 Sébastien Giroud1,2*
 Yama Tomonaga1
 Matthias S. Brennwald1
 Naoto Takahata3
 Tomo Shibata4
 Yuji Sano5
 Rolf Kipfer1,2,6
- 1Department of Water Resources and Drinking Water, Eawag, Dubendorf, Switzerland
- 2Institute of Biogeochemistry and Pollutant Dynamics, ETH Zürich, Zurich, Switzerland
- 3Atmosphere and Ocean Research Institute, The University of Tokyo, Kashiwa-shi, Japan
- 4Institute for Geothermal Sciences, Kyoto University, Kyoto, Japan
- 5Center for Advanced Marine Core Research, Kochi University, Kochi, Japan
- 6Institute of Geochemistry and Petrology, ETH Zürich, Zurich, Switzerland
Hot thermal fluids flow through the Earth's crust and carry valuable information about the deep subsurface. The monitoring of natural tracers transported in geothermal fluids, such as gases or ions, are relevant to better understand the geological processes in the Earth's subsurface and their relation to deep fluid dynamics. Recently developed technologies (e.g., portable gas-equilibrium membrane-inlet mass spectrometry) allow for the continuous monitoring of gas species at a much higher temporal resolution than the sampling procedures commonly used, based on a few individual samples. However, the monitoring of gas species from hot thermal fluids still poses experimental challenges tied to unwanted water vapor condensation in the headspace of the separation module, which irremediably leads to clogging (e.g., of the connecting capillaries) and failure of the detection device. In this contribution, we present two new experimental methods that provide suitable technical conditions to measure gases, even in high temperature geothermal fluids, using a portable gas analyzer. Two sites with different thermal water temperatures (first one ranging from 50 °C to 65 °C and second one close to boiling temperature) were selected. The first method was deployed on the thermal waters of Lavey-les-Bains (Vaud, Switzerland), for which we report results from October 2021. The second method was used in Beppu (Oita Prefecture, Japan), for which we report results from April 2018. Our results show that at both sites, our methods allow for continuous measurements of gas species (N2, Ar, O2, Kr, He, CH4, CO2 and H2) in thermal waters. Furthermore, they show that the variability of gas emanation from the two sites can only be adequately described by measurements with high temporal resolution, which both methods allow.
1. Introduction
Groundwater and other terrestrial fluids transport valuable information about deep fluid dynamics. Elemental and isotopic composition of terrestrial fluids can indicate the origin of the fluid or inform about possible routes the fluid has taken. Furthermore, their elemental and isotopic composition can also respond to crustal events, such as earthquakes (Ide et al., 2020). The natural variability in time and space of terrestrial fluids often cannot be reasonably characterized by isolated measurements. The characterization of natural variability requires a series of measurements at a sampling rate higher than the rate of natural variability in gas composition within the fluid (e.g., weekly to biweekly for a seasonal trend). This results in tedious laboratory work if conventional sampling protocols and measuring procedures are applied (i.e., off-site laboratory analysis, Beyerle et al., 2000). Nevertheless, such in-depth knowledge of fluid dynamics in the Earth's crust is essential, as the crust has become of central interest in current societal energy transition processes, such as carbon sequestration, geothermal power generation, or geological deep storage of spent nuclear fuel. Moreover, fluid dynamics could, at least on a conceptual level, inform about the potential relationship between fluid evolution and natural processes in the Earth's crust, such as volcanic or seismic activity.
To characterize the variability of gas species in groundwater and terrestrial fluids, recent monitoring technologies have evolved toward more continuous measurements under in situ conditions (e.g., continuous 222Rn monitoring in the coastal zone with RAD7, Burnett et al., 2001; continuous 220Rn and 222Rn monitoring in groundwater with RAD7, Huxol et al., 2012; continuous measurements of carbon dioxide and methane with cavity ring-down spectroscopy, Chen et al., 2010; continuous monitoring of carbon dioxide with laser isotope spectrometer, Frank et al., 2020; continuous measurements of dissolved gases with continuous flow membrane inlet mass spectrometer, Chatton et al., 2017; in situ denitrification tracing with gas-equilibrium membrane-inlet mass spectrometry, Popp et al., 2020; dissolved gases monitoring in groundwater with conventional membrane-inlet mass spectrometry, Takahata et al., 1997, or with gas-equilibrium membrane-inlet mass spectrometry, Mächler et al., 2013; in situ argon and helium monitoring with gas-equilibrium membrane-inlet mass spectrometry, Roques et al., 2020). These available technologies allow gases to be measured in a quasi-continuous mode from both gaseous and liquid phases, often relying on specific semi-permeable membranes which allow separation of the dissolved gaseous phase from liquid phases. Whether the gases are sampled from a liquid or gas phase, available methods generally require matrices free of liquid water, that is, the analytical methods are sensitive to high water vapor partial pressure and the associated risk of water vapor condensation in the headspace of the module containing the gas-permeable membrane. As the headspace fills up with water and no longer allows the proper separation of dissolved gases from the liquid phase, the inlet of a gas analyzer can draw in water and clog, especially if the gas analyzer uses capillaries to deliver gases to the mass spectrometer (e.g., OmniStar® by Pfeiffer or miniRUEDI by Gasometrix). Obtaining liquid-free matrices for gas analysis becomes even more challenging when monitoring gas species in geothermal fluids. Both the exponential increase in water vapor saturation in the gas phase with increasing fluid temperature and the cooler surface of the membrane module that favors water vapor condensation in the headspace can quickly lead to clogging of the membrane module and inlet capillaries if those are used to inlet gases to the gas detector.
To overcome the challenge of water vapor condensation in the headspace and the clogging of the connecting capillaries, we present two different methods that have been developed to adapt the available monitoring schemes to geothermal waters and gases rich in water vapor. In our case, we combined the developed experimental techniques specifically with a gas-equilibrium membrane-inlet mass spectrometer (miniRUEDI, Brennwald et al., 2016) as an analytical detector coupled to a gas-permeable membrane module (Liqui-Cel™, 3M™). Nevertheless, we note that both methods can easily be adapted to any other detection method commonly used for continuous gas quantification based on the separation of dissolved gases from the liquid phase, where the condensation of water vapor in the headspace jeopardizes the proper functioning of the membrane module, and particularly to those based on capillaries for gas inlet.
Two sites were studied covering two different water temperature ranges. At the first site, different wells with temperatures ranging up to 65 °C (Section 2.3) were accessible for continuous gas measurement in a thermal production well. At the second site, the water temperature was too high to be compatible with the temperature range specified for the separation membrane used. Therefore, an alternative method was developed allowing gas quantification at fluid temperature exceeding 65 °C (Section 2.4). In both cases, the specifically developed methods, which are described in the experimental subsections, provide a suitable framework for the continuous monitoring of gas species (N2, Ar, O2, Kr, He, CH4, CO2, and H2) from geothermal waters and other geothermal fluids.
2. Study sites and methods
2.1. Study sites
The first site, Lavey-les-Bains (Switzerland), is located in the Rhône Valley, where thermal water is abstracted from a gneiss formation of the Aiguilles Rouges alpine massif (Sonney and Vuataz, 2009; Sonney et al., 2012). The rocks are strongly fractured and allow groundwater to recharge and circulate deeply into the continental crust before reappearing at the central plain of the Rhône Valley. The thermal water of Lavey-les-Bains has been suggested to recharge at the top of the Aiguilles Rouges massif, which is located west of the lower Rhône Valley (approximately 430 m a.s.l.) at high altitude (approximately 1,000–3,000 m a.s.l.) (Sonney and Vuataz, 2009; Sonney et al., 2012). In Lavey-les-Bains, hot thermal water is abstracted from three deep wells (201, 280, and 516 m b.g.l.) that were drilled between 1970 and 1990 and supply the local thermal spa infrastructure. The deepest borehole withdraws water at 64 °C, which is fed by the underlying hydrothermal reservoir.
The second site is located in the Horita hot spring area in the city of Beppu on the Kyushu Island, Southwestern Japan. In the area, fluids gush from a deep high temperature reservoir (250–300 °C, Allis and Yusa, 1989; Sturchio et al., 1996). The analyzed monitoring well is hydraulically connected to the Horita-Asamigawa Fault Zone, which belongs to the Beppu-Shimabara graben. In April 2016, the Beppu-Shimabara graben was particularly active at the Futagawa-Hinagu Fault Zone, which was responsible for the Kumamoto earthquakes (mainshock at magnitude 7.3, Ide et al., 2020). The Kumamoto earthquakes have been shown to have changed the gas composition of deep groundwaters, whereby higher 4He concentrations and lower 3He/4He ratios have been reported as the result of injection of radiogenic He from crustal rocks (Sano et al., 2016). This observation suggests that He and other geogenic gases have the potential to be used as indicators for seismic activity along active fault systems.
2.2. Portable mass spectrometer system
At both study sites, the gas composition was continuously determined under field conditions over several weeks by using portable gas-equilibrium membrane-inlet mass spectrometry (miniRUEDI). The device allows the quantification of the partial pressures of multiple gas species (e.g., He, Ar, Kr, N2, O2, H2, CH4, CO2) in liquid or gaseous fluids (Brennwald et al., 2016). Major gas species are determined on a Faraday cup, and trace gases are analyzed on an electron multiplier detector. The raw data obtained from the mass spectrometer were calibrated in terms of the partial pressures of the analyzed gases using atmospheric air (Porcelli et al., 2002) or a gas mixture (97 % N2, 1 % H2, 1 % CO2, and 1 % CH4, Tomonaga et al., 2019) as standards. Sample measurements were followed by calibrations using the two standards. Standards were measured at least 6 times a day, as measurement conditions were rather stable over the period of the experiment (Brennwald et al., 2016). It should be noted that the calibration frequency can be increased under more variable environmental conditions.
The quantification of gas species in liquid phases by a gas analyzer commonly requires the separation of gases from the liquid phase. The gas-permeable membrane module (polypropuylene/polyurethane membrane, 3M™ Liqui-Cel™) separates gases from the liquid phase. The membrane operates such that the gas phase in the membrane module is at equilibrium with the gases dissolved in the thermal water that runs through the membrane module. A minimal water flow (1 mL/min) across the membrane module is required to reach proper equilibrium between the dissolved gas phase in thermal waters and the headspace of the membrane module. For common applications under typical ambient surface conditions (fluids with temperatures between 0 °C and 30 °C), the partial pressure of water vapor inside the membrane module is rather low and the condensation of water vapor in the headspace barely interferes with mid- and long-term quantification of gas species.
2.3. Geothermal waters up to 65 °C
Thermal waters degas once reaching the surface as result of the lower surface pressure and the high water temperature. Quantification of thermal water gases with conventional sampling techniques (e.g., copper tube sampling) is therefore problematic because the gas bubbles sampled along with the water may not be representative of the targeted water parcel. In this case, the use of the membrane module is more appropriate because the headspace equilibrium across the membrane is not affected by the degassing, as both dissolved and free gases equilibrate with the headspace (Lightfoot, 2022). However, the high content of gaseous water in the headspace promotes the formation of liquid water, which leads to clogging of the headspace and the capillary inlet of the gas analyzer.
One approach to quantify gas species in thermal waters without condensation of water vapor, and related clogging, is heating the membrane module to a temperature higher than the analyzed water. For this purpose, a heating box (see Figure 1 for a schematic view) was designed and built. The heating box was thermally insulated (see Figure 1, TI), and three heating foils (see Figure 1, HF) were placed inside to provide heat to maintain the heating box at the required temperature. The empty space inside the heating box between the membrane module and the heating foils was filled with metal castings (e.g., 1.25–1.70 mm, AR101652, IEPCO), which resulted in efficient heat conductance in the box (i.e., rapid and homogeneous distribution of the thermal energy). This guaranteed a homogeneous temperature at the surface of the membrane module. The temperature inside the heating box was controlled and monitored by two thermometers (see Figure 1, TM). The first temperature sensor was part of a self-made thermostat, which supplied power to the heating foils to ensure that the temperature inside the heating box remained constant and at a sufficiently high value to avoid water vapor condensation. The second temperature sensor was directly monitored by the control unit of the miniRUEDI to detect any failure of the heating box, such as a lower temperature (e.g., due to a shortcut in the heater foils), which would lead to water vapor condensation in the analytical system. If the temperature in the heating box fell below a predetermined temperature threshold (which was set 3 °C higher than the temperature of the monitored water), the control unit would disconnect the membrane module from the gas analyzer. This was achieved by changing the gas inlet to a dead-end port.
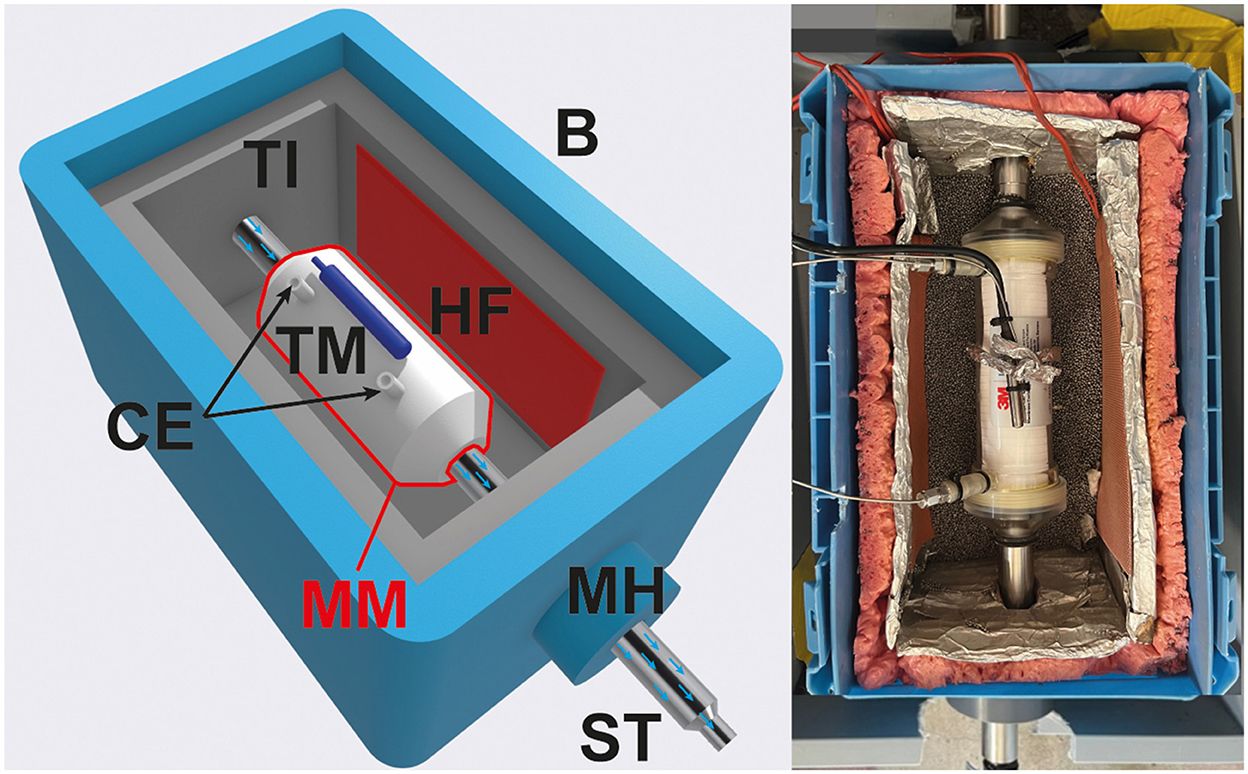
Figure 1. Heating box for moderate temperature ranges of up to 65 °C. The box (B) is thermally insulated (TI) and the void space is filled with metal castings. This provides a constant high temperature to the membrane module (MM). The heating foils (HF) heat the castings to a predefined temperature (i.e., above the temperature of the water/fluid being analyzed). The temperature is monitored by two thermometers (TM, represented by the blue part in the schematic view). The first belongs to the thermostat, while the second is monitored by the control unit to ensure that the temperature does not fall below the threshold. Two steel tubes (ST) are connected to the membrane module and circulate the thermal water. Water is entering on one side, passes through the gas permeable membrane inside the module, and exits on the other side. Mechanical stresses on the membrane module were reduced by mechanical holds (MH) which distributed forces to the box rather than to the membrane module. Two capillary entries (CE) allow to measure the partial pressure of individual gas species in the headspace of the MM, whose gas phase is in equilibrium with the dissolved gases in the liquid phase under analysis.
We note that the commercially available membrane modules are built from polymers (polycarbonate), which limits their application to hydrothermal waters up to 65 °C (a maximal heating temperature of 70 °C was reached during a 3-month test before failure of the membrane module). Although most polymers do have a melting point higher than 100 °C, the plastic tends to weaken when exposed to heat. Any mechanical stress (e.g., torsional and weight forces of the connected water supply lines) promotes cracks and thus damages the structure of the membrane module. Highly strained parts, such as screw threads of the water inlet and outlet of the membrane module, are particularly affected. To avoid the early malfunctioning of the inlet and outlet, the hard plastic fittings supplying the membrane module with water were replaced with custom stainless steel fittings at a later stage during monitoring. These stainless steel tubes (see Figure 1, ST) were held by cylindrical hard structures attached to the outside of the heating box (see Figure 2, MH), which were designed to reduce mechanical stresses on the membrane module by holding the stainless steel tubes and distributing mechanical stresses on the hard box rather than on the membrane module. To the authors' best knowledge, no suitable commercial alternative was found, as the more robust membrane modules were too expensive, rather large, and had the disadvantage of having a steel surface, making it impossible to observe the water level in the headspace in case of water vapor condensation.
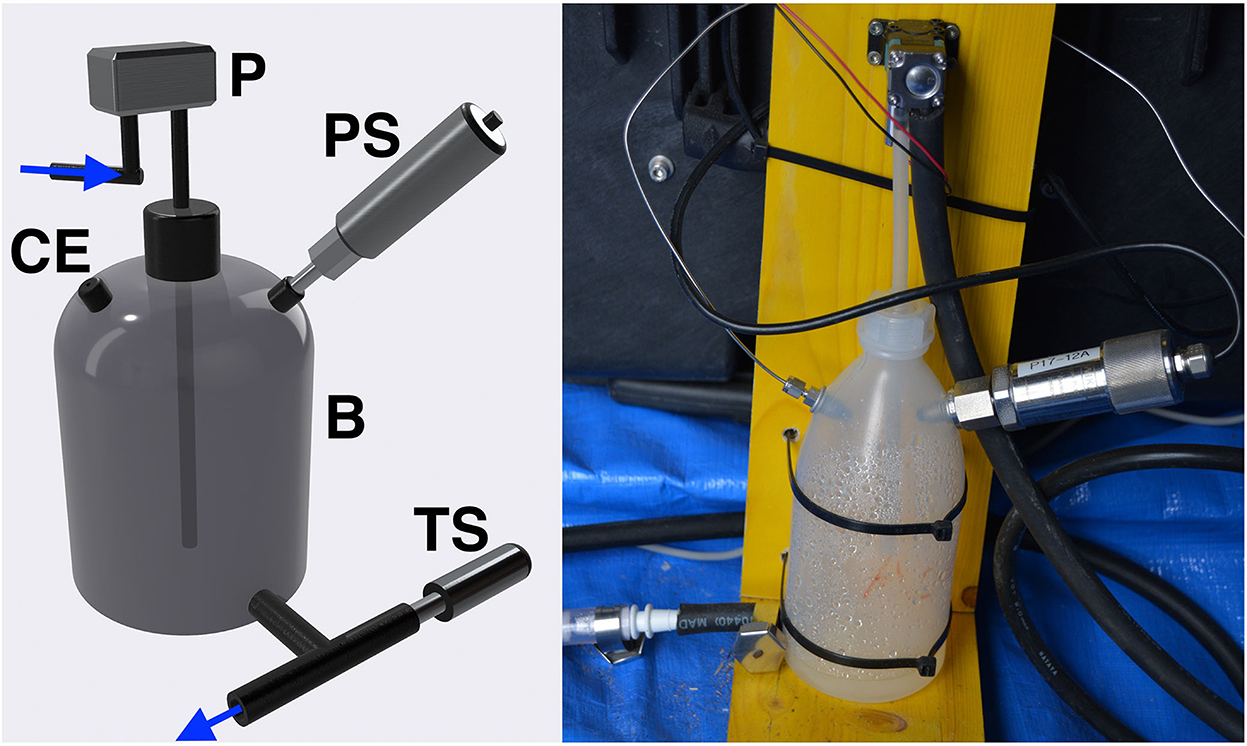
Figure 2. Sampling bottle for fluid temperatures superior to 65 °C. A membrane pump (P) pumps the hot fluids (e.g., water vapor) into the bottle (B). Two sensors measure the temperature (TS) and the pressure (PS) of the pumped gas. A capillary entry (CE) allows to measure the gases using the miniRUEDI. As incoming gases and condensed water vapor are forced into the bottle near the bottom, condensation-related clogging of the analysis system is avoided because the gas analyzer inlet is located on the upper side of the bottle.
2.4. Geothermal fluids over 65 °C
Geothermal fluids in active hydrothermal fields can easily exceed 65 °C, and the monitoring of gas species in these fluids cannot be accomplished by the first method covered in the previous section, calling for an entirely different approach to the problem posed by water vapor condensation within the membrane module. At site 2, the high water temperature (close to boiling temperature) precludes the use of the membrane module for gas–liquid separation. Thus, to monitor the gas composition at site 2, we decided to optimize our analytical techniques to gases continuously emitted from the outlet of a water/steam separator which is directly connected to the well head. Gas species are quantified from the gaseous phase (i.e., gases emitted by the thermal water) and not directly in the liquid phase. We designed a system to draw the gases from the outlet of the separator toward the inlet of the portable mass spectrometer (see Figure 2).
A 10 m-long ethylene propylene diene monomer rubber tube (gas-tight) withstanding temperatures of up to 105 °C was inserted for approximately 0.5 m into the metal outlet of the separator. The other end of the rubber tube (heat resisting synthetic rubber, POLYPRESS, 9.5 mm inner diameter) was connected to a pump (KNF, model FF 20 DC-M KT, see Figure 2, P) equipped with PTFE membranes (fluoropolymer). The pump circulated the liberated gases at a flow rate of 210 mL/min through an attached plastic bottle (volume 500 mL, see Figure 2, B). The residence time of the gases in the rubber tube was sufficient to cool the gas phases close to ambient temperature. Therefore, most of the water vapor condensed within the rubber tube. The inlet of the plastic bottle was designed so that liquid water was prevented to reach the capillary inlet at the top of the bottle. A tube carried gases and liquid water from the top toward the bottom of the bottle, releasing fluids at the bottom of the bottle (see Figure 2). The chosen design and the used pumping rate allowed the complete mixing of the headspace in the bottle due to temperature gradient and turbulent fluid flow. A total gas pressure sensor was connected in the upper part of the bottle (see Figure 2, CE and PS, respectively). An outlet for both gaseous and liquid phases was set at the bottom of the plastic bottle. The temperature changes of the fluids were monitored by a temperature sensor (see Figure 2, TS) at the outlet of the bottle.
3. Results and discussion
3.1. Method for water temperatures below 65 °C
At site 1, the self-made heating box was tested on two different water temperatures. In an early test phase, the method was tested on a hydrothermal well where thermal waters reach a temperature of 62 °C at the well head. Therefore, the heating box had to be set at a constant temperature of approximately 70 °C. In this first test phase, measures to reduce the mechanical stress on the membrane module were not implemented, leading to a total failure of the membrane module when the inlet walls broke after 3 months. Nevertheless, this test phase showed the potential to monitor thermal waters up to 65 °C, as the heating box provided sufficient energy to remove water vapor condensation from the headspace of the membrane module.
For operational reasons and due to the annual shutdown of the deepest and hottest well at site 1, the setup, which has been additionally improved to reduce mechanical stresses on the membrane module, was transferred and installed to the shallowest well (P201, 201 m b.g.l.), where the thermal waters reach a temperature of 52 °C. The temperature threshold for the heating box was set to 55 °C and the thermostat to 58 °C. The temperature threshold was never reached, which ensured that the temperature inside the box was always higher than the water temperature during the experiment. As of August 2022, the monitoring of gas species from the thermal waters abstracted from the well P201 has been ongoing for 12 months. During the 12 months of operation, the membrane module showed no signs of water condensation nor total failure. The developed heating box successfully heated the membrane module to avoid condensation. In addition, the physical support provided by the mechanical holds (see Figure 2, MH) significantly extended the lifespan of the membrane module (3 months for the first test phase, over 12 months for the currently ongoing experiment).
Given that the monitoring of gas species was successful because of the proper functioning of the heating box, we could process some preliminary results to illustrate what could be achieved by monitoring gas species in thermal waters. Data were filtered to include only measurements at temperatures higher than 48 °C. Data points at lower temperatures were measured while the pump was inactive and are therefore not representative of the targeted water. Figure 3 shows the complete time series of gas concentrations (approximately one measurement every 15 minute, resulting in over 2,600 individual data points for each gas species, with concentrations expressed as gas partial pressures being at equilibrium with the dissolved gas phase in the thermal water) taken at the well P201 during October 2021. N2, Ar, O2, Kr, He, CH4, CO2, and H2 partial pressures were simultaneously quantified from the thermal water using integrated procedures from the miniRUEDI system (Brennwald et al., 2016). The data were smoothed (Savitzky-Golay filtering, frame length 27 and order 3). The major gas was N2, which accounted for approximately 96 % of the total gas pressure. Ar, He, and CH4 were the following most abundant gases, with each accounting for approximately 1–2 % of the measured total pressure. O2, Kr, H2, and CO2 accounted for the rest of the measured gas fraction.
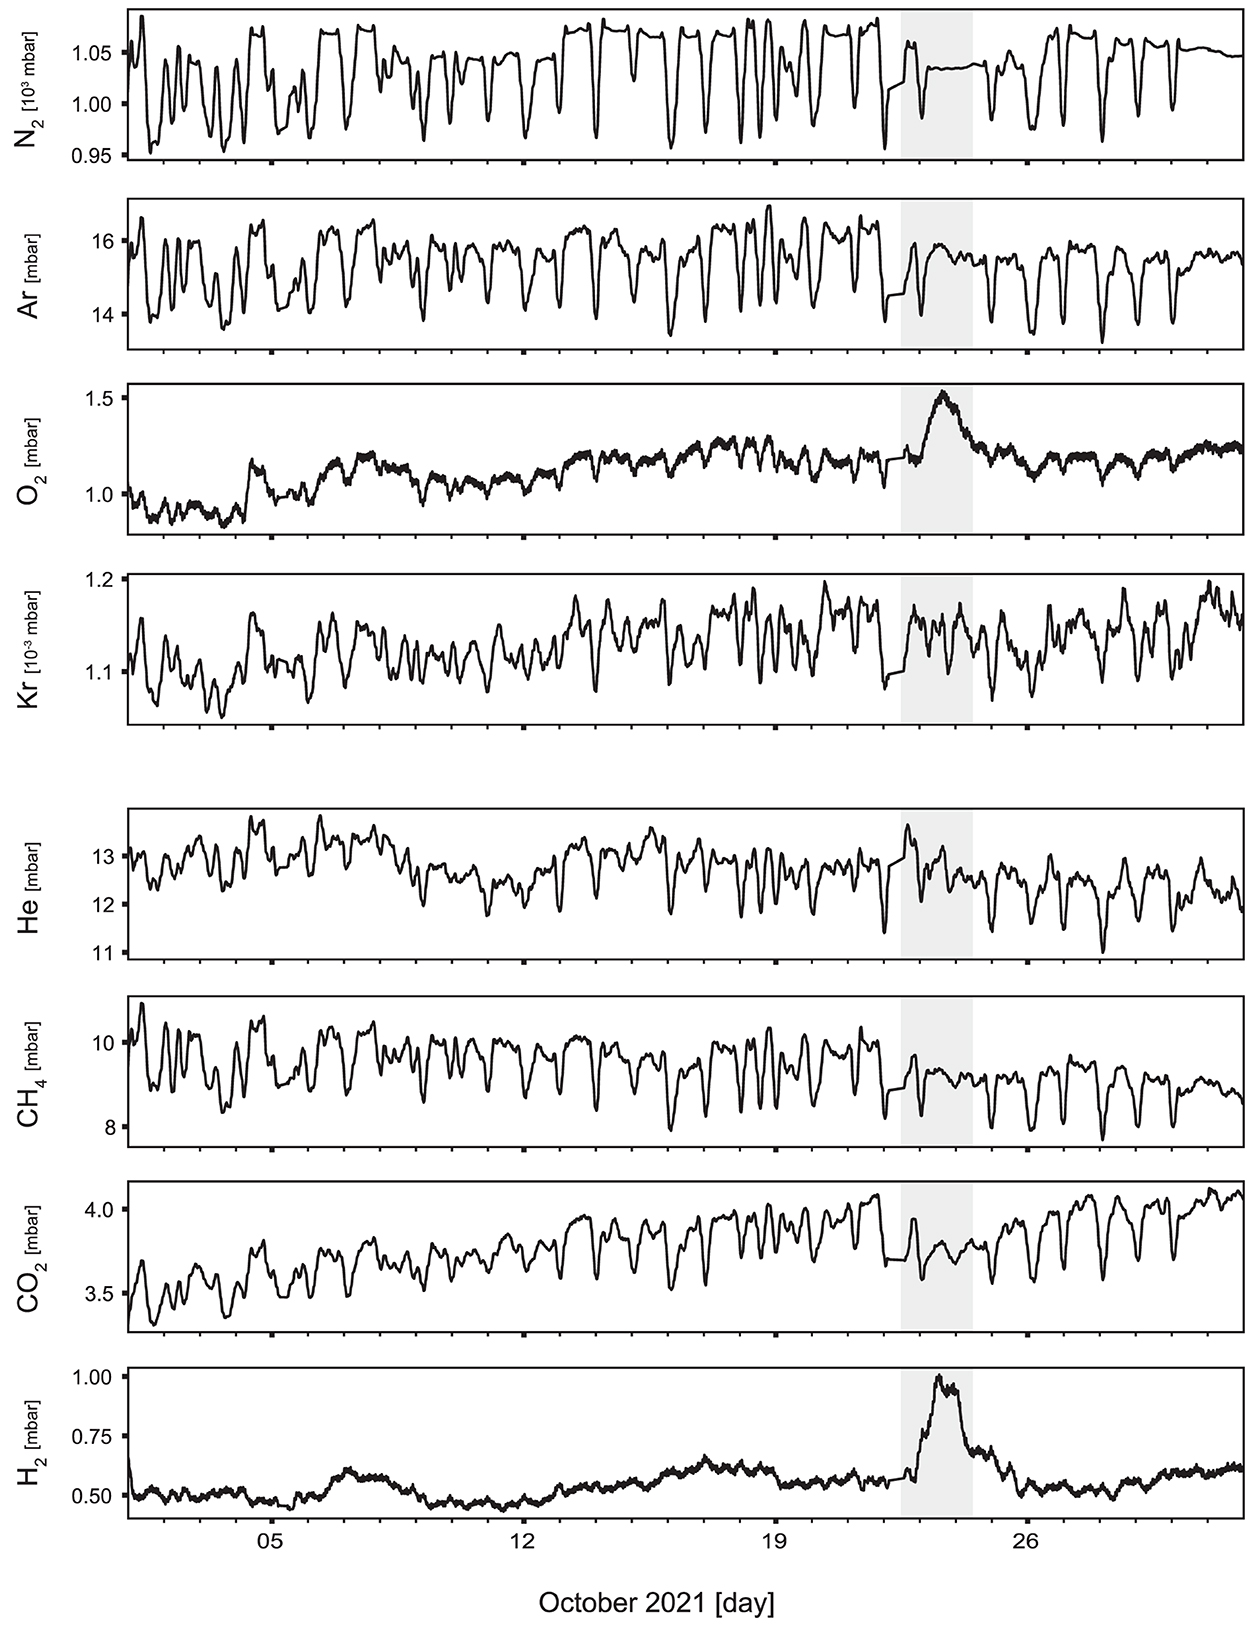
Figure 3. Time series of gas measurements (>2, 600 data points) conducted at Lavey-les-Bains (Switzerland) in October 2021. The determined partial pressures [mbar] of N2, Ar, O2, Kr (atmospheric gases), He, CH4, CO2, and H2 (geogenic gases) are plotted using Savitzky-Golay filtering (frame length 27 and order 3) to smooth the curves. On October 22, the P201 pump was offline for a duration of 8 h due to an operation failure. The different peaks in the shaded area, such as those in the concentrations of H2 and O2, are possible effects of the pumping interruption.
During October 2021, the gas composition evolved in time while short (hours to day) and long (week to month) trends were observed. All gas measurements showed distinct short-term oscillations with a frequency of about 1 day. These short-term oscillations can most likely be related to the different pumping rates of well P201 to supply thermal water to the local spa (hot water requirements were greater during the day when the spa was open to the public than at night). Superimposed on the short-term variations, gas concentrations appeared to vary gradually during October 2021 (e.g., slow decrease of CH4, slow increase of CO2). Whether these long-term variations were also related to the pumping regime or whether they reflect the natural variability of the dissolved gases in the thermal water of Lavey-les-Bains is the subject of ongoing research (Giroud et al., 2022). Recording short- and long-term trends in the temporal evolution of gas species in thermal waters (see Figure 3) would hardly have been possible without the use of the new method developed to extend the applicability of continuous monitoring of gas species to warm waters up to 65 °C.
3.2. Method for fluid temperatures over 65 °C
At site 2, the method was implemented to analyze the gas composition in fluids reaching the boiling temperature of water. During the 2 months of operation, the separation of the high water vapor content from the rest of the gases never compromised the gas detector responsible for monitoring the gas species from the hot fluids, as the liquid water was flushed out of the bottle and never reached the critical level to clog the analysis system (i.e., the height of the capillary connecting the bottle to the gas detector). As no membrane module is required in this approach, the only limiting factor for the quantification of gas species in thermal fluids was given by the thermal resistance of the rubber tube. The rubber tube must be long enough to cool fluids close to room temperature, allowing water to condense inside the rubber tube, and must be able to withstand the high temperature of the fluid. Once again, the data provided when using the method at site 2 during the monitoring of gas species from thermal fluids is valuable in illustrating the range of possibilities that can be achieved with this new method.
Figure 4 shows the results of the gas measurements conducted in April 2018 at the hydrothermal well at site 2. The time series of the partial pressures of Ar, He, N2, CO2, CH4, and H2 are reported together with concurrent seismic events occurring in the surrounding region. The gas measurements were smoothed by filtering (see above). CO2 and N2 were the most abundant gas species with partial pressure approximately 850 mbar and 150 mbar, respectively. CH4 and H2 showed alternating phases of low and high concentrations, correlating with the temporal evolution of CO2 and N2. Phases of enhanced concentrations of H2 matched rather well with the timing of increasing CO2 concentrations, suggesting the deep origin of H2, whereas high CH4 concentrations tended to correlate with the timing of increasing atmospheric gas concentrations. Ar concentrations correlate well with N2 concentration measurements, whereas He concentrations seemed to correlate neither with major changes in CO2 nor with major changes in N2 concentrations, although being slightly enriched with respect to atmospheric air.

Figure 4. Time series of gas measurements (>2, 000 data points) conducted in April 2018 at the hydrothermal well in Beppu (Japan). The (upper panel) indicates phases of low (white background) and of higher (gray background) seismic activity. The (lower panels) show the long-term temporal variation of the measured gas species. The main (carrier) gases are anti-correlated (CO2 and N2). High concentrations of CH4 correlate with high concentrations of N2, while high concentrations of H2 correlate with high concentrations of CO2. Mid-term changes as seen for N2 and CH4 can also be observed in the Ar time series. He does not seem to be affected by low or higher seismic activities. As for Figure 3, a Savitzky-Golay filtering (frame length 27 and order 3) was used to smooth the curves.
These observations suggest that a mechanism modulates the mixing of a deep-sourced gas component (enriched in CO2 and H2) and a shallower gas component (carrying atmospheric gases, such as N2 and Ar, but possibly also CH4 from a surface-near source). A solid statistical analysis of the relation between geochemical changes and seismicity cannot be achieved in the context of this work as the amount of data is very limited. Nevertheless, the data suggest that the peak concentration of CH4 synchronously occurs with more active seismic phases (upper panel of Figure 4). Conversely, phases of high H2 concentrations appear during time periods of lower seismic activity. Other hydrothermal sites in seismically active regions are currently being studied to explore the possible relation between seismicity and fluid dynamics (Giroud et al., 2022).
4. Conclusions
Increasingly, efforts to monitor environmental conditions call for robust and portable technologies. In the case of thermal fields where high temperature water is close to the Earth surface, gas analyzers, especially those relying on capillary inlets, can be impacted by the high water vapor content and the associated risk of water vapor condensation. The two methods we presented in this study allow us to extend the on-site analytical methods for gas quantification, such as the miniRUEDI, for geothermal applications.
Both methods open new experimental possibilities to study the temporal and spatial variability of gases in thermal waters and hot terrestrial fluids (e.g., fumaroles), that are notoriously difficult to assess by conventional sampling methods, which rely on the analysis of a few individual samples. Our developed methods are a step forward for the systematic analysis of the possible relation of terrestrial fluid dynamics and seismicty in volcanic and tectonic active regions (Giroud et al., 2022). Similarly, the developed methods open a new analytical window to track fluids in the context of deep-fluid circulation experiments (i.e., by labeling water with a noble gas as an artificial tracer, Roques et al., 2020; Zappone et al., 2021).
Data availability statement
The raw data supporting the conclusions of this article will be made available by the authors upon request, without undue reservation.
Author contributions
SG, YT, MB, and RK designed the study and prepared the manuscript. SG, YT, TS, and YS carried out the fieldwork. TS and NT provided logistical and infrastructural support. All authors contributed to the article and approved the submitted version.
Funding
PhD support for SG and open access funding provided by Eawag - Swiss Federal Institute of Aquatic Science and Technology.
Acknowledgments
We are grateful to Eline Mignot, Gabriele Bianchetti, and Jean-Marie Rouiller for providing us access to the hydrothermal wells in Lavey-les-Bains and valuable monitoring data. We thank André Défago for his help during the fieldwork in Lavey-les-Bains. The earthquake catalog used in this study was produced by the Japan Meteorological Agency, in cooperation with the Ministry of Education, Culture, Sports, Science, and Technology. The catalog is based on seismic data provided by the National Research Institute for Earth Science and Disaster Resilience, the Japan Meteorological Agency, Hokkaido University, Hirosaki University, Tohoku University, the University of Tokyo, Nagoya University, Kyoto University, Kochi University, Kyushu University, Kagoshima University, the National Institute of Advanced Industrial Science and Technology, the Geographical Survey Institute, Tokyo Metropolis, Shizuoka Prefecture, Hot Springs Research Institute of Kanagawa Prefecture, Yokohama City, and Japan Agency for Marine-Earth Science and Technology. We thank the three reviewers for their time and effort to improve our initial version of the manuscript and Dr. Hugo Delottier for handling the manuscript.
Conflict of interest
The authors declare that the research was conducted in the absence of any commercial or financial relationships that could be construed as a potential conflict of interest.
Publisher's note
All claims expressed in this article are solely those of the authors and do not necessarily represent those of their affiliated organizations, or those of the publisher, the editors and the reviewers. Any product that may be evaluated in this article, or claim that may be made by its manufacturer, is not guaranteed or endorsed by the publisher.
References
Allis, R., and Yusa, Y. (1989). Fluid flow processes in the Beppu geothermal system, Japan. Geothermics 18, 743–759. doi: 10.1016/0375-6505(89)90104-1
Beyerle, U., Aeschbach-Hertig, W., Imboden, D. M., Baur, H., Graf, T., and Kipfer, R. (2000). A mass spectrometric system for the analysis of noble gases and tritium from water samples. Environ. Sci. Technol. 34, 2042–2050. doi: 10.1021/es990840h
Brennwald, M. S., Schmidt, M., Oser, J., and Kipfer, R. (2016). A portable and autonomous mass spectrometric system for on-site environmental gas analysis. Environ. Sci. Technol. 50, 13455–13463. doi: 10.1021/acs.est.6b03669
Burnett, W. C., Kim, G., and Lane-Smith, D. (2001). A continuous monitor for assessment of 222Rn in the coastal ocean. J. Radioanalytical Nuclear Chem. 249, 167–172. doi: 10.1023/A:1013217821419
Chatton, E., Labasque, T., de La Bernardie, J., Guihéneuf, N., Bour, O., and Aquilina, L. (2017). Field continuous measurement of dissolved gases with a CF-MIMS: applications to the physics and biogeochemistry of groundwater flow. Environ. Sci. Technol. 51, 846–854. doi: 10.1021/acs.est.6b03706
Chen, H., Winderlich, J., Gerbig, C., Hoefer, A., Rella, C., Crosson, E., et al. (2010). High-accuracy continuous airborne measurements of greenhouse gases (CO2 and CH4) using the cavity ring-down spectroscopy (CRDS) technique. Atmosphere. Meas. Techn. 3, 375–386. doi: 10.5194/amt-3-375-2010
Frank, A. H., van Geldern, R., Myrttinen, A., Zimmer, M., Barth, J. A. C., and Strauch, B. (2020). Geological CO2 quantified by high-temporal resolution stable isotope monitoring in a salt mine. Sci. Rep. 10, 20671. doi: 10.1038/s41598-020-77635-5
Giroud, S., Tomonaga, Y., Brennwald, M. S., and Kipfer, R. (2022). “Monitoring dissolved gases in thermal water to assess the potential relation between fluid evolution and seismicity,” in Goldschmidt 2022 Abstract. doi: 10.46427/gold2022.8935
Huxol, S., Brennwald, M. S., Hoehn, E., and Kipfer, R. (2012). On the fate of 220Rn in soil material in dependence of water content: Implications from field and laboratory experiments. Chem. Geol. 298–299, 116–122. doi: 10.1016/j.chemgeo.2012.01.002
Ide, K., Hosono, T., Kagabu, M., Fukamizu, K., Tokunaga, T., and Shimada, J. (2020). Changes of groundwater flow systems after the 2016 Mw 7.0 Kumamoto earthquake deduced by stable isotopic and CFC-12 compositions of natural springs. J. Hydrol. 583, 124551. doi: 10.1016/j.jhydrol.2020.124551
Lightfoot, A. K. (2022). Noble Gases to Analyse the Physical Mechanisms Influencing Arsenic Dynamics in Groundwater (Ph.D. thesis). ETH Zürich.
Mächler, L., Peter, S., Brennwald, M. S., and Kipfer, R. (2013). Excess air formation as a mechanism for delivering oxygen to groundwater. Water Resour. Res. 49, 6847–6856. doi: 10.1002/wrcr.20547
Popp, A. L., Manning, C. C., Brennwald, M. S., and Kipfer, R. (2020). A new in situ method for tracing denitrification in riparian groundwater. Environ. Sci. Technol. 54, 1562–1572. doi: 10.1021/acs.est.9b05393
Porcelli, D. P., Ballentine, C. J., and Wieler, R. (2002). “An overview of noble gas geochemistry and cosmochemistry,” in Noble Gases in Geochemistry and Cosmochemistry, Reviews in Mineralogy and Geochemistry, Vol. 47, eds D. Porcelli, C. Ballentine, and R. Wieler (Mineralogical Society of America, Geochemical Society), 1–19.
Roques, C., Weber, U. W., Brixel, B., Krietsch, H., Dutler, N., Brennwald, M. S., et al. (2020). In situ observation of helium and argon release during fluid-pressure-triggered rock deformation. Sci. Rep. 10, 6949. doi: 10.1038/s41598-020-63458-x
Sano, Y., Takahata, N., Kagoshima, T., Shibata, T., Onoue, T., and Zhao, D. (2016). Groundwater helium anomaly reflects strain change during the 2016 Kumamoto earthquake in Southwest Japan. Sci. Rep. 6, 37939. doi: 10.1038/srep37939
Sonney, R., and Vuataz, F.-D. (2009). Numerical modelling of alpine deep flow systems: a management and prediction tool for an exploited geothermal reservoir (Lavey-les-Bains, Switzerland). Hydrogeol. J. 17, 601–616. doi: 10.1007/s10040-008-0394-y
Sonney, R., Vuataz, F.-D., and Schill, E. (2012). Hydrothermal circulation systems of the Lavey-les-Bains, Saint-Gervais-les-Bains and Val d'Illiez areas associated with the Aiguilles Rouges Massif in Switzerland and France. Swiss Bulle. Appl. Geol. 17, 232. doi: 10.5169/seals-349232
Sturchio, N., Ohsawa, S., Sano, Y., Arehart, G., Kitaoka, K., and Yusa, Y. (1996). Geochemical characteristics of the Yufuin outflow plume, Beppu hydrothermal system, Japan. Geothermics 25, 215–230. doi: 10.1016/0375-6505(95)00049-6
Takahata, N., Igarashi, G., and Sano, Y. (1997). Continuous monitoring of dissolved gas concentrations in groundwater using a quadrupole mass spectrometer. Appl. Geochem. 12, 377–382. doi: 10.1016/S0883-2927(97)00007-3
Tomonaga, Y., Giroud, N., Brennwald, M. S., Horstmann, E., Diomidis, N., Kipfer, R., et al. (2019). On-line monitoring of the gas composition in the full-scale emplacement experiment at Mont Terri (Switzerland). Appl. Geochem. 100, 234–243. doi: 10.1016/j.apgeochem.2018.11.015
Keywords: water condensation, long-term gas monitoring, dissolved gases, geothermal fluids, in situ mass spectrometry
Citation: Giroud S, Tomonaga Y, Brennwald MS, Takahata N, Shibata T, Sano Y and Kipfer R (2023) New experimental approaches enabling the continuous monitoring of gas species in hydrothermal fluids. Front. Water 4:1032094. doi: 10.3389/frwa.2022.1032094
Received: 30 August 2022; Accepted: 19 December 2022;
Published: 02 February 2023.
Edited by:
Hugo Delottier, Université de Neuchâtel, SwitzerlandReviewed by:
Johannes A. C. Barth, Friedrich-Alexander-Universität Erlangen-Nürnberg, GermanyTehnuka Ilanko, University of Waikato, New Zealand
Stephanie Musy, University of Bern, Switzerland
Copyright © 2023 Giroud, Tomonaga, Brennwald, Takahata, Shibata, Sano and Kipfer. This is an open-access article distributed under the terms of the Creative Commons Attribution License (CC BY). The use, distribution or reproduction in other forums is permitted, provided the original author(s) and the copyright owner(s) are credited and that the original publication in this journal is cited, in accordance with accepted academic practice. No use, distribution or reproduction is permitted which does not comply with these terms.
*Correspondence: Sébastien Giroud,  sebastien.giroud@eawag.ch