Leveraging digital twin and game-engine for traffic simulations and visualizations
 Samuel Rundel
 Raffaele De Amicis
- School of Electrical Engineering and Computer Science, College of Engineering, Oregon State University, Corvallis, OR, United States
Combined with simulation software packages, City Information Models allow analysts and decision-makers to explore ‘what-if?’ questions and scenarios for various engineering and strategic applications. In this context, crowd and traffic simulations are most commonly utilized. Urban intelligent traffic management and pedestrian flow analysis greatly benefits from the latest generation of 3D City Information Models created from accurate urban-scale geospatial information. Analysis and simulation tools based on geometric, semantic, morphological, and structural information at the urban scale level offer the scientific foundation for all the activities required for identifying, detecting, planning, training, and analyzing vulnerability that may threaten human lives in urban environments. Nevertheless, the literature research showed that samples of operational Digital Twins incorporating simulation capabilities are impracticable for small municipalities and rural, low-income communities due to their complex infrastructure, hardware, and data requirements. It is desirable to reduce the requirements for these Digital Twins and still be capable of running comprehensive and accurate simulations based on urban-scale geospatial information. This article proposes an innovative framework and workflow capable of generating an operational Digital Twin and its visualization in the form of a 3D model using a procedural approach. The Digital Twin is connected with the traffic simulation SUMO and the Game Engine Unity for visualization using the TraCI middleware. The middleware is extended with additional functionalities and acts as an authoring tool. Unity allows visualizations in VR. The entire framework can be run on a single, standalone computer and is ready in a matter of minutes. The proposed framework for integrating modeling, simulation, and visualization of operational Digital Twins can help guide better decision-making for both rural areas as well as cities.
1 Introduction
In the academic years from 2001/2002 to 2015/2016, more than 190 shootings have occurred in or near a college campus across the United States (Cannon, 2016, p. 3). The shootings caused 167 victims, and 270 were wounded (Cannon, 2016, p. 4). In addition to the possibility of potential harm to students caused by humans (shootings, terrorist attacks, etc.), a wide variety of non-human threats could occur on campus (flooding, fire, gas leaks, earthquake, tsunamis, etc.). A fast, effective, and complete evacuation may become necessary for many of these scenarios. The evacuation scenarios outlined above vary greatly in the required response. Some of the scenarios require low-scale evacuations, limited to just a single building. Others, however, may require the large-scale evacuation of an entire area. This area may become unusable for a considerable amount of time, and the effects on the traffic situation on the remaining area will be tremendous. Some of the scenarios apply not only to college campuses but also to small municipalities.
Large universities may have thousands of students trafficking the campus at any time, surpassing the number of residents of many small towns. Thus, the requirements for the administrators for either are comparable.
Although emergency managers and administrators consider digital simulation as a useful training tool, they do not want to replace hands-on exercises. But it is essentially impossible to test large-scale evacuation scenarios with that many people. Consequentially, it is of particular interest to simulate and track these evacuation scenarios to ensure a safe, fast, and complete evacuation and continuous upkeep of the traffic flow. Simulation Suites utilizing Digital Twins (DTs) can help with these simulations.
This is the main focus of the proof-of-concept application presented in this paper. There are several modeling and simulation tools for applications linked to emergency response, and more are being developed. In this paper, we investigate on the integration of traffic and crowd simulation with Urban Digital Twins. We propose a framework to model real-world traffic conditions on urban digital twins, generated using available geospatial datasets to reproduce and simulate the traffic in a DT in a virtual reality environment. For this purpose, a DT of the Oregon State University (OSU) campus was realized as a proof-of-concept.
The distinguishing features of this framework are embodied in two aspects: The first aspect is the generation of a procedural City Information Model (CIM), including a 3D model, based on already existing geospatial datasets using the Safe FME (Feature Manipulation Engine (FME)) and CityEngine, and how to store this Model in a specified format for later use and information provision. A further contribution is the description of the procedure for streaming the DT into the Game-Engine “Unity” using the ArcGIS-Plugin for visualization. The second aspect is the generation of the simulation. This simulation is populated using different data sources and runs in the application Simulation of Urban Mobility (SUMO). The simulation results from SUMO are then combined with the 3D model of the CIM and presented to the user with a Virtual Reality (VR)-ready visualization in Unity.
The resulting framework is considerably less complex than others and is capable of running comprehensive simulations on a standalone computer compared to other CIM-based simulations. These simulations often run on distributed systems. While the paper implements a simulation using SUMO, the modular components of the framework allow easy implementation of the same approach for different simulations, e.g., crowd simulations.
In Section 2, an overview of the current research and applicable literature is given. This review is followed by the system architecture and its implementation in Section 3. This implementation is then evaluated and discussed in Section 4 and critically reviewed in Section 5.
2 Selected literature research
The concept of utilizing the DT paradigm for cities has been largely investigated (Xu et al., 2021). Most CIMs, as the DTs of cities are often referred to, are used for smart urban planning, automated vehicles simulation, and urban governance of major cities (Angelidou, 2017; Wang et al., 2021). Usually, these CIMs incorporate the capability for running simulations. These simulations include traffic, cell coverage, urban climate, wind stream, and other aspects (Dembski et al., 2019; Schrotter and Hürzeler, 2020; National Research Foundation, Singapore, 2021). Given the wide variety of simulation topics, it is clear that no single simulation software can simulate these aspects. Consequently, all CIMs considered during the preliminary research suffered from the very same problem: The underlying infrastructure is complex, specialized, and at times self-developed software has been used (Dembski et al., 2020).
One of the most comprehensive CIM at the moment, “Virtual Singapore”, includes simulations for wind, gas leaks, cell phone coverage, and crowd movement (National Research Foundation, Singapore, 2016; National Research Foundation, Singapore, 2021). The system commemorates multiple datasets of preexisting data, and still had a budget of over 73 Million Dollars and took over 5 years to realize (Singapore Land Authority, 2012). However, comparing the state of Singapore with a college campus is not ideal.
The CIM of the town Herrenberg in Germany is more suitable for this comparison. The town of Herrenberg has around 30000 citizens, around the same number of students as OSU. At the time of sporting events, the OSU campus might surpass that number. The CIM of Herrenberg and the adjunct software can be used to run wind, emission, climate, and traffic simulations (Dembski et al., 2019). The DT was established using non-free data from regional authorities and extended using light detection and ranging (LiDAR)-scans (Dembski et al., 2019; Dembski et al., 2020). The infrastructure contains multiple software components, namely the distributed software system COVISE.
Both CIMs closer investigated can simulate similar scenarios and are intended to be used for much more than just a simulation, namely smart urban governance and decision-making. The preparation of the CIMs includes data created explicitly for the purpose of the CIM and limits the system to this area. Changing the target area would require the preparation of new data, resulting in additional costs. Even if it would be possible to set up the system on-the-fly for a new area, the distributed software architecture still makes both systems hard to use by individuals and will always require complex and costly infrastructure.
This paper aims to overcome the described problems by proposing a smaller, less complex framework capable of running on a regular computer. The proposed framework can be used for creating a CIM based on publicly available mapping information. This model can be used in connection with different traffic simulation scenarios. These scenarios, among others, can include pedestrian traffic, emergency management, and traffic guidance at large events. While the investigated systems require lots of preparation and infrastructure, the proposed framework could be ready in a matter of minutes. It could therefore be used for simulations for single occasions such as sports events and festivals.
3 System architecture and components
While the proposed framework is capable of running on a standalone system, it still consists of multiple separate applications interacting closely with each other. The framework includes components for establishing the DT, including the 3D model (Safe FME, Esri CityEngine). Others are used for establishing the simulation (NetEdit, SUMO). All components are combined using a middleware (“Authoring Tool”). This component and the Unity application for visualization are custom-written for the framework. An overview of the various components and their interaction can be found in Figure 1. An overview of the workflow can be found in Figure 2.
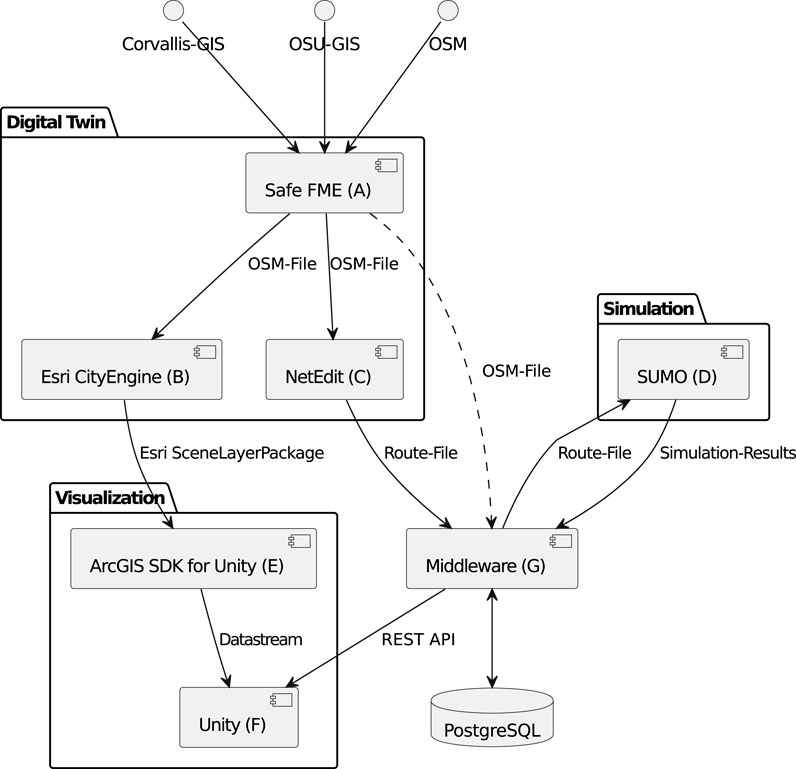
FIGURE 1. Overview of the various software components used for establishing the Digital Twin and the simulation. The figure shows the interaction between the components.
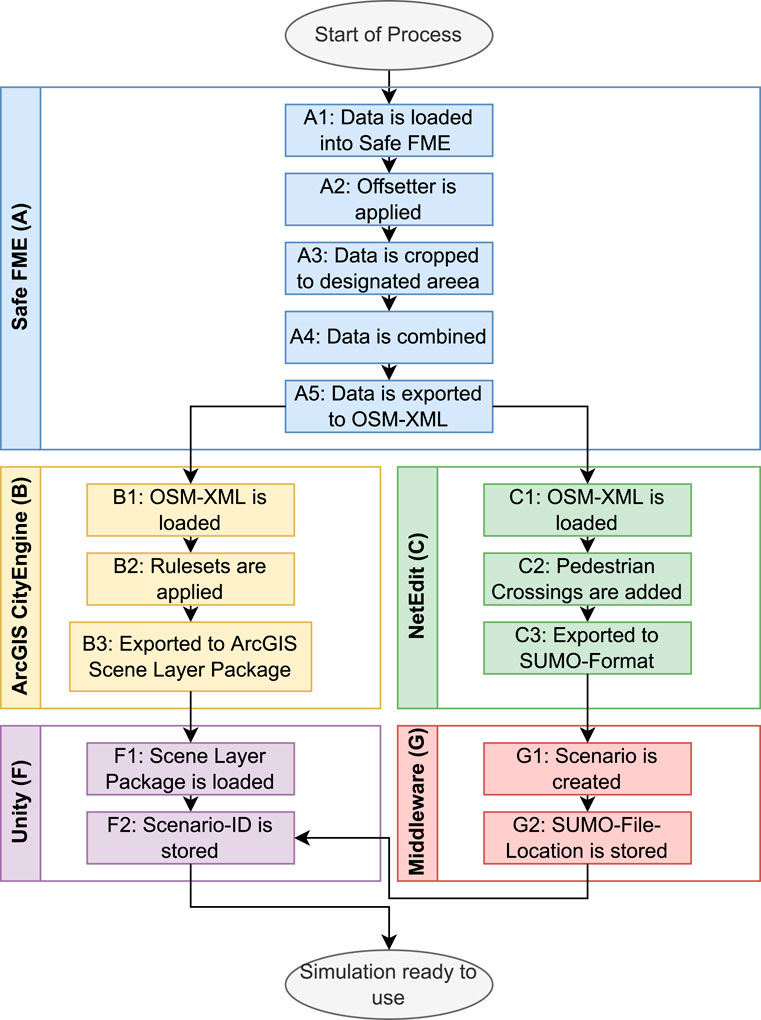
FIGURE 2. Overview of the workflow required for the creation of a simulation and visualization. The letters correspond to the letters in Figure 1.
3.1 City Information Model
The first step in the workflow is the generation of the DT. A DT is, to some extent, a copy of the real world into a digital model (Dembski et al., 2020). Usually, DTs includes real-time sensor information to extend the model. The process to generate a DT consists of the data integration and harmonization of the different map sources and the generation of the 3D model. Usually, DTs can interact with and store real-time information from sensors and other sources. The DT used in this framework is not directly capable of this. Instead, the later described authoring tool (see Section 3.3) can be used to incorporate real-time information into the model and the simulation.
Another difference is the generation of the DT. Usually, new data is collected specifically for this process. This data collection uses tools such as LiDAR measurement, photogrammetry, and other methods. Collecting data using these methods is an expensive undertaking. Additionally, generating the Model from these datasets is highly complex and requires expertise for accurate results (Son et al., 2015; Dembski et al., 2020). It was decided to use a different approach for the model in this framework. Instead of collecting brand-new data, the described process uses only preexisting data from public sources. This enables the process to be applied to every area of the world. Additionally, costs and complexity for the DT generation are significantly lower compared to other approaches. The described workflow assumes specific base criteria for the dataset (e.g., building footprints, road shapes, and sidewalk shapes).
Multiple public mapping sources are available online. The most popular ones are Google Maps, Bing Maps, and the open-sourceOpenStreetMap (OSM) (OSM-Contributors, 2022a; Google, 2022; Microsoft, 2022). While all these online maps offer roughly the same coverage, the level of detail is highly different and dependent on the area (compare Figure 3: Google (Figure 3A), Bing (Figure 3B), and OSM (Figure 3C), showing the Kelley Engineering Center at OSU). Accessibility of the data was another factor that was considered. Only OSM offers a publicly available Extensible Markup Language (XML) standard (OSM-Contributors, 2022b) for downloading and editing the mapping information. Still, as none of the mapping sources was deemed accurate enough, multiple sources have to be combined to form one conclusive dataset. It is possible to enrich and extend the data available from OSM with information obtained from other sources and build a highly accurate dataset based on the latest information available.
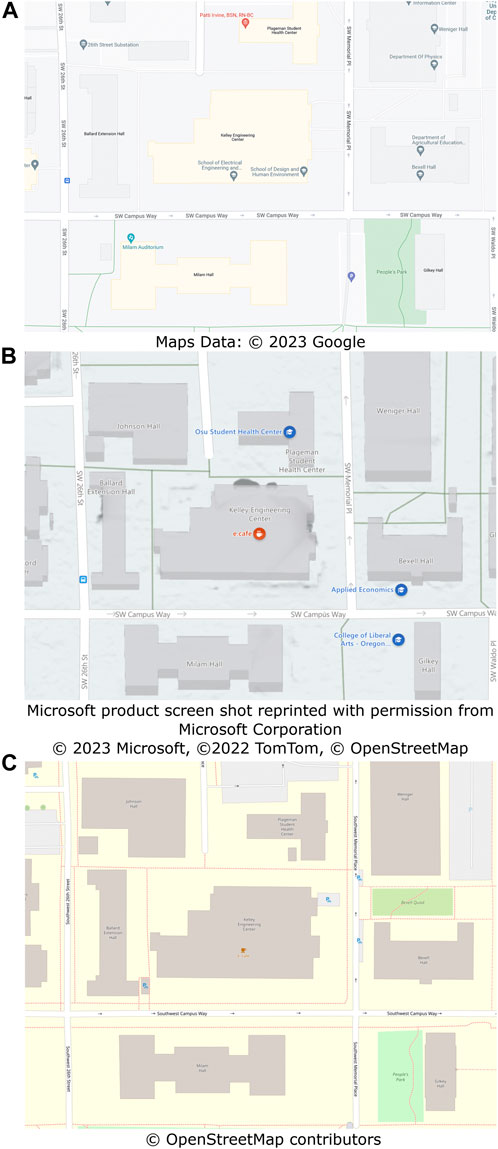
FIGURE 3. Comparison between the possible sources of publicly available mapping data. (A) Google Maps, (B): Bing Maps, (C): OpenStreetMap.
Data from OSM, the municipality of Corvallis (Corvallis GIS Services, 2022a; Corvallis GIS Services, 2022b) and OSU is combined into one comprehensive dataset. This data integration and harmonization process is completed using the software “Safe FME” (see Figure 1, A). This software can analyze, process, and write geospatial data from different formats and files into one file automatically (Safe Software, 2022).
The different datasets are loaded into FME (Figure 2, A1). The data is remapped onto the same coordinate reference system to ensure accurate results. An Offsetter-component within Safe FME, shifting features in lateral and vertical directions, is used on some datasets to reduce a slight geospatial difference between the datasets (Figure 2, A2). This offset was determined visually using building footprints as a reference. Additionally, the data is clipped to an area defined by the user, reducing the amount of data to process (Figure 2, A3).
The next step combines the relevant elements using different methodologies (Figure 2, A4). Most implemented methods for combining the different dataset uses one data source as the primary source, and every other dataset is mapped onto this source. This primary source is determined by visual inspection and comparison with satellite imagery. Other methods include merging the areas, using the average between areas/lines, and cropping one area from another. The most suitable method has been chosen depending on the data type (polygon, line, point) and the entity type (building, sidewalk, road).
While a DT generally covers all aspects of the twinned entity, this DT’s current usage scenarios are traffic simulations. Therefore, the primary focus in the process of generating the DT was on the combination of traffic elements, mainly composed of roads and sidewalks.
Different methods of mapping roads are used in different data sources. OSM uses centerlines, while other datasets use the actual outline of the road. Additionally, different sources have different definitions of roads, e.g., if on-street parking is considered part of the road. Combining these different methods and definitions causes the road shape and the centerline to differ greatly between the datasets. OSM relies heavily on a centerline to store relevant metadata for roads and sidewalks. A new centerline is created using the center of the combined road shape. Using the name, if available, as a unique key, the metadata for the roads from the different sources can be extracted and mapped onto this new centerline. If a dataset includes roads not previously present in the OSM-data, default values have been assumed for the required metadata.
The combined data is exported to an OSM XML File (Figure 2, A5). This format enables the direct import into Esri CityEngine and SUMO. Additionally, various tools for visualizing and debugging the combined data could be used during the development of the workflow.
3.2 Traffic simulation
The data combination process results in an OSM XML file containing a highly accurate dataset of the given area. The simulation software should be able to digest this data directly and create a simulation based on the data. While SUMO cannot run directly from the XML file, its software suite contains applications required to convert the XML file into the required format, a different XML schema. Other software, e.g., Carla, would require the data either in a non-proprietary format for Safe FME or would need additional third-party software for simulation generation.
Different software for traffic simulation comes with a wide variety of use cases. Carla focuses on the simulation of autonomous vehicles by simulating all sensor results a vehicle could have (LiDAR, radar, cameras). The traffic simulation included is merely a side product. The simulation of sensors and the inherently different simulation approach compared to SUMO produces a significant performance overhang. A simulation with more than 20 cars already causes performance problems on a high-end computer.
On the other hand, SUMO mainly focuses on traffic and pedestrian simulation. Several different traffic models, the way the entities move throughout the simulation, are already implemented and cover all standard transportation modes in an urban environment. Resulting of these significant differences in the use cases, the implementation of the two simulation software differ highly. SUMO handles a simulation with multiple hundred cars and pedestrians well. Additionally, SUMO allows the combination of different traffic models for the same entity. An entity could be spawned, walk a distance by foot, then enter a bus, and move the rest of the way by foot.
The possibility of implementing a new traffic simulation was discarded due to the unnecessary complexity. It is unlikely that any traffic simulation implemented during the cause of the research period would have any advantages over SUMO. SUMO has been continuously developed since 2002 and is state-of-the-art simulation software by the German Aerospace Center (Alvarez Lopez et al., 2018).
Another reason we use SUMO (see Figure 1, D) over Carla and other commercial products is the possibility of interacting with the simulation using a well-documented Application Programming Interface (API). It allows the ingestion of new entities and entity types during runtime. The Traffic Control Interface (TraCI), SUMO’s API, gives the simulation near real-time capabilities, an essential aspect of DTs.
The network information is extracted from the OSM-file generated by Safe FME (Figure 2, C1) and stored in a SUMO proprietary XML format using NetEdit (Figure 2, C3). This network can be loaded as a simulation using the Graphical User Interface (GUI), Command Line Interface (CLI), or TraCI. SUMO loads demand elements (the entities) from a second XML file or waits till TraCI ingests them. SUMO itself is not real-time. The near-real-time capabilities come from a second application or script running the TraCI-Sim-Step-command with a given interval. However, even with this setup, the user can never be sure if the simulation step was completed successfully before the new command is executed.
Figure 4 shows the traffic simulation running within SUMO.
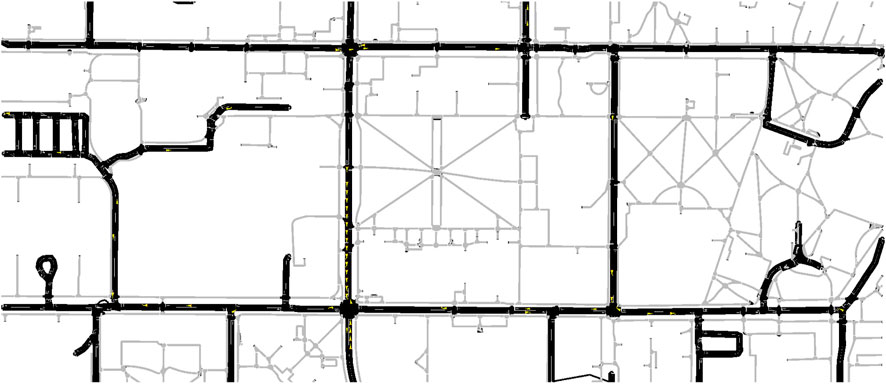
FIGURE 4. Screenshot of a running SUMO-Simulation.
3.3 Authoring
TraCI enables the entity ingestion into SUMO during runtime. A second application utilizes TraCI to set up a connection with SUMO, to set the pace at which the commands are executed, and provides the data to ingest into SUMO. In our case, this application is called the Middleware or Authoring tool (see Figure 1, G).
The authoring tool must execute the sim step at a set pace to have a simulation as close to real-time as possible. The time period between these executions has to be the same every single time. Otherwise, the simulation would be sped up or slowed down. The authoring tool starts a separate thread for executing the Sim-Step commands (see Figure 5). All other commands required for data ingestion are stored in a queue (compare Figure 5, C and E). The main thread executes a set number of commands from each queue during each Sim-Step. Before and after the execution of the command, the current time is recorded (Figure 5, A and G). These timesteps are subtracted from each other (Figure 5, H). The thread will sleep the difference between this period and the required period for a near real-time simulation (Figure 5, I).
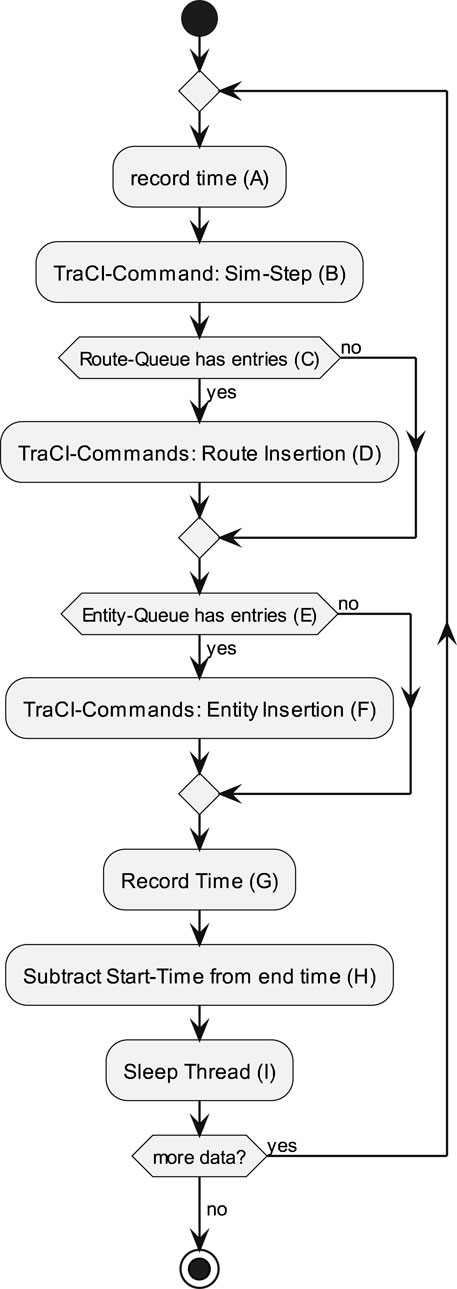
FIGURE 5. The Activity-Diagram of the thread responsible for executing the TraCI-Commands.
The nature of Unity and the desire to let the simulation visualization run in VR prevented the integration of these activities into Unity itself. As the simulation running in SUMO would always require a computer in addition to the Helmet Mounted Display (HMD), there is no downside in using a separate application for these steps. Additionally, it allows for multiple visualization clients (instances of the visualization, either on a computer or on a HMD-device) to connect to the authoring tool and visualize the results of the same simulation. Another benefit of this design choice are the additional features, e.g., a database connection to store persistent scenario and the easier integration of sensor information.
The authoring tool is written in C# using the ASP.NET Model-View-Controller (MVC) framework, allowing direct mapping of database entries to instances of classes within the application. Additionally, the framework allows the easy creation of a REST API. This API can be used to insert real-life data from various sources into the datastore of the authoring tool to be used in the simulation. The same API is utilized by the visualization clients to retrieve the data to visualize.
At the moment, the authoring tool can start a simulation based on the SUMO-XML-file, retrieve the information of the simulation and condense it to the required information for Unity. New entities can be inserted using completely random routes, a start point with a random endpoint, or a completely given route. Random routes are, if activated, generated at a certain rate in a thread. Fixed routes can be inserted using the API of the authoring tool, SUMO-XML-files or retrieved from the database.
After each executed sim-step command, the authoring tool retrieves the entity data from SUMO. The data retrieval is implemented using the subscription system offered by the TraCI. The retrieved data is compared to the entities’ last information. The information on which entities are updated (= new, deleted, or position changed) is then offered for retrieval in the API.
3.4 Visualization
Visualizing the results of a simulation are equally important as the simulation itself. A good visualization of simulation results can significantly improve the user’s understanding of the information (Eberhard, 2021). For the current scenario, visualization of two different data sources is required. The first data source is the DT contained in the OSM-XML-File, and the second data source is the simulation results. Both data sources are visualized in one VR-ready visualization.
3.4.1 3D model
The data combination and enrichment done with Safe FME results in a highly accurate representation of an area. This data is used to create a 3D model of the data. Such a 3D model can be either created manually or procedurally. A tool for the procedural creation of a 3D model is Esri CityEngine. Esri CityEngine contains a powerful toolchain for creating a procedural model of large urban areas. CityEngine reads the metadata contained in the XML file (Figure 2, B1) and applies rulesets (Figure 2, B2). Rule files are fully customizable, resulting in a model fitting the personal requirements.
The current proof of concept has implemented a relatively simple generation workflow. The Model only contains building shapes, sidewalks, trees, streets, and parking areas. CityEngine would be capable of generating urban furniture (benches, traffic signals, and others) as well as road signs and road lines.
Another important aspect of using CityEngine over a package or a custom-implemented plugin for Unity is its high compatibility with other applications. The model can be exported to various formats and further refined in other applications for perfect results.
As the user of the visualization application should be capable of navigating through the urban environment, significant, well-known objects are required. To achieve this, additional models of some critical buildings can be manually added to the generated model manually.
The 3D model generated in Esri CityEngine is stored in the Esrio proprietary Scene Layer Package (Figure 2, B3).
3.4.2 Unity-visualization
Unity is a powerful game engine. Various additional packages allow the implementation of various different use-cases. The “ArcGIS Map SDK for Unity” brings geospatial features to Unity. As outlined above, the Authoring Tool is implemented using the concept of MVCs. The usage of Unity over other game engines allows the direct usage of the C#-classes created as models for the authoring tool. This simplifies the implementation of the API interface into Unity.
The already mentioned “ArcGIS Map SDK for Unity” is also capable of loading the Scene Layer Package exported from CityEngine and displaying its content in the virtual environment (Figure 2, F1).
Unity is implemented using GameObjects. Every GameObject can contain multiple C# classes, and different functions of these classes are executed at certain events during the application life cycle (start, update frame, stop). The GameObject containing the class SUMOClient connects to the authoring tool at the start of the application, starts a simulation identified by its unique ID (Figure 2, F2), and waits till the simulation has started. Once started, the SUMOClient retrieves the list of the entities in the simulation at a rate based on the application’s target frame rate. This rate is usually at 30 updates per second, while the maximum frame rate of Unity is around 120 Frames per Second (FPS). The different update rates minimize the number of requests on the authoring tool and the resulting missed or incomplete responses and greatly improved the performance of all components (simulation, authoring, and visualization).
The SUMOClient contains a list with all objects it spawned and compares this list with the retrieved list. A new GameObject representing the entity is spawned if the retrieved list contains new entries. If the list contains updated information about the entity, the position of the corresponding GameObject is updated. GameObjects no longer in the retrieved list are deleted.
Other components in the SUMOClient are responsible for the interaction between the user and the simulation. The main user feature in the application at the moment is the insertion of new entities into the application. The user can specify two points within the boundaries of the simulation that are mapped to the next streets or sidewalk. These points are then used for inserting a new entity into the simulation. Both vehicles and pedestrians can be inserted at this point.
The 3D model representing the simulation area is loaded into the application using the ArcGIS-Plugin. The models generated by Esri CityEngine are saved as a 3D Scene Layer package, loaded by the plugin, and displayed. This method can easily combine additional information and maps, such as terrain data, base maps, or other 3-dimensional layers independently from the model generated using the combined data.
The user can navigate through the visualization using teleportation and regular movement. These two movement paradigms allow the user both to travel big distances in the simulated area and to move to a precise location to specify a start point. Additionally, it allows the usage of the visualization both in VR as well as on a regular desktop setup.
The final result of the described visualization is visible in Figure 6 and in Figure 7.
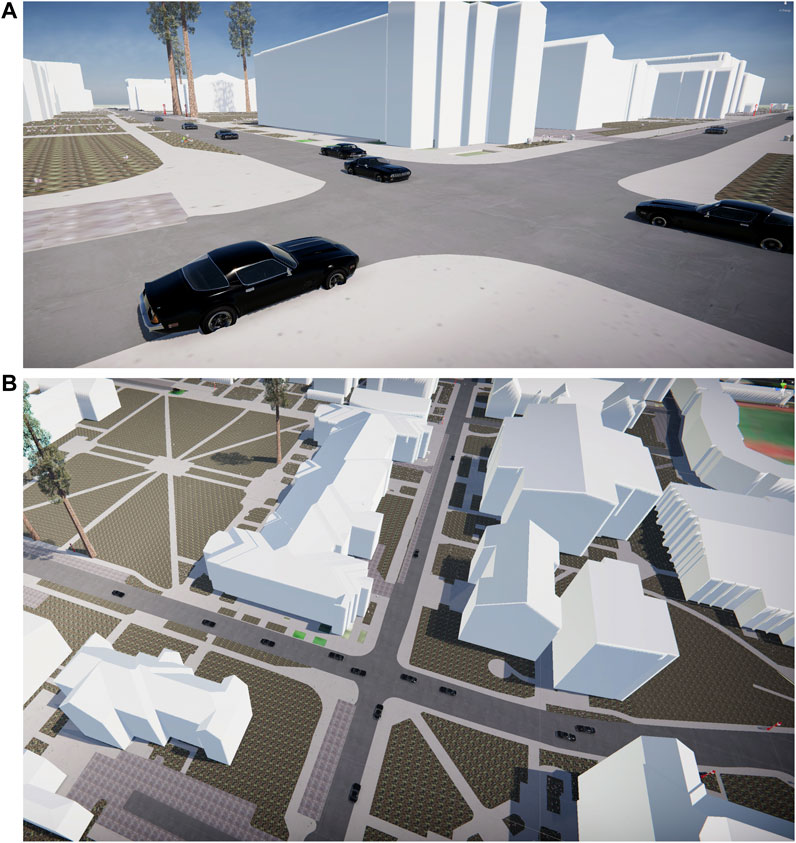
FIGURE 6. A 3D model of the Oregon State University Campus is visualized in Unity. The cars visible in the visualization are simulated using SUMO. (A,B): Different Views of the visualization running inside Unity.
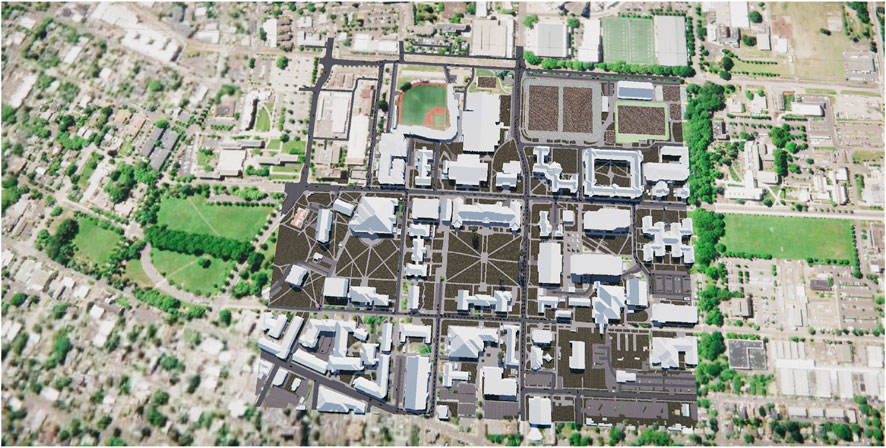
FIGURE 7. Overview of the running simulation visualized in Unity. The model is displayed on top of an ArcGIS Online basemap (© Esri, Maxar, Earthstar Geographics, GIS User Community). The base map was created using ArcGIS® software by Esri. ArcGIS® and ArcMap™ are the intellectual property of Esri and are used herein under license. Copyright © Esri. All rights reserved. For more information about Esri® software, please visit www.esri.com.
4 Validation of system architecture
While the complexity of the framework is significantly reduced compared to the frameworks presented in the literature review section (compare Section 2), the proposed architecture is still complex. At the moment, the described framework is not designed after a specific set of user and customer requirements; therefore, using user evaluation at this point of the implementation was not conducted. The software validation phase has been finalized through several integration and system tests. During the integration testing all the individual components were integrated to create composite components that were tested against the requirements in Table 1. We plan to conduct a software validation based on the final user implementation in the near future, were a number of acceptance tests will be coupled by a NASA TLX and SUS evaluation.
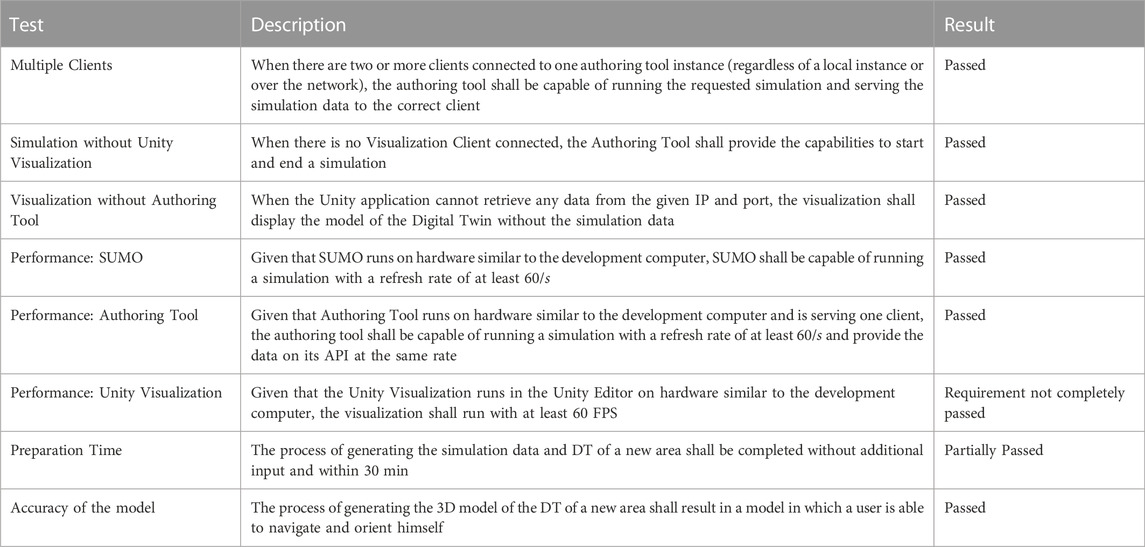
TABLE 1. Integration tests applied during the creation of the area or on the result of this creation.
These tests are focused on the question of whether the current implementation allows the simulation as well as the visualization in real time. A secondary focus is if the proposed architecture is rigid enough for deployment to a potential end-user, who could then be used for a user evaluation.
To conduct these integration tests, a DT of the OSU Campus in Corvallis was created using the procedures described in the previous sections. This campus area is visible in Figure 8 and covers the central area of the campus (0.6405 km2). The selected area contains multiple roads, intersections, complex road crossings, and a wide variety of sidewalk and pedestrian areas (Compare Figure 8B for coverage and Figure 6 for the visualization in Unity).
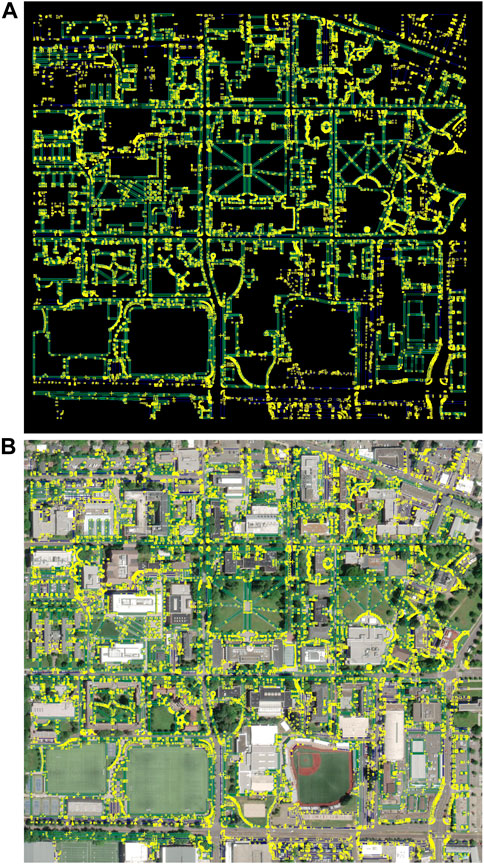
FIGURE 8. The raw data of the Digital Twin after the data combination using Safe FME. (A) Digital Twin-Data, (B) Digital Twin-Data overlaid with Esri satellite imagery. (© Esri, Maxar, Earthstar Geographics, GIS User Community). The base maps was created using ArcGIS® software by Esri. ArcGIS® and ArcMap™ are the intellectual property of Esri and are used herein under license. Copyright © Esri. All rights reserved. For more information about Esri® software, please visit www.esri.com.
These integration tests were conducted after the implementation of each software component outlined in Section 3. As the requirement regarding the performance of the Unity visualization is the only one not completely met and a simulation in real-time is an inherent key requirement, this test is described more in detail.
The authoring tool creates cars and pedetrians at a rate of 5, 10, 15, 20, 25, and 30 (respectively) entities per second. The simulation data is transmitted to the visualization running in the Unity Editor. As the vehicle model is more demanding in data transmission and rendering than the pedestrian model, the number for both types of entities is displayed separately in the results. As a result of the randomized routes, the entities remain in the simulation for a different time span, resulting in a non-linear curve for entities in Figure 9. The player character in Unity remained in the same position in which he spawned to minimize the influence of the model rendering and API usage of the “ArcGIS SDK for Unity” on the overall result. Remaining with the character in the same position promises more comparable results. The FPS and the number of entities for the first 2 min of each run have been recorded. The FPS have been averaged for each second to minimize noise. The results are visible in Figure 9.
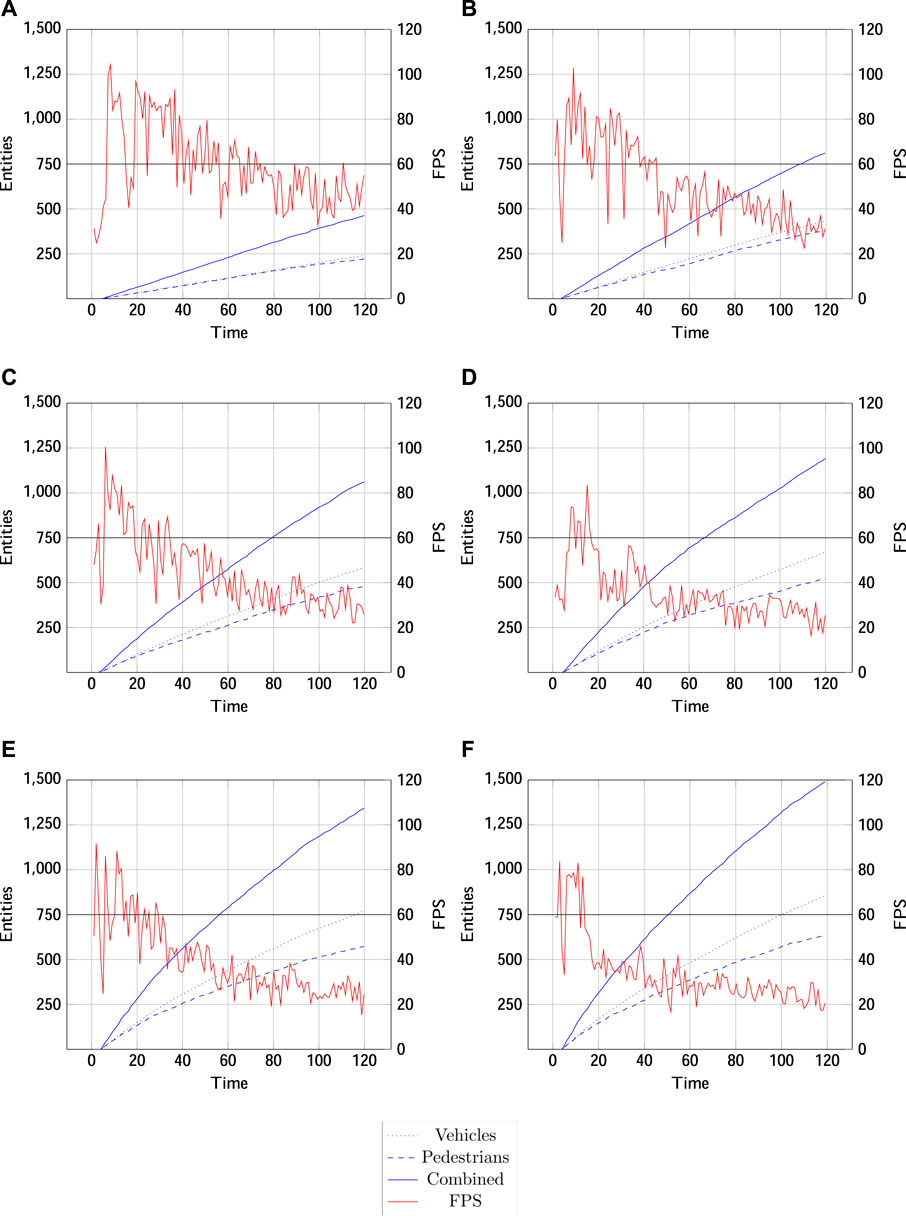
FIGURE 9. The results of the performance test. The frame rate is visualized in red, and the number of entities is visualized in blue. The time is given in seconds from the start of the visualization. The following captions provide the spawn rate for pedestrians and cars for each figure. (A): Pedestrians: 5/s, Vehicles: 5/s, (B): Pedestrians: 10/s, Vehicles: 10/s, (C): Pedestrians: 15/s, Vehicles: 15/s, (D): Pedestrians: 20/s, Vehicles: 20/s, (E): Pedestrians: 25/s, Vehicles: 25/s.
The graphs presented in five show two very critical behaviors: With the number of entities in the simulation increasing, the FPS is falling rapidly. The FPS falls under 60 FPS permanently at a number of entities of 300 and 400 vehicles with a slight alteration from rate to rate.
The second observation made is that the relationship between the number of entities and achieved FPS does not appear to be linear. After an initial sharp drop at the start of the simulation, the performance drops rapidly but is not falling at a similar rate later during the simulation.
The provided figures show that the current implementation is capable of running near real-time within the given parameters of 60 FPS for an entity count of fewer than 300 vehicles. Since the simulation runs at a rate of 60 refreshes per second, if no additional measures had been taken, the simulation visualization would have dropped behind in real-time. The specific implementation between the authoring tool, simulation, and visualization prevents this.
The results of this integration test shows the complexity of visualizing simulation results of this nature in a virtual environment due to the required stable refresh rate.
The workflow for creating the DT/CIM of the OSU campus area, digests OSM and other sources and prepares a representative model of the area without relying on any additional datasets. However, while the model is accurate enough to help the user to navigate the area in VR, it is not capable of standing its ground with other CIM when it comes to the accuracy of the model. As the model is the result of a process taking minutes rather than months or even years, the result still seems sufficient enough. While the workflow does not require any additional input for the main part of the process, pedestrian crossings are not generated correctly and have to be added manually into the model.
The authoring tool allows the uncoupling of simulation and visualization and allows both to run independently from each other. Additionally, while not an initial requirement, the authoring tool allows multiple clients to connect to the same simulation and to view the simulation results simultaneously.
While the current status of the application is already capable of running simulations, the overall stability of the connection between simulation and visualization needs to be improved. As visible from Figure 9, the overall performance with a large number of entities has to be improved. The most usable way would here to limit the updated vehicles to the area visible by the player (occlusion culling). The most significant future work consists of the definition of a format to define and store scenarios based on quantitative numbers and time steps and not on single entities coupled with a start time.
5 Conclusion
The main goal of the current project was to overcome the problems present in many CIMs. The main issue found during the preliminary research is the complexity of the underlying infrastructure. Both CIMs closer investigated relied on distributed systems. This made the systems inflexible and expensive to main. This paper overcomes the described problems by promoting a smaller, more lightweight infrastructure capable of running on a standalone system. Additionally, the CIM used in the system should be preparable from publicly available data in a procedural manner.
The described workflow and visualization technique overcomes the described problems by proposing a smaller, more lightweight framework capable of running on a standalone computer while minimizing time and data requirements for the creation of the DT. While the system can not surpass the accuracy and depth of data achieved by systems investigated during the literature research, it still provides a reasonable well representation of the area without spending months on data preparation.
While the current implementation shows its capabilities to run and visualizations in a near real-time manner, the overall performance should be increased using more advanced techniques for data retrieval and rendering control in Unity.
Another important aspect not considered is a usability and user requirement study. The implementation is only based on inherent requirements and the wish to provide a tool for these kind of operations and simulations and acts only as proof-of-concept. In a future iteration, user requirements, accessibility and other usability aspects need to be strongly considered to determine if the proposed system has the described capabilities of a regular DT system.
Data availability statement
The raw data supporting the conclusions of this article will be made available by the authors, without undue reservation.
Author contributions
RA was responsible for this research’s conceptualization, methodology, supervision, system architecture design, and funding acquisition. SR was responsible for data collection, analysis and harmonization, software discovery and evaluation, and component adaption, integration, and development.
Acknowledgments
We would like to thank OSU-staff at the department for University Facilities, Infrastructure and Operations for providing us with Geographic Information System (GIS)-data of the OSU-campus.
Conflict of interest
The authors declare that the research was conducted in the absence of any commercial or financial relationships that could be construed as a potential conflict of interest.
Publisher’s note
All claims expressed in this article are solely those of the authors and do not necessarily represent those of their affiliated organizations, or those of the publisher, the editors and the reviewers. Any product that may be evaluated in this article, or claim that may be made by its manufacturer, is not guaranteed or endorsed by the publisher.
References
Alvarez Lopez, P., Behrisch, M., Bieker-Walz, L., Erdmann, J., Flötteröd, Y.-P., Hilbrich, R., et al. (2018). “Microscopic traffic simulation using SUMO,” in 2019 IEEE Intelligent Transportation Systems Conference (ITSC), Maui, USA, 04-07 November 2018 (IEEE), 2575–2582.
Angelidou, M. (2017). The role of smart city characteristics in the plans of fifteen cities. J. Urban Technol. ISSN 24, 1063–1128. doi:10.1080/10630732.2017.1348880
Cannon, A. (2016). Aiming at students. Available at: http://www.nycrimecommission.org/pdfs/CCC-Aiming-At-Students-College-Shootings-Oct2016.pdf (Accessed August 08, 2022).
Corvallis GIS Services (2022a). Structure - file geodatabase. Available at: https://gispub.corvallisoregon.gov/GISPublic/Dynamic/Fgdb/Structure.gdb.zip (Accessed 04 27, 2022).
Corvallis GIS Services (2022b). Transportation - file geodatabase. Available at: https://gispub.corvallisoregon.gov/GISPublic/Dynamic/Fgdb/Transportation.gdb.zip (Accessed 04 27, 2022).
Dembski, F., Wössner, F., and Letzgus, M. (2019). “The digital twin - tackling urban challenges with models, spatial analysis and numerical simulations in immersive virtual environments,” in Architecture in the age of the 4th industrial revolution - proceedings of the 37th eCAADe and 23rd SIGraDi conference. Editors J. Sousa, J. Xavier, and G. Castro Henriques (Porto, Portugal: University of Porto), 1, 795–804. CUMINCAD.
Dembski, F., Wössner, U., Letzgus, M., Ruddat, M., and Yamu, C. (2020). Urban digital twins for smart cities and citizens: The case study of Herrenberg, Germany. Sustainability 12, 2307. doi:10.3390/su12062307
Eberhard, K. (2021). The effects of visualization on judgment and decision-making: A systematic literature review. Manag. Rev. Q. doi:10.1007/s11301-021-00235-8
Google (2022). Oregon state university campus area. Available at: https://www.google.com/maps/@44.5673015-123.2789381,18.5z (Accessed 08 29, 2022).
Microsoft (2022). Oregon state university campus area. Available at: https://www.bing.com/maps/ (Accessed 08 29, 2022).
National Research Foundation, Singapore (2016). Uses of virtual Singapore. Available at: https://www.youtube.com/watch?v=y8cXBSI6o44 (Accessed 08 25, 2022).
National Research Foundation, Singapore (2021). Virtual Singapore. Available at: https://www.nrf.gov.sg/programmes/virtual-singapore (Accessed 08 22, 2022).
OSM-Contributors (2022a). Oregon state university campus area. Available at: https://www.openstreetmap.org/ (Accessed 08 29, 2022).
OSM-Contributors (2022b). “OSM XML,” in OpenStreetMap-Wiki. Available at: https://wiki.openstreetmap.org/wiki/OSM_XML.
Safe Software (2022). What is FME? ⋅ introduction to FME desktop. Available at: https://safe-software.gitbooks.io/introduction-to-fme-desktop/content/1.getting-started/1.02.what-is-fme.html (Accessed 04 27, 2022).
Schrotter, G., and Hürzeler, C. (2020). The digital twin of the city of zurich for urban planning. PFG – J. Photogrammetry, Remote Sens. Geoinformation Sci. 88, 99–112. doi:10.1007/s41064-020-00092-2
Singapore Land Authority (2012). Virtual Singapore - a 3D city model platform for knowledge sharing and community collaboration. Available at: https://www.sla.gov.sg/articles/press-releases/2014/virtual-singapore-a-3d-city-model-platform-for-knowledge-sharing-and-community-collaboration (Accessed 08 22, 2022).
Son, H., Kim, C., and Turkan, Y. (2015). “Scan-to-BIM-an overview of the current state of the art and a look ahead,” in Isarc. Proceedings of the international symposium on automation and robotics in construction (citeseer), 32, 1.
Wang, Z., Han, K., and Tiwari, P. (2021). Digital twin simulation of connected and automated vehicles with the unity game engine. doi:10.36227/techrxiv.14582943.v1
Keywords: digital twin, unity, traffic simulation, game engine, city information model, geographic information system, data combination, SUMO
Citation: Rundel S and De Amicis R (2023) Leveraging digital twin and game-engine for traffic simulations and visualizations. Front. Virtual Real. 4:1048753. doi: 10.3389/frvir.2023.1048753
Received: 19 September 2022; Accepted: 09 January 2023;
Published: 21 February 2023.
Edited by:
Sky Lo, Hong Kong Polytechnic University, Hong Kong SAR, ChinaReviewed by:
Francesco De Pace, Polytechnic University of Turin, ItalyWanyu Pei, National University of Singapore, Singapore
Copyright © 2023 Rundel and De Amicis. This is an open-access article distributed under the terms of the Creative Commons Attribution License (CC BY). The use, distribution or reproduction in other forums is permitted, provided the original author(s) and the copyright owner(s) are credited and that the original publication in this journal is cited, in accordance with accepted academic practice. No use, distribution or reproduction is permitted which does not comply with these terms.
*Correspondence: Raffaele De Amicis, raffaele.deamicis@oregonstate.edu