Antimicrobial cellulose hydrogels against gram-positive and gram-negative bacteria
 Karla Miño1
  Antonela Pérez2
  Tamia Xaymara Iza-García3 Dayanna Gabriela Cabascango3 Catalina Gordillo1
  Andrea Gordillo1 Nelson Vispo1
  António Machado3*
  Camilo Zamora-Ledezma4
  Frank Alexis2*
- 1School of Biological Sciences and Engineering, Yachay Tech University, Imbabura, Ecuador
- 2Departamento de Ingeniería Química, Universidad de San Francisco de Quito, Instituto de Microbiología, Instituto de Energía y Materiales, Quito, Ecuador
- 3Colegio de Ciencias Biológicas y Ambientales COCIBA, Universidad San Francisco de Quito (USFQ), Instituto de Microbiología, Laboratorio de Bacteriología, Quito, Ecuador
- 4Green and Innovative Technologies for Food, Environment and Bioengineering Research Group, Faculty of Pharmacy and Nutrition, UCAM-Universidad Católica San Antonio de Murcia, Murcia, Spain
The development of hydrogels has a significant impact in fields such as tissue engineering and biomedical devices. The present study tests different cellulose particles extracted from plants to produce hydrogels and identify if these particles and hydrogels have antimicrobial properties. Nine cellulose particles from Ecuadoran biodiversity were obtained using an established chemical extraction protocol, characterized using known techniques, and evaluated for bacterial growth in-vitro. In addition, two particles of nine were selected to perform bacterial growth rates and bacterial adhesion assays. The bacterial growth rates with cellulose F1 and F53 were similar to the positive control (with antibiotic) with both Escherichia coli ATCC 25922 and TG1 strains. However, the results showed that the bacterial growth rate with seven of the nine cellulose particles was lower than the negative control (without antibiotics) suggesting antifouling properties. Based on the results using cellulose particles and hydrogels with antifouling properties, we prepared a plant extract to test the bactericide properties against Gram-positive (Staphylococcus aureus ATCC 25923) and Gram-negative (E. coli ATCC 25922) bacteria, evidencing the highest inhibitory effect at 40 and 60 mg/mL against S. aureus and E. coli, respectively. Lastly, we encapsulated the bactericide plant extract into the anti-fouling hydrogel. The results demonstrated that the combination of antifouling and bactericide properties could be an alternative approach for surface-modified cellulosic materials applications in the future.
1 Introduction
Bacterial and other microorganism infections caused by implants are of great concern in the biomedical field because they cause many deaths each year worldwide (Alarfaj et al., 2016). The ability of these microbes to colonize surfaces rapidly and migrate allows these microcolonies to produce biofilms. Both Gram-positive and Gram-negative bacteria can cause biofilm formation in biomedical devices (Cangui et al., 2022). The most common bacteria are Enterococcus faecalis, Staphylococcus aureus, Staphylococcus epidermidis, Streptococcus viridans, Escherichia Coli, Klebsiella pneumoniae, Proteus mirabilis, and Pseudomonas aeruginosa (Cangui et al., 2023; Khatoon et al., 2018). Simultaneously, the formation of biofilms on medical implants allows bacteria to acquire antimicrobial resistance (Arciola et al., 2018). Due to the rise of antimicrobial resistance worldwide, alternative therapies and preventive measures are extremely needed nowadays (Zamora et al., 2022; Machado et al., 2023).
Antibiotics are typically employed as a general strategy to overcome bacterial infectious diseases; however, they can also generate resistance if they are not used correctly (Muñoz et al., 2021). According to the European Antimicrobial Resistance Surveillance System (EARSS), the prevalence of methicillin-resistant S. aureus (MRSA) in at least 10% of all S. aureus-associated infections has increased by as much as 40%–50% (Alarfaj et al., 2016).
The need to eliminate or reduce the formation of biofilms on surfaces of biomedical devices has focused on the fabrication of new antimicrobial coatings capable of preventing the colonization and proliferation by microorganisms on surfaces or the modification of the architecture of existing antibacterial surfaces to improve their yield (Hasan et al., 2013; Zamora-Mendoza et al., 2023) Antifouling and bactericidal surfaces have been developed as two types of antimicrobial coatings. Antifouling surfaces can resist the adherence of bacteria to the implant due to the presence of structures that reduce the binding for microorganisms. Bactericidal surfaces cause cell death when bacteria come into contact with the implants; the coating can have either repellent or destructive molecules (Zamora et al., 2022; Machado et al., 2023).
Antimicrobial polymers present a great alternative to combat this issue since their action mechanisms differ from those of antibiotics. Polymers can also show antimicrobial properties and be applied for functionalization with other materials to avoid antibiotic resistance problems. Natural antimicrobial biopolymers are a promising area where further research is needed (Zamora et al., 2022). For this reason, this research aims to analyze the antimicrobial properties of a natural biopolymer, such as cellulose and its hydrogels. In the present study, we hypothesized that natural particles from plants could be an alternative material with the potential to prevent bacterial adhesion in future applications in biomaterials (Figure 1). Nine types of cellulose were characterized and tested against Escherichia coli ATCC 25922 and TG1 to find bactericidal or bacteriostatic effects based on the physical, chemical, and morphological characteristics. Then, two particles were selected to test antibacterial activity by determining colony-forming units per milliliter (CFU/mL). Next, we produced cellulose-based hydrogels and encapsulated a plant extract to test the antimicrobial properties against E. coli ATCC 25922 (Gram-negative) and S. aureus ATCC 25923 (Gram-positive) bacteria. To achieve this purpose, the main analyses made for the anti-fouling capacity of each hydrogel were developed by initial bacteria adhesion and bacterial growth inhibition over time assays. The results demonstrated that the combination of antifouling and bactericide properties could have be an approach for surface-modified cellulosic materials applications in the near future.
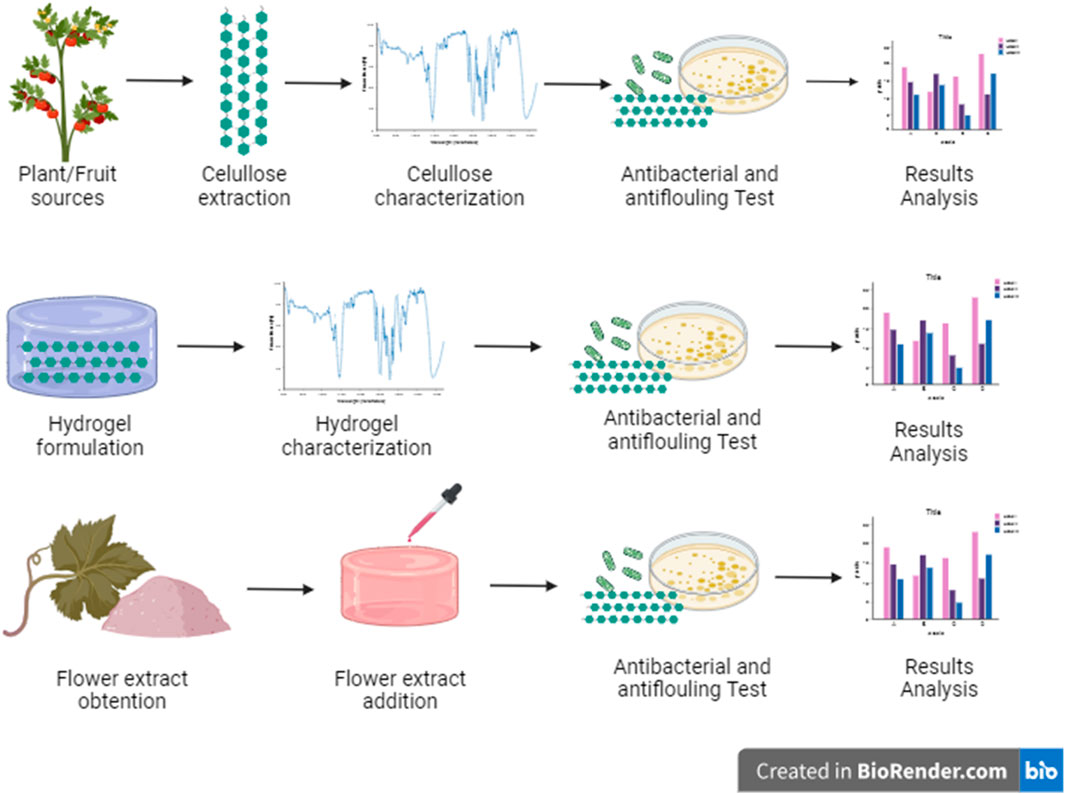
FIGURE 1. Schematic representation of the process and tests performed for the study.
2 Materials and methods
2.1 Materials
The raw material of the cellulose was obtained from different Ecuadorian natural sources acquired in Ecuadorian popular markets. Control samples of commercial cellulose (Sigmacell cellulose, type 20, 20 µm) were supplied by Sigma-Aldrich with purity of 95%–99%.
2.2 Fiber preparations
Cellulose extraction was carried out according to a predetermined chemical extraction technique, which included numerous water washes to eliminate any remaining chemicals. After the extraction process, the pure cellulose was dried for 1 day in a lyophilizer (Labconco model 7670520). We obtained seven powdered celluloses and two fiber-type celluloses (Table 1).

TABLE 1. List of plants and fruits used in the present study.
2.3 Fiber characterization
2.2.1 Fourier Transform Infrared Spectroscopy (FTIR)
FTIR analysis was performed on a spectrometer model Cary 630. First, the spectrum of the gold-plated sample holder was acquired as background, and then the spectra of the samples were recorded. The wavelength range for the analysis was between 500 and 4,000 cm–1 in transmittance mode at a resolution of 4 cm–1.
2.2.2 Scanning electron microscope (SEM)
SEM was used in this investigation to obtain images of the surface structure, porosity, and morphology of cellulose samples. The morphologies of the different cellulose samples were characterized using a Phenom Pro X scanning electron microscope operated at 10 kV. A pin with a carbon film was used to prepare the samples.
2.2.3 X-ray diffraction (XRD)
The X-ray generator was operated to 40 kV and 15 mA in a sealed tube CuKα radiation source. Additionally, for collecting data was employed a θ/2θ configuration in the scan-axis, 0.02° step, and 20.0°/min scan velocity in a range of 5°–90° in 2θ, and the D/tex Ultra2 detector in 1D scan mode. Finally, it used a Soller slit 1.25° receive and incident scattering and high-length receiving and incident slit 10.0 mm, 8.0 mm, and 13.0 mm, respectively.
The degree of crystallinity of each cellulose sample was analyzed using a powder diffractometer Rigaku, Miniflex-600, equipped with a D/tex Ultra2 detector. The crystallinity index can be calculated using the following equation:
Where
2.4 Antibacterial test of the cellulose particle surface
The antibacterial activity of the cellulose surface was tested against two strains of E. coli ATCC 25922 and TG1 by two different methods, more exactly, qualitative evaluation with an agar diffusion assay and quantitative evaluation in a culture broth medium.
For the qualitative evaluation, overnight cultures of E. coli TG1(1E+08 colony-forming units (CFU)/mL) were placed in a Petri dish filled with Luria Bertani (LB) agar. Different amounts of cellulose particles were placed in the spaces from 1 to 4 labeled on each plate at 1, 5, and 10 mg. Besides, as a control, 3 µL of ampicillin were used and placed over the colonies, and then the cultures were incubated at 37 C for 24 h. After the required time, a definite zone of bacterial inhibition around the samples was measured to evaluate antibacterial activity.
The antibacterial activity was also quantitatively determined in terms of growth inhibition by measuring the optical density of bacteria treated with cellulose particles. This test included a positive control (medium + bacteria + antibiotic), a negative control (medium + bacteria), and a cellulose control (medium + cellulose). The ampicillin was prepared at a concentration of 1 μL/mL. Overnight cultures were prepared by inoculating 100 µL of E. coli ATCC 25922 and TG1 in 3 mL of LB broth medium and then incubated at 37°C and 180 rpm. Theoretical bacterial density (OD) at 600 nm was measured by immersing a 100 mg sample of each cellulose in 10 mL of LB medium with an initial optical density (OD) of 0.05 (approximately 1E+05 CFU/mL) in all test tubes. The corresponding negative controls were added to the assays, as well as positive controls were prepared by adding 10 μL of ampicillin to 10 mL of LB medium. The cellulose’s optical density affects the absorbance measurements because it begins to degrade over time. For this reason, optical density readings of controls were taken with each cellulose sample (100 mg) diluted in an LB medium. Then, this influence was analyzed in each case to obtain the actual absorbance. All the suspensions were incubated on a rotary shaker at 180 rpm at 37 C for 24 h. Each tube’s absorbance was measured periodically at 600 nm using a UV-visible spectrophotometer (ZUZI model 4,211/50) at 3, 6, and 24 h.
2.5 Statistical analyses
For the statistical analysis, the Malthusian growth equation was used to understand bacteria’s growth kinetics and extract information about their behavior with the cellulose particles under study. For this, the specific growth rates were calculated for each case with the following equation:
Where Pt is the population in a time, Po is the initial population, k is the specific growth rate, and t is the time in hours.
Subsequently, a one-way analysis of variance (ANOVA) was performed with the growth rates obtained to determine if there were significant differences between the samples. After this, a Duncan Test was performed to classify the samples. Statistical software R was used for all analyses (https://www.rstudio.com/).
2.6 Hydrogel formulation
According to Guamba et al. (Guamba et al., 2023), the hydrogel formulation was prepared utilizing a 1:10 concentration of cellulose and a basic solvent. The solvent comprises 4% urea and 6% sodium hydroxide (NaOH). Following the formation of the hydrogel matrix, it underwent washing with distilled water until the basic pH transitioned to neutral. This procedural step was executed for both F1 fiber cellulose and the commercial cellulose by Sigma-Aldrich, serving the purpose of establishing a control reference.
2.7 Jamaica flower extract
To prevent any interference with the hydrogel formulation structure, the flower extract was prepared in a solvent-based manner. This involved employing a standardized ratio of 2:10 parts of previously dehydrated Jamaica calyx to distilled water and allowing for a 24-h extraction period. After the designated incubation time, the heterogeneous mixture was subjected to filtration and lyophilization processes.
2.8 Addition of Jamaica flower extract into the hydrogel
Despite the absence of any alcohol remnants in the obtained extract, the addition of Jamaica flower extract directly to the hydrogel solution was precluded due to its pH. Consequently, the hydrogel was introduced into a dilution of 50 mg/mL with the Jamaica extract for 5 h. This approach was employed considering the maximum swelling properties of the hydrogels while ensuring precautionary measures against degradation prompted by the pH of the extract.
2.9 Minimum inhibitory concentration of Jamaica flower extract
The minimum inhibitory concentration (MIC) value was determined following the protocol outlined by Wiegand et al. (Wiegand et al., 2008), employing a bacteria concentration of 1.5E+08 CFU/mL in a Mueller-Hilton (MH) medium, E. coli ATCC 25922 and S. aureus ATCC 25923. These pathogens were selected based on their prevalence in cutaneous wound bacterial infections. The pathogen solution was added to a 96-well plate template, with the medium serving as a negative control, considering eight escalating extract concentrations (10, 20, 40, 60, 80, 100, 150, and 200 mg/mL) included, along with positive gentamicin control concentrations of 0.12, 0.5, and 1 μg/mL for S. aureus. Gentamicin concentrations of 0.25, 0.5, and 1 μg/mL, as per the established manual of the Clinical and Laboratory Standards Institute (CLSI) (Weinstein and Clinical and Laboratory Standards Institute, 2021), were considered for MIC determination using the specified strains and gentamicin as the antibiotic reference. The absorbance analysis was conducted after 20 h of incubation at 37°C, utilizing the OD at 570 nm of the ELx8081IU spectrophotometer by Biotek Instruments. To validate the results obtained through absorbance measurements, 30 μL of resazurin were added to each well of the 96-well plate to identify the minimum bactericidal concentration (MBC) value. This was determined by observing the initial purple color change of the resazurin after 15 min of the chemical reaction (Wiegand et al., 2008; Elshikh et al., 2016).
2.10 Evaluation of the bacterial initial adhesion of the hydrogel surfaces
To assess the anti-fouling properties of each hydrogel, a bacteria adhesion methodology was developed in collaboration with the Institute of Microbiology at Universidad San Francisco de Quito (IM-USFQ), as previously described (Rodríguez et al., 2022). Briefly, the protocol commenced with a 24-h incubation of a bacterial culture at 37 C in MH agar medium, aiming to optimize bacterial initial adhesion of E. coli ATCC 25922 and S. aureus ATCC 25923. Subsequently, a bacteria dilution was prepared using 30 mL of the medium, incorporating bacterial colonies until reaching a concentration of 1E+09 CFU/mL for bacterial inoculum (Rodríguez et al., 2022). In 6-well plate templates, 3 mL of the bacteria solution was added to each well, along with coverslips, encompassing reference materials such as commercial cellulose hydrogel, F1, and F1+J.ext. hydrogels. To simulate the initial contamination of a wound, the templates were incubated at 37 °C for 30 min. Subsequently, the surfaces were washed once with 3 mL of PBS and transferred to a Falcon tube containing 15 mL of PBS, which was mixed for 5 min at maximum velocity using a vortex dispersing the initial adhered bacteria from the surface samples. After the dispersion step, a 100 μL aliquot was extracted from the Falcon tube and placed on a coverslip, following the procedure outlined in the work of Rodríguez et al. (Rodríguez et al., 2022), to determine the cells/cm2 adhesion on each surface, the coverslips were stained with crystal violet (0.01 M) for 1 min and observed under a microscope, considering 15 central fields.
2.11 Time-kill kinetics of hydrogels with plant extract
The antimicrobial activity of hydrogels containing Jamaica extract was assessed in terms of bacterial growth inhibition over time with optical density measurements taken during 24 h (Zamora-Mendoza et al., 2023; Guamba et al., 2023). S. aureus ATCC 25923 and E. coli ATCC 25922 bacteria, sourced from the collection of the IM-USFQ, were employed for the study. Two hydrogel treatments were evaluated: one without the extract (F1) and another with Jamaica extract (F1+J. ext.). included a positive control, consisting of the medium and the pathogen. These treatments were placed in 96-well plates, and 100 µL of an initial bacterial concentration of 1E+05 CFU/mL was added to the MH broth medium. Subsequently, absorbance was measured at 0, 3, 6, and 24 h at 570 nm, following the methodology outlined in prior studies (Atiencia et al., 2022; Cabezas et al., 2023).
3 Results, interpretation, and discussion
3.1 Characterization of fibers
The Fourier transform infrared (FTIR) was carried out to verify the successful separation of other residual components, such as lignin and hemicellulose, from the extracted cellulose.
FTIR spectra of all-natural cellulose particles are shown in Figure 2. All samples showed two central absorbance regions. The first one with large wavenumbers in a range of 2,700 cm−1 to 3,500 cm−1, and the second with lower wavenumbers in a range of 500 cm−1 to 1800 cm−1. The spectra exhibited characteristic peaks and absorption bands similar to commercial cellulose, which have individual and specific functionalities. One is the strong absorption band in the 1,635 cm−1 region, corresponding to the stretching vibration O-H of the water molecules absorbed in the cellulose structure (Khan et al., 2020). Other absorbance bands at 896 cm−1 correspond to the glycosidic bonds between monosaccharide units in cellulose molecules. Also, the bands located at 1,056 cm−1 and 3,437 cm−1 are attributed to the C-O-C stretching of the pyranose ring and the stretching O-H of the hydroxyl groups in the cellulose structure. Additionally, essential peaks are evident at ∼1,300 cm−1, ∼2,900 cm−1, and ∼3,300 cm−1, which correspond to rocking vibrations at C6, OH bending, and sp3 C-H stretching, respectively.
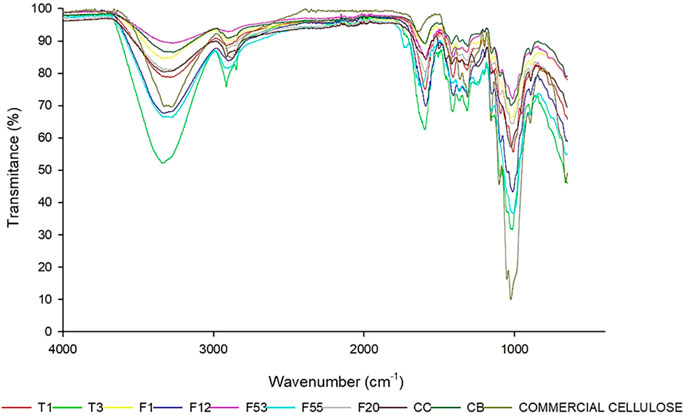
FIGURE 2. Fourier Transform Infrared Spectroscopy spectra of nine cellulose particles compared with commercial cellulose. T1, T3, F1, F12, F20, F53, F55,F20, CB, CC, and commercial cellulose.
The commercial cellulose was used as a control to compare the FTIR bands of extracted cellulose. All samples showed a similar pattern to the commercial cellulose control, except for the low-intensity transmittance band at 1742 cm−1 in sample F55 which is associated with C = O stretching vibration due to the presence of the small amount of residual lignin and acetyl or uronic ester groups of hemicellulose as shown in Figure 2.
X-ray powder diffraction (XRD) is an analytical technique used mainly for the phase identification of a crystalline material and its physical and chemical properties. X-ray diffraction (XRD) tests on the nine cellulose samples depicted distinct graphs and different degrees of crystallinity (Figure 3). All the XRD patterns indicated the presence of two major peaks. The first prominent peak around 2θ = 22° represents the crystalline structure of cellulose, and the peaks around 2θ = 18° represent the amorphous structure of the samples (Rambo and Ferreira, 2015).
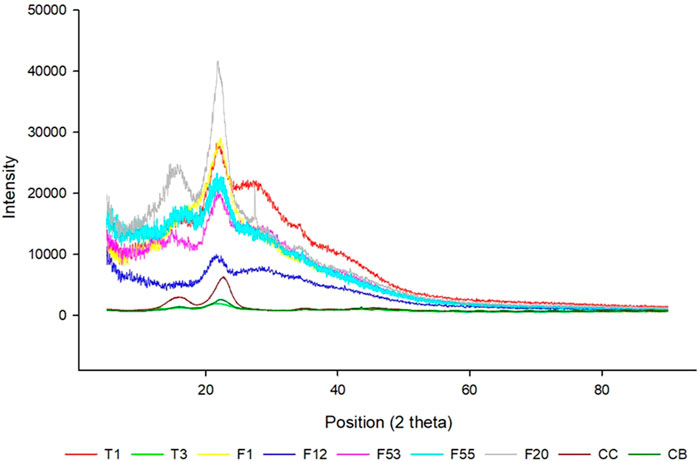
FIGURE 3. X-Ray diffraction analysis patterns of nine cellulose fibers: T1, T3, F1, F12, F20, F53, F55, F12, CB, and CC.
The difference between the X-ray diffraction patterns can occur due to the nature of the samples and how they are prepared, which will influence the crystallinity index (Park et al., 2010). However, the extraction and process of cellulose used the same protocol, and the method to prepare the sample for XRD was also the same procedure. Therefore, it is expected that the differential crystallinity index is due to the different origins of cellulose. The results showed a variation of the index of crystallinity from 28% to 69% demonstrating that some of the cellulose particles are more amorphous than others (Table 2).
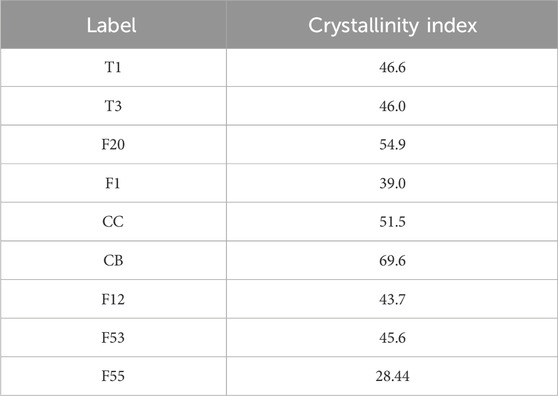
TABLE 2. The crystallinity index of cellulose samples.
The morphology and topography of the nine cellulose particles were analyzed by scanning electron micrographs displayed in Figure 4. Each cellulose sample has a distinct shape determined by the plant source. The external structure of the samples T1, T3, F53, F55, F12, CC, and CB demonstrated an irregular surface that exhibits roughness. In particular, some of these appeared to be irregular fiber fragments and also showed a network structure. There is also a more evident degree of porosity in some of this cellulose. The morphology of the particles F1 and F20 have a more elongated and compact structure.
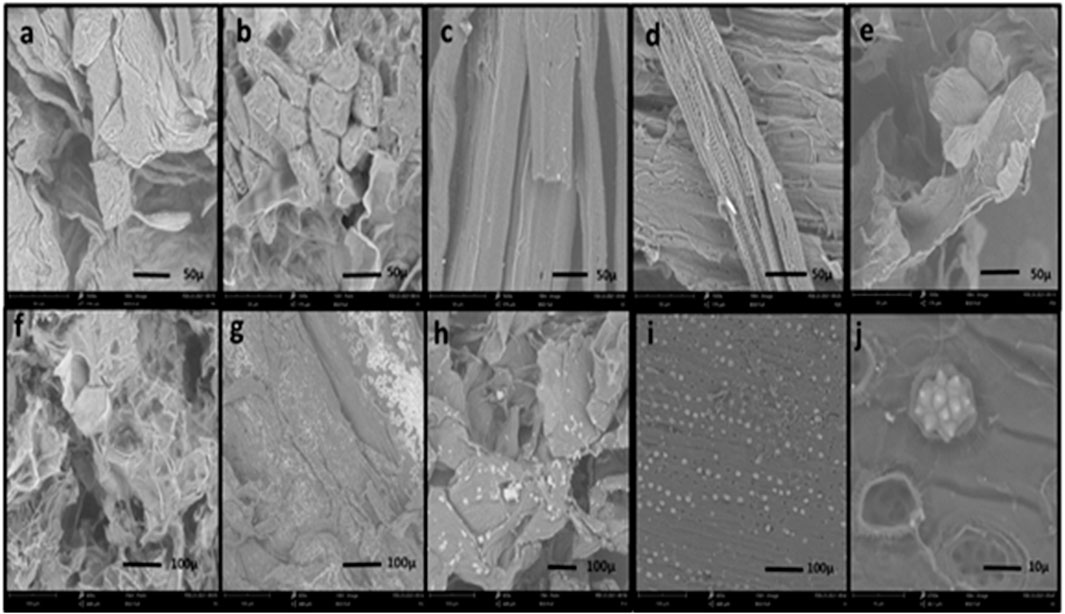
FIGURE 4. Scanning electron microscope (SEM) analysis of cellulose particles: (A) T1, (B) T3, (C) F1, (D) F20, (E) F53, (F) F55, (G) F12, (H) CB, (I) CC, and (J) special structure in CC.
3.2 Bactericide evaluation of cellulose particles
A qualitative assay was performed with E. coli TG1. For this test, three amounts of each cellulose sample were placed on the agar plate: 1, 5, and 10 mg. Each plate was divided into four parts: 1 mg of the sample was placed in space number one. In space number two, the antibiotic was placed as a positive control; in space three, 5 mg of the sample was placed; finally, 10 mg of the cellulose sample was placed in space four. The process was repeated twice for each cellulose sample, and then all plates were incubated at 37 C for 24 h. As shown in Figure 5, a negative response was obtained for the test; there was no inhibition against E. coli TG1. The results demonstrated that cellulose particles do not have bactericide properties.
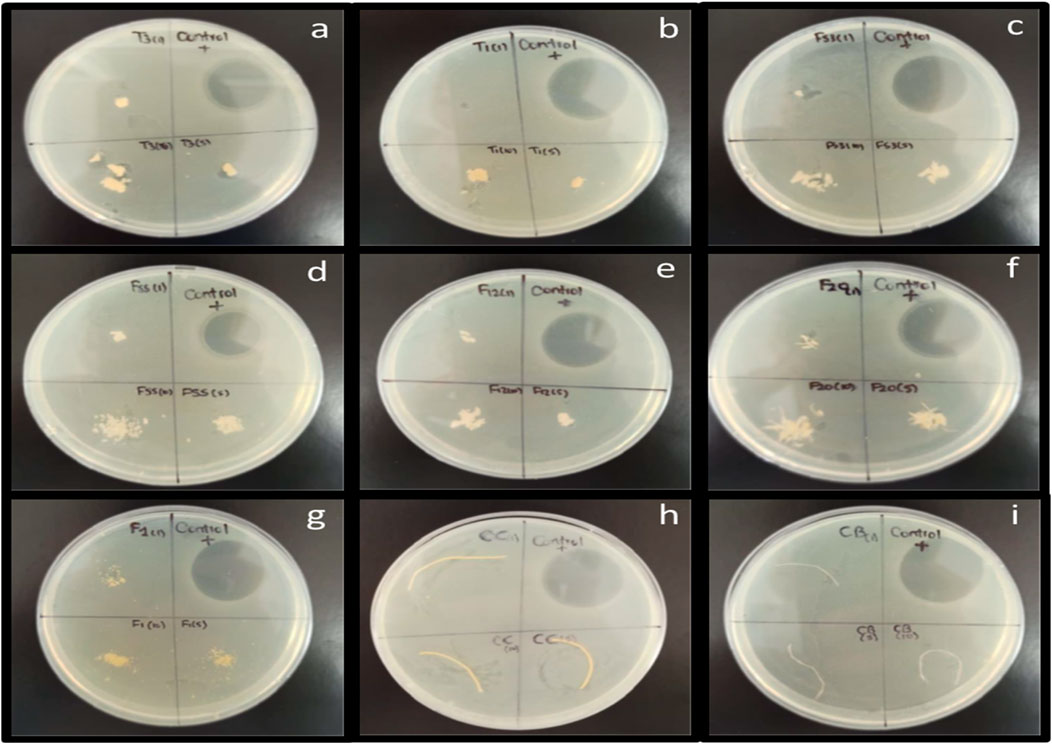
FIGURE 5. Antibacterial test against E.coli TG1 strain with the seven powdered cellulose: (A) T3, (B) T1, (C) F53, (D) F55, (E) F12, (F) F20, (G) F1, and two cellulose particles (H) CC and (I) CB.
Moreover, a quantitative assay was performed to determine the antibacterial activity of the cellulose against both E.coli ATCC 25922 and TG1 strains to measure the bacterial growth rate in solution. All the bacterial suspensions started with the same concentration of bacteria (1E+05 CFU/mL), and then optical density measurements were made at 600 nm at 0, 3, 6, and 24 h for each cellulose sample. Two independent experiments were performed for each cellulose; the reported values correspond to the two experiments’ mean. The bacterial growth of E. coli with each cellulose sample was compared with the E. coli cultures with ampicillin (positive control) and without ampicillin (negative control).
At different times, the mean absorbance values of the cultures with the cellulose particles against the E. coli ATCC 25922 were recorded. The results in Figure 6 show that cellulose particles F1, F12, CC, T3, T1, F53, F55, F20, and CB had a similar tendency and decreased bacterial growth compared to the negative control. It is important to note that 3 h after the initial time, this cellulose had a remarkable decrease in absorbance values, unlike the negative control, and although as the culture time increased, the absorbance increased, after 24 h, the particles had a bacterial growth minor than the negative control so demonstrating the bacterial growth inhibition. The cellulose CC had a different tendency since the growth was similar to the negative control. According to the absorbance values obtained against E. coli ATCC 25922, there is a decrease in the bacterial suspension with most celluloses in each time interval compared to the negative control, which did not contain any antimicrobial agent. However, the absorbance values of antibiotic control were always lower.
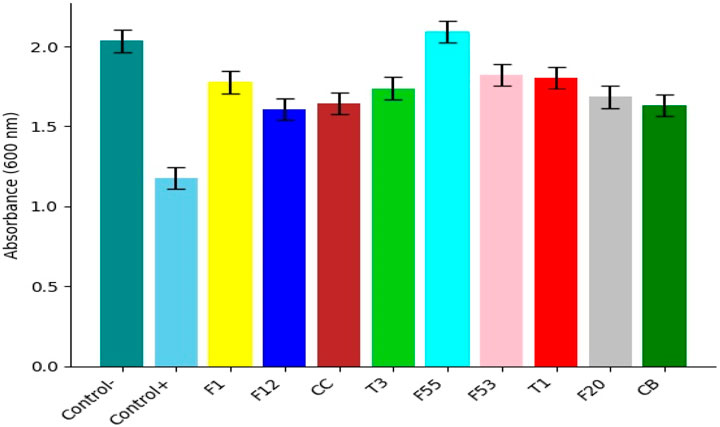
FIGURE 6. Bacterial growth with cellulose particles against E. coli ATCC 25922. In the graph, the growth of the bacteria with almost all celluloses is lower than the negative control. The growth rate with cellulose CC was similar to the negative control.
The mean absorbance values of the cultures with the cellulose particles against E. coli TG1 are shown in Figure 7. In this case, the particles that had significantly decreased growth at 24 h when compared to the negative control were F12,F53,T3,F55, T1 and CB. The rest of the particles had a similar tendency to the negative control, while F20 presented an increase in its growth rate.
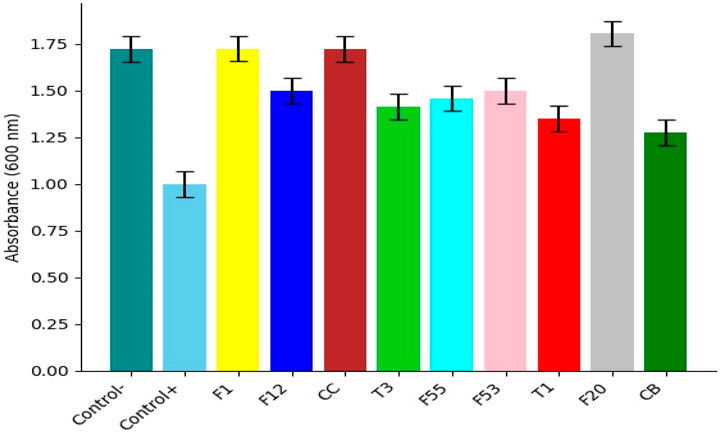
FIGURE 7. Bacterial growth with cellulose particles against E. coli TG1. In observing the graph, the bacterial growth with cellulose F12 and F53 was the most different from the negative control without the antibiotic.
The specific growth rate (k) from the two experiments with both bacteria strains with the different cellulose samples was calculated using the Malthusian growth equation (Supplementary Appendix SA). This parameter k is essential since it represents microorganisms’ dynamic growth and allows determining which treatment with cellulose particles grows with more or less intensity.
It was verified that the data followed a normal distribution with the Shapiro-Wilks and the Kolmogorov-Smirnov test (Supplementary Appendix SB). The ANOVA test results allowed us to compare the means of the specific growth rates of each cellulose sample to establish if there was a difference. Accept or reject the null hypothesis that states no differences between the means of the different groups. Considering the p-value (<0.05) obtained from the ANOVA test for the E. coli ATCC25922 and TG1 strains (Supplementary Appendix SC), it can be concluded that there is a significant difference between all cellulose samples.
Duncan’s test is a multiple comparison test that compares the means obtained after rejecting the null hypothesis of equality of means using the ANOVA technique. The results obtained for this test classified all the samples. Duncan’s distribution for the cellulose samples against both bacterial strains showed a highly significant difference between the cellulose particles being consistent with the experiment results (Supplementary Appendix SD).
Based on the absorbance data presented in Figure 8, the initial concentration added to the bacterial culture (10 mg/mL) demonstrated no inhibition for both bacterial growth. However, the inhibitory effect of the Jamaica flower extract becomes apparent from 20 mg/mL, with the highest inhibitory capacity observed at 40 mg/mL for S. aureus and 60 mg/mL for E. coli, reaching its maximum efficacy at 100 mg/mL. Furthermore, employing the resazurin indicator, the obtained MBC values against each studied bacterium were 40 and 60 mg/mL for S. aureus and E. coli, respectively.
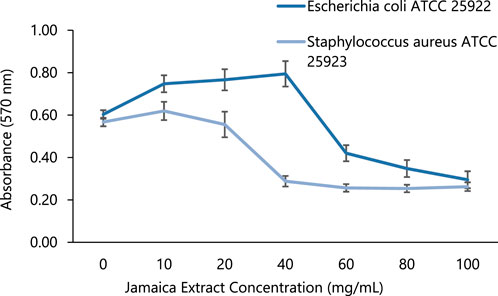
FIGURE 8. Bacterial growth inhibition analysis of Jamaica flower extract in different concentrations.
Based on Guamba et al. (Guamba et al., 2023), commercial cellulose fibers and hydrogels were fully characterized and do not exhibit antimicrobial and antifouling properties against E. coli. Nevertheless, commercial cellulose hydrogels demonstrate some antifouling properties against both gram-positive. In this context, the commercial cellulose hydrogel was employed as a control in the adhesion test.Further evaluation was realized by different materials on the bacterial initial adhesion into the hydrogel surfaces when compared to glass, as shown in Figure 9. According to the reference materials, the glass coverslip exhibited minimal bacterial adhesion for each bacterium. In contrast, the hydrogel formulated with commercial cellulose demonstrated the highest adhesion for E. coli, while showing a similar bacterial initial adhesion for S. aureus when compared to the natural cellulose hydrogel F1 with values of 2.12 and 2.08 E+05 (cells/cm2), respectively. On the other hand, the incorporation of Jamaica flower extract into the hydrogel matrix significantly reduced the bacterial initial adhesion for both Gram-negative (E. coli) and positive (S. aureus) bacteria with adhesion levels comparable to the reference glass surface and surpassing the microbial adhesion inhibition recently reported by Rodríguez-Arias and colleagues (Rodríguez et al., 2022).
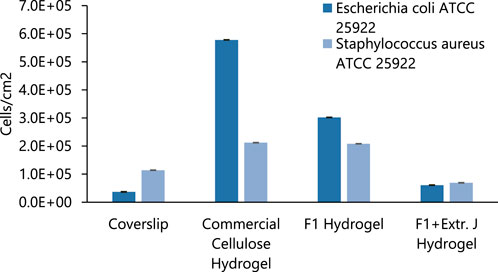
FIGURE 9. Initial bacteria adhesion of different materials (glass and hydrogel surfaces).
Finally, when evaluating the bacterial growth inhibition by F1 and F1 with Jamaica flower extract (F1+J.ext.) hydrogels, both hydrogels successfully inhibited E. coli and S. aureus growth at 24 h in comparison to the positive control (Figure 10). The positive control exhibited an average absorption of 0.661 and 0.164 nm for E. coli ATCC 25922 and S. aureus ATCC 25923, respectively. However, the average absorption of S. aureus ATCC 25923 for the F1 fiber hydrogel was similar to the positive control (0.128 vs. 0.164, respectively). Therefore, the overall results demonstrated an effective antibacterial property of the natural cellulose hydrogel against the Gram-negative pathogen but a lack of efficacy for the Gram-positive bacteria. On the other hand, the measured absorption reported for the F1+J.ext. hydrogel was close to the initial absorption for each bacterium (0.025 nm), more exactly a final absorption of 0.026 nm for E. coli ATCC 25922 and 0.029 nm for S. aureus ATCC 25923. This indicates a successful antibacterial activity of the natural cellulose hydrogel and the Jamaica flower extract in conjunction, even when the extract concentration was minimal against each pathogen based on the MIC analysis. These results revealed a high antimicrobial activity and applicability on future biomedical applications, as previously observed in the recent study of Zamora et al. (Zamora-Mendoza et al., 2023)
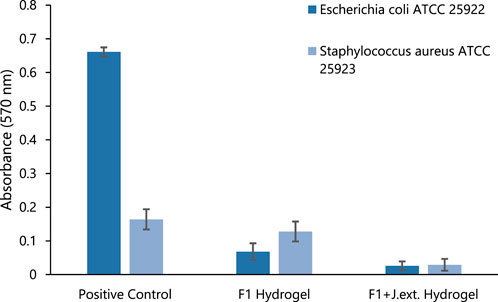
FIGURE 10. Bacterial growth with hydrogel against E. coli ATCC 25922 and Staphylococcus aureus ATCC 25923. Positive control, hydrogel F1 treatment, and hydrogel F1 treatment with Jamaica extract (F1+J.ext.).
4 Conclusion
In this work, nine particles were successfully extracted from Ecuadorian plants with an established chemical protocol. The nine cellulose particles were characterized by FTIR, XRD, and SEM analyses. FTIR confirmed the effective removal of non-cellulosic material and cellulose extraction with a good purity level. XRD analysis verified a high degree of crystallinity in the samples, up to 69.6%. X-ray diffractograms showed that some samples, like CC and CB, were more crystalline than other samples, like F55, due to the natural source of each cellulose. SEM microscopy displayed unique characteristics of nine particles, like morphology, porosity, and size depending on the native origin, giving them distinctive features.
Antibacterial tests were performed with two strains, E. coli ATCC25922 and TG1, for 24 h to measure the bacterial growth rate in the presence of nine different cellulose fibers. Bacterial growth with cellulose F1, F12, F53, T1, T3, and CC was lower than that of the negative control with both strains of E. coli. Furthermore, cellulose F1 and F53 presented an inhibition similar to the antibiotic control, while F55 and F20 showed higher growth than the negative control. The bacterial growth rate of F1 at pH 7 exhibited the greatest inhibition.
The results were validated using the Malthusian growth equation and the growth rates of each cellulose particle. The highest growth rate was 0.1543, and the lowest was 0.1314, with E. coli ATCC 25922. The ANOVA and Duncan tests showed differences between the samples, obtaining that cellulose F1 and F53 had the best performance. Therefore, the F1 and F53 cellulose have great potential as a biomaterial. Further antimicrobial evaluation demonstrated that Jamaica flower extract possesses MIC and MBC values of 40 mg/mL for S. aureus and 60 mg/mL for E. coli. When combined with F1 hydrogel, hydrogel F1 treatment with Jamaica flower extract evidenced the lowest bacterial initial adhesion levels and the highest bacterial growth inhibition. Overall results showed the most optimal and appropriate choice of F1 and Jamaica flower extract for further evaluation and a deeper investigation in biomedical applications. (Chauviere et al., 1992; Schierholz and Beuth, 2001; Tokiwa et al., 2009; Weerasekera M. M. et al., 2016; Weerasekera M. et al., 2016; Arciola et al., 2018; Han et al., 2018; Boukir et al., 2019; Sahar et al., 2020; Castro et al., 2022; Senthilrajan et al., 2022).
Data availability statement
The original contributions presented in the study are included in the article/Supplementary Material, further inquiries can be directed to the corresponding authors.
Ethics statement
Ethical approval was not required for the studies on humans in accordance with the local legislation and institutional requirements because only commercially available established cell lines were used.
Author contributions
KM: Data curation, Investigation, Methodology, Writing–original draft, Writing–review and editing. AP: Conceptualization, Data curation, Methodology, Writing–original draft, Writing–review and editing, Investigation. TI-G: Data curation, Investigation, Methodology, Writing–review and editing. DC: Data curation, Investigation, Methodology, Writing–review and editing. CG: Data curation, Investigation, Methodology, Writing–review and editing. AG: Data curation, Investigation, Methodology, Writing–review and editing. NV: Data curation, Investigation, Methodology, Writing–original draft. AM: Data curation, Investigation, Methodology, Writing–original draft, Supervision, Validation, Writing–review and editing. CL: Investigation, Methodology, Writing–review and editing. FA: Methodology, Writing–review and editing, Conceptualization, Data curation, Project administration, Supervision, Writing–original draft.
Funding
The author(s) declare that no financial support was received for the research, authorship, and/or publication of this article.
Conflict of interest
The authors declare that the research was conducted in the absence of any commercial or financial relationships that could be construed as a potential conflict of interest.
Publisher’s note
All claims expressed in this article are solely those of the authors and do not necessarily represent those of their affiliated organizations, or those of the publisher, the editors and the reviewers. Any product that may be evaluated in this article, or claim that may be made by its manufacturer, is not guaranteed or endorsed by the publisher.
Supplementary material
The Supplementary Material for this article can be found online at: https://www.frontiersin.org/articles/10.3389/frsfm.2024.1362677/full#supplementary-material
References
Alarfaj, A., Lee, H. H. C., Munusamy, M. A., Ling, Q. D., Kumar, S., Chang, Y., et al. (2016). Development of biomaterial surfaces with and without microbial nano segments. J. Polym. Eng. 36, 1–12. doi:10.1515/polyeng-2015-0046
Arciola, C., Campoccia, D., and Montanaro, L. (2018). Implant infections: adhesion, biofilm formation and immune evasion. Nat. Rev. Microbiol. 16 (7), 397–409. doi:10.1038/s41579-018-0019-y
Atiencia, M., Cabezas, F., Vizuete, K., Debut, A., Tejera, E., and Machado, A. (2022). Evaluation of the biofilm life cycle between Candida albicans and Candida tropicalis. Front. Cell Infect. Microbiol. 12. 1155 doi:10.3389/fcimb.2022.953168
Boukir, A., Fellak, S., and Doumenq, P. (2019). Structural characterization of Argania spinosa Moroccan wooden artifacts during natural degradation progress using infrared spectroscopy (ATR-FTIR) and X-Ray diffraction (XRD). Heliyon 5 (9), e02477. doi:10.1016/j.heliyon.2019.e02477
Cabezas, F., Atiencia-Carrera, M. B., Villacrés-Granda, I., Proaño, A. A., Debut, A., Vizuete, K., et al. (2023). Evaluation of the polyphenolic profile of native Ecuadorian stingless bee honeys (Tribe: meliponini) and their antibiofilm activity on susceptible and multidrug-resistant pathogens: an exploratory analysis. Curr. Res. Food Sci. 7, 100543. doi:10.1016/j.crfs.2023.100543
Cangui, S., Ñacato-Toapanta, A. L., Enríquez-Martínez, L. J., Salinas-Delgado, G. A., Reyes, J., et al. (2023). Battle royale: immune response on biofilms – host-pathogen interactions. Curr. Res. Immunol. 4. 100057 doi:10.1016/j.crimmu.2023.100057
Cangui, S., Ñacato, A., Enríquez, L., Reyes, J., Garzon, D., and Machado, A. (2022). Biofilm-forming microorganisms causing hospital-acquired infections from intravenous catheter: a systematic review. Curr. Res. Microb. Sci. 3 (Jan), 100175. doi:10.1016/j.crmicr.2022.100175
Castro, J., Lima, Â., Sousa, L. G. V., Rosca, A. S., Muzny, C. A., and Cerca, N. (2022). Crystal violet staining alone is not adequate to assess synergism or antagonism in multi-species biofilms of bacteria associated with bacterial vaginosis. Front. Cell Infect. Microbiol. 11, 795797. doi:10.3389/fcimb.2021.795797
Chauviere, G., Coconnier, M. H., Kerneis, S., Fourniat, J., and Servin, A. L. (1992). Adhesion of human lactobacillus acidophilus strain LB to human enterocyte-like Caco-2 cells. J. Gen. Microbiol. 138 (8), 1689–1696. doi:10.1099/00221287-138-8-1689
Elshikh, M., Ahmed, S., Funston, S., Dunlop, P., McGaw, M., Marchant, R., et al. (2016). Resazurin-based 96-well plate microdilution method for the determination of minimum inhibitory concentration of biosurfactants. Biotechnol. Lett. 38 (6), 1015–1019. doi:10.1007/s10529-016-2079-2
Guamba, E., Vispo, N. S., Whitehead, D. C., Singh, A. K., Santos-Oliveira, R., Niebieskikwiat, D., et al. (2023). Cellulose-based hydrogels towards an antibacterial wound dressing. Biomaterial Science, 11, 3461, doi:10.1039/D2BM01369J
Han, W., Jiao, H., and Fox, D. (2018). “Scanning electron microscopy,” in Springer tracts in modern physics Amsterdam, Netherlands (Elsevier Inc).
Hasan, J., Crawford, R., and Ivanova, E. (2013). Antibacterial surfaces: the quest for a new generation of biomaterials. Trends Biotechnol. 31 (5), 295–304. doi:10.1016/j.tibtech.2013.01.017
Khan, M., Rehman, N., Sharif, A., Ahmed, E., Farooqi, Z., and Din, M. (2020). Environmentally benign extraction of cellulose from dunchi fiber for nanocellulose fabrication. Int. J. Biol. Macromol. 153, 72–78. doi:10.1016/j.ijbiomac.2020.02.333
Khatoon, Z., McTiernan, C., Suuronen, E., Mah, T., and Alarcon, E. (2018). Bacterial biofilm formation on implantable devices and approaches to its treatment and prevention. Heliyon 4 (12), e01067. doi:10.1016/j.heliyon.2018.e01067
Machado, A., Zamora, L., Alexis, F., and Álvarez, J. M. (2023). Use of plant extracts, bee-derived products, and probiotic-related applications to fight multidrug-resistant pathogens in the post-antibiotic era. Future Pharmacol. 3 (3), 535–567. doi:10.3390/futurepharmacol3030034
Muñoz, A., Cabezas, F., Tejera, E., and Machado, A. (2021). Comparative effectiveness of treatments for bacterial vaginosis: a network meta-analysis. Antibiotics 10 (8), 978. doi:10.3390/antibiotics10080978
Park, S., Baker, J., Himmel, M., Parilla, P., and Johnson, D. (2010). Cellulose crystallinity index: measurement techniques and their impact on interpreting cellulase performance. Biotechnol. Biofuels 3, 10. doi:10.1186/1754-6834-3-10
Rambo, M., and Ferreira, M. (2015). Determination of cellulose crystallinity of banana residues using near-infrared spectroscopy and multivariate analysis. J Braz Chem Soc, 26, 1491, doi:10.5935/0103-5053.20150118
Rodríguez, R., Guachi, B., Montalvo, D., and Machado, A. (2022). Lactobacilli displacement and Candida albicans inhibition on initial adhesion assays: a probiotic analysis. BMC Res. Notes 15 (1), 239. doi:10.1186/s13104-022-06114-z
Sahar, D., Hoorieh, D., Farzaneh, N., and Malak, H. (2020). Characterization and the evaluation of antimicrobial activities of silver nanoparticles biosynthesized from Carya illinoinensis leaf extract. Heliyon 6 (3), e03624. doi:10.1016/j.heliyon.2020.e03624
Schierholz, J., and Beuth, J. (2001). Implant infections: a haven for opportunistic bacteria. J. Hosp. Infect. 49 (2), 87–93. doi:10.1053/jhin.2001.1052
Senthilrajan, S., Venkateshwaran, N., Naresh, K., Velmurugan, R., and Gupta, N. K. (2022). Effects of jute fiber length and weight percentage on quasi-static flexural and dynamic mechanical properties of jute/polyester composites for thin-walled structure applications. Thin-Walled Struct. 179, 109719. doi:10.1016/j.tws.2022.109719
Tokiwa, Y., Calabia, B., Ugwu, C., and Aiba, S. (2009). Biodegradability of plastics. Int. J. Mol. Sci. 10 (9), 3722–3742. doi:10.3390/ijms10093722
Weerasekera, M., Wijesinghe, G. K., Jayarathna, T. A., Gunasekara, C. P., Fernando, N., Kottegoda, N., et al. (2016). Culture media profoundly affect Candida albicans and Candida tropicalis growth, adhesion and biofilm development. Mem. Inst. Oswaldo Cruz 111 (11), 697–702. doi:10.1590/0074-02760160294
Weinstein, M. P., and Clinical and Laboratory Standards Institute, (2021). Performance standards for antimicrobial susceptibility testing, Clinical and Laboratory Standards Institute, Wayne, PS, USA
Wiegand, I., Hilpert, K., and Hancock, R. E. W. (2008). Agar and broth dilution methods to determine the minimal inhibitory concentration (MIC) of antimicrobial substances. Nat. Protoc. 3 (2), 163–175. doi:10.1038/nprot.2007.521
Zamora, L., Guamba, E., Miño, K., Romero, M. P., Levoyer, A., Alvarez-Barreto, J. F., et al. (2022). Antimicrobial properties of plant fibers. Molecules, 27, 999 doi:10.3390/molecules27227999
Keywords: cellulose, antibacterial, fiber, plant, biodiversity, antifouling
Citation: Miño K, Pérez A, Iza-García TX, Cabascango DG, Gordillo C, Gordillo A, Vispo N, Machado A, Zamora-Ledezma C and Alexis F (2024) Antimicrobial cellulose hydrogels against gram-positive and gram-negative bacteria. Front. Soft Matter 4:1362677. doi: 10.3389/frsfm.2024.1362677
Received: 28 December 2023; Accepted: 01 February 2024;
Published: 23 February 2024.
Edited by:
Hui Jie Zhang, Shaanxi University of Science and Technology, ChinaReviewed by:
Anne-laure Fameau, Institut National de recherche pour l’agriculture, l’alimentation et l’environment (INRAE), FranceMarcel Krzan, Jerzy Haber Institute of Catalysis and Surface Chemistry, Poland
Copyright © 2024 Miño, Pérez, Iza-García, Cabascango, Gordillo, Gordillo, Vispo, Machado, Zamora-Ledezma and Alexis. This is an open-access article distributed under the terms of the Creative Commons Attribution License (CC BY). The use, distribution or reproduction in other forums is permitted, provided the original author(s) and the copyright owner(s) are credited and that the original publication in this journal is cited, in accordance with accepted academic practice. No use, distribution or reproduction is permitted which does not comply with these terms.
*Correspondence: António Machado, amachado@usfq.edu.ec; Frank Alexis, falexis@usfq.edu.ec