Using terrestrial laser scanning to evaluate non-destructive aboveground biomass allometries in diverse Northern California forests
 Paris Krause1
  Brieanne Forbes1
  Alexander Barajas-Ritchie1†
  Matthew Clark2,3
  Mathias Disney4,5
  Phil Wilkes4,5
  Lisa Patrick Bentley1*
- 1Department of Biology, Sonoma State University, Rohnert Park, CA, United States
- 2Department of Geography, Environment and Planning, Sonoma State University, Rohnert Park, CA, United States
- 3Center for Interdisciplinary Geospatial Research, Sonoma State University, Rohnert Park, CA, United States
- 4Department of Geography, University College London, London, United Kingdom
- 5NERC National Centre for Earth Observation, University College London, London, United Kingdom
A crucial part of carbon accounting is quantifying a tree’s aboveground biomass (AGB) using allometric equations, but species-specific equations are limited because data to inform these equations requires destructive harvesting of many trees which is difficult and time-consuming. Here, we used terrestrial laser scanning (TLS) to non-destructively estimate AGB for 282 trees from 5 species at 3 locations in Northern California using stem and branch volume estimates from quantitative structure models (QSMs) and wood density from the literature. We then compared TLS QSM estimates of AGB with published allometric equations and used TLS-based AGB, diameter at breast height (DBH), and height to derive new species-specific allometric AGB equations for our study species. To validate the use of TLS, we used traditional forestry approaches to collect DBH (n = 550) and height (n = 291) data on individual trees. TLS-based DBH and height were not significantly different from field inventory data (R2 = 0.98 for DBH, R2 = 0.95 for height). Across all species, AGB calculated from TLS QSM volumes were approximately 30% greater than AGB estimates using published Forest Service’s Forest Inventory and Analysis Program equations, and TLS QSM AGB estimates were 10% greater than AGB calculated with existing equations, although this variation was species-dependent. In particular, TLS AGB estimates for Quercus agrifolia and Sequoia sempervirens differed the most from AGB estimates calculated using published equations. New allometric equations created using TLS data with DBH and height performed better than equations that only included DBH and matched most closely with AGB estimates generated from QSMs. Our results support the use of TLS as a method to rapidly estimate height, DBH, and AGB of multiple trees at a plot-level when species are identified and wood density is known. In addition, the creation of new TLS-based non-destructive allometric equations for our 5 study species may have important applications and implications for carbon quantification over larger spatial scales, especially since our equations estimated greater AGB than previous approaches.
1 Introduction
Globally, forested ecosystems store more carbon both above- and below-ground than any other terrestrial sink, making climate-smart forest management an important strategy to mitigate excess anthropogenic carbon production (Canadell and Schulze, 2014). Unfortunately, the specific drivers that promote long-term carbon storage and improve forest health are often challenging and complicated to identify without accurate data related to the size of trees (Pugh et al., 2018). In addition, traditional forestry-based survey approaches (i.e., hand-measured data or non-remote sensing data) to estimate aboveground size of trees (aboveground biomass, or AGB) may be inaccurate for a large percentage of species due to a lack of availability of destructive harvest data (Burt et al., 2020). In Northern California, an area of high regional species diversity, it is unknown how much error is introduced into AGB estimates when using general equations based on diameter at breast height (DBH) and height data that originate from outside the study area and are not locally calibrated. Due to the increased prevalence of drought and wildfire in Northern California and the need to accurately estimate carbon in trees, there is a need to focus on: 1) improving the quantification of AGB for tree species in this region, and 2) determining if there is a more efficient and accurate method to estimate AGB than traditional approaches based on destructive sampling.
Terrestrial Laser Scanning (TLS), which can measure three-dimensional (3D) structure to millimeter accuracy and precision at plot (e.g., 100–1,000 m2) scales (Disney et al., 2018), can be a solution to these needs. In forests, TLS has been shown to be more accurate than traditional field methods for sampling forest structure (Hudak et al., 2009; Calders et al., 2015a; Kelly and Di Tommaso, 2015; Liang et al., 2016; de Tanago et al., 2018; Stovall et al., 2018). Although there are relatively few papers related to the use of TLS to estimate AGB (reviewed in Liang et al., 2016), AGB estimates from TLS have been found to strongly correlate with estimates from destructive sampling. Calders et al. (2015a) found that TLS AGB estimates highly correlated with AGB from destructive sampling (R2 = 0.98), with an overestimation of 9.7%; in contrast, AGB derived from allometric equations had a lower correlation with reference biomass samples (R2 = 0.68–0.78) and underestimation of 36.6%–29.9%. The study also found AGB error with allometric equations to increase exponentially with increasing DBH, whereas TLS error was DBH independent. Since the detailed 3D data generated from TLS can be rapid, non-destructive, and automated with high precision, TLS data can be used to update general allometric equations or establish specific equations for a geographic region (Liang et al., 2016; Lau et al., 2018; Demol et al., 2022).
To estimate AGB from TLS data, automated algorithms and Quantitative Structure Models (QSMs) are often used (Calders et al., 2015a; Lau et al., 2018; Stovall et al., 2018; Lau et al., 2019; Momo Takoudjou et al., 2018; de Tanago et al., 2018; Malhi et al., 2018; Disney et al., 2020). QSMs are a set of hierarchically structured cylinders that can be fitted to TLS point clouds to estimate the volume of trunk (stem) and branches of the tree, and calculate a total (Raumonen et al., 2013; Calders et al., 2015a; Calders et al., 2015b). Stovall et al. (2018) found that TLS stem volume modeling via QSMs was an appropriate method of non-destructive allometric equation development and reducing uncertainty in tree-level AGB estimates. Similarly, Disney et al. (2020) found QSMs of Sequoia sempervirens (redwood) to agree with AGB estimates derived from detailed manual measurements within 2% AGB from values from allometric equations, with no change in regression slope.
In light of the need for non-destructive, accurate estimates of carbon for species specific to Northern California regions, we used TLS to non-destructively estimate AGB for 282 trees from 5 species at 3 locations using stem and branch volume estimates from quantitative structure models (QSMs) and wood density from the literature. We aimed to determine if estimates of AGB calculated using TLS QSM volume or TLS DBH and height would differ from AGB calculated from multiple published allometric equations. We also used TLS measurements to derive new allometric equations for our study species using both DBH and height. We hypothesized that both TLS-based volume AGB estimates and AGB calculated via an individual tree’s TLS DBH and height would be greater than AGB calculated from published equations, as TLS is species-specific and directly measures the volume of each individual tree whereas published allometries are often based on a small destructive sample from a singular genus or forest type. Additionally, we predicted that there would be less differences between TLS-based AGB and AGB calculated from existing allometric equations for coniferous species compared to broadleaf species (Quercus sp.), as tree shape and biomass distribution is similar across conifers of the size classes in our study areas, and allometric equations often assume tapered, cylindrical growth of a single stem (e.g., conifer growth pattern).
2 Methods
2.1 Study sites
Data were collected from three study sites in northern California, United States: (Figure 1): Pepperwood Preserve (38° 34′ 57.5″ N, 122° 42′ 37.3″ W; Sonoma County), Saddle Mountain Open Space Preserve (38° 30′ 3.3″ N, 122° 37′ 44.6″ W; Sonoma County) and Latour Demonstration State Forest, 40° 38′ 21.5″ N, 121° 43’ 26.0” W; Shasta County). At Pepperwood Preserve, the most prominent forest community is oak woodlands. Trees at Pepperwood were selected from multiple plots (20 × 20 m) stratified across topographic gradients along a narrow elevational range (120–460 m) where DBH and height data had already been manually collected in the past year (Evett et al., 2013; Ackerly et al., 2020). Saddle Mountain primarily consists of mixed hardwood and conifer forest, oak woodland, grassland, and chaparral shrublands. Trees at Saddle Mountain were selected from multiple plots (11.3-m radius) along a narrow elevational range (233–549 m) where a suite of forest structure variables were collected simultaneously (Forbes et al., 2020). Latour Demonstration State Forest (LDSF) is located at the southern tip of the Cascade Mountain Range (1,158 m to 2,550 m) and is comprised of many conifer species. Trees at Latour were selected from Continuous Forest Inventory (CFI) plots (11.3-m radius) where DBH and height data had already been manually collected in the past year.
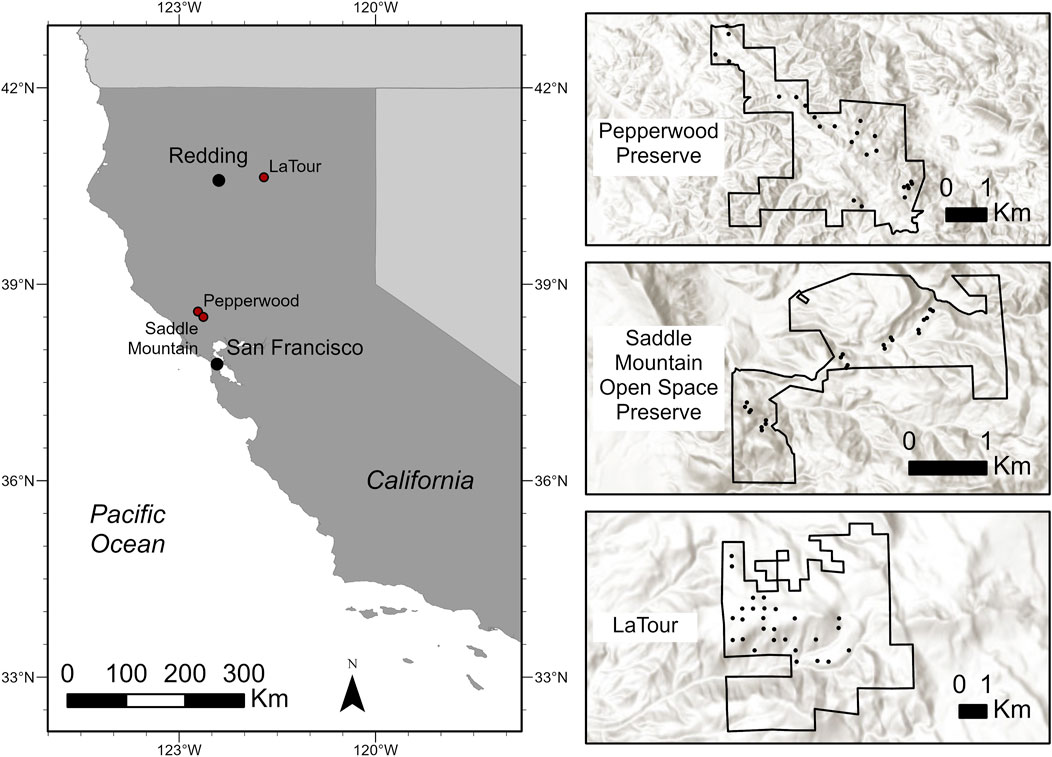
FIGURE 1. Map of the 3 study locations in Northern California (Latour Demonstration State Forest, Pepperwood Preserve, and Saddle Mountain Open Space Preserve) with expanded detail showing the plots (black circles) where trees were selected.
2.2 Species selection
Five species (Quercus agrifolia, Q. garryana, S. sempervirens, Pinus ponderosa, and Abies concolor) were chosen based on both their distribution in the study areas and availability of existing allometric equations. Specifically, each species had to have a minimum of 60 individuals within the surveyed plots across all three study sites to ensure a large enough sample size for allometric equation determination (Stovall et al., 2018). Additionally, Q. agrifolia and Q. garryana were chosen because there is only one known published species-specific allometric equation for either species (Pillsbury et al., 1984). Redwoods, S. sempervirens, were selected because local species-specific allometric equations do exist, based on detailed partial-destructive sampling and crown mapping (Sillett et al., 2019). S. sempervirens, P. ponderosa, and A. concolor were also chosen because they are important timber species, making accurate AGB estimates crucial for foresters. No species was present at all three study sites.
2.3 Field measurements of DBH and height
Data collection included DBH, total tree height, and tree species. For each tree included in this study, DBH was collected at 1.37 m from the base of the uphill side on the trunk to the 10th of a centimeter using a DBH tape for all selected species. To measure the height of each tree, a Laser Technology Impulse 200 LR Rangefinder was used by aiming the laser at eye level on the trunk of the tree, then at the base of the uphill side of the trunk, and at the top of the tallest piece of living or dead tree material. Height was collected for all trees at Pepperwood Preserve and Saddle Mountain, but at LDSF, height was only collected on select trees of interest due to time constraints.
2.4 TLS field measurements and plot-level post-processing
A RIEGL VZ-400i (Horn, Austria) laser scanner was used for all TLS measurements. One 360° vertical and one 360° horizontal scan were collected per scan position by rotating the TLS on a tilt-mount on the scanner surveying tripod to rotate 90° while remaining in its fixed scan position. This scanner has a 1550-nm wavelength and a 0.35-mrad beam divergence (Wilkes et al., 2017; de Tanago et al., 2018). At all plots, nine scan positions were used on a 10 × 10-m grid to ensure full scan visibility in densely forested plots (Wilkes et al., 2017). Additional details related to TLS field scanning is included in the Supplemental Material and in Forbes et al. (2022).
Co-registration of TLS data was completed in RiSCAN PRO (Riegl, www.riegl.com) where each scan was aligned to a common local coordinate system. First, a coarse registration used voxelized point clouds and an on-board Global Navigation Satellite System (GNSS) to align the scans relative to the first scan position. Then a Multi-Station Adjustment (MSA) (RIEGL Laser Measurement Systems GmbH) performed a fine adjustment where planes fit to the point data were aligned using a least squares approach. Using GNSS, data were transformed to NAD83 (2011)/UTM Zone 10N and geoid 12B for accurate height data. Once registered, the TLS pointcloud of the entire plot was aligned to 2013 airborne LiDAR scanner (ALS) data within RiSCAN PRO to create an accurate digital elevation model (DEM), to better align with ALS and unoccupied aerial system (UAS) data used in other studies at the same field sites (see Forbes et al., 2022; Reilly et al., 2021 for more details). The program Lidar360 (GreenValley International, greenvalleyintl.com) was then used to create a DEM by triangular irregular network (TIN) for each plot and height normalize plot-level TLS data.
2.5 Data analyses
2.5.1 Allometric equations
To estimate AGB, allometric equations were used that have been developed from destructive sampling of relatively small numbers of trees in the same region (≥2.5 cm stem diameter) for a subset of common species. These species-specific equations relate main stem cubic volume via DBH or other diameter type (e.g., above buttress), wood density and height, as well as biomass of additional leaf and branch components (Jenkins et al., 2003; California Air Resources Board, 2014; Chojnacky et al., 2014; Sillett et al., 2019).
Multiple tree allometry protocols were used to calculate AGB for each tree species: 1) U.S. Forest Service’s Forest Inventory and Analysis Program (FIA) protocol; 2) Jenkins et al.’s (2003) protocol; 3) Chojnacky et al.’s (2014) protocol; and 4) a local species-specific allometry (if available). For the FIA protocol, volume and AGB of live trees were determined with allometric equations approved by California’s Air Resource Board (CARB) for cubic volume and wood density (density of tree bole/stem, bark, and branches) (CARB, 2014). Each species was assigned a specific equation for live volume estimation, using each stem’s DBH and height as inputs. The AGB of the tree stems (in kilograms) was calculated as:
The CARB FIA protocol species-specific wood densities and specific gravities were used in Eq. 1. Some genera with largely varying wood specific gravities were divided into two different taxa groups. Supplementary Table S1 shows each species within the equation taxa group for Jenkins et al., 2003 and Chojnacky et al., 2014. Additional details related to the specific allometric equations used are included in the Supplemental Material.
2.5.2 TLS data
Using plot-level data, semi-automated segmentation of individual trees from a respective seed point was performed in Lidar360. The profile view of an individual tree was used to manually measure the DBH and height of a single stem, where height was determined by the tallest visual points of the tree. After each tree was segmented and measured, it was manually edited in CloudCompare (www.danielgm.net/cc) to remove extraneous points (Supplemental Figure S1) and processed via TLSeparation (v1.3.2; tlseparation.github.io/documentation) to remove the foliage so only wood was remaining.
Tree volume was estimated directly from the segmented and cleaned point cloud of wood-only data using Quantitative Structure Models (QSM) (Raumonen et al., 2013; Calders et al., 2015b; Disney et al., 2018; Lau et al., 2018; Raumonen, 2020). A range of TreeQSM input parameters were tested to optimize QSM outputs. All QSMs were visually compared to the segmented point cloud and any that did not produce visually similar structured models (i.e., large branches missing) were discarded and not used in subsequent analyses. Additional details related to tree segmentation, tree measurements and QSM functions and optimization are included in the Supplemental Materials.
2.5.3 Data comparisons
As general indicators of model accuracy, root mean square error (RMSE) (kg), coefficient of variation root mean square error (CV RMSE) (%), bias (kg), and percent bias (%) were calculated via Eqs 2–5:
where,
2.5.4 Updated allometric equations
DBH, height, volume, and AGB were used to derive a DBH and height and a DBH only allometric equations per species (10 equations total). TLS derived allometric equations were computed using a linear regression model, with TLS QSM AGB as the response and TLS DBH and height per species as predictors. The log-transformed ordinary least squares regression method detailed in Stovall et al. (2018) was used to determine the slope coefficient, β1, and intercept, β0, with DBH and height H). Specifically, two equation forms were used:
AGB Eq. 1:
AGB Eq. 2:
All analyses were performed using R Statistical Software (v3.6.2; R Core Team, 2021).
3 Results
3.1 TLS vs inventory data for height and DBH estimation
For 550 trees, DBH ranged from 10.9–76.4 cm. For 291 trees, height ranged from 3.16–38.74 m. Across all species, TLS derived metrics accurately estimated DBH and height when compared to field measured DBH and height (R2 = 0.98 for DBH, R2 = 0.95 for height) (Figure 2).
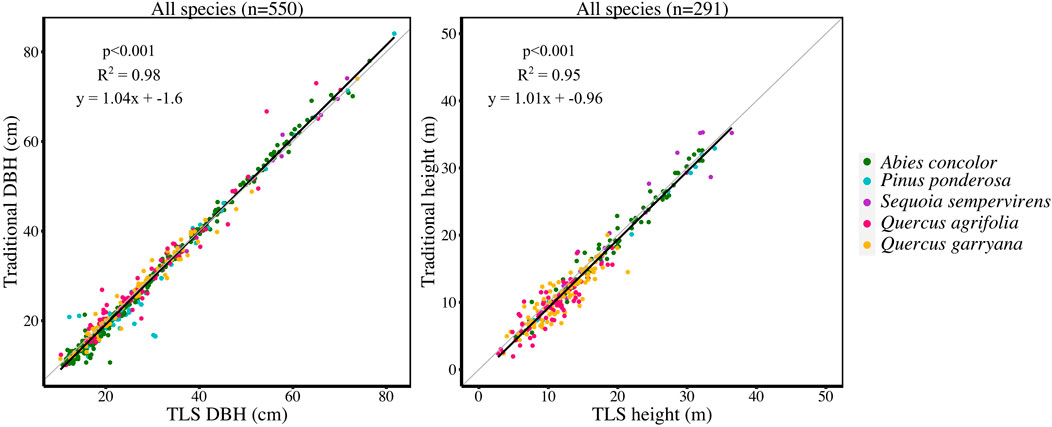
FIGURE 2. (LEFT) Linear regression of traditional DBH (cm) compared to TLS DBH (cm) and (RIGHT) linear regression of traditional height (m) compared to TLS height (m) for each tree measured in the study plots (550 trees for DBH and 291 trees for height; sample sizes are different because traditional height was not measured on all trees).
3.2 QSM volume estimates compared to national FIA equations
Successful QSMs were created for 282 trees across 5 species. Across all species, except P. ponderosa, AGB calculated from TLS QSM volumes were approximately 30% greater than AGB estimates using published Forest Service’s Forest Inventory and Analysis Program (FIA) equations (Figure 3, Supplemental Table S3, Supplemental Table S8). Conifer species (A. concolor, P. ponderosa, S. sempervirens) had QSM volumes closer to FIA volumes compared to hardwood species (Q. agrifolia, Q. garryana) (Figure 3, Supplemental Table S3, Supplemental Table S8).
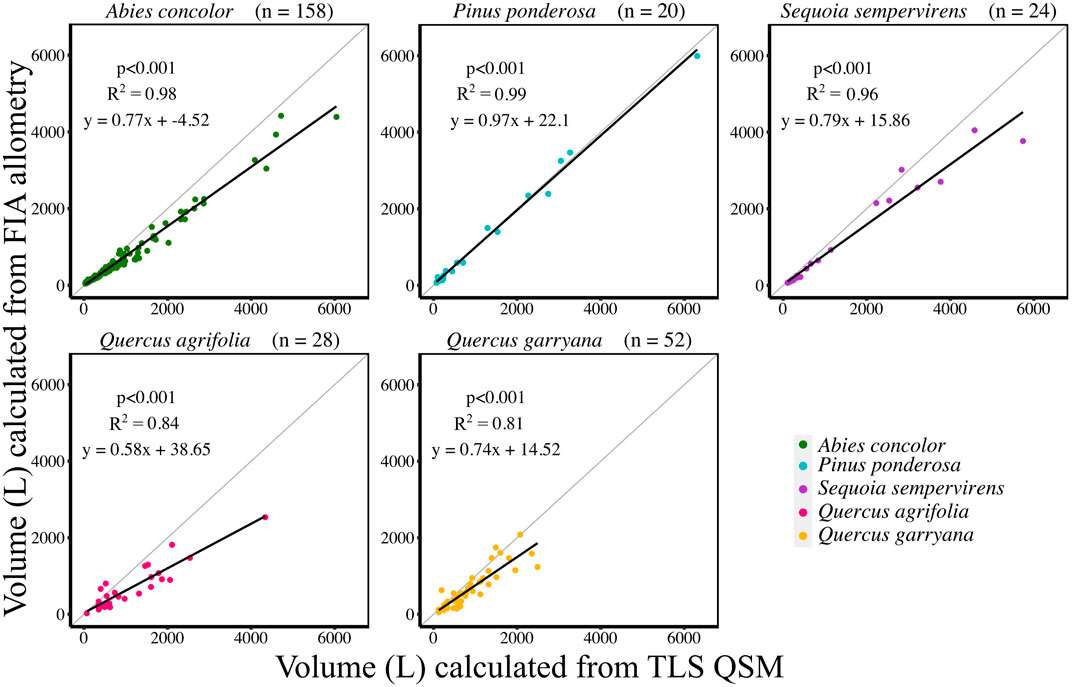
FIGURE 3. Individual tree volume comparison between TLS QSM volumes (L) and FIA volumes (L) by species. Individual tree sample sizes are listed next to species names in parentheses. Grey line indicates 1:1 line.
3.3 TLS QSM AGB estimates compared to AGB calculated from national allometric equations
TLS derived AGB estimates were compared to AGB calculated using published allometric equations from FIA, Jenkins et al. (2003), Chojnacky et al. (2014), and Sillett et al. (2019; for S. sempervirens only) (Figure 4, Supplemental Table S4). In general, comparisons between TLS AGB and AGB calculated from Jenkins et al. (2003) equations had the lowest CV RMSE (36.10%) and bias (1%). Comparisons between TLS AGB and AGB calculated using Chojnacky et al. (2014) and FIA equations had 39.09% and 40.34% CV RMSE and 20% and 11% bias, respectively. For A. concolor, when comparing AGB from species-specific published allometries to TLS AGB, FIA equations had the lowest CV RMSE of 31.78%, a bias of 59.41 kg, and percent bias of 12%. For P. ponderosa, AGB comparisons between the three equations only differ by 1.23 kg with FIA producing the lowest CV RMSE of 25.35%. However; Chojnacky et al. (2014) equations had an CV RMSE of 25.62% with a lower bias of 23.49 kg and percent bias of 5% than either FIA or Jenkins et al. (2003); Jenkins et al. (2003) equations comparisons for AGB had the lowest CV RMSE, bias, and percent bias for the other three species, S. sempervirens, Q. agrifolia, and Q. garryana (Supplemental Table S4). Despite Sillett et al. (2019) having updated equations from detailed measurements, comparisons of TLS AGB with AGB calculated using these equations did not produce the lowest CV RMSE for S. sempervirens. RMSE only differed between Jenkins et al. (2003) and Sillett et al. (2019) by 2.78 kg, and Sillett et al. (2019) had a much lower bias of 16.53 kg compared to 93.85 kg for Jenkins et al. (2003) for S. sempervirens. Both hardwood species, Q. agrifolia and Q. garryana, had TLS AGB estimates that were most similar to Jenkins et al. (2003) AGB estimates when evaluated with CV RMSE and bias.
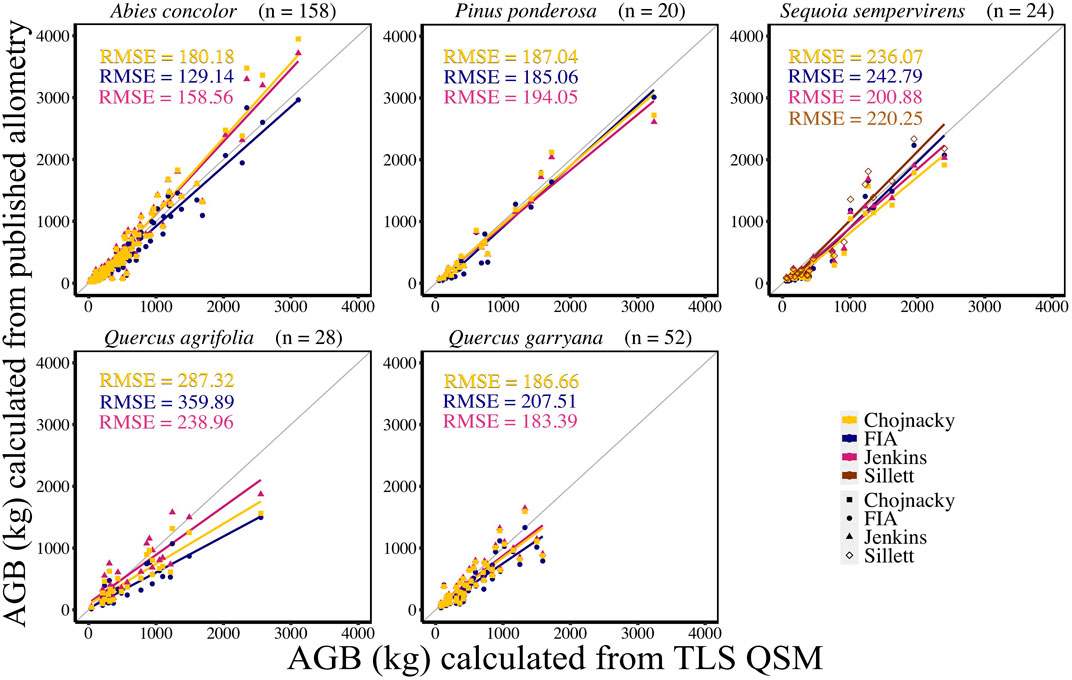
FIGURE 4. Linear regression of FIA, Jenkins et al. (2003), and Chojnacky et al. (2014) and Sillett et al. (2019) individual tree AGB (kg) compared to TLS QSM AGB (kg) for each species. Sillett et al. (2019) is used for Sequoia sempervirens only.
3.4 New species-specific allometric equations created from TLS QSM AGB data
New allometric equations were developed for each species using either DBH (Eq. 6), or both DBH and height (Eq. 7) as covariates with TLS QSM AGB. The species-specific equation coefficients, β0 and β1, for each equation are reported in Table 1 and visualized in Supplemental Figures S2, 3 The R2 and CV RMSE values for each species-specific equation demonstrated that the height-DBH equations were a better fit than the DBH only, for all species except Q. garryana, where there was no difference in R2.
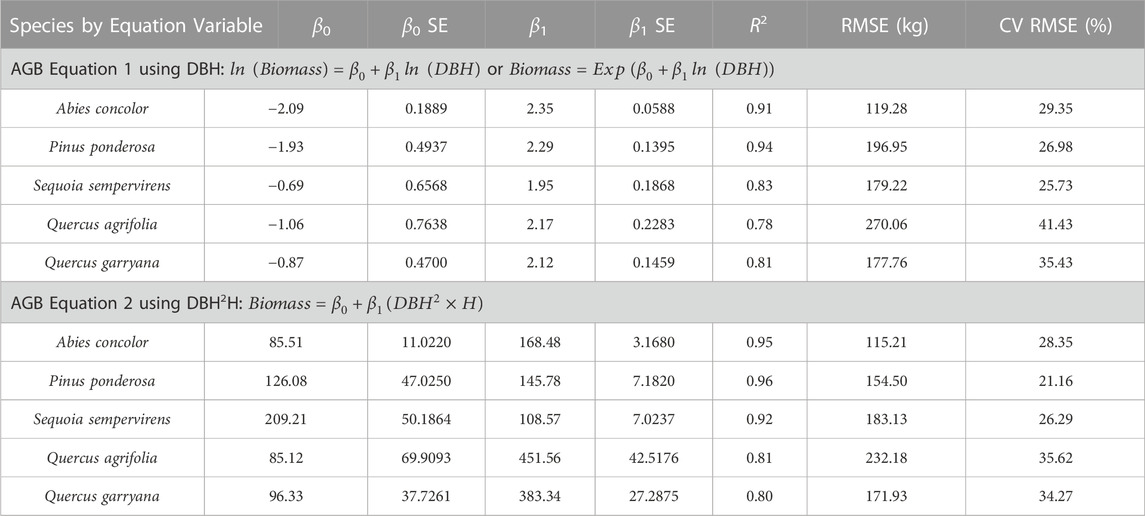
TABLE 1. New species-specific allometric equations created from TLS QSM AGB data.
3.5 AGB calculated from new TLS species-specific allometries compared to AGB calculated from published allometries and TLS QSMs
AGB calculated from new allometric equations derived from TLS data were compared to FIA, Jenkins et al. (2003), Chojnacky et al. (2014), and Sillett et al. (2019) (S. sempervirens only) AGB estimates. AGB estimates created from TLS QSM AGB and DBH (Eq. 6) were more closely correlated (CV RMSE and bias) to AGB estimates using Jenkins et al. (2003) equations for all species (Figure 5, Supplemental Table S5). When comparing equations created with TLS QSM AGB and height and DBH (Eq. 7), Jenkins et al. (2003) AGB estimates were the closest to TLS data for all species except for A. concolor and P. ponderosa, which had the lowest CV RMSE for AGB calculated using the FIA equations (Figure 6, Supplemental Table S6). TLS AGB (kg) estimated from QSMs compared to TLS AGB estimated from the new allometric equations had slightly greater R2 for Eq. 6 (DBH2H) compared to Eq. 7 (DBH) across all species (Figure 7, Supplemental Table S7).
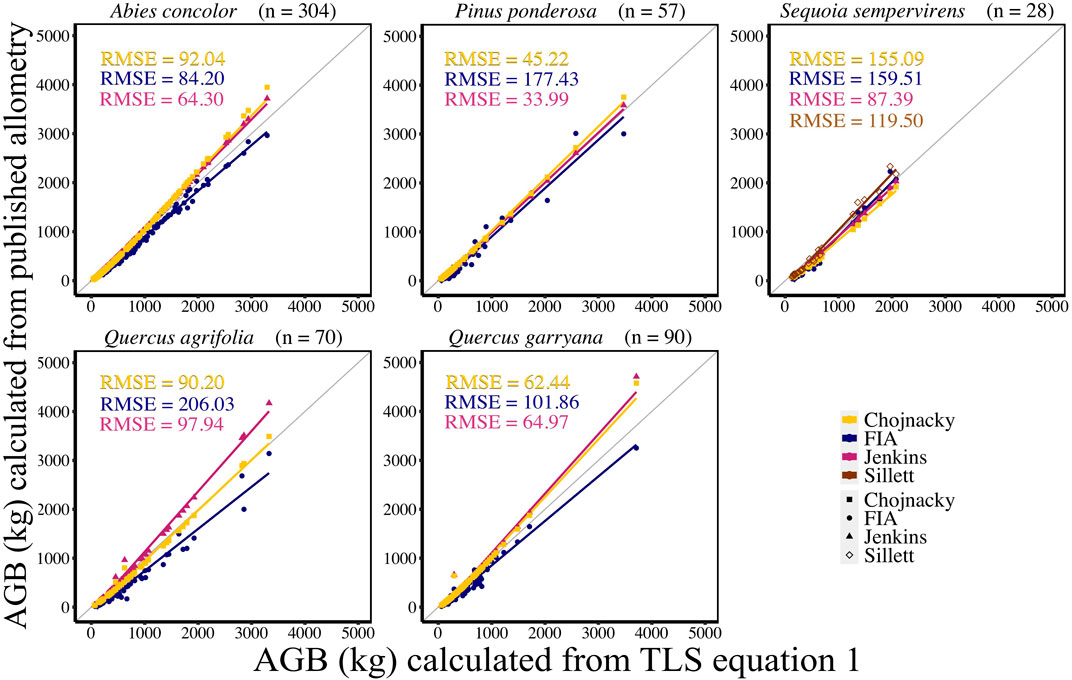
FIGURE 5. New species-specific TLS DBH-based AGB estimates (kg) (AGB Eq. 1) compared to AGB estimated using FIA, Jenkins et al. (2003), Chojnacky et al. (2014) and Sillett et al. (2019) equations for all trees using TLS DBH. Sillett et al. (2019) equations are used for Sequoia sempervirens only.
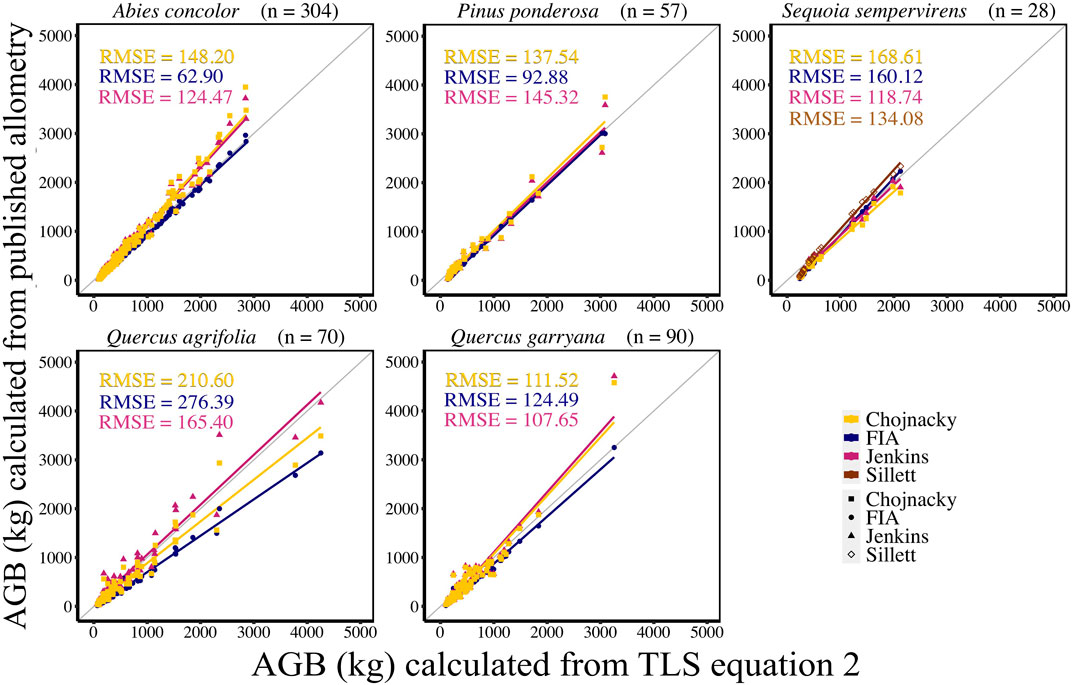
FIGURE 6. New species-specific TLS DBH2 * height-based AGB estimates (kg) (AGB Eq. 2) compared to AGB estimated using FIA, Jenkins et al. (2003), and Chojnacky et al. (2014) and Sillett et al. (2019) equations with TLS DBH and TLS height. Sillett et al. (2019) equations are used for Sequoia sempervirens only.
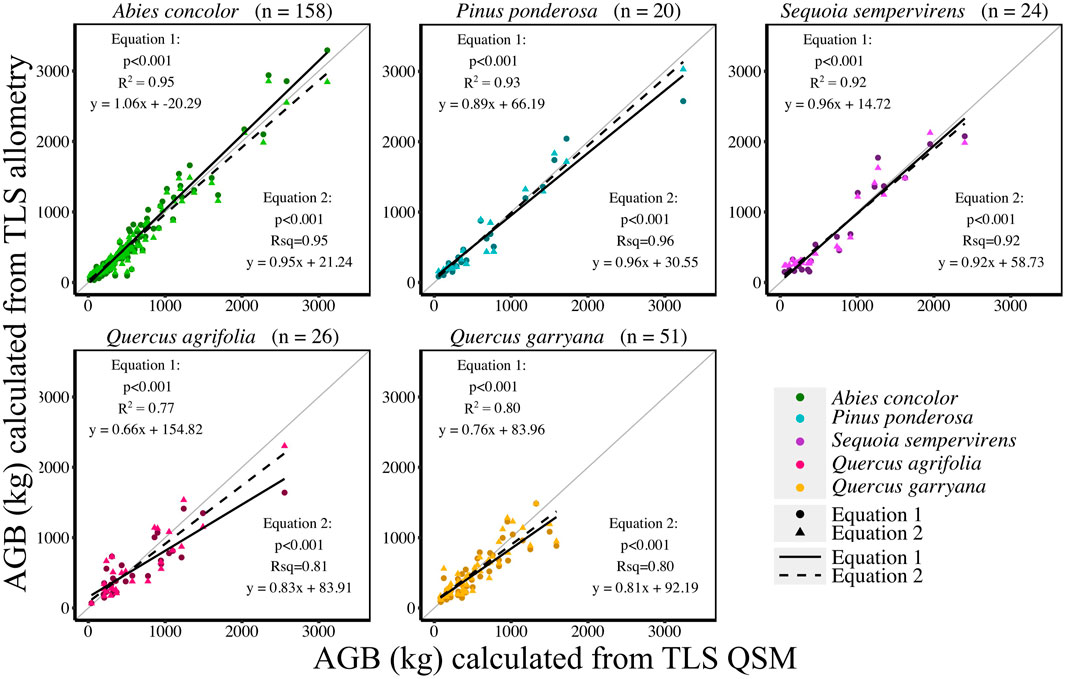
FIGURE 7. TLS AGB (kg) compared to TLS allometric equation derived AGB (kg) using AGB Eq. 1 (DBH only) and AGB Eq. 2 (DBH and Height).
4 Discussion
Due to a lack of comprehensive destructive sampling, allometric equations developed for a few species are often applied to many species across large spatial areas (i.e., often outside their domain) which may introduce error into AGB estimates. Further, in order to apply these equations to any forest stand, multiple measurements from individual trees must still be measured in the field via expensive, time-consuming on-the-ground surveys. This study used a relatively rapid, remote sensing approach (TLS) to estimate AGB of 5 tree species in Northern California by calculating and then comparing TLS QSM estimates of AGB with AGB estimated from published allometric equations (FIA, Jenkins et al., 2003; Chojnacky et al., 2014; Sillett et al., 2019). Data from TLS were then used to measure AGB, DBH, and height to create new allometric equations for these species and to compare these new equations, and their resulting AGB, to AGB of published allometric equations and AGB estimated directly from QSMs.
Before estimating AGB, we validated the use of TLS to accurately capture tree dimensions by comparing TLS data to field DBH from a tape measure and height from a laser rangefinder. Similar to other TLS studies which also extracted these measurements and compared them to field measurements (Olofsson et al., 2014; Calders et al., 2015a; Liang et al., 2016; Stovall et al., 2018; Lau et al., 2019), we determined that DBH and height could be accurately measured for the trees sampled here. Importantly, the TLS data processing approach developed for these measurements occurred at the plot-level, indicating that one can easily and semi-automatically extract DBH and height for multiple trees within a plot without individual tree segmentation or QSM processing.
When volume estimates from TLS QSMs were compared to volume estimated with FIA equations (the only allometries that estimate volume directly), all TLS volumes were greater than FIA estimated volumes (20%–86% greater), except for P. ponderosa (only 1.6% greater). Also, larger AGB discrepancies between TLS and published FIA volume-based allometries were observed for hardwoods (51%–86%) compared to softwoods (2%–46%). It is possible that these volumes showed large differences because FIA volumes allometries are developed from field-measured DBH and height, whereas the TLS volume measurements are based on TLS measured cylinders that measure the main stem and branches. Since allometric equations often assume tapered cylindrical trunk growth of a single stem and do not incorporate coppice growth with multiple tapering stems and interlocking limbs (e.g., redwood/tanoak forests or oak-woodlands regenerating after fire), species that do not grow strictly following a typical fractal growth pattern are expected to show the greatest deviations (Bentley et al., 2013). In Sonoma County, California, allometric equations to estimate height from DBH were found to overestimate heights for large trees, requiring corrections via airborne light detection and ranging (LiDAR) data (Duncanson et al., 2017). These results imply that volume estimates using FIA equations where height is modeled might significantly underestimate actual tree volume, especially for hardwood species.
TLS based estimates of AGB were also greater than AGB estimated from published allometric equations, but on average only 10% greater, with much less variation by species than volume-based FIA estimates. Jenkins et al. (2003) estimated hardwood AGB were very similar to TLS AGB estimates, perhaps because stem AGB is captured by both estimates and might be the main component of total AGB. Duncanson et al. (2017) also found that Jenkins et al. (2003) and Chojnacky et al. (2014) equations produced AGB estimates that were statistically similar to each other, on a plot- and forest-scale, while FIA equation AGB estimates were 20% less than Jenkins et al. (2003) and Chojnacky et al. (2014) overall. Importantly, the greatest deviations we observed were for S. sempervirens (23.5% greater) and Q. agrifolia (15.3% greater). Disney et al. (2020) found that AGB for S. sempervirens in Sonoma County calculated using TLS was 30% higher than AGB calculated using Jenkins et al. (2003); Chojnacky et al. (2014) equations for large redwoods. Further research (including validation through destructive sampling) should be done to determine if the allometric equations generated for these species differ due to site-specific variation. Local conditions are often ignored when creating allometric equations via destructive sampling, but can greatly influence the morphology and biomass of the tree as trees respond to abiotic and biotic stresses experienced throughout their lifetime (Anderson-Teixeira et al., 2015).
New allometric equations created using TLS data validated the use of TLS to generate new allometric equations, as these equations produce AGB values similar to QSM volume measurements and values using already accepted and published equations. New allometric equations created using TLS data for AGB, DBH and height, performed better than equations that only included TLS AGB and DBH, perhaps because accurate TLS heights were used in these equations. In addition, allometric equations created using TLS data agreed most closely with general Jenkins et al. (2003) equations, rather than FIA equations. This was surprising since FIA equations are the only of the three biomass equation protocols that incorporate height and use California species-specific Q. agrifolia and Q. garryana equations (Pillsbury et al., 1984). Possibly, the close agreement of our data with Jenkins et al. (2003) equations and not FIA equations is due to the variety in tree form due to regional biotic and abiotic factors that can be better quantified by more general equations. Can general allometries in a region be used across species without species-specific information? Equation development for Jenkins et al. (2003) and Chojnacky et al. (2014) compiles thousands of equations for over 100 species. While the varying levels of agreement among TLS AGB and published allometric AGB is most likely due to differences in species form, forest density, or destructive sampling/published equations inaccuracies, it is possible that these differences may not matter as much as previously believed. Nevertheless, there is an assumption that wood densities are consistent within a species, and even within an individual. This might not be entirely realistic due to wood density differences between heartwood and sapwood, or branches vs bole (Sillett et al., 2019) and should be verified with field measurements for future model development and testing.
It is also possible that closer agreement between TLS AGB and AGB estimates from Jenkins et al. (2003) equations are due to the fact that our analysis did not include tree size as an interaction term. Other studies comparing TLS derived AGB to AGB calculated from published allometries often examine the effect of tree size (DBH, height) on the success of the QSM and may even generate distinct allometric equations from TLS data based on size (Lau et al., 2018; Stovall et al., 2018; Lau et al., 2019). While we did not have a large enough range of tree sizes to perform this analysis, larger individual trees in this study did tend to deviate farther from the 1:1 line than smaller individuals as in Disney et al. (2020). It is possible that larger (older) trees have more complex branching architecture and bigger contribution of branches to biomass, not captured as easily by a regression allometry based on DBH and height. It is important that future work should focus on comparing the effect of tree size, such as height or DBH, on TLS based allometric equations using these data.
In addition, future work related to estimation of AGB using TLS data should focus on QSM optimization improvement. While optimizing QSMs for tree size, QSMs failed consistently for individual trees without clear point clouds due to close proximity to the TLS instrument in the field or dense foliage in the understory. These study sites were in predominantly evergreen forests during leaf-on conditions for deciduous species, which most likely increased occlusion compared to less dense forests. These issues with QSM generation suggest that future work should experiment with different algorithms for fitting volume to TLS point clouds rather than TreeQSM. Other methods such as convex hull (Stovall et al., 2017) and complex primitives (Åkerblom et al., 2015) are currently being explored with promising results as an alternative to TreeQSM (Calders et al., 2020). Lastly, development of improved automation of tree extraction and leaf-separation techniques would greatly improve the feasibility of TLS over broader spatial scales (Vicari et al., 2019; Moorthy et al., 2020).
We recognize that TLS may not be necessary at a local spatial scale or in regions with low stand density (i.e., few trees) to measure AGB due to the time needed to process TLS data being greater than the time to complete field measurements. Nevertheless, this work supports the use of TLS for non-destructive AGB estimation and allometric equation derivation, which is incredibly useful for species that do not yet have species-specific or local equations, because destructive sampling is challenging or impossible due to protection from local or federal law. While Duncanson et al. (2017) and Disney et al. (2020) both evaluated LiDAR derived AGB in Sonoma County, in similar regions where S. sempervirens, Q. agrifolia, and Q. garryana data were collected for this study, there are no known studies which specifically evaluate allometric equations for AGB of Q. agrifolia, Q. garryana, or other hardwood species in California, with or without TLS (Pillsbury et al., 1984), until now.
Lastly, TLS may offer a uniform, cost effective, and precise method to collect DBH and height or estimate AGB on broader spatial scales or in regions with high stand density, where traditional methods and access are laborious, but species are identified and appropriate wood density values are known. Importantly, since we found that current traditional approaches for estimating AGB for well-studied species produce values that are up to 85% less than TLS AGB estimates, the implications for calculating AGB for regional carbon budgets using TLS are large. Once height-based and/or regional allometric equations can be evaluated, validated or improved for a larger number of species across California, TLS has the potential to supplement airborne or spaceborne LiDAR biomass estimates for rapid, regional-scale, or global applications (Silva et al., 2021).
Data availability statement
The datasets presented in this study can be found in online repositories. The names of the repository/repositories and accession number(s) can be found below: https://doi.org/10.5061/dryad.b5mkkwhhware.
Author contributions
PK—Conceptualization, Data curation, Formal Analysis, Funding Acquisition, Investigation, Methodology, Resources, Software, Visualization, Writing—original draft. BF—Data curation, Formal Analysis, Funding Acquisition, Investigation, Methodology, Resources, Software, Visualization, Writing—review and editing. AB-R—Data curation, Funding Acquisition, Investigation, Methodology, Software. MC—Funding acquisition, Investigation, Software, Writing—review and editing. MD—Funding acquisition, Investigation, Writing—review and editing. PW—Investigation, Writing—review and editing. LB—Conceptualization, Data curation, Funding Acquisition, Investigation, Methodology, Project administration, Resources, Supervision, Validation, Visualization, Writing—original draft.
Funding
This research was funded by CAL FIRE Forest Health and Forest Legacy Program (8GG18806) and California State University Agricultural Research Institute (20-01-106) grants to LB and MC, a Joint Fire Science Program Graduate Research Innovation Grant (20-1-01-20) to BF and LB, a Save the Redwoods League grant to AB-R and LB, and SSU RSCA funding to LB. MD and PW received capital funding from NERC via UCL Geography and NCEO.
Acknowledgments
This project would not have been possible without the hard work and dedication of the undergraduate and graduate students in the Bentley Lab at Sonoma State University who assisted with data processing including: Sarah Arroyo-Chavez, Jolene Markarian, Lauren Webster, Lauryn Calderon, Kristi Faro, Renzo Grimaldi, Karishma Patel, Zane Cooper, and Alanna Post. We are grateful to Sean Place and Nicole Molinari for their conceptual guidance and thoughtful comments on the manuscript and to Sean Reilly for his assistance with programming allometric equations and their interpretation. We additionally thank the Sonoma County Agricultural Preservation and Open Space District, Pepperwood Preserve, Latour DSF and David Ackerly for granting us access to their sites and facilitating our research data collection. We especially appreciate Jason Poburko at CALFIRE for arranging site access and data sharing.
Conflict of interest
The authors declare that the research was conducted in the absence of any commercial or financial relationships that could be construed as a potential conflict of interest.
Publisher’s note
All claims expressed in this article are solely those of the authors and do not necessarily represent those of their affiliated organizations, or those of the publisher, the editors and the reviewers. Any product that may be evaluated in this article, or claim that may be made by its manufacturer, is not guaranteed or endorsed by the publisher.
Supplementary material
The Supplementary Material for this article can be found online at: https://www.frontiersin.org/articles/10.3389/frsen.2023.1132208/full#supplementary-material
References
Ackerly, D. D., Kling, M. M., Clark, M. L., Papper, P., Oldfather, M. F., Flint, A. L., et al. (2020). Topoclimates, refugia, and biotic responses to climate change. Front Ecol Environ. 18 (5), 288–297.
Åkerblom, M., Raumonen, P., Kaasalainen, M., and Casella, E. (2015). Analysis of geometric primitives in quantitative structure models of tree stems. Remote Sens. 7 (4), 4581–4603. doi:10.3390/rs70404581
Anderson-Teixeira, K. J., Mcgarvey, J. C., Muller-Landau, H. C., Park, J. Y., Gonzalez-Akre, E. B., Herrmann, V., et al. (2015). Size-related scaling of tree form and function in a mixed-age forest. Funct. Ecol. 29 (12), 1587–1602. doi:10.1111/1365-2435.12470
Bentley, L. P., Stegen, J. C., Savage, V. M., Smith, D. D., von Allmen, E. I., Sperry, J. S., et al. (2013). An empirical assessment of tree branching networks and implications for plant allometric scaling models. Ecol. Lett. 16 (8), 1069–1078. doi:10.1111/ele.12127
Burt, A., Calders, K., Cuni-Sanchez, A., Gómez-Dans, J., Lewis, P., Lewis, S. L., et al. (2020). Assessment of bias in pan-tropical biomass predictions. Front. For. Glob. Change 3. doi:10.3389/ffgc.2020.00012
Calders, K., Newnham, G., Burt, A., Murphy, S., Raumonen, P., Herold, M., et al. (2015a). Nondestructive estimates of above-ground biomass using terrestrial laser scanning. Methods Ecol. Evol. 6 (2), 198–208. doi:10.1111/2041-210X.12301
Calders, K., Newnham, G. J., Armston, J. D., Disney, M. I., Schaaf, C. B., and Paynter, I. (2015b). “Terrestrial LIDAR for forest monitoring. A sourcebook of methods and procedures for monitoring and reporting anthropogenic greenhouse gas emissions and removals associated with deforestation, gains and losses of carbon stocks in forests remaining forests, and forestation,” in GOFC-GOLD land cover project office (Netherlands: Wageningen University). (Gofc-gold ed.).
Calders, K., Adams, J., Armston, J., Bartholomeus, H., Bauwens, S., Bentley, L. P., et al. (2020). Terrestrial laser scanning in forest ecology: expanding the horizon. Remote Sens Environ. 251, 112102.
California Air Resources Board (CARB) (2014). Compliance offset protocol. U.S. Forest Offset Protocol.
Canadell, J. G., and Schulze, E. D. (2014). Global potential of biospheric carbon management for climate mitigation. Nat. Commun. 5, 5282. doi:10.1038/ncomms6282
Chojnacky, D. C., Heath, L. S., and Jenkins, J. C. (2014). Updated generalized biomass equations for North American tree species. Forestry 87 (1), 129–151. doi:10.1093/forestry/cpt053
de Tanago, J. G., Lau, A., Bartholomeus, H., Herold, M., Avitabile, V., Raumonen, P., et al. (2018). Estimation of above-ground biomass of large tropical trees with terrestrial LiDAR. Methods Ecol. Evol. 9 (2), 223–234. doi:10.1111/2041-210X.12904
Demol, M., Verbeeck, H., Gielen, B., Armston, J., Burt, A., Disney, M. I., et al. (2022). Estimating forest aboveground biomass with terrestrial laser scanning: Current status and future directions. Methods in Ecology and Evolution, 13 (8), 1628–1639. Available at: https://besjournals.onlinelibrary.wiley.com/doi/full/10.1111/2041-210X.13906.
Disney, M., Burt, A., Wilkes, P., Armston, J., and Duncanson, L. (2020). New 3D measurements of large redwood trees for biomass and structure. Sci. Rep. 10 (1), 16721. doi:10.1038/s41598-020-73733-6
Disney, M. I., Vicari, M. B., Burt, A., Calders, K., Lewis, S. L., Raumonen, P., et al. (2018). Weighing trees with lasers: Advances, challenges and opportunities. Interface Focus 8 (2), 20170048. doi:10.1098/rsfs.2017.0048
Duncanson, L., Huang, W., Johnson, K., Swatantran, A., McRoberts, R. E., and Dubayah, R. (2017). Implications of allometric model selection for county-level biomass mapping. Carbon Balance Manag. 12 (1), 18. doi:10.1186/s13021-017-0086-9
Evett, R. R., Arthur Dawson , , and James, W. B. (2013). Estimating vegetation reference conditions by combining historical source analysis and soil phytolith analysis at Pepperwood Preserve, northern California Coast Ranges, United States. Restor. Ecol. 21 (4), 464–473.
Forbes, B., Reilly, S., Clark, M., Ferrell, R., Kelly, A., Krause, P., et al. (2022). Comparing Remote Sensing and Field-Based Approaches to Estimate Ladder Fuels and Predict Wildfire Burn Severity. Front. for. glob. change. 5.
Hudak, A. T., Evans, J. S., and Stuart Smith, A. M. (2009). LiDAR utility for natural Resource managers. Remote Sens. 1 (4), 934–951. doi:10.3390/rs1040934
Jenkins, J. C., Chojnacky, D. C., Heath, L. S., and Birdsey, R. A. (2003). National scale biomass estimators for United States tree species. For. Sci. (49), 12–35.
Kelly, M., and Di Tommaso, S. (2015). Mapping forests with Lidar provides flexible, accurate data with many uses. Calif. Agric. 69 (1), 14–20. doi:10.3733/ca.v069n01p14
Lau, A., Bentley, L. P., Martius, C., Shenkin, A., Bartholomeus, H., Raumonen, P., et al. (2018). Quantifying branch architecture of tropical trees using terrestrial LiDAR and 3D modelling. Trees - Struct. Funct. 32 (5), 1219–1231. doi:10.1007/s00468-018-1704-1
Lau, A., Calders, K., Bartholomeus, H., Martius, C., Raumonen, P., Herold, M., et al. (2019). Tree biomass equations from terrestrial LiDAR: A case study in Guyana. Forests 10 (6), 527. doi:10.3390/f10060527
Liang, X., Kankare, V., Hyyppä, J., Wang, Y., Kukko, A., Haggrén, H., et al. (2016). Terrestrial laser scanning in forest inventories. ISPRS J. Photogrammetry Remote Sens. 115, 63–77. doi:10.1016/j.isprsjprs.2016.01.006
Malhi, Y., Jackson, T., Patrick Bentley, L., Lau, A., Shenkin, A., Herold, M., et al. (2018). New perspectives on the ecology of tree structure and tree communities through terrestrial laser scanning. Interface Focus. 8 (2), 20170052.
Momo Takoudjou, S., Ploton, P., Sonk é, B., Hackenberg, J., Griffon, S., De Coligny, F., et al. (2018). Using terrestrial laser scanning data to estimate large tropical trees biomass and calibrate allometric models: a comparison with traditional destructive approach. Methods Ecol. Evol. 9 (4), 905–916.
Moorthy, S. M. K., Calders, K., Vicari, M. B., and Verbeeck, H. (2020). Improved supervised learning-based approach for leaf and wood classification from LiDAR point clouds of forests. IEEE Trans. Geoscience Remote Sens. 58 (5), 3057–3070. doi:10.1109/TGRS.2019.2947198
Olofsson, K., Holmgren, J., and Olsson, H. (2014). Tree stem and height measurements using terrestrial laser scanning and the RANSAC algorithm. Remote Sens. 6 (5), 4323–4344. doi:10.3390/rs6054323
Reilly, S., Clark, M. L., Bentley, L. P., Matley, C., Piazza, E., and Oliveras Menor, I. (2021). The potential of multispectral imagery and 3D point clouds from unoccupied aerial systems (UAS) for monitoring forest structure and the impacts of wildfire in mediterranean-climate forests. Remote Sens. 13 (19), 3810.
Pillsbury, N. H., and Kirkley, M. L. (1984). Equations for total, wood, and saw-log volume for thirteen California hardwoods. U.S. Department of Agriculture, Forest Service, PNW-RN-414. Pacific Northwest Forest and Range Experiment Station. doi:10.2737/PNW-RN-414
Pugh, T. A. M., Jones, C. D., Huntingford, C., Burton, C., Arneth, A., Brovkin, V., et al. (2018). A large committed long-term sink of carbon due to vegetation dynamics. Earthʼs futur. 6 (10), 1413–1432.
R Core Team (2021). R: A language and environment for statistical computing. Vienna, Austria: R Foundation for Statistical Computing. Available at: https://www.R-project.org/.
Raumonen, P., Kaasalainen, M., Markku, Å., Kaasalainen, S., Kaartinen, H., Vastaranta, M., et al. (2013). Fast automatic precision tree models from terrestrial laser scanner data. Remote Sens. 5 (2), 491–520. doi:10.3390/rs5020491
Raumonen, P. (2020). TreeQSM quantitative structure models of single trees from laser scanner data instructions for MATLAB-software TreeQSM. version 2.4.0.
Sillett, S. C., Pelt, R. V., Carroll, A. L., Campbell-Spickler, J., Coonen, E. J., and Iberle, B. (2019). Allometric equations for Sequoia sempervirens in forests of different ages. For. Ecol. Manag. 433, 349–363. doi:10.1016/j.foreco.2018.11.016
Silva, C. A., Duncanson, L., Hancock, S., Neuenschwander, A., Thomas, N., Hofton, M., et al. (2021). Fusing simulated GEDI, ICESat-2 and NISAR data for regional aboveground biomass mapping. Remote Sens. Environ. 253, 112234. doi:10.1016/j.rse.2020.112234
Stovall, A. E. L., Shugart, H. H., Stovall, A. E. L., Anderson-Teixeira, K. J., and Anderson-Teixeira, K. J. (2018). Assessing terrestrial laser scanning for developing non-destructive biomass allometry. For. Ecol. Manag. 427, 217–229. doi:10.1016/j.foreco.2018.06.004
Stovall, A. E. L., Vorster, A. G., Anderson, R. S., Evangelista, P. H., and Shugart, H. H. (2017). Non-destructive aboveground biomass estimation of coniferous trees using terrestrial LiDAR. Remote Sens. Environ. 200, 31–42. doi:10.1016/j.rse.2017.08.013
Vicari, M. B., Disney, M., Wilkes, P., Burt, A., Calders, K., and Woodgate, W. (2019). Leaf and wood classification framework for terrestrial LiDAR point clouds. Methods Ecol. Evol. 10 (5), 680–694. doi:10.1111/2041-210X.13144
Keywords: terrestrial laser scanning (TLS), tree aboveground biomass, allometric equations, Quercus agrifolia, Quercus garryana, Sequoia sempervirens, Pinus ponderosa, Abies concolor
Citation: Krause P, Forbes B, Barajas-Ritchie A, Clark M, Disney M, Wilkes P and Bentley LP (2023) Using terrestrial laser scanning to evaluate non-destructive aboveground biomass allometries in diverse Northern California forests. Front. Remote Sens. 4:1132208. doi: 10.3389/frsen.2023.1132208
Received: 27 December 2022; Accepted: 13 April 2023;
Published: 10 May 2023.
Edited by:
Erin Bunting, Michigan State University, United StatesReviewed by:
Kyla Dahlin, Michigan State University, United StatesTianyu Hu, Institute of Botany (CAS), China
Copyright © 2023 Krause, Forbes, Barajas-Ritchie, Clark, Disney, Wilkes and Bentley. This is an open-access article distributed under the terms of the Creative Commons Attribution License (CC BY). The use, distribution or reproduction in other forums is permitted, provided the original author(s) and the copyright owner(s) are credited and that the original publication in this journal is cited, in accordance with accepted academic practice. No use, distribution or reproduction is permitted which does not comply with these terms.
*Correspondence: Lisa Patrick Bentley, lisa.bentley@sonoma.edu
†Present address: Alexander Barajas-Ritchie, Department of Computer Science, Oregon State University, Corvallis, OR, United States