UAS remote sensing applications to abrupt cold region hazards
 Megan Verfaillie1*
  Eunsang Cho2,3†
  Lauren Dwyre1†
  Imran Khan1† Cameron Wagner1†
  Jennifer M. Jacobs1,4 Adam Hunsaker1,4
- 1Department of Civil and Environmental Engineering, University of New Hampshire, Durham, NH, United States
- 2Hydrological Sciences Laboratory, NASA Goddard Space Flight Center, Greenbelt, MD, United States
- 3Earth System Science Interdisciplinary Center, University of Maryland, College Park, MD, United States
- 4Earth Systems Research Center, Institute for the Study of Earth, Oceans, and Space, University of New Hampshire, Durham, NH, United States
Unoccupied aerial systems (UAS) are an established technique for collecting data on cold region phenomenon at high spatial and temporal resolutions. While many studies have focused on remote sensing applications for monitoring long term changes in cold regions, the role of UAS for detection, monitoring, and response to rapid changes and direct exposures resulting from abrupt hazards in cold regions is in its early days. This review discusses recent applications of UAS remote sensing platforms and sensors, with a focus on observation techniques rather than post-processing approaches, for abrupt, cold region hazards including permafrost collapse and event-based thaw, flooding, snow avalanches, winter storms, erosion, and ice jams. The pilot efforts highlighted in this review demonstrate the potential capacity for UAS remote sensing to complement existing data acquisition techniques for cold region hazards. In many cases, UASs were used alongside other remote sensing techniques (e.g., satellite, airborne, terrestrial) and in situ sampling to supplement existing data or to collect additional types of data not included in existing datasets (e.g., thermal, meteorological). While the majority of UAS applications involved creation of digital elevation models or digital surface models using Structure-from-Motion (SfM) photogrammetry, this review describes other applications of UAS observations that help to assess risks, identify impacts, and enhance decision making. As the frequency and intensity of abrupt cold region hazards changes, it will become increasingly important to document and understand these changes to support scientific advances and hazard management. The decreasing cost and increasing accessibility of UAS technologies will create more opportunities to leverage these techniques to address current research gaps. Overcoming challenges related to implementation of new technologies, modifying operational restrictions, bridging gaps between data types and resolutions, and creating data tailored to risk communication and damage assessments will increase the potential for UAS applications to improve the understanding of risks and to reduce those risks associated with abrupt cold region hazards. In the future, cold region applications can benefit from the advances made by these early adopters who have identified exciting new avenues for advancing hazard research via innovative use of both emerging and existing sensors.
1 Introduction
Abrupt hazards in cold regions often result in direct exposures which impact people, society, and/or the environment, and may disrupt an individual or community’s way of life through travel limitations, infrastructure damage, or loss of life (Markon et al., 2018). These impacts pose an even greater risk in areas most vulnerable to the effects of climate change. By the mid-century, it is predicted that the Arctic will be nearly sea ice-free for most of the year, altering fish and wildlife habitats and leaving coastal regions vulnerable to storm surge, flooding, and erosion (Markon et al., 2018; Druckenmiller, Thoman, and Moon, 2022). Increased temperatures and precipitation are expected to impact snowpacks, river discharge, and water quality (Markon et al., 2018; Lee et al., 2023). The future of some impacts is less certain, such as the evolving risk from glacial lake outburst floods (GLOFs), snow avalanches, and winter storms. These areas require further research to assess how their frequency and extent will change. Risks resulting from climate change are expected to increase threats to human health (e.g., food and water security, infectious diseases), resulting in possible habitat loss and relocation of rural coastal communities (Markon et al., 2018; Druckenmiller, Thoman, and Moon, 2022; Lee et al., 2023).
Cold regions are characterized by below freezing temperatures, cold weather precipitation (e.g., snow, freezing rain), the presence of permafrost, and the formation of sea, lake, or river ice (Markon et al., 2018; Bates and Bilello, 1966; Gerdel, 1969; Shen, 1992; “Cold Region Operations” 2011). In cold regions, abrupt hazards and their associated impacts are particularly challenging to monitor using traditional data collection techniques. Field-based data collection activities in cold regions are commonly limited by weather conditions and lack of accessibility to sample sites. Satellite remote sensing allows for the collection of data over large areas in remote, hard-to-reach places (Gaffey and Bhardwaj, 2020). Despite the advances in high-resolution satellite data for cold region imaging (e.g., Sentinel, PlanetScope, WorldView, SPOT, etc.) (Leigh et al., 2019), observations may be available infrequently due to satellite revisit times, have coarse spatial resolutions, have different illumination conditions over time, or be constrained by darkness or cloud cover which limits their effectiveness for assessing rapid changes (Marshall, Dowdeswell, and Rees, 1994; Andreassen et al., 2008; Markon et al., 2018; He et al., 2023). Crewed aircraft also collect high-resolution data, but flights are limited by high operation costs, lack of operational infrastructure, extreme weather, and intrusion on wildlife. Thus, while satellite and airborne remote sensing are extremely useful, data collection at the required frequency and resolution may not be possible, making assessment of rapidly evolving hazards a challenge (Markon et al., 2018; Gaffey and Bhardwaj, 2020).
Unoccupied aerial systems (UAS) have emerged as a reliable method for collecting data in cold regions at higher spatial resolutions (centimeter scale) than satellites and are not limited by orbital revisit times. Although their areal extent is typically smaller than satellites and crewed aircraft, UASs can operate beneath clouds, giving them an advantage in cloudy regions. UAS platforms are low cost compared to aerial surveys and allow for more flexibility because they can carry a suite of light-weight sensors tailored to the needs of a particular study (Gaffey and Bhardwaj, 2020). The high spatial and temporal resolution of UAS data means that it can also bridge the gap between satellite-based and field-scale observations.
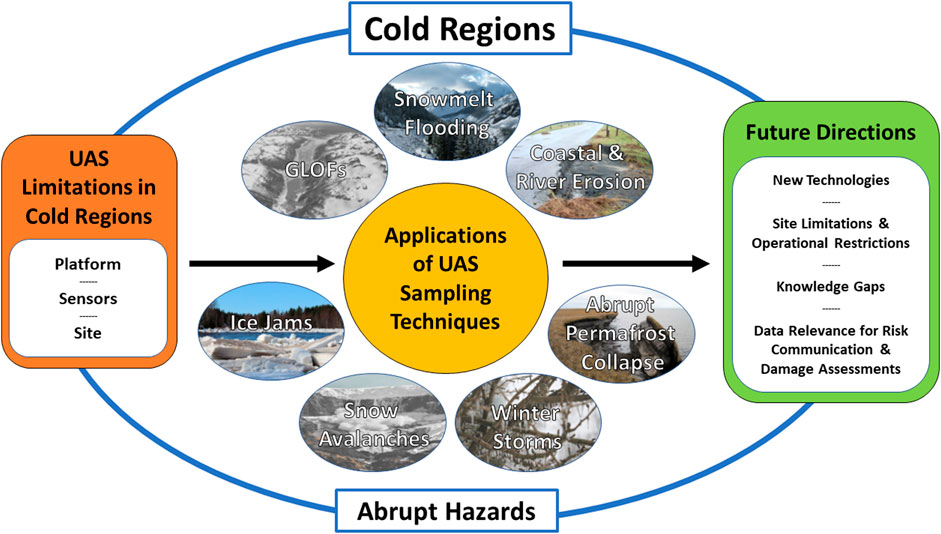
Many studies have focused on remote sensing applications for monitoring long-term changes in cold regions, but the role of UAS for detection, monitoring, and response to rapid changes and exposures resulting from abrupt hazards in cold regions is still emerging. As the frequency and intensity of abrupt cold region hazards changes (Druckenmiller, Thoman, and Moon, 2022; Lee et al., 2023), it will become increasingly important to document and understand these changes to support scientific advances and hazard management. The increasing accessibility and decreasing costs of UASs will likely make them a standard part of acquiring this data (Du et al., 2019; Quirk and Haack, 2019; Gaffey and Bhardwaj, 2020). This review provides an overview of UAS remote sensing limitations, details recent applications of UAS for abrupt cold region hazards and concludes with a summary of future directions (Figure 1).
2 Definitions of cold regions
In the Northern Hemisphere, cold regions are often defined by temperature and may be delineated based on the 0°C isotherm in the coldest month of the year (Bates and Bilello, 1966; Gerdel, 1969) or using the annual average temperature (Shen, 1992). Cold regions may also be defined by areas where lakes, rivers, harbors, or coastal waters become un-navigable for 100 days or more per year (Gerdel, 1969). Permafrost (i.e., frozen ground) is also used to define cold regions and may exist in an unbroken fashion across an entire region as continuous permafrost or may be patchy and discontinuous. Bates and Bilello (1966) defined cold regions as those that experience 30.5 cm of frost penetration. However, since the actual depth of frost penetration is not regularly observed, a freezing index is most frequently used as a measure of potential frost penetration into the ground (Gerdel, 1969). Compared to other cold regions, polar regions often experience more severe conditions, contain a unique environment and geology, and are subject to increased climate change impacts (IPCC, 2019a).
A cold region may also be defined by its impacts on engineering design, built infrastructure, and/or human activity (e.g., mobility, military operations). For example, a cold region may exist wherever frost affects engineering systems; snow load must be considered in design of structures; low temperatures affect efficiency of humans or machines; or safety of roadways and power lines are a consideration (Shen, 1992). The U.S. military defines cold regions as any region where “cold temperatures, unique terrain, and snowfall significantly affect military operations for 1 month or more each year” (“Cold Region Operations” 2011).
In this review, we broadly include studies and activities that were conducted in cold regions that are inclusive of these definitions.
3 Applications of UAS sampling techniques for understanding abrupt cold region hazards
The following sections review examples and benefits of UAS observations for snowmelt flooding, GLOFs, ice jams, coastal and river erosion, abrupt permafrost collapse and event-based thaw, snow avalanches, and winter storms (Figure 1). These studies are well distributed globally, with most occurring in mid-latitudes between 30 and 60°N (Figure 2). Some individual applications are more widespread than others, for example, GLOF research sites range from south of the equator (Wigmore and Mark, 2017) to northwestern Greenland (Jouvet et al., 2017). Conversely, the use of UAS for observing conditions which inform the understanding and prediction of snowmelt flooding is concentrated within Europe, with one site in the northernmost Finnish Lapland (Flener et al., 2013) and one in the western United States (McGrath et al., 2022). A complete site list can be found in Supplementary Table S1 from the supplementary material.
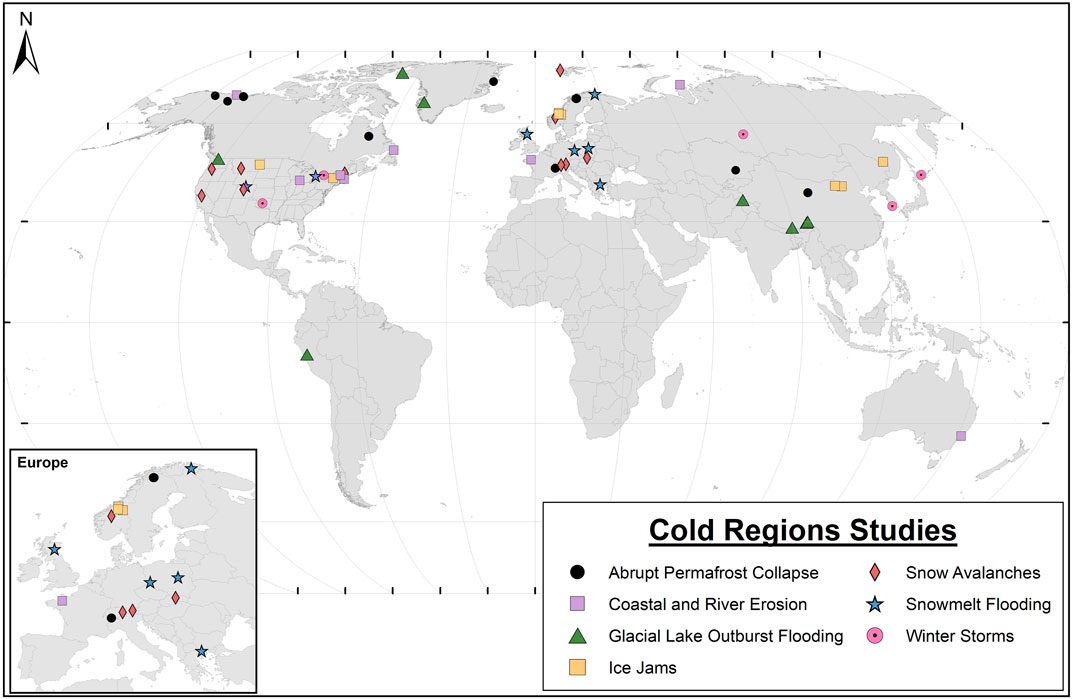
FIGURE 2. Distribution of reviewed study locations for UAS applications to cold region abrupt hazards (laboratory studies not pictured). Created by Tim Hoheneder (UNH). A complete site list is included in Supplementary Table S1 found in the supplementary material.
3.1 Glacial lake outburst flooding
Glacial lakes are often formed in the overdeepenings–or depressions–created by receding glaciers (Mölg et al., 2021), and impounded by weak moraine or ice dams (Neupane, Chen, and Cao, 2019). There has been a rapid increase in the number and size of these lakes around the world due to the recent deglaciation (Carrivick and Tweed, 2013), which is attributed to anthropogenic climate change (Harrison et al., 2018). Between 1990 and 2018, the number of glacial lakes increased by 53% globally, while the total volume of water in glacial lakes increased by 48% (Shugar et al., 2020). Glacial lakes provide a source of fresh water, regulate river flows, and act as natural water reservoirs for hydropower generation (Ehrbar et al., 2018). However, when a large volume of water is held in a glacial lake by an unstable dam, it increases the probability of a GLOF (Benn et al., 2012). GLOFs are one of the most catastrophic extreme events in glaciated mountain regions (Tomczyk and Ewertowski, 2021; Taylor et al., 2023). They occur when water is suddenly released from a glacial lake due to a dam breach (Anacona, Mackintosh, and Norton, 2015; Emmer et al., 2022). Historical records show that GLOFs have occurred for centuries (Carrivick and Tweed, 2016) and, due to the increased formation and expansion of glacial lakes, a considerable increase in GLOF occurrence is expected in the future (Harrison et al., 2018; Compagno et al., 2022).
Mapping glacial lakes is the first step in evaluating GLOF risk. Cost-effective and efficient data on GLOFs obtained from satellite remote sensing (Thati and Ari, 2022) are an obvious choice for the long-term study of glaciers and glacial lakes (Winsvold, Kaab, and Nuth, 2016). However, when there is an imminent threat from a potentially dangerous glacial lake (i.e., high potential of causing a GLOF) UASs can provide an important contribution via campaign-style observations with a high temporal and spatial resolution over shorter periods to capture more rapid changes than can be collected by most satellites (Gaffey and Bhardwaj, 2020). For example, ice-dammed lakes can be short-lived and may experience spontaneous drainage (Hewitt and Liu, 2010; Carrivick et al., 2017; Jacquet et al., 2017), therefore they require continuous monitoring to allow advance warning. PlanetScope satellite imagery provides daily coverage at 3 m resolution (Qayyum et al., 2020; Mullen et al., 2023), but the data is not publicly available. Recent studies have utilized UAS data to supplement satellite data to combine the benefits of both platforms and obtain information quickly and inexpensively with greater temporal and spatial resolution (Wigmore and Mark, 2017; Gaffey and Bhardwaj, 2020).
UASs have been instrumental in monitoring glacial lake volume and potential GLOF triggers, such as calving at the glacier terminus. Several studies have used a combination of satellite and UAS monitoring techniques to investigate GLOF triggers and the characteristics of glacial lakes. Bazai et al. (2021) found lake volumes obtained from the UAS-derived digital elevation models (DEMs) of glacial lake basins were more accurate than those derived from the Advanced Spaceborne Thermal Emission and Reflection Radiometer (ASTER) in the Karakoram region. Their UAS surveys also identified an increase in the number of crevasses in the lower ablation zone of the Malangutti Glacier, an important indicator of subglacial drainage (Bazai et al., 2021). Similarly, Hu et al. (2022) used UAS data in combination with satellite imagery to assess the geomorphology of Gega Glacial Lake in the eastern Himalayas. UAS images identified the dimensions of the dam and important local features including a natural outlet and its dimensions and water seepage near the dam bottom (Hu et al., 2022). He et al. (2023) also combined satellite imagery and UAS survey data to investigate the Zhuxi Glacier’s surface and mass dynamics, ablation hotspots, and proglacial moraine-dammed lake expansion in the southeastern Tibetan Plateau. The increased spatial resolution of UASs compared to satellite techniques allows for fine scale investigation of GLOF triggers. In Cordillera Blanca, Peru, Wigmore and Mark (2017) analyzed changes in the Llaca Glacier and the proglacial lake using a custom designed UAS and orthomosaics and DEMs created using Structure-from-Motion (SfM) techniques. The high-resolution imagery revealed low surface velocities at the terminus of the glacier within the lake as well as the disappearance of the supraglacial ponds identified in the first survey. In Greenland, Jouvet et al. (2017) performed repeat UAS photogrammetric surveys to observe an active calving event from the Bowdoin Glacier using feature tracking and ice flow modelling (Jouvet et al., 2017).
UAS-derived orthomosaics and digital surface models (DSMs) have also been used to reconstruct historical GLOFs such as the 2001 Chongbaxia Tsho GLOF (Nie et al., 2020) and the 2021 GLOF at the Russell Glacier in West Greenland (Dømgaard et al., 2023). These studies used UAS-derived data to quantify the lake features including lake surface elevation and volume before and after the GLOF event and drained lake topography and flood drainage routes. UAS imagery revealed geomorphologic features in the Russell Glacier’s drainage area, such as large ice blocks in the drainage route, that were not visible in the satellite imagery and identified a new flow pathway that is likely to become the dominant drainage route (Dømgaard et al., 2023).
3.2 Snowmelt flooding
Unlike GLOFs which are limited to glaciated regions, snowmelt flooding is more widespread and may occur in seasonal snow-dominant regions. Snowmelt flooding occurs when the primary source of floodwater is melted water from the snowpack (Merz and Blöschl, 2003; Berghuijs et al., 2016). During a snowmelt flood, rapid snowmelt occurs over 1–2 weeks, usually caused by increased air temperatures and/or rain-on-snow events, leading to soil saturation and continuous elevation of river flows (Todhunter, 2001; Pomeroy, Stewart, and Whitfield, 2016; Tuttle et al., 2017). Snowmelt associated with the spring thaw as well as rainfall events (e.g., rain-on-snow) increases the likelihood of flooding, which can endanger lives and damage property and infrastructure (Fang et al., 2014; Li et al., 2019; Davenport et al., 2020). Snowmelt floods have impacted local and regional communities across the U.S. and Canada during last several decades (Stadnyk et al., 2016; Cho and Jacobs, 2020). The drivers of snowmelt flooding will become more complex under a changing climate due to rapid changes in temperature and frequent occurrences of winter rainfall events, increasing the need for accurate prediction of snowmelt flooding (Diffenbaugh, 2017; Musselman et al., 2018; Henn et al., 2020). This requires frequent and accurate quantification of spatially distributed snowpack and antecedent soil conditions over a watershed or basin. Spatial snowpack information captured by satellite- or airborne-based remote sensing approaches, such as passive microwave satellite data (Vuyovich and Jacobs, 2011), airborne light detection and ranging (LiDAR) (e.g., Airborne Snow Observatory; Painter et al., 2016; Bormann et al., 2019; Lahmers et al., 2022), airborne gamma snow survey (Carroll et al., 2006; Cho, Jacobs, and Vuyovich, 2020), and stereo satellite photogrammetry (e.g., Pléiades; Deschamps-Berger et al., 2020), have been used to obtain this data.
An integrated approach of UAS-based observations and physically-based flood models utilizing data assimilation techniques may be able to maximize our ability to monitor and predict snowmelt flooding (Fang et al., 2014; Griessinger et al., 2016). There are two categories of hydrological characteristics captured by UASs which can be utilized for improving snowmelt flood modeling: snow-related properties [e.g., snow depth, SWE, liquid water content (LWC)] and floodwater level and its dynamics. UAS-based LiDAR and photogrammetry have been widely used to monitor spatial distribution of snow depth (Vander Jagt et al., 2015; Bühler et al., 2016; Harder et al., 2016; Harder, Pomeroy, and Helgason, 2020; Cho, McCrary, and Jacobs, 2021; Jacobs et al., 2021). To estimate SWE and LWC maps, recent studies utilized ground penetrating radar (GPR) coupled with UAS photogrammetry (Yildiz, Akyurek, and Binley, 2021; McGrath et al., 2022; Valence et al., 2022). UAS-based GPR systems can observe permittivity measures which are physically related to snow density and LWC (Prager et al., 2022; Valence et al., 2022). UAS-mounted synthetic aperture radar (SAR) (Koo et al., 2012) is another potential application to directly measure river flow and flood propagation for near-real snowmelt flood monitoring. The SAR system on a low-cost, commercially available UAS platform has great potential to reduce uncertainties in floodwater dynamics driven by the limited temporal frequency of satellite measurements with a fully controllable revisit time and timing of UASs.
There are various applications for UASs to improve detection, prediction, and assessment of snowmelt-driven runoff and extreme events (Lucieer et al., 2014; Niedzielski, Spallek, and Witek-Kasprzak, 2018; Yalcin, 2019; Wufu et al., 2021). One viable approach is to incorporate spatial snow depth or SWE information obtained by UAS-based photogrammetry or LiDAR with physically-based hydrologic models. While the applications are still in the early stage, there is some evidence that UAS-based approaches can support snowmelt flood prediction. Niedzielski et al. (2018) developed UAS-based SWE maps for a small mountainous catchment in southwestern Poland. They found snowmelt runoff can be estimated using the UAS-based approach with −11% and 2% errors, implying that the UAS-based snow information can improve snowmelt runoff and its extremes.
UAS-based information can also improve capability for monitoring flood dynamics by providing ultra-high-resolution, up-to-date river shorelines, vegetation, and channel geometry as well as floodwater dynamics (Perks, Russell, and Large, 2016; Koutalakis, Tzoraki, and Zaimes, 2019; Karamuz, Romanowicz, and Doroszkiewicz, 2020; Munawar et al., 2021). This enables detailed analyses of hydraulic and fluvial processes even during flood events. Perks, Russell, and Large (2016) found that UAS photogrammetry was able to capture water velocity features present on the floodwater surface during a highly transient flash flood event in Scotland. This study presents a potential use of UASs in quantifying flood flows within ungauged rivers in other regions. Karamuz, Romanowicz, and Doroszkiewicz (2020) provided an overview of the potential for using UAS platforms in flood hazard modeling including derivation of digital terrain models of a river valley, bathymetry, and ice cover and snow monitoring on rivers. They also provided an example of how imagery from UAS photogrammetry can improve the boundary conditions of a hydrodynamic model (HEC-RAS). In contrast, Flener et al. (2013) used UAS photogrammetry-based images of the Pulmonki River in the Finnish Lapland to create a 3D bathymetric model to detect morphologic changes in a highly dynamic river in the sub-Arctic and improve understanding of how spring flooding and summer low flows influence erosion and deposition.
3.3 Ice jams
Ice jams and snowmelt may co-occur in cold regions, making them more complicated to model than open water floods (Goldberg et al., 2020). Ice jam floods are often more severe than open water floods because they can result in two to three times higher water depths under the same or lower discharge (Rokaya, Budhathoki, and Lindenschmidt, 2018). The formation of an ice jam depends on winter weather conditions as well as the characteristics of the ice floe and the river (e.g., velocity, temperature, flow profile) (Lindenschmidt et al., 2019). Mid-winter thaws and springtime conditions increase water input to frozen rivers, causing the layer of ice on top to break up and move downstream (Turcotte, Burrell, and Beltaos, 2019; “What Is an Ice Jam?” 2022). When these broken chunks of floating river ice encounter a narrow passage, they may get stuck and block the flow of a river, causing an ice jam. Ice break-up and associated jams can alter hydraulic conditions and morphology, resulting in flooding of coastal communities and damage to infrastructure and riverine flora and fauna (“What Is an Ice Jam?” 2022; Alfredsen and Juárez, 2020; Alfredsen et al., 2018). Ice jams can occur anywhere rivers freeze and are a source of concern for citizens, insurance companies, and government agencies throughout the world (Rokaya, Budhathoki, and Lindenschmidt, 2018; Lindenschmidt et al., 2019; Burrell, Beltaos, and Turcotte, 2021). In the Northern Hemisphere, almost 60% of rivers experience significant seasonal effects of river ice. In 2017, the estimated economic cost of ice jam flooding in North America was 300 million United States dollars (USD) (Rokaya, Budhathoki, and Lindenschmidt, 2018). Climate change is expected to alter winter weather conditions and the patterns and timing of river ice formation and breakup (Beltaos, 2002; Burrell, Beltaos, and Turcotte, 2021; Cho, McCrary, and Jacobs, 2021).
Ice jam flood forecasting systems are used to identify ice jam evolution and reduce flood risks by informing governance systems. Flood warning systems for ice jams require detailed field observations and have a high level of uncertainty due to the time lag between observations and reporting and the complexity of ice cover breakup and jam formation. Ice jam flood forecasting systems are site-specific and require model inputs, such as bathymetry and ice geometry, that are difficult to collect due to the size of ice formations and the risks to personnel and equipment (Lindenschmidt et al., 2019). Additional research and higher resolution data are required to move from qualitative evaluations of ice (i.e., type, presence/non-presence) to quantitative estimates of ice volumes and spatial distribution (Alfredsen et al., 2018; Alfredsen and Juárez, 2020).
Remotely sensed satellite data is often insufficient to identify and quantify river ice in smaller streams and rivers (Alfredsen and Juárez, 2020). As a result, most satellite-based ice surveys are for large rivers and alternative methods are needed to monitor ice in smaller rivers and streams. UAS and SfM methods are well suited for complex river environments and provide a less expensive method to collect high-resolution, three-dimensional data on ice and land surface elevations and optical and thermal imagery of ice characteristics (Lindenschmidt et al., 2019; Wang et al., 2022), while also overcoming the difficulties of image acquisition and distortion of image collection from the shoreline (Wang et al., 2022). For small and medium sized rivers, UAS techniques may remove the need to access the ice and provide an amount and quality of data that cannot be matched by manual measurements (Alfredsen et al., 2018). Alfredsen et al. (2018) mapped river ice south of Trondheim, Norway using consumer-grade UAS and SfM software to survey the remnant of a stranded ice jam and an anchor ice dam. UAS data allowed for calculation of river cross sections and the volume of ice, an analysis not commonly produced due to the difficulty of collecting field measurements, as well as rapid identification of the ice formation mechanisms. Rødtang, Alfredsen, and Juárez (2021) used UAS SfM-generated DEMs of the riverbed, riverbanks, and ice conditions for a small river in central Norway to quantify ice volume and thickness distributions for calibration and evaluation of river ice models. They demonstrated the effectiveness of small UAS systems to accurately map the development of river ice during periods of freeze-up and break-up when collection of manual measurements is impossible. Because ice information is often needed in larger and longer reaches such as the Yellow River in China, fixed wing unoccupied aerial vehicles (UAVs) are an effective platform to extract floe size, ice cover, and ice condition (Lin et al., 2012). Another approach for capturing larger areas is to combine local measurements from UAS surveys with airborne observations. In a river south of Trondheim, Norway, where ice jams are common, Alfredsen and Juárez (2020) combined high-resolution DEMs and orthophoto mosaics of grounded ice with airborne LiDAR DEMs to model the river’s velocity and water levels in the presence of grounded ice.
In addition to supplying data for models and forecasts, mapping of ice jams is essential for understanding the extent, severity, and evolution of a jam. Palomaki and Sproles (2022) used ice surface roughness calculated from a UAS SfM-derived DEM to train a model to predict ice classes from Sentinel-1 SAR backscatter data for a river in Glendive, Montana, United States. The surface roughness measurements between datasets varied from fractions of a millimeter to a few centimeters, and the high-resolution SfM DEMs allowed for detection of surface roughness features that affect SAR backscatter. Garver, Capovani, and Pokrzywka (2018) employed UAS photogrammetry and SfM to study the structure and thickness of an ice jam in the Mohawk River, NY. UAS photogrammetry provided a method to gather data on floe dynamics and problematic jam points for a portion of the Mohawk River in a fast, comprehensive way. Wang et al. (2022) also tracked ice dynamics using feature tracking algorithms and 4K video footage collected by UAS in the Heilongjiang River in northern China. Compared to traditional ice velocity monitoring methods, their method increased precision and reduced time and labor costs. The rapid response applications of UAS photogrammetry were further demonstrated by Quirk and Haack (2019) for a river in Plymouth, NH. A UAS mission was requested by a state agency to collect imagery of flooding caused by an ice jam for planning emergency response activities. The U.S. Geological Survey was able to start collecting data within 4 hours and provided same day image mosaics which were used in briefings to the Governor, first responders, and news outlets (Quirk and Haack, 2019).
While many studies integrated UAS techniques into ice jam flood prevention through data collection and predictive modeling, a novel study by Song et al. (2015) explored the potential for GPR to identify areas for bombing the ice to reduce the threat of an ice jam flood in the Yellow River. An airborne, uncrewed helicopter mounted GPR was used alongside ground-based, hand-held GPR equipment to detect ice layer thickness for informing preventative measures, however, further work is needed to improve detection of thin ice layers and overcome barriers for real time transmission of GPR data.
3.4 Coastal and river erosion
In parts of Alaska and the Arctic, coastal inundation and erosion resulting from permafrost thaw and lack of sea ice during fall and winter storms are considered the most severe and immediate threats from climate-related environmental change (Markon et al., 2018; “Alaska Native Villages” 2009; “Climate change” 2023). Coastal inundation occurs when high water levels flood low lying areas, often resulting in infrastructure damage, erosion, and increased flow of salt water into groundwater aquifers. Erosion removes material from banks or cliffs due to wind, water, or landslides (Kilfoil et al., 2018). There are two main types of erosion that occur in cold regions: mechanical and thermal. Thermal erosion is caused by an increased flow of warm water that melts ground ice and mechanical erosion is driven by wave action, currents and/or sediment transport (Chassiot, Lajeunesse, and Bernier, 2020). In some cases, cold regions may experience both thermal and mechanical erosion. Preventative techniques such as rock walls, sandbags, and riprap only slow or displace erosion processes (Markon et al., 2018).
The result of increased erosion is a loss of terrestrial habitat and cultural resources and relocation of communities to safer terrain (Markon et al., 2018). In coastal areas, climate-induced decreased sea ice and delayed formation of landfast sea ice lengthens the ice-free seasons and leaves shorelines unprotected from intense storms (Markon et al., 2018; Chassiot, Lajeunesse, and Bernier, 2020). Sea level rise, higher water levels and ice-free conditions allow waves from storms to travel further inland and increase inundation, flooding, and mechanical erosion. Additionally, areas where permafrost is present are expected to experience three to four times more coastal erosion due to wave action acting on thawing sediments due to increasing sea temperatures (Stark et al., 2022). Arctic coasts in the U.S. and Canadian Beaufort Sea have experienced the largest measured increase in erosion rates, with an 80%–160% increase between the end of the 20th century and the 21st century (Jones et al., 2020).
In situ, airborne, and satellite monitoring methods have been used to study the geomorphology of coastal sediments and streambank erosion and retreat (Hamshaw et al., 2019; Mury, Collin, and James, 2019). Compared to in situ methods, airborne and satellite approaches can cover a large area with relatively low time and effort requirements. However, for a beach in Mont-Saint-Michel, France, Mury, Collin, and James (2019) determined that, despite being the least expensive data source, UAS-derived orthomosaics, DEMs and point clouds outperformed the crewed aircraft imagery and LiDAR surveys.
Traditionally, erosion rates and volumetric change for shorelines are calculated based on data collected over decades using airborne LiDAR systems flown every five to 10 years. UAS SfM and LiDAR surveys offer an alternative to calculate erosion rates for specific site locations at shorter time scales (e.g., seasonally, event-based) and to capture fine-scale erosion changes at higher spatial resolutions. UAS optical sensors and SfM techniques are commonly used to quantify seasonal changes in surface elevation and volumetric erosion rates, such as at a bluff site on Lake Michigan (Roland et al., 2021), as well as the recovery and stability following landslides (Kilfoil et al., 2018). Based on the studies identified (Supplementary Table S1), UAS LiDAR is a less frequently used sensor than optical for studying erosion. However, Troy et al. (2021) demonstrated the utility of UAS LiDAR combined with an RGB camera to survey elevation and volume change at two beaches along the coastline of Lake Michigan. Their color-coded LiDAR DSMs in combination with water levels and wave data, revealed that high water levels have a greater impact on erosion rates than wave energy.
A study by Kilfoil et al. (2018) on the west coast of the Northern Peninsula, Newfoundland and Labrador, Canada, demonstrated that UAS techniques can be used to quantify both sediment loss and sediment accumulation. Stopak, Nordio, and Fagherazzi (2022) used UAS aerial imagery and DEMs to evaluate the contribution of ice-rafted debris (IRD) to sediment supply following a January 2018 winter storm which deposited ice-rafted sediment in the Plum Island Estuary in Massachusetts, USA. IRD is a process which contributes to salt March sediment accretion in northern latitudes. A pixel-based land-cover classification of the UAS data and field measurements indicated that IRD contributed annual sediment accretion of 0.57 ± 0.14 mm/y to the site and that this one event contributed, on average, 20% of the annual volume of material accreted by salt marshes (Stopak, Nordio, and Fagherazzi, 2022).
Erosion rates from UAS data combined with traditional environmental variables (e.g., sea surface temperature, wind speed and direction) are advancing the science of erosion. Cunliffe et al. (2019) used UAS and satellite DSMs to observe the rapid retreat of a permafrost coastline on an island in the Canadian Beaufort Sea. When these DSMs were combined with local meteorological and oceanographic observations, the highly episodic erosion was determined to be influenced by thermal and mechanical conditions. Novikova et al. (2021) combined high-resolution UAS surveys and ArcticDEM data products with satellite imagery to distinguish erosion rates and processes between two different climates on the Kara Sea coast in Russia. The first site had a mild, cold climate with higher ice soil content, while the second site had a severe polar climate with a rocky coast. It was found that the first site in a mild, cold climate had a more dynamic coast and higher rates of erosion, likely due to the presence of longer ice-free periods, loose sediment, and ground ice.
3.5 Abrupt permafrost collapse and event-based thaw
Approximately 25% of the exposed land surface in the Northern Hemisphere is underlain by permafrost and much of the construction in the Arctic depends on permafrost stability (“Frozen Ground & Permafrost” 2022; Markon et al., 2018). Since 1980, global permafrost temperatures in polar and high mountain ranges have increased to record high levels (IPCC, 2019a). Climate models project that near-surface permafrost will likely disappear in approximately 24%–69% of the Arctic by the end of the 21st century (IPCC, 2019a). Not all permafrost thaw will be gradual; abrupt thaw is possible in less than 20% of the permafrost zone, but could affect up to half of permafrost carbon (Turetsky et al., 2020). Gradual thaw affects centimeters of soil over a period of decades, while abrupt thaw may affect meters of soil over a period of days to years. As a result, carbon emission models which only consider gradual thaw may substantially underestimate emissions (Turetsky et al., 2020). Thaw may also result in surface subsidence and formation of distinctive landforms (i.e., wetland, lake, hillslope); a process known as thermokarst. Thermokarst landscapes are estimated to occupy approximately 20% of the permafrost regions in the Northern Hemisphere (Mu et al., 2020; Chen, Liu, and Cheng, 2022). Thaw slumps, one of the most dynamic thermokarst processes, are created when melting occurs on a slope and causes sliding, resulting in significant impacts on thaw rates and terrain morphology (Mu et al., 2020). In addition to abrupt thermokarst collapses, event-based thaw (e.g., rain-induced permafrost thaw) poses similar concerns related to permafrost stability and emissions (Douglas, Turetsky, and Koven, 2020).
Much like other hazards, routine monitoring is necessary to investigate the drivers, impacts, and risks associated with these abrupt landscape changes and remote sensing methods are routinely used for observing these changes across landscapes. Gaffey and Bhardwaj (2020) noted that satellite imagery is often too coarse to capture important landform patterns in permafrost regions. UAS observations can bridge spatial and temporal gaps between satellite-based and field-scale observations of permafrost changes as needed to assess permafrost terrain dynamics and infrastructure impacts. High-resolution, quantitative time series data on the rate, drivers, and development of permafrost thaw collected by UAS are especially useful for studying rapid processes when combined with in situ validation methods for validation.
The most common use of UASs in permafrost regions is observing and quantifying abrupt thaw on slopes or in mountainous regions that caused visible changes to landforms. Vivero and Lambiel (2019) used UAS photogrammetry to study rapid topographic changes to an active rock glacier, a visible expression of creeping mountain permafrost. Surface kinematics were estimated using image correlation algorithms and visual inspection of orthophoto mosaics. Mu et al. (2020) combined field investigations, aerial photographs, satellite imagery from GeoEye-1 and Pleiades-1A, and UAS imagery to quantify the rapid acceleration in thaw slump activity over time in the alpine permafrost regions of the Qilian Mountains of the Qinghai-Tibetan Plateau (QTP). Elevation models were generated from UAS data to extract the elevations and headwall locations for each thaw slump. Hendrickx et al. (2022) used UAS photogrammetry, TLS, meteorological data, and rock subsurface temperature data to investigate the drivers of rock- and cliff fall events in high mountain environments of the Western Swiss Alps. UAS flights were used to map summer cliff falls that exposed permafrost and subsequent rapid degradation triggered rock wall failure and retreat.
Permafrost collapse is another abrupt thaw hazard that is well served by combining UAS imagery with in situ measurements and aerial and satellite remote sensing. Gao et al. (2021) combined data from in situ measurements, UAS, crewed aerial photographs, and satellite images to quantify the acceleration of permafrost collapse and spread since 2004 in the Tibetan Plateau. Compared to satellites, UAS data allowed for observation of collapses as small as 10 m2. Zhong et al. (2021) used a combination of TLS and UAS imagery to understand how ground temperature change, extreme precipitation, and human activity affect even finer-scale seasonal vertical deformation and headwall retreat of thermokarst landforms in the QTP. Christensen et al. (2021) used a time series of UAS imagery to document a dramatic gulley thermokarst resulting from extreme snowmelt in Zackenberg, Greenland in 2018. The resulting quantification of the thermokarst’s spatial and volumetric development were combined with climate and ecosystem data, model data, and eddy covariance data to investigate the total ecosystem disruption following the event. Turner, Pearce, and Hughes (2021) used UAS data products, including SfM-derived DEMs, multispectral, thermal, and irradiance data, combined with in situ measurements of sediment carbon and nitrogen to track volumetric change over a 3-year period for the largest active permafrost retrogressive thaw slumps (RTS) along the Old Crow River in Old Crow Flats, Yukon, Canada. They successfully documented the volumetric change, associated drivers (e.g., meteorology, orientation), thaw slump geomorphology, relationship with soil nutrients, and potential impacts on biogeochemical cycling.
UAS-based methods are an integral part of understanding impacts to the built environment from rapid permafrost thaw. Van der Sluijs et al. (2018) used UAS photogrammetry and thermal imaging to study permafrost thaw-induced RTS and thaw-driven evolution of anthropogenically disturbed terrain in the Northwest Territories, Canada. The combination of Airborne Laser Scanning (ALS) and repeat UAS surveys resulted in a time series of digital terrain models (DTMs) to estimate displaced material volumes from thaw slumping. Even when used by themselves, UAS systems can provide benefits for assessing the impacts of rapid permafrost thaw on the built environment. Kaiser et al. (2022) assessed the ability of off-the-shelf, low-cost, non-real-time kinematic (RTK) UAS photogrammetry without the use of GCPs to quantify sub-meter changes and future permafrost degradation risks to critical infrastructure along the Dalton Highway in the North Slope of Alaska. They found this low-cost workflow using open-source software to be appropriate for conducting ad hoc UAS surveys of abrupt and rapid land surface displacements.
3.6 Snow avalanches
Much like GLOFs, the occurrence of snow avalanches is relatively geographically limited because they are primarily associated with steep, mountainous terrain. However, despite their limited extent, they are a serious cold region hazard. Between winters 2012–2022, there were an average of 27 avalanche-related fatalities per year in the United States (“Avalanche Accident Statistics” 2022). An avalanche occurs when a fracture propagates across a steep (>30°), unstable, snow-covered slope. The fracture may be triggered by a natural event (e.g., sudden warming, large snowfall, earthquake) or by human activity (Schweizer et al., 2003). In some regions, climate change is increasing the frequency of rain-on-snow events which promote wet slab avalanche formation (Stimberis and Rubin, 2011; López-Moreno et al., 2021). Slope stability depends on snowpack stratigraphy, or the arrangement and properties of the layers that make up the snowpack (Nienow and Campbell, 2011). For example, strong, well-bonded snow situated above weaker, granular type snow results in increased avalanche risk. Avalanche risk also depends on snow accumulation, temperature gradients in the air and snowpack, and wind speed and direction (Schweizer et al., 2003).
Currently, avalanche forecasts and hazard assessments are carried out by avalanche centers at the regional scale (i.e., for individual mountains or ranges) using detailed information on local terrain and meteorological patterns. Avalanche danger ratings are assigned based on three factor classes: weather, snowpack, and stability (McClung, 2002; Jamieson, Campbell, and Jones, 2008). The rating provides a publicly available avalanche risk classification tool for decision makers and individuals in the region. Despite the importance of quantitative data on snow characteristics to measure critical triggering load for slope stability assessments, in situ data is only relevant for the slope where it was collected and fails to describe neighboring slopes or those with different aspects and elevations (Landry et al., 2002). While digging snow pits more frequently and in areas that are representative of surrounding slopes could improve stability assessments, it is often dangerous to conduct stability tests in potential avalanche zones (Birkeland and Chabot, 2006; Canadian Avalanche Association, 1995).
The effectiveness of remote sensing tools for identifying snow characteristics has been demonstrated for a variety of snowpack types. While current satellite-derived snow depth data can map snow depths at 2 m horizontal resolution with 0.5 m vertical accuracy, the accuracy of DEMs produced using satellite imagery and stereoscopic processing is less reliable on slopes steeper than 35° (Miller et al., 2022). Ground-based approaches using TLS are limited by field of view and shadowing from topographic features. Airborne laser scanning techniques overcome terrain-shadowing challenges but are often cost-prohibitive (Miller et al., 2022). UASs provide a method to collect regional, high-resolution data on slope stability and identify specific locations most at risk of avalanche while reducing human exposure. UAS-measured snow depths are more accurate than those achieved using high-resolution satellite photogrammetry (Deschamps-Berger et al., 2020). Much like satellites and airborne surveys, they operate from outside dangerous areas, however, the high spatial resolution of UAS sensors allows for identification of small-scale snow conditions and features important for avalanche forecasting at a lower cost than airborne techniques (Cimoli et al., 2017; Miller et al., 2022). UAS are also more adaptable than satellite platforms and have been used in post-disaster search and rescue operations and extent mapping (Bühler et al., 2016).
UASs can be used to monitor spatiotemporal changes in snow depth, which help inform estimates of potential avalanche likelihood and size. There are multiple sensors (e.g., optical, LiDAR, radar) available to observe snow surface conditions and elevation (i.e., snow depth) change (Bühler et al., 2016). Cimoli et al. (2017) compared minimal and advanced sensor setups to collect UAS data in Svalbard and Greenland to measure snow depth. The SfM-generated snow depth maps allowed analysts to distinguish hazards and assess snow surface conditions. A study in the Tatra Mountains located in the northern part of Slovakia used a fixed wing UAS and SfM to create snow depth maps of an avalanche prone slope to assess likelihood of slope failure. The authors emphasized the importance of using post process kinematic (PPK) or RTK techniques to reduce GPS errors and create accurate snow depth models (Masný, Weis, and Biskupič, 2021). Adams, Bühler, and Fromm (2018) also used UAS photogrammetry and SfM processing to compare visible and near infrared (NIR) spectra in avalanche terrain to improve snow depth model accuracy. The accuracy of the snow depth maps was validated with terrestrial laser scanner data and manual snow probing and authors determined that NIR imagery had greater accuracy (0.23 m) compared to visible imagery (0.37 m). Walter et al. (2020) used a UAS photogrammetry and a low-cost radar system to identify areas of increased snow accumulation resulting from blowing snow off a mountain ridge. Because meaningful placement of GCPs was not possible due to steep and dangerous slopes, an integrated sensor orientation using the UAS GNSS was used to achieve a mean positioning accuracy of 2.5 cm.
Data on avalanche risk and indicators is especially relevant in avalanche prone areas adjacent to critical infrastructure, such as roadways. The Norwegian Public Roads Administration (NPRA) compared UAS platforms and sensors to identify avalanche prone slopes that may impact roadways (McCormack and Vaa, 2019). Manual avalanche test pits, visual and NIR imagery, photogrammetry, and GPR data were collected and compared to create recommendations on sensors and UAS platforms for future NPRA use. While GPR is especially important for determining avalanche risk due to its ability to detect layering in the snowpack, its applications are limited by the high-level of post-processing required to turn raw data to useable products and the challenges associated with collecting data on steep and uneven slopes (McCormack and Vaa, 2019).
In cases where an avalanche has already occurred, UAS surveys may still be able to reduce human exposure to unstable terrain. Following an avalanche, responders are primarily focused on search and recovery to reduce fatalities. Domański (2022) conducted interviews with mountain rescuers and UAS pilots in the Mountain Volunteer Search and Rescue (GOPR) to assess the use of UAS in search and rescue in the Polish mountains. They concluded that while UAS are already used by GOPR to search for people and monitor avalanches, their use is limited partly due to the presence of more pilots than UAS platforms. While UAS applications for search and recovery are event-specific, UASs are generally deployed following an event to locate buried individuals via avalanche beacon or thermal imaging (Silvagni et al., 2017). Recent research has also investigated the potential for UAS detection of 4G LTE cell phone signals (Wolfe et al., 2015). Van Tilburg (2017) presented two examples of UAS-assisted search and rescue operations in Oregon, United States. The first used UAS to confirm a fatality in a slot canyon and keep rescue personnel out of harm’s way and the second used UAS to provide alternative viewing angles of dangerous terrain. Extent mapping following an avalanche is also important for understanding how it formed and the impacts. For example, UAS hyperspectral sensors have been used to map avalanche extent by measuring changes in reflectance between snow and avalanche debris (Bühler et al., 2009; Eckerstorfer and Bühler, 2016).
3.7 Winter storms
Winter storms bring cold temperatures, freezing rain, snow, ice, and high winds. Types of winter storms include snowstorms, blizzards, lake effect storms, and ice storms (“Winter Storms” 2022). Winter storms are particularly relevant to this discussion because they may result in the necessary conditions to create other hazards. Between 1949 and 2000 freezing rainstorms alone accounted for 87 catastrophic events in the United States, resulting in losses totaling 16.3 billion USD. However, national-scale, climate-based approaches for assessing damages based on ice thickness and storm size have been limited by the lack of sufficient data to define these conditions (Changnon, 2003).
Remote sensing has long been used by weather forecasters to provide meteorological observations and data. Satellite remote sensing provides visual imagery and environmental variables such as atmospheric temperature and moisture profiles, making it a valuable tool for filling gaps between ground-based weather monitoring stations (“Weather Forecasting Through the Ages” 2002). Due to the limited spatial extent of UAS compared to satellites, they serve a very different purpose for predicting and understanding winter storms and use very different techniques than the previously discussed hazards. Unlike space-borne remote sensing platforms, there are many hurdles to UAS operations in winter storm conditions (Gao et al., 2021). Despite this, several studies have demonstrated applications for collecting high-resolution data on atmospheric boundary layers during storm events and for monitoring impacts following winter precipitation events. Profiles of atmospheric parameters are necessary for monitoring and predicting synoptic (i.e., large scale) disturbances and weather events in remote regions (Inoue and Sato, 2022). This data is traditionally collected by radiosondes that are typically carried by weather balloons (“Radiosondes—an Overview” 2015). The radiosonde observing networks in polar regions provide critical tropospheric and stratospheric measurements, but are limited by operation costs (e.g., sensors and human resources) and the generation of waste (i.e., used balloons, radiosondes) over land and oceans (Inoue and Sato, 2022).
UAS are being piloted as a potential alternative to radiosondes. Inoue and Sato (2022) developed an inexpensive UAS (<4,000 USD) to collect meteorological data equivalent to that of radiosondes in northern Japan during winter conditions. Their findings indicated that, despite the lack of real-time data transmission, the inexpensive UAS had similar performance as the radiosonde air temperature sensors and had the best temperature performance (accuracy 0.2°C ± 0.4°C) of the UAS tested. Tripp, Martin, and Reeves (2021) also demonstrated the value of a UAS equipped with a temperature and humidity sensor alongside iMet-4 radiosondes to collect boundary layer measurements for a February 2019 winter storm in Oklahoma. Weather events in cold regions and sudden changes in atmospheric conditions also have implications for the safety and efficiency of aviation. Gultepe et al. (2019) used various meteorological sensors, including a weather and environmental UAV (WE-UAV), to study atmospheric boundary layer processes and parameters for aviation applications. Data collected by the WE-UAV was combined with observations from multiple sites (e.g., fog and snow tower observations) to produce information applicable to aviation meteorology including planetary boundary layer weather research, validation of numerical weather model predictions, and remote sensing retrievals.
Despite their operations being limited to the lower boundary layer, UASs present an alternative method for collecting profiles of near-surface atmospheric parameters to complement existing polar observing systems. At higher elevations, fixed-wing UAS have been used to investigate hurricanes and other events in mid-latitude regions since the early 2,000s, The large Global Hawk UAS has been used with dropsondes for hurricane prediction as well as in the Arctic for capturing characteristics of the polar vortex, surface inversions, and low-level jets (Inoue and Sato, 2022). In 2015–2016, the Global Hawk UAS was used to collect data to improve forecasting of major winter storms over the Pacific Ocean. The in situ and remote sensing observations collected during the project demonstrated “significant positive forecast benefits” when included in forecasting of high-impact weather events on global and regional scales, especially in cases where there was a gap in polar satellite observations (Dunion et al., 2018). A study by Choi et al. (2018) focused on sampling the troposphere at an altitude of 16–20 km. This altitude is directly above the troposphere and is where most weather dynamics take place. As part of their study, three compact microwave radiometers were deployed along with optical cameras and in situ sensors on the High-Altitude, Long Endurance UAV (HALE UAV) to obtain vertical temperature profiles and column-averaged water vapor for the entire troposphere. Calibration flights demonstrated that the platform was able to reach two-thirds of its target altitude.
4 Discussion and future directions
Despite their widespread use, effective utilization of UAS techniques in cold regions requires consideration of the limitations which may negatively impact surveys. While the growing body of literature provides examples of UAS applications for cold region abrupt hazards (Supplementary Table S1), it also provides insights into the current state of knowledge. Many of these applications use either SfM or optical imagery to support their results (Figure 3). Some applications, sensor modalities and data products have yet to be fully explored. Based on the literature summarized in Supplementary Table S1, this review identified four key topics to be addressed for future research to expand upon these applications. Future improvements to UAV platforms and sensors will continue to create new opportunities for UAS in cold region environments. However, if these topics are not addressed it is likely that they will limit new potential applications. Current applications are challenged by technological limitations, operational rules and restrictions, environmental conditions, and/or the lack of existing use cases to support their utility. Despite current limitations, the studies in this review have demonstrated that UAS data products are especially useful when combined with other data types and resolutions. However, even in cases where the utility of UAS data collection has been clearly demonstrated, there is still a notable lack of integration with risk communication frameworks, response plans, and damage assessments. A discussion of each of these topics and suggestions for how they may be addressed by future research is included below.
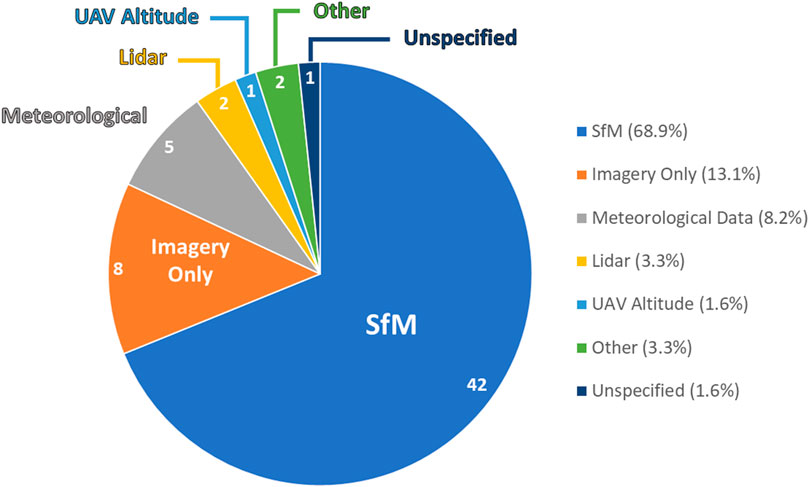
FIGURE 3. Data types produced by UAS sampling techniques.
4.1 Topic 1: implementation of new technologies
Significant barriers still exist for the implementation of new UAS technologies, especially those that go beyond low-cost optical sensing and SfM techniques. As compared to optical sensing, advanced UAS operations, such as LiDAR, hyperspectral, and radar are increasingly limited by the expertise of the operator and the characteristics of the UAS platform selected (i.e., battery life, weight, size). Sensor payload configuration has a major influence on the selected UAS platform’s flight endurance (Choi et al., 2018; Mohsan et al., 2023), with heavier sensors requiring more power consumption to stay airborne and therefore limiting the effective range of the system (Wigmore and Mark, 2017). Larger UAS platforms are also less transportable, making flights in remote areas difficult or impossible. Small, lightweight UAS platforms can be easily transported to most sites but are still confined to flying over relatively local scales due to limited onboard power supply.
These challenges are exacerbated in cold or mountainous regions which are often subject to less-than-optimal flight conditions. Considerations for platform malfunction and recovery in the event of a lost connection or a rapid change in conditions are essential in challenging cold region environments (Flener et al., 2013). Cold region meteorological conditions (e.g., solar radiation, wind speed, temperature, precipitation) may impact power usage and sensor performance (Gultepe et al., 2019; Novikova et al., 2021). While cold temperatures increase lift, they also decrease battery life. Strong winds and turbulence also increase power consumption and may cause structural damage (Rajawat, 2021). High elevations in the mountains have low air density, reducing overall UAS performance, flight times, and lifting capacity, making it difficult, or impossible, to carry heavier sensors (Ranquist, Steiner, and Argrow, 2017; Wigmore and Mark, 2017). In areas with steep or variable slopes, maintaining a constant height above the ground surface (i.e., terrain following) is important for ensuring that UAS operations are below the maximum allowable altitude, sensors stay within range of their target, and that there is low variability in the resolution and scale of imagery. Some UAS flight planning software allows the user to reference an existing DEM for terrain following. However, adjusting for elevation throughout the flight adds additional battery drain which reduces overall flight time (Burchfield et al., 2020). Lastly, adverse weather such as precipitation or fog reduces visibility and contributes to the buildup of moisture on UAS components. Buildup of ice on UAS propellers reduces thrust and lift while increasing drag, resulting in higher power consumption and decreased speed (Rajawat, 2021). In addition to negatively impacting UAS performance, icing slows sensor response time and results in erroneous measurements, making mitigation of ice buildup crucial for successful data collection (Tripp, Martin, and Reeves, 2021).
Despite the variety of sensors currently available for UAS surveys, most applications for abrupt cold region hazards have relied on optical imagery and/or SfM photogrammetry. It is unclear whether this is due to the lower cost of SfM techniques, reduced energy consumption associated with carrying lightweight cameras, the complexity of analyzing data from other sensor types, or lack of relevance for surveying the hazard types discussed. Many of the studies also identified specific challenges associated with image acquisition from UAS platforms. Image accuracy for UAS-mounted cameras may be reduced due to camera stability and orientation in turbulent conditions (Perks, Russell, and Large, 2016; Karamuz, Romanowicz, and Doroszkiewicz, 2020). Image distortion, especially near the edges of an image (e.g., vignetting), is also common (Kaiser et al., 2022). Sensor targets may also be inconsistent due to variable surface texture and homogeneity (Miller et al., 2022), as well as changing lighting conditions. Cloud cover and low lighting are common in winter, and poor surface illumination conditions pose challenges for optical sensors (Bondi et al., 2016; Alfredsen and Juárez, 2020). Presence of shadows and high contrast lighting also reduce sensor performance and may result in feature tracking errors (Alfredsen et al., 2018; Vivero and Lambiel, 2019). In addition to presenting challenges for optical data collection, poor lighting conditions also negatively impact the performance of SfM image processing. Furthermore, SfM requires that objects within the image remain still during sampling, making areas with moving objects (e.g., wind-blown vegetation and surface water) subject to higher degrees of inaccuracy (Stopak, Nordio, and Fagherazzi, 2022). Data quality may be further reduced depending on the performance of autonomous navigation (including obstacle avoidance) and auto camera settings, especially when calibration is required before flight and is not adjustable during sampling (Alfredsen et al., 2018). For example, in cases where terrain following is not used or had poor performance, operators must consider the impacts of changing ground distance relative to the UAS sensor including degraded sensor accuracy and variable resolutions (Burchfield et al., 2020; Gao et al., 2021).
Many studies, particularly earlier studies, discussed strategies and limitations regarding the high level of positional accuracy required for UAS data collection. In complex mountainous terrain, well-spread GCPs may be required to obtain accurate observational products. GCPs must be manually placed and surveyed, a challenging and time-intensive task in dangerous environments and on slopes with significant elevation change (Walter et al., 2020). Alternatives to GCPs (e.g., RTK, PPK) have become more common in recent years but their relative accuracy and effectiveness are still being evaluated (Fraser et al., 2022). Recent studies often used UAS systems which included RTK or PPK GNSS positioning to help improve positional accuracy. These methods require the use of a GNSS receiver (rover) and base station (base). The base station remains stationary during the duration of the flight and either transmits correction information to the rover in real-time (RTK) or during post-processing after completion of the survey (PPK). While RTK/PPK positioning can be completed without known base station coordinates, the global accuracy of UAS products is reduced (“Critical Factors Affecting RTK Accuracy” 2023). However, even the use of a GNSS base station cannot completely eliminate the occurrence of positional errors, as RTK/PPK is limited by the base station signal range, processing time, and the need for continuous, real-time signal communication (“Real Time Kinematics” 2011).
These considerations, in addition to the necessary training and licensing, create a major barrier to purchasing a UAV and the associated equipment for cold region research applications. Moreover, this technology is changing rapidly, making it difficult to invest in equipment that will quickly become obsolete. It is unlikely for a single UAS platform to meet all of the needs for a certain application, especially over the lifetime of a multi-year study (McCormack and Vaa, 2019). Updating and improving sensors and payloads often comes with increased weight and the need to upgrade the UAV, increasing overhead due to equipment costs, flight endurance, regulations, and pilot certifications (Cimoli et al., 2017). Despite the decreasing cost and necessary expertise for operation of remote sensing technologies (e.g., LiDAR), many high accuracy sensors are still difficult to implement due to their cost, complexity, and size. Implementation of these technologies requires providing operators with information on how to balance these factors for their specific application. Currently, this responsibility often falls to the vendors and end users. Some studies have shown that low-cost sensors can provide similar actionable information as more expensive ones, further decreasing the incentive to invest in the implementation of new and emerging technologies (Kaiser et al., 2022; King, Kelly, and Fletcher, 2023). However, some applications necessitate further development of high-resolution sensors to capture fine-scale data or overcome limitations of existing sensors (e.g., minimum depth resolution for GPR, LiDAR for bathymetric surveys) (Song et al., 2015; Troy et al., 2021).
As technology advances, the decreasing cost and increasing reliability and availability of sensors and platforms will likely reduce many of these current challenges. In the near-term, additional effort is needed to address barriers to the use of alternative platforms and sensor types for cold region applications. Possible solutions for overcoming barriers may include community instrumentation pools, training on the sensors or sensor selection for a given hazard, better access to data processing software (e.g., open-source tools), and identification of specific technological advancements to meet the field’s evolving needs. Increased dialog among relevant communities of practice as well as equipment vendors is essential for developing effective trainings, tools, and technologies.
4.2 Topic 2: site limitations and operational restrictions
UAS surveys in remote areas require long travel and more equipment and personnel, increasing the costs of sampling campaigns. This is especially true in high-latitude sites where the cost of access can be substantial, potentially contributing to an uneven distribution of monitoring sites (Cunliffe et al., 2019). During data collection, UAS operators must also stay within range of the UAS radio transmitter, so takeoff must occur close to the study area. Site conditions, such as canopy cover, may further complicate deployment and normal operation of the UAS platform (Troy et al., 2021). Universal site limitations for UAS are those imposed by the airspace in which they operate. For example, air space restrictions imposed by the U.S. Federal Aviation Administration (FAA) only allow UAS flights in uncontrolled airspaces below 121.9 m above ground level. Flights are restricted in controlled airspaces serviced by air traffic control (e.g., airport airspace) as well as in special use airspaces such as those around military operation areas, secure locations, hazardous areas (e.g., artillery firing), and wildlife refuges/national parks (Pilot’s Handbook of Aeronautical Knowledge, 2016). Other operational restrictions from the FAA require that UAS remain in visual line-of-sight (VLOS) for the duration of the flight (“14 CFR Part 107” 2016).
Similar restrictions exist in other countries, such as those imposed by the European Union Aviation Safety Agency (EASA). The EASA organizes UAS operations into use categories based on the weight and intended operation, but still requires UAS operations to be within visual line of sight, below 120 m from the ground surface, and outside of restricted airspace unless approved by the competent authority designated by the EASA Member State (“Easy Access Rules for Unmanned Aircraft Systems” 2022). In some cases, regardless of existing restrictions or approvals, surveys may still not be flown due to political restrictions, such as those in transboundary glaciated regions (Bazai et al., 2021).
While agencies like the U.S. FAA offer waivers for some restrictions with prior approval (e.g., operations within controlled airspaces) (Pilot’s Handbook of Aeronautical Knowledge, 2016), this is currently an arduous process which limits applications that require frequent sampling or that must occur within a specific timeframe leading up to an event. A list of waivers issued for UAS operations is available on the FAA website (“Part 107 Waivers Issued” 2023). The FAA also provides expedited approval for first responders and other organizations through the Special Governmental Interest process, but this process is limited to those responding to natural disasters or other emergency situations (“Emergency Situations” 2023). In non-emergency situations, existing restrictions may prevent further development of a UAS application with potential to reduce risks to personnel operating in remote or dangerous environments.
Abrupt hazards may occur infrequently and be difficult to predict, making data collection challenging when they coincide with restricted air spaces (Lin et al., 2012; Tripp, Martin, and Reeves, 2021). Providing more flexibility for UAS operations for hazard preparedness and mitigation has the potential to improve their utility in emergency situations and increase understanding of hazards before they occur. Operational restrictions that limit the use of emerging technologies slow or prevent the implementation of new techniques that increase current understanding of cold region hazards. For example, while UAS networks are of considerable interest for large-scale meteorological surveys, they are restricted by beyond VLOS operations in the presence of low cloud bases (Tripp, Martin, and Reeves, 2021). While existing regulations are important for reducing the risks associated with UAS operations, they are offset by the potential risk reduction in hazardous cold region environments. These limitations indicate the need for more dialog among the research community, hazard response agencies, and regulatory agencies regarding methods to streamline the waiver process, facilitate research to predict or mitigate future hazards, or develop more flexible restrictions in hazard-prone areas to reduce risks for personnel and equipment.
Two such examples can be found in snow-covered regions. When avalanche risk is increasing over time, explosions may be used to intentionally trigger a slope failure before the hazard can impact humans or infrastructure (Simioni and Schweizer, 2013). This approach allows for control over the timing and starting location of an avalanche to reduce accidental initiation by civilians. UASs provide a novel approach for delivering explosives to remote avalanche zones from outside potential hazard areas using real time imagery (McCormack and Stimberis, 2010). There are many barriers to this approach and potential applications vary widely by country. For example, the U.S. FAA has restrictions on permitting UAS weaponization and flying beyond VLOS (“Small Unmanned Aircraft Systems UAS Regulations Part 107” 2020). Despite these restrictions, potential uses for this methodology are being explored. In addition to explosive payloads, restrictions also exist for sensor payloads. Valence et al. (2022) explored the potential applications of GPR for collecting data on snowpack hydrological characteristics in Quebec, Canada. Most GPR applications to date have required the instrument to be towed by the operator, but airborne and vehicle based GPR applications have risen in popularity (Valence et al., 2022). UAS-mounted GPR can increase the capability to survey avalanche conditions by reducing the need for operators to travel in avalanche-prone terrain and increasing the number of slopes that can be evaluated during a survey compared to hand dug pits (McCormack and Vaa, 2019). Despite its demonstrated potential, UAS surveys using GPR are limited by regulations from the U.S. FAA and U.S. Federal Communications Commission which require operation in close proximity (1 m) from the ground, limiting the sensor’s spatial coverage (“ET Docket 98-153” 2002).
4.3 Topic 3: knowledge gaps
Even if regulations for UAV platforms and sensors become more flexible regarding the use of new sensing technologies and alternative sampling methodologies, this review has demonstrated that UAS surveys are still most effective when combined with other data types and resolutions. Synthesis with other remote sensing techniques and in situ sampling is still relatively ad hoc. There are opportunities to overcome the limitations of UAS datasets by supplementing existing data or utilizing new or alternative sensor types in a systematic manner (Zhang, 2010; Lei et al., 2022; Villalpando et al., 2023). The spatial and temporal scale of data collected by UAS allows it to span the boundary between field data and satellite or modeled data to provide information about conditions within a satellite grid cell. Troy et al. (2021), suggested combining UAS bathymetric data with existing surveys to fill gaps between the two data types at different spatial scales. Tripp, Martin, and Reeves (2021) proposed using synthetic observations from mesoscale models to simulate sub-hourly data for UAS surveys of atmospheric conditions. Healy and Khan (2022) compared UAS SfM-derived glacial ablation (i.e., water equivalent) with discharge data collected by the Nooksack Indian Tribe for the Sholes Glacier in the North Cascades range to assess the impacts of short but intense warming events. Challenges still exist for comparing UAS and satellite data across different resolutions, such as those encountered by Palomaki and Sproles (2022) when UAS ice surface roughness measurements did not meet the threshold criteria to conclusively delineate roughness compared to Sentinel-1 microwave backscatter.
In addition to bridging gaps among different types of data, UASs have also been used to fill gaps between similar data types collected at different spatial and temporal scales. Filling spatial and temporal data gaps is essential for researching abrupt hazards that occur over small areas or relatively short time frames. This is especially true in regions where satellite data is limited by cloud cover and in situ data collection poses increased risks to personnel and equipment, such as glacial environments (Śledź, Ewertowski, and Piekarczyk, 2021). Using UAS data for gap filling allows for better change detection (Flener et al., 2013), especially in cases where change may be episodic (e.g., shorelines) rather than continuous (Troy et al., 2021). Other examples include Jouvet et al. (2017) UAS-enabled tracking of a fracture at the calving front of the Bowdoin Glacier and Nie et al. (2020) use of low-cost, high-resolution UAS data of lake surface elevations before and after a GLOF event to reconstruct historical GLOFs in High Mountain Asia.
Opportunities to synthesize UAS data with existing data types are emerging, offering new perspectives and understanding of cold region processes. For example, Varner et al. (2022) created a timeseries of trace gas radiative forcing for Stordalen Mire in northern Sweden based on vegetation types classified from UAS imagery to identify the relationship between vegetation composition and improve estimates of CO2 and CH4 exchange. de la Barreda-Bautista et al. (2022) synthesized UAS imagery and Interferometric Synthetic Aperture Radar (InSAR) data to identify subsidence rates over a large spatial extent and to estimate surface motion at the local level caused by permafrost thaw in sub-Arctic peatlands in Sweden. Freitas et al. (2022) used satellite and UAS data (RGB and multispectral) to improve the detection, classification, and monitoring of optically diverse, vegetated thermokarst lakes and ponds in Nunavik, Canada.
Improvements to the accuracy of UAS remote sensing techniques combined with technological improvements will make data collection of fine scale changes in hazardous areas increasingly practical and accessible in the future (Turner, Harley, and Drummond, 2016). Recent literature in these fields has identified potential improvements for measuring fine-scale changes with UAS. Miller et al. (2022) determined that, while previous snow depth research typically utilized a 1 m resolution, a spatial resolution of 0.5 m was necessary to accurately capture the spatial variability at their mountainous site in the Bridger Range of Montana, United States. Another example from Fraser et al. (2022) identified potential strategies to measure smaller (<0.1 m) ground elevation changes to characterize permafrost-driven surface dynamics and determined that an RTK-enabled, high-resolution (<1 cm) UAS survey with only one fixed GCP captured ground elevation changes within 0.6 cm.
Several studies identified the need for more frequent UAS data collection to create larger datasets that span a range of conditions (Turner, Pearce, and Hughes, 2021; Palomaki and Sproles, 2022) and to allow for refinement of the relationships between data types (e.g., UAS-derived volume change and seismic signals for rockfall events) (Hendrickx et al., 2022). However, collecting UAS data at high spatial and temporal resolutions requires a significant time commitment and may necessitate extended sampling campaigns which may make the study impractical depending on the associated cost and personnel requirements. It is not uncommon for mountainous conditions to prevent UAS operations for consecutive days or weeks (Eckerstorfer et al., 2016). The combination of uncertainty in local forecasts and modest maximum wind and temperature thresholds of UAS platforms makes flight planning in these conditions even more challenging (Gultepe, 2015). Despite these challenges, it has been shown that UAS data can be used to improve interpolation between point-based in situ data, fill temporal data gaps between satellite overpasses, provide data at a very high spatial resolution, monitor rapidly evolving hazards, and connect different data types to provide a more holistic investigation of hazards. As the barriers for accessing new technologies and techniques are reduced, it is likely that improving data integration across spatial and temporal scales will require cross-disciplinary approaches that bring together both quantitative and qualitative data types (Zhang, 2010).
4.4 Topic 4: data relevance for risk communication and damage assessments
The studies discussed in this review are mostly research focused and rarely address specific needs for hazard risk communication and response. For example, because avalanche risk assessment is not only informed by UAS snow depth products, the required accuracy is sensitive to the usage context (Masný, Weis, and Biskupič, 2021). Similarly, the need to post-process data, such as GPR and LiDAR, limits their usefulness for transportation professionals making real-time decisions (McCormack and Vaa, 2019). Existing and proposed UAS technology for risk assessment would benefit from new software or data analysis tools to improve early detection of hazards and provide these data in formats that can be directly integrated into existing forecasts, information broadcasts, and traffic planning applications (McCormack and Vaa, 2019; Sziroczak, Rohacs, and Rohacs, 2022).
In addition to their utility for risk communication and mitigation, UASs can also be used to assess direct damages following cold weather storm events. They are already widely applied in transmission line inspection because they provide an economical and flexible way to collect imagery of current conditions (Guo and Hu, 2017). In the future, other UAS applications might also include inspection, monitoring, and assessment of bridge infrastructure, building damage, pipelines, geotechnical stability, and roadways (Adams, Levitan, and Friedland, 2014; Cunningham, 2017; Van der Sluijs et al., 2018; Mandirola et al., 2022).
Public health and safety in hazard-prone areas would benefit from future studies on abrupt cold region hazards that include considerations for data utilization for risk communication and mitigation prior to a hazard as well as post-hazard damage assessments. Future needs include improved data presentation for stakeholders and information dissemination to the public (Kilfoil et al., 2018). These improvements would not only benefit the public, but also researchers who regularly operate in these regions. By working in tandem with end users responsible for hazard communication and response, new studies can fill critical gaps in understanding of these hazards in ways that also fit into existing response and communication frameworks.
5 Conclusion
Collectively, the studies reviewed here demonstrate the advantages of UAS remote sensing over satellite- or airborne-based remote sensing alone for monitoring abrupt hazards in cold regions. Each example showed the capacity for UAS platforms to collect much needed data despite the limitations of UAS operations in cold regions. While UASs also experience limitations outside of cold regions, the conditions in cold environments negatively impact the flight times and performance of UAS platforms and components and the reliability and measurement quality of the instruments they carry. In addition, many cold regions are also located in remote or mountainous regions, therefore decreasing accessibility, making deployment of personnel or equipment difficult or dangerous, and in some cases reducing ability to validate data.
Most of the studies identified in this review used either SfM-created 3D models or optical imagery to support their results. Many utilized UAS alongside other remote sensing and in situ sampling techniques. Frequently, the UASs were used to supplement existing data with higher spatial or temporal resolution data or to collect additional types of data not included in existing datasets. In many cases, the addition of UAS sampling techniques provided a deeper understanding of the process or event of interest through creation of 3D models, collection of high-resolution imagery, or improvement of model forecasts.
As the frequency and intensity of abrupt cold region hazards changes (Druckenmiller, Thoman, and Moon, 2022; Lee et al., 2023), it will become increasingly important to document and understand these changes to support scientific advances and hazard management. The increasing accessibility and decreasing costs of UASs will likely make them a standard part of acquiring this data (Du et al., 2019; Quirk and Haack, 2019; Gaffey and Bhardwaj, 2020). Impacts from these abrupt cold region hazards pose a great risk in areas highly vulnerable to the effects of climate change and where observational networks and historical data are too limited for accurate prediction, understanding, and response. Overcoming challenges related to implementation of new technologies, modifying operational restrictions, bridging gaps between data types and resolutions, and creating data tailored to risk communication and damage assessments will increase the potential for UAS applications to improve the understanding of risks and to reduce those risks associated with abrupt cold region hazards.
Author contributions
MV wrote the first draft of the manuscript and the abstract, introduction, definition of cold regions section, several applications sections, discussion and future directions, and conclusion. JJ provided subject matter specific guidance, revisions, and final approval of the manuscript. EC, LD, IK, and CW each conducted literature review and wrote individual applications sections. AH provided revisions and additional content. All authors contributed to the article and approved the submitted version.
Acknowledgments
This research gratefully acknowledges support from NASA Terrestrial Hydrology Program (NNH16ZDA001N). IK is partially supported by the Fulbright Foreign Student Program. The authors would like to acknowledge Tim Hoheneder (UNH) for creation of Figure 2. They would also like to acknowledge Alix Contosta (UNH) and Lee Friess (UNH) for reviewing the manuscript. The authors also thank the editor and the two reviewers for their time and input on this manuscript.
Conflict of interest
The authors declare that the research was conducted in the absence of any commercial or financial relationships that could be construed as a potential conflict of interest.
Publisher’s note
All claims expressed in this article are solely those of the authors and do not necessarily represent those of their affiliated organizations, or those of the publisher, the editors and the reviewers. Any product that may be evaluated in this article, or claim that may be made by its manufacturer, is not guaranteed or endorsed by the publisher.
Supplementary material
The Supplementary Material for this article can be found online at: https://www.frontiersin.org/articles/10.3389/frsen.2023.1095275/full#supplementary-material
Footnotes
1GLOFS: Photograph illustrating the variability of glacier-dammed lakes and Blockade Glacier by Austin Post, https://library.usgs.gov/photo/index.html#/item/51dda377e4b0f72b4471e0fd, courtesy of U.S. Geological Survey, U.S. public domain
2Snowmelt flooding: Winter Snows by Randolph Femmer, U.S. Geological Survey, https://www.flickr.com/photos/27784370@N05/16379395862/, licensed under CC0 1.0
3Coastal & River Erosion: Erosion damage, by U.S. Fish and Wildlife Service, https://www.flickr.com/photos/usfwshq/6094143432/, licensed under CC BY 2.0
4Abrupt Permafrost Collapse: Climate Impacts to Arctic Coasts by Benjamin Jones, U.S. Geological Survey, https://www.flickr.com/photos/27784370@N05/32682616471/, Public Domain Mark 1.0
5Winter Storms: Winter Storm Landon by Dan Keck, https://www.flickr.com/photos/140641142@N05/51861879928/, licensed under CC0 1.0
6Snow Avalanches: Close-Up Photo of Snow Avalanche on Mountain by Lucas Suárez, https://www.pexels.com/photo/close-up-photo-of-snow-avalanche-on-mountain-13170400/
7Ice Jams: Kiiminkijoki Haukipudas 20120429b by Estormiz, https://commons.wikimedia.org/wiki/File:Kiiminkijoki_Haukipudas_20120429b.JPG, reproduced via Wikimedia Commons, licensed under CC0 1.0
References
14 CFR Part 107 (2016). National archives: code of federal regulations. Available at: https://www.ecfr.gov/current/title-14/chapter-I/subchapter-F/part-107.
Adams, M. S., Bühler, Y., and Fromm, R. (2018). Multitemporal accuracy and precision assessment of unmanned aerial system photogrammetry for slope-scale snow depth maps in alpine terrain. Pure Appl. Geophys. 175 (9), 3303–3324. doi:10.1007/s00024-017-1748-y
Adams, S. M., Levitan, M. L., and Friedland, C. F. (2014). High resolution imagery collection for post-disaster studies utilizing unmanned aircraft systems (UAS). Photogrammetric Eng. Remote Sens. 80 (12), 1161–1168. doi:10.14358/PERS.80.12.1161
Alaska Native Villages (2009). Report to congressional requesters. GAO. Washington: Government Accountability Office.
Alfredsen, K., Haas, C., Tuhtan, J. A., and Zinke, P. (2018). Brief communication: mapping river ice using drones and structure from motion. Cryosphere 12 (2), 627–633. doi:10.5194/tc-12-627-2018
Alfredsen, K., and Juárez, A. (2020). Modelling stranded river ice using LiDAR and drone-based models. Madrid, Spain: IAHR.
Anacona, P. I., Iribarren, P., Mackintosh, A., and Norton, K. (2015). Reconstruction of a Glacial Lake outburst flood (GLOF) in the engaño valley, Chilean patagonia: lessons for GLOF risk management. Sci. Total Environ. 527–528, 1–11. September. doi:10.1016/j.scitotenv.2015.04.096
Andreassen, L. M., Paul, F., Kääb, A., and Hausberg, J. E. (2008). Landsat-derived glacier inventory for jotunheimen, Norway, and deduced glacier changes since the 1930s. Cryosphere 2 (2), 131–145. doi:10.5194/tc-2-131-2008
Avalanche Accident Statistics (2022). Colorado avalanche information center. Available at: https://avalanche.state.co.us/accidents/statistics-and-reporting.
de la Barreda-Bautista, B., Boyd, D. S., Ledger, M., Siewert, M. B., Chandler, C., et al. (2022). Towards a monitoring approach for understanding permafrost degradation and linked subsidence in arctic peatlands. Remote Sens. 14 (3), 444. doi:10.3390/rs14030444
Bates, R. E., and Bilello, M. A. (1966). Defining the cold regions of the northern Hemisphere. Hanover, New Hampshire: U.S. Army Materiel Command, Cold Regions Research & Engineering Laboratory, 18.
Bazai, N. A., Cui, P., Carling, P. A., Wang, H., Hassan, J., Liu, D., et al. (2021). Increasing Glacial Lake outburst flood hazard in response to surge glaciers in the Karakoram. Earth-Science Rev. 212, 103432. January. doi:10.1016/j.earscirev.2020.103432
Beltaos, S.(2002). Effects of climate on mid-winter ice jams. Hydrol. Process. 16 (4), 789–804. doi:10.1002/hyp.370
Benn, D. I., Bolch, T., Hands, K., Gulley, J., Luckman, A., Nicholson, L. I., et al. (2012). Response of debris-covered glaciers in the mount everest region to recent warming, and implications for outburst flood hazards. Earth-Science Rev. 114 (1–2), 156–174. doi:10.1016/j.earscirev.2012.03.008
Berg, B., and Bassis, J. (2022). Crevasse advection increases glacier calving. J. Glaciol. March, 1–10. 1–10. doi:10.1017/jog.2022.10
Berghuijs, W. R., Woods, R. A., Hutton, C. J., and Sivapalan, M. (2016). Dominant flood generating mechanisms across the United States. Geophys. Res. Lett. 43 (9), 4382–4390. doi:10.1002/2016GL068070
Biancamaria, S., Lettenmaier, D. P., and Pavelsky, T. M. (2016). “The SWOT mission and its capabilities for land Hydrology,” in Remote sensing and water resources. Editors A. Cazenave, N. Champollion, J. Benveniste, and J. Chen (Cham: Springer International Publishing), 117–147. Space Sciences Series of ISSI. doi:10.1007/978-3-319-32449-4_6
Birkeland, K. W., and Chabot, D. (2006). “Minimizing” false stable” stability test results: why digging more snowpits is a good idea,” in Proceedings of the 2006 International Snow Science Workshop, Telluride, Colorado, October 2006, 498–504.
Bondi, E., Salvaggio, C., Montanaro, M., and Gerace, A. D. (2016). “Commercial + scientific sensing and imaging,” in Calibration of UAS imagery inside and outside of shadows for improved vegetation index computation. Editors J. Valasek, J. Alex Thomasson, and 98660J (Baltimore, Maryland, United States: SPIE). doi:10.1117/12.2227214
Bormann, K., Kormos, P. R., Lhotak, J., Miller, W. P., Shanahan, S., Deems, J., et al. (2019). Tangible use of airborne snow observatory SWE products for enhanced runoff forecasting. AGU Fall Meet. Abstr. 2019, H33I–H2046. December.
Bühler, Y., Hüni, A., Christen, M., Meister, R., and Kellenberger, T. (2009). Automated detection and mapping of avalanche deposits using airborne optical remote sensing data. Cold Regions Sci. Technol. 57 (2), 99–106. doi:10.1016/j.coldregions.2009.02.007
Bühler, Y., Adams, M. S., Bösch, R., and Stoffel, A. (2016). Mapping snow depth in alpine terrain with unmanned aerial systems (UASs): potential and limitations. Cryosphere 10 (3), 1075–1088. doi:10.5194/tc-10-1075-2016
Burchfield, D. R., Petersen, S. L., Kitchen, S. G., and Jensen, R. R. (2020). SUAS-based remote sensing in mountainous areas: benefits, challenges, and best practices. Pap. Appl. Geogr. 6 (1), 72–83. doi:10.1080/23754931.2020.1716385
Burrell, B. C., Beltaos, S., and Turcotte, B. (2021). Effects of climate change on river-ice processes and ice jams. Int. J. River Basin Manag. 0 (0), 421–441. doi:10.1080/15715124.2021.2007936
Canadian Avalanche Association (1995). Observation Guidelines and recording standards for weather, snowpack and avalanches. Revelstoke, BC: Canadian Avalanche Assoc.
Carrivick, J. L., and Tweed, F. S. (2016). A global assessment of the societal impacts of glacier outburst floods. Glob. Planet. Change 144, 1–16. September. doi:10.1016/j.gloplacha.2016.07.001
Carrivick, J. L., Tweed, F. S., Ng, F., Quincey, D. J., Mallalieu, J., Ingeman-Nielsen, T., et al. (2017). Ice-dammed lake drainage evolution at Russell Glacier, west Greenland. Front. Earth Sci. 5. doi:10.3389/feart.2017.00100
Carrivick, J. L., and Tweed, F. S. (2013). Proglacial lakes: character, behaviour and geological importance. Quat. Sci. Rev. 78, 34–52. October. doi:10.1016/j.quascirev.2013.07.028
Carroll, D. C., Olheiser, C., Rost, A., Nilsson, A., Fall, G., Bovitz, C., et al. (2006). “NOAA’s national snow analyses,” in Proceedings of the 74th Annual Western Snow Conference, Las Cruces, NM, April 17-20, 2006, 13–74. Available at: https://westernsnowconference.org/node/837 (Western Snow Conference.
Changnon, S. A. (2003). Characteristics of ice storms in the United States. J. Appl. Meteorology Climatol. 42 (5), 630–639. doi:10.1175/1520-0450(2003)042<0630:COISIT>2.0.CO;2
Chassiot, L., Lajeunesse, P., and Bernier, J.-F. (2020). Riverbank erosion in cold environments: review and outlook. Earth-Science Rev. 207, 103231. August. doi:10.1016/j.earscirev.2020.103231
Chen, Y., Liu, A., and Cheng, X. (2022). Detection of thermokarst lake drainage events in the northern Alaska permafrost region. Sci. Total Environ. 807, 150828. February. doi:10.1016/j.scitotenv.2021.150828
Cho, E., and Jacobs, J. M. (2020). Extreme value snow water equivalent and snowmelt for infrastructure design over the contiguous United States. Water Resour. Res. 56 (10), e2020WR028126. doi:10.1029/2020WR028126
Cho, E., Jacobs, J. M., and Vuyovich, C. M. (2020). The value of long-term (40 Years) airborne gamma radiation SWE record for evaluating three observation-based gridded SWE data sets by seasonal snow and land cover classifications. Water Resour. Res. 56 (1), e2019WR025813. doi:10.1029/2019WR025813
Cho, E., McCrary, R. R., and Jacobs, J. M. (2021). Future changes in snowpack, snowmelt, and runoff potential extremes over North America. Geophys. Res. Lett. 48 (22), e2021GL094985. doi:10.1029/2021GL094985
Choi, R. K. Y., Ha, J.-C., Kim, K.-H., Cho, Y.-J., Joo, S.-W., Kim, D.-Y., et al. (2018). “Preliminary test flight of a compact high altitude imager and sounding radiometer (CHAISR) microwave radiometers for meteorological observation from HALE UAV,” in 2018 IEEE 15th Specialist Meeting on Microwave Radiometry and Remote Sensing of the Environment (MicroRad), Cambridge, MA, March 27–30, 2018, 91–96.
Christensen, T. R., Lund, M., Skov, K., Abermann, J., López-Blanco, E., Scheller, J., et al. (2021). Multiple ecosystem effects of extreme weather events in the arctic. Ecosystems 24 (1), 122–136. doi:10.1007/s10021-020-00507-6
Cimoli, E., Marcer, M., Vandecrux, B., Bøggild, C. E., Williams, G., and Simonsen, S. B. (2017). Application of low-cost UASs and digital photogrammetry for high-resolution snow depth mapping in the arctic. Remote Sens. 9 (11), 1144. doi:10.3390/rs9111144
Climate change (2023). WWF arctic. Available at: https://www.arcticwwf.org/threats/climate-change/(Accessed May 4, 2023).
Cold Region Operations (2011). ATTP 3-97.11/MCRP 3-35.1d. Department of the army. Available at: https://irp.fas.org/doddir/army/attp3-97-11.pdf.
Compagno, L., Huss, M., Zekollari, H., Miles, E. S., and Farinotti, D. (2022). Future growth and decline of High Mountain asia’s ice-dammed lakes and associated risk. Commun. Earth Environ. 3 (1), 191–199. doi:10.1038/s43247-022-00520-8
Critical Factors Affecting RTK Accuracy (2023). Critical factors affecting RTK accuracy. Available at: https://receiverhelp.trimble.com/r750-gnss/PositionModes_CriticalFactorsRTK.html (Accessed May 4, 2023).
Cunliffe, A. M., Tanski, G., Radosavljevic, B., Palmer, W. F., Sachs, T., Lantuit, H., et al. (2019). Rapid retreat of permafrost coastline observed with aerial drone photogrammetry. Cryosphere 13 (5), 1513–1528. doi:10.5194/tc-13-1513-2019
Cunningham, K. W. (2017). Advanced imaging of transportation infrastructure using unmanned aircraft systems: final report. Alaska, USA: University of Alaska Fairbanks, and International Arctic Research Center. Available at: https://rosap.ntl.bts.gov/view/dot/32117.
Davenport, F. V., Herrera-Estrada, J. E., Burke, M., and Diffenbaugh, N. S. (2020). Flood size increases nonlinearly across the western United States in response to lower snow-precipitation ratios. Water Resour. Res. 56 (1), e2019WR025571. doi:10.1029/2019WR025571
Deschamps-Berger, C., Gascoin, S., Berthier, E., Deems, J., Gutmann, E., Dehecq, A., et al. (2020). Snow depth mapping from stereo satellite imagery in mountainous terrain: evaluation using airborne laser-scanning data. Cryosphere 14 (9), 2925–2940. doi:10.5194/tc-14-2925-2020
Diffenbaugh, N. S. (2017). Opinion | what California’s dam crisis says about the changing climate. Available at: https://www.nytimes.com/2017/02/14/opinion/what-californias-dam-crisis-says-about-the-changing-climate.html (The New York Times, February 14, 2017, sec. Opinion.
Domański, R. (2022). The use of drones in mountain search and rescue (gopr) in Poland - possibilities and limitations. LogForum 18 (3), 275–284. doi:10.17270/J.LOG.2022.754
Dømgaard, M., Kjeldsen, K. K., Huiban, F., Carrivick, J. L., Khan, S. A., Bjørk, A. A., et al. (2023). Recent changes in drainage route and outburst magnitude of the Russell Glacier ice-dammed lake, west Greenland. Cryosphere 17 (3), 1373–1387. doi:10.5194/tc-17-1373-2023
Douglas, T. A., Turetsky, M. R., and Koven, C. D. (2020). Increased rainfall stimulates permafrost thaw across a variety of interior alaskan boreal ecosystems. Npj Clim. Atmos. Sci. 3 (1), 1–7. doi:10.1038/s41612-020-0130-4
Druckenmiller, M. L., Thoman, R. L., and Moon, T. A. (2022). NOAA arctic report card 2022: Executive summary. Washington: NOAA. doi:10.25923/YJX6-R184
Du, J., Watts, J. D., Jiang, L., Lu, H., Cheng, X., Duguay, C., et al. (2019). Remote sensing of environmental changes in cold regions: methods, achievements and challenges. Remote Sens. 11 (16), 1952. doi:10.3390/rs11161952
Dunion, J. P., Wick, G. A., Black, P. G., and Walker, J. (2018). Sensing hazards with operational unmanned technology: 2015–2016 campaign summary, final report. Washington: NOAA. doi:10.7289/V5/TM-OAR-UAS-001
Easy Access Rules for Unmanned Aircraft Systems (2022). Regulations (EU) 2019/947 and 2019/945. European union. Available at: https://www.easa.europa.eu/en/document-library/easy-access-rules/easy-access-rules-unmanned-aircraft-systems-regulations-eu.
Eckerstorfer, M., Bühler, Y., Frauenfelder, R., and Malnes, E. (2016). Remote sensing of snow avalanches: recent advances, potential, and limitations. Cold Regions Sci. Technol. 121, 126–140. January. doi:10.1016/j.coldregions.2015.11.001
Ehrbar, D., Schmocker, L., Vetsch, D., and Boes, R. (2018). Hydropower potential in the periglacial environment of Switzerland under climate change. Sustainability 10 (8), 2794. doi:10.3390/su10082794
Emergency Situations (2023). Federal aviation administration. Available at: https://www.faa.gov/uas/advanced_operations/emergency_situations (Accessed April 28, 2023).
Emmer, A., Wood, J. L., Cook, S. J., Ryan, W., Diaz-Moreno, A., Reynolds, J. M., et al. (2022). 160 Glacial Lake outburst floods (GLOFs) across the tropical andes since the little ice age. Glob. Planet. Change 208, 103722. January. doi:10.1016/j.gloplacha.2021.103722
ET Docket 98-153 (2002). First report and order FCC 02-48. Washington, United States: Federal Communications Commission.
Fang, S., Xu, L., Pei, H., Liu, Y., Liu, Z., Zhu, Y., et al. (2014). An integrated approach to snowmelt flood forecasting in water resource management. IEEE Trans. Industrial Inf. 10 (1), 548–558. doi:10.1109/TII.2013.2257807
Flener, C., Vaaja, M., Jaakkola, A., Krooks, A., Kaartinen, H., Kukko, A., et al. (2013). Seamless mapping of river channels at high resolution using mobile LiDAR and UAV-photography. Remote Sens. 5 (12), 6382–6407. doi:10.3390/rs5126382
Fraser, R. H., Leblanc, S. G., Prevost, C., and van der Sluijs, J. (2022). Towards precise drone-based measurement of elevation change in permafrost terrain experiencing thaw and thermokarst. Drone Syst. Appl. 10 (1), 406–426. doi:10.1139/dsa-2022-0036
Freitas, P., Vieira, G., Mora, C., Canário, J., and Vincent, W. F. (2022). Evaluation of shadow effects on remotely sensed reflectance from permafrost thaw lakes in the subarctic forest-tundra zone. Rochester, NY: SSRN Scholarly Paper. doi:10.2139/ssrn.4024763
Frozen Ground & Permafrost (2022). National snow and ice data center. Available at: https://nsidc.org/learn/parts-cryosphere/frozen-ground-permafrost (Accessed November 1, 2022).
Gaffey, C., and Bhardwaj, A. (2020). Applications of unmanned aerial vehicles in cryosphere: latest advances and prospects. Remote Sens. 12 (948), 948. doi:10.3390/rs12060948
Gao, T., Zhang, Y., Kang, S., Abbott, B. W., Wang, X., Zhang, T., et al. (2021). Accelerating permafrost collapse on the eastern Tibetan plateau. Environ. Res. Lett. 16 (5), 054023. doi:10.1088/1748-9326/abf7f0
Garver, J. I., Capovani, E., and Pokrzywka, D. (2018). Photogrammetric models from UAS mapping and ice thickness estimates of the 2018 mid-winter ice jam on the Mohawk River. New York.
Goldberg, M. D., Li, S., Lindsey, D. T., Sjoberg, W., Zhou, L., and Sun, D. (2020). Mapping, monitoring, and prediction of floods due to ice jam and snowmelt with operational weather satellites. Remote Sens. 12 (11), 1865. doi:10.3390/rs12111865
Griessinger, N., Seibert, J., Magnusson, J., and Jonas, T. (2016). Assessing the benefit of snow data assimilation for runoff modeling in alpine catchments. Hydrology Earth Syst. Sci. 20 (9), 3895–3905. doi:10.5194/hess-20-3895-2016
Gultepe, I., Agelin-Chaab, M., Komar, J., Elfstrom, G., Boudala, F., and Zhou, B. (2019). A meteorological supersite for aviation and cold weather applications. Pure Appl. Geophys. 176 (5), 1977–2015. doi:10.1007/s00024-018-1880-3
Gultepe, I. (2015). “Chapter three - mountain weather: observation and modeling,” in Advances in geophysics. Editor Renata Dmowska (Amsterdam, Netherlands: Elsevier), 56, 229–312. doi:10.1016/bs.agph.2015.01.001
Guo, Q., and Hu, X. (2017). “Power line icing monitoring method using binocular stereo vision,” in 2017 12th IEEE Conference on Industrial Electronics and Applications (ICIEA), Siem Reap, Cambodia, 18 - 20 June 2017, 1905–1908.
Hamshaw, S. D., Engel, T., Rizzo, D. M., O’Neil-Dunne, J., and Dewoolkar, M. M. (2019). Application of unmanned aircraft system (UAS) for monitoring bank erosion along river corridors. Geomatics, Nat. Hazards Risk 10 (1), 1285–1305. doi:10.1080/19475705.2019.1571533
Harder, P., Pomeroy, J. W., and Helgason, W. D. (2020). Improving sub-canopy snow depth mapping with unmanned aerial vehicles: lidar versus structure-from-motion techniques. Cryosphere 14 (6), 1919–1935. doi:10.5194/tc-14-1919-2020
Harder, P., Schirmer, M., Pomeroy, J., and Helgason, W. (2016). Accuracy of snow depth estimation in mountain and prairie environments by an unmanned aerial vehicle. Cryosphere 10 (6), 2559–2571. doi:10.5194/tc-10-2559-2016
Harrison, S., Kargel, J. S., Huggel, C., Reynolds, J., Shugar, D. H., Betts, R. A., et al. (2018). Climate change and the global pattern of moraine-dammed Glacial Lake outburst floods. Cryosphere 12 (4), 1195–1209. doi:10.5194/tc-12-1195-2018
He, Z., Yang, W., Wang, Y., Zhao, C., Ren, S., and Li, C. (2023). Dynamic changes of a thick debris-covered Glacier in the southeastern Tibetan plateau. Remote Sens. 15 (2), 357. doi:10.3390/rs15020357
Healy, S. M., and Khan, A. L. (2022). Mapping Glacier ablation with a UAV in the North Cascades: a structure-from-motion approach. Front. Remote Sens. 2. doi:10.3389/frsen.2021.764765
Hendrickx, H., Le Roy, G., Helmstetter, A., Pointner, E., Larose, E., Braillard, L., et al. (2022). Timing, volume and precursory indicators of rock- and cliff fall on a permafrost mountain ridge (mattertal, Switzerland). Earth Surf. Process. Landforms 47 (6), 1532–1549. doi:10.1002/esp.5333
Henn, B., Musselman, K. N., Lestak, L., Martin Ralph, F., and Molotch, N. P. (2020). Extreme runoff generation from atmospheric river driven snowmelt during the 2017 oroville dam spillways incident. Geophys. Res. Lett. 47 (14), e2020GL088189. doi:10.1029/2020GL088189
Hewitt, K., and Liu, J. (2010). Ice-dammed lakes and outburst floods, Karakoram himalaya: historical perspectives on emerging threats. Phys. Geogr. 31 (6), 528–551. doi:10.2747/0272-3646.31.6.528
Hu, K., Zhang, X., Gouli, M. R., Liu, S., and Nie, Y. (2022). Retrospective analysis and hazard assessment of Gega Glacial Lake in the eastern himalayan syntaxis. Nat. Hazards Res. 2 (4), 331–342. doi:10.1016/j.nhres.2022.11.003
Inoue, J., and Sato, K. (2022). Toward sustainable meteorological profiling in polar regions: case studies using an inexpensive UAS on measuring lower boundary layers with quality of radiosondes. Environ. Res. 205, 112468. April. doi:10.1016/j.envres.2021.112468
IPCC (2019a). “Polar regions,” in The Ocean and cryosphere in a changing climate: Special report of the intergovernmental panel on climate change (Cambridge: Cambridge University Press), 203–320. doi:10.1017/9781009157964.005
Jacobs, J. M., Hunsaker, A. G., Sullivan, F. B., Palace, M., Burakowski, E. A., Herrick, C., Cho, E., et al. (2021). Snow depth mapping with unpiloted aerial system lidar observations: a case study in durham, New Hampshire, United States. Cryosphere 15 (3), 1485–1500. doi:10.5194/tc-15-1485-2021
Jacquet, J., McCoy, S. W., McGrath, D., Nimick, D. A., Fahey, M., O’kuinghttons, J., et al. (2017). Hydrologic and geomorphic changes resulting from episodic Glacial Lake outburst floods: rio colonia, patagonia, Chile. Geophys. Res. Lett. 44 (2), 854–864. doi:10.1002/2016GL071374
Jamieson, B., Campbell, C., and Jones, A. (2008). Verification of Canadian avalanche bulletins including spatial and temporal scale effects. Cold Regions Sci. Technol. 51 (2), 204–213. doi:10.1016/j.coldregions.2007.03.012
Jones, B. M., Irrgang, A. M., Farquharson, L. M., Lantuit, H., Whalen, D., Ogorodov, S., et al. (2020). Arctic report card 2020: Coastal permafrost erosion. Washington: NOAA. doi:10.25923/E47W-DW52
Jouvet, G., Weidmann, Y., Seguinot, J., Funk, M., Abe, T., Sakakibara, D., et al. (2017). Initiation of a major calving event on the Bowdoin Glacier captured by UAV photogrammetry. Cryosphere 11 (2), 911–921. doi:10.5194/tc-11-911-2017
Kaiser, S., Boike, J., Grosse, G., and Langer, M. (2022). The potential of UAV imagery for the detection of rapid permafrost degradation: assessing the impacts on critical arctic infrastructure. Remote Sens. 14 (23), 6107. doi:10.3390/rs14236107
Karamuz, E., Romanowicz, R. J., and Doroszkiewicz, J. (2020). The use of unmanned aerial vehicles in flood hazard assessment. J. Flood Risk Manag. 13 (4), e12622. doi:10.1111/jfr3.12622
Kilfoil, G. J., Blagdon, A., Leitch, A., Campbell, H., Irvine, M. R., Batterson, M. R., et al. (2018). The application and testing of two geophysical methods (Direct-Current resistivity and ground-penetrating radar as part of the coastal monitoring Program to assess terrain stability. Nfld. Labrador Dep. Nat. Resour. Geol. Surv., 31–57. (Report 18-1).
King, F., Kelly, R., and Fletcher, C. G. (2023). New opportunities for low-cost LiDAR-derived snow depth estimates from a consumer drone-mounted smartphone. Cold Regions Sci. Technol. 207, 103757. March. doi:10.1016/j.coldregions.2022.103757
Koo, V. C., Chan, Y. K., Gobi, V., Chua, M. Y., Lim, C. H., Lim, C.-S., et al. (2012). A new unmanned aerial vehicle synthetic aperture radar for environmental monitoring. Prog. Electromagn. Res. 122, 245–268. doi:10.2528/PIER11092604
Koutalakis, P., Tzoraki, O., and Zaimes, G. (2019). UAVs for hydrologic scopes: application of a low-cost UAV to estimate surface water velocity by using three different image-based methods. Drones 3 (1), 14. doi:10.3390/drones3010014
Lahmers, T. M., Kumar, S. V., Rosen, D., Dugger, A., Gochis, D. J., Santanello, J. A., et al. (2022). Assimilation of NASA’s airborne snow observatory snow measurements for improved hydrological modeling: a case study enabled by the coupled LIS/WRF-hydro system. Water Resour. Res. 58 (3), e2021WR029867. doi:10.1029/2021WR029867
Landry, C., Birkeland, K., Hansen, K., Borkowski, J., Brown, R., and Aspinall, R. (2002). Snow stability on uniform slopes: Implications for avalanche forecasting. Bozeman, MT: Montana State University, 532–539.
Lee, H., Calvin, K., Dasgupta, D., Krinner, G., Mukherji, A., Thorne, P., et al. (2023). Synthesis report of the IPCC sixth assessment report (AR6): Summary for policymakers. Geneva, Switzerland: Intergovernmental Panel on Climate Change.
Lei, T., Wang, J., Li, X., Wang, W., Shao, C., and Liu, B. (2022). Flood disaster monitoring and emergency assessment based on multi-source remote sensing observations. Water 14 (14), 2207. doi:10.3390/w14142207
Leigh, J. R., Stokes, C. R., Carr, R. J., Evans, I. S., Andreassen, L. M., and Evans, D. J. A. (2019). Identifying and mapping very small (<0.5 Km2) mountain glaciers on coarse to high-resolution imagery. J. Glaciol. 65 (254), 873–888. doi:10.1017/jog.2019.50
Li, D., Lettenmaier, D. P., Margulis, S. A., and Andreadis, K. (2019). The role of rain-on-snow in flooding over the conterminous United States. Water Resour. Res. 55 (11), 8492–8513. doi:10.1029/2019WR024950
Lin, J., Li, S., Zuo, H., and Zhang, B. (2012). Experimental observation and assessment of ice conditions with a fixed-wing unmanned aerial vehicle over Yellow River, China. J. Appl. Remote Sens. 6 (1), 063586. doi:10.1117/1.JRS.6.063586
Lindenschmidt, K.-E., Carstensen, D., Fröhlich, W., Hentschel, B., Iwicki, S., Kögel, M., et al. (2019). Development of an ice jam flood forecasting system for the lower oder river—requirements for real-time predictions of water, ice and sediment transport. Water 11 (1), 95. doi:10.3390/w11010095
López-Moreno, J. I., Pomeroy, J. W., Morán-Tejeda, E., Revuelto, J., Navarro-Serrano, F. M., Vidaller, I., et al. (2021). Changes in the frequency of global High Mountain rain-on-snow events due to climate warming. Environ. Res. Lett. 16 (9), 094021. doi:10.1088/1748-9326/ac0dde
Lucieer, A., Turner, D., King, D. H., and Robinson, S. A. (2014). Using an unmanned aerial vehicle (UAV) to capture micro-topography of antarctic moss beds. Int. J. Appl. Earth Observation Geoinformation, Special Issue Polar Remote Sens. 27, 53–62. April. doi:10.1016/j.jag.2013.05.011
Mandirola, M., Casarotti, C., Peloso, S., Lanese, I., Brunesi, E., and Senaldi, I. (2022). Use of UAS for damage inspection and assessment of bridge infrastructures. Int. J. Disaster Risk Reduct. 72, 102824. April. doi:10.1016/j.ijdrr.2022.102824
Markon, C., Gray, S., Berman, M., Eerkes-Medrano, L., Hennessy, T., Huntington, H. P., et al. (2018). Chapter 26: Alaska. Impacts, risks, and adaptation in the United States: the fourth national climate assessment, volume II. Washington: U.S. Global Change Research Program. doi:10.7930/NCA4.2018.CH26
Marshall, G. J., Dowdeswell, J. A., and Rees, W. G. (1994). The spatial and temporal effect of cloud cover on the acquisition of high quality landsat imagery in the European arctic sector. Remote Sens. Environ. 50 (2), 149–160. doi:10.1016/0034-4257(94)90041-8
Masný, M., Weis, K., and Biskupič, M. (2021). Application of fixed-wing UAV-based photogrammetry data for snow depth mapping in alpine conditions. Drones 5 (4), 114. doi:10.3390/drones5040114
McClung, D. M. (2002). The elements of applied avalanche forecasting, Part II: the physical issues and the rules of applied avalanche forecasting. Nat. Hazards 26 (2), 131–146. doi:10.1023/A:1015604600361
McCormack, E., and Stimberis, J. (2010). Small unmanned aircraft evaluated for avalanche control. Transp. Res. Rec. 2169 (1), 168–173. doi:10.3141/2169-18
McCormack, E., and Vaa, T. (2019). Testing unmanned aircraft for roadside snow avalanche monitoring. Transp. Res. Rec. 2673 (2), 94–103. doi:10.1177/0361198119827935
McGrath, D., Bonnell, R., Zeller, L., Olsen-Mikitowicz, A., Bump, E., Webb, R., et al. (2022). A time series of snow density and snow water equivalent observations derived from the integration of GPR and UAV SfM observations. Front. Remote Sens. 3. doi:10.3389/frsen.2022.886747
Merz, R., and Blöschl, G. (2003). A process typology of regional floods. Water Resour. Res. 39 (12). doi:10.1029/2002WR001952
Miller, Z. S., Peitzsch, E. H., Sproles, E. A., Birkeland, K. W., and Palomaki, R. T. (2022). Assessing the seasonal evolution of snow depth spatial variability and scaling in complex mountain terrain. Cryosphere 16 (12), 4907–4930. doi:10.5194/tc-16-4907-2022
Mohsan, S. A. H., Othman, N. Q. H., Li, Y., Alsharif, M. H., and Khan, M. A. (2023). Unmanned aerial vehicles (UAVs): practical aspects, applications, open challenges, security issues, and future trends. Intell. Serv. Robot. 16 (1), 109–137. doi:10.1007/s11370-022-00452-4
Mölg, N., Huggel, C., Herold, T., Storck, F., Allen, S., Haeberli, W., et al. (2021). Inventory and evolution of glacial lakes since the little ice age: lessons from the case of Switzerland. Earth Surf. Process. Landforms 46 (13), 2551–2564. doi:10.1002/esp.5193
Mu, C., Shang, J., Zhang, T., Fan, C., Wang, S., Peng, X., et al. (2020). Acceleration of thaw slump during 1997–2017 in the qilian mountains of the northern Qinghai-Tibetan plateau. Landslides 17 (5), 1051–1062. doi:10.1007/s10346-020-01344-3
Mullen, A. L., Watts, J. D., Rogers, B. M., Carroll, M. L., Elder, C. D., and Noomah, J. (2023). Using high-resolution satellite imagery and deep learning to track dynamic seasonality in small water bodies. Geophysical Research Letters 50 (7), e2022GL102327. doi:10.1029/2022GL102327
Munawar, H. S., Hammad, A. W. A., Waller, S. T., Thaheem, M. J., and Shrestha, A. (2021). An integrated approach for post-disaster flood management via the use of cutting-edge technologies and UAVs: A review. Sustainability 13 (14), 7925. doi:10.3390/su13147925
Mury, A., Collin, A., and James, D. (2019). Morpho–sedimentary monitoring in a coastal area, from 1D to 2.5D, using airborne drone imagery. Drones 3 (3), 62. doi:10.3390/drones3030062
Musselman, K. N., Lehner, F., Ikeda, K., Clark, M. P., Prein, A. F., Liu, C., et al. (2018). Projected increases and shifts in rain-on-snow flood risk over western North America. Nat. Clim. Change 8 (9), 808–812. doi:10.1038/s41558-018-0236-4
Neupane, R., Chen, H., and Cao, C. (2019). Review of moraine dam failure mechanism. Geomatics, Nat. Hazards Risk 10 (1), 1948–1966. doi:10.1080/19475705.2019.1652210
Nie, Y., Liu, W., Liu, Q., Hu, X., and Westoby, M. J. (2020). Reconstructing the Chongbaxia Tsho Glacial Lake outburst flood in the eastern himalaya: evolution, process and impacts. Geomorphology 370, 107393. December. doi:10.1016/j.geomorph.2020.107393
Nienow, P. W., and Campbell, F. (2011). Stratigraphy of Snowpacks. Encyclopedia of Snow, Ice and Glaciers . Editors V. P. Singh, P. Singh, and U. K. Haritashya (Dordrecht: Springer Netherlands). doi:10.1007/978-90-481-2642-2_541
Niedzielski, T., Spallek, W., and Witek-Kasprzak, M. (2018). Automated snow extent mapping based on orthophoto images from unmanned aerial vehicles. Pure Appl. Geophys. 175 (9), 3285–3302. doi:10.1007/s00024-018-1843-8
Novikova, A. V., Vergun, A. P., Zelenin, E. A., Baranskaya, A. V., and Ogorodov, S. A. (2021). Determining dynamics of the Kara Sea coasts using remote sensing and UAV data: a case study. Russ. J. Earth Sci. 21 (3), 1–18. doi:10.2205/2020ES000743
Painter, T. H., Boardman, J. W., Bormann, K. J., Deems, J. S., Gehrke, F., Hedrick, A., et al. (2016). The airborne snow observatory: fusion of scanning lidar, imaging spectrometer, and physically-based modeling for mapping snow water equivalent and snow albedo. Remote Sens. Environ. 184, 139–152. October. doi:10.1016/j.rse.2016.06.018
Palomaki, R. T., and Sproles, E. A. (2022). Quantifying the effect of river ice surface roughness on sentinel-1 SAR backscatter. Remote Sens. 14 (22), 5644. doi:10.3390/rs14225644
Part 107 Waivers Issued (2023). Template. Available at: https://www.faa.gov/uas/commercial_operators/part_107_waivers/waivers_issued/April 21, 2023).
Perks, M. T., Russell, A. J., and Large, A. R. G. (2016). Technical note: advances in flash flood monitoring using unmanned aerial vehicles (UAVs). Hydrology Earth Syst. Sci. 20 (10), 4005–4015. doi:10.5194/hess-20-4005-2016
Pilot’s Handbook of Aeronautical Knowledge (2016). Pilot’s Handbook of aeronautical Knowledge. Washington, DC: U.S. Department of Transportation Federal Aviation Administration.
Pomeroy, J. W., Stewart, R. E., and Whitfield, P. H. (2016). The 2013 flood event in the south saskatchewan and elk river basins: causes, assessment and damages. Can. Water Resour. J./Revue Can. Des Ressources Hydriques 41 (1–2), 105–117. doi:10.1080/07011784.2015.1089190
Prager, S., Sexstone, G., McGrath, D., Fulton, J., and Moghaddam, M. (2022). Snow depth retrieval with an autonomous UAV-mounted software-defined radar. IEEE Trans. Geoscience Remote Sens. 60, 1–16. doi:10.1109/TGRS.2021.3117509
Qayyum, N., Ghuffar, S., Ahmad, H. M., Yousaf, A., and Shahid, I. (2020). Glacial lakes mapping using multi satellite PlanetScope Imagery and Deep Learning. ISPRS International Journal of Geo-Information. 9 (10), 560. doi:10.3390/ijgi9100560
Quirk, B., and Haack, B. (2019). “Federal government applications of UAS technology,” in Applications of small unmanned aircraft systems: Best practices and case studies (Florida, United States; CRC Press).
Radiosondes - an Overview (2015). Radiosondes - an overview. Available at: https://www.sciencedirect.com/topics/earth-and-planetary-sciences/radiosondes.
Rajawat, M. (2021). Weather conditions and its effects on UAS. Int. Res. J. Mod. Eng. Technol. Sci. 3 (12).
Ranquist, E., Steiner, M., and Argrow, B. (2017). Exploring the range of weather impacts on UAS operations. Social network service.
Real Time Kinematics (2011). Real time kinematics. Paris, France: ESA. Available at: https://gssc.esa.int/navipedia/index.php/Real_Time_Kinematics.
Rødtang, E., Alfredsen, K., and Juárez, A. (2021). Drone surveying of volumetric ice growth in a steep river. Front. Remote Sens. 2. doi:10.3389/frsen.2021.767073
Rokaya, P., Budhathoki, S., and Lindenschmidt, K.-E. (2018). Ice-jam flood research: a scoping review. Nat. Hazards 94 (3), 1439–1457. doi:10.1007/s11069-018-3455-0
Roland, C. J., Zoet, L. K., Rawling, J. E., and Cardiff, M. (2021). Seasonality in cold coast bluff erosion processes. Geomorphology 374, 107520. February. doi:10.1016/j.geomorph.2020.107520
Schweizer, J., Jamieson, B., and Schneebeli, M. (2003). Snow avalanche formation. Rev. Geophys. 41, 1016. doi:10.1029/2002RG000123
Shelekhov, A., Afanasiev, A., Shelekhova, E., Kobzev, A., Tel’minov, A., Molchunov, A., et al. (2022). Low-altitude sensing of urban atmospheric turbulence with UAV. Drones 6 (3), 61. doi:10.3390/drones6030061
Shugar, D. H., Burr, A., Haritashya, U. K., Kargel, J. S., Watson, C. S., Kennedy, M. C., et al. (2020). Rapid worldwide growth of glacial lakes since 1990. Nat. Clim. Change 10 (10), 939–945. doi:10.1038/s41558-020-0855-4
Silvagni, M., Tonoli, A., Zenerino, E., and Chiaberge, M. (2017). Multipurpose UAV for search and rescue operations in mountain avalanche events. Geomatics, Nat. Hazards Risk 8 (1), 18–33. doi:10.1080/19475705.2016.1238852
Simioni, S., and Schweizer., J. (2013). Assessing weak layer failure and changes in snowpack properties due to avalanche control by explosives, 775–778.
Śledź, S., Ewertowski, M. W., and Piekarczyk, J. (2021). Applications of unmanned aerial vehicle (UAV) surveys and structure from motion photogrammetry in glacial and periglacial geomorphology. Geomorphology 378, 107620. April. doi:10.1016/j.geomorph.2021.107620
Small Unmanned Aircraft Systems (UAS) Regulations (Part 107) (2020). Federal aviation administration. Available at: https://www.faa.gov/newsroom/small-unmanned-aircraft-systems-uas-regulations-part-107.
Song, Z., Shi, X., Fei, X., and Feng, W. (2015). “Ice-flood prevention in Yellow River using GPR and unmanned helicopter,” in 2015 IEEE International Conference on Communication Software and Networks (ICCSN), Chengdu, China, June 2015, 23–28.
Stadnyk, T., Dow, K., Wazney, L., and Blais, E.-L. (2016). The 2011 flood event in the red river basin: causes, assessment and damages. Can. Water Resour. J./Revue Can. Des Ressources Hydriques 41 (1–2), 65–73. doi:10.1080/07011784.2015.1008048
Stark, N., Green, B., Brilli, N., Eidam, E., Franke, K. W., and Markert, K. (2022). Geotechnical measurements for the investigation and assessment of arctic coastal erosion—a review and outlook. J. Mar. Sci. Eng. 10 (7), 914. doi:10.3390/jmse10070914
Stimberis, J., and Rubin, C. M. (2011). Glide avalanche response to an extreme rain-on-snow event, snoqualmie pass, Washington, USA. J. Glaciol. 57 (203), 468–474. doi:10.3189/002214311796905686
Stopak, S., Nordio, G., and Fagherazzi, S. (2022). Quantifying the importance of ice-rafted debris to salt marsh sedimentation using high resolution UAS imagery. Remote Sens. 14 (21), 5499. doi:10.3390/rs14215499
Summary for Policymakers (2019b). “Summary for policymakers,” in The Ocean and cryosphere in a changing climate: Special report of the intergovernmental panel on climate change (Cambridge: Cambridge University Press), 3–36. doi:10.1017/9781009157964.001
Sziroczak, D., Rohacs, D., and Rohacs, J. (2022). Review of using small UAV based meteorological measurements for road weather management. Prog. Aerosp. Sci. 134, 100859. October. doi:10.1016/j.paerosci.2022.100859
Taylor, C., Robinson, T. R., Dunning, S., Rachel Carr, J., and Westoby, M. (2023). Glacial Lake outburst floods threaten millions globally. Nat. Commun. 14 (1), 487. doi:10.1038/s41467-023-36033-x
Thati, J., and Ari, S. (2022). A systematic extraction of glacial lakes for satellite imagery using deep learning based technique. Measurement 192, 110858. March. doi:10.1016/j.measurement.2022.110858
Todhunter, P. E. (2001). A hydroclimatological analysis of the red rwer of the North snowmelt flood catastrophe of 19971. JAWRA J. Am. Water Resour. Assoc. 37 (5), 1263–1278. doi:10.1111/j.1752-1688.2001.tb03637.x
Tomczyk, A. M., and Ewertowski, M. W. (2021). Baseline data for monitoring geomorphological effects of glacier lake outburst flood: a very-high-resolution image and gis datasets of the distal part of the Zackenberg river, northeast Greenland. Earth Syst. Sci. Data 13 (11), 5293–5309. doi:10.5194/essd-13-5293-2021
Tripp, D. D., Martin, E. R., and Reeves, H. D. (2021). Applications of uncrewed aerial vehicles (UAVs) in winter precipitation-type forecasts. J. Appl. Meteorology Climatol. 60 (3), 361–375. doi:10.1175/jamc-d-20-0047.1
Troy, C. D., Cheng, Y.-T., Lin, Y.-C., and Habib, A. (2021). Rapid Lake Michigan shoreline changes revealed by UAV LiDAR surveys. Coast. Eng. 170, 104008. December. doi:10.1016/j.coastaleng.2021.104008
Turcotte, B., Burrell, B. C., and Beltaos, S. (2019). The impact of climate change on breakup ice jams in Canada: state of Knowledge and research approaches. CGU HS Comm. River Ice Process. Environ. 30.
Turetsky, M. R., Abbott, B. W., Jones, M. C., Anthony, K. W., Olefeldt, D., Schuur, E. A. G., et al. (2020). Carbon release through abrupt permafrost thaw. Nat. Geosci. 13 (2), 138–143. doi:10.1038/s41561-019-0526-0
Turner, I. L., Harley, M. D., and Drummond, C. D. (2016). UAVs for coastal surveying. Coast. Eng. 114, 19–24. August. doi:10.1016/j.coastaleng.2016.03.011
Turner, K. W., Pearce, M. D., and Hughes, D. D. (2021). Detailed characterization and monitoring of a retrogressive thaw slump from remotely piloted aircraft systems and identifying associated influence on carbon and nitrogen export. Remote Sens. 13 (2), 171. doi:10.3390/rs13020171
Tuttle, S., Cho, E., Restrepo, P., Jia, X., Vuyovich, C., Cosh, M., et al. (2017). Remote sensing of drivers of spring snowmelt flooding in the North central U.S. Remote Sens. Hydrologic Extrem. January, 21–45.
US EPAOAR (2022). Climate change indicators: Coastal flooding” reports and assessments. Available at: https://www.epa.gov/climate-indicators/climate-change-indicators-coastal-flooding.
Valence, E., Baraer, M., Rosa, E., Barbecot, F., and Monty, C. (2022). Drone-based ground-penetrating radar (GPR) application to snow Hydrology. Cryosphere 16 (9), 3843–3860. doi:10.5194/tc-16-3843-2022
Van der Sluijs, J., Kokelj, S. J., Fraser, R. H., Tunnicliffe, J., and Lacelle, D. (2018). Permafrost terrain dynamics and infrastructure impacts revealed by UAV photogrammetry and thermal imaging. Remote Sens. 10 (11), 1734. doi:10.3390/rs10111734
Van Tilburg, C. (2017). First report of using portable unmanned aircraft systems (drones) for search and rescue. Wilderness & Environ. Med. 28 (2), 116–118. doi:10.1016/j.wem.2016.12.010
Vander Jagt, B., Lucieer, A., Wallace, L., Turner, D., and Durand, M. (2015). Snow depth retrieval with UAS using photogrammetric techniques. Geosciences 5 (3), 264–285. doi:10.3390/geosciences5030264
Varner, R. K., Crill, P. M., Frolking, K., McCalley, C. K., Burke, S. A., Chanton, J. P., et al. Steve Frolking (2022). Permafrost thaw driven changes in Hydrology and vegetation cover increase trace gas emissions and climate forcing in stordalen Mire from 1970 to 2014. Philosophical Trans. R. Soc. A Math. Phys. Eng. Sci. 380 (2215), 20210022. doi:10.1098/rsta.2021.0022
Villalpando, F., Tuxpan, J., Ramos-Leal, J., and Marín, A. (2023). Towards of multi-source data fusion framework of geo-referenced and non-georeferenced data: prospects for use in surface water bodies. Geocarto Int. January 1, 11. doi:10.1080/10106049.2023.2172215
Vivero, S., and Lambiel, C. (2019). Monitoring the crisis of a rock glacier with repeated UAV surveys. Geogr. Helvetica 74 (1), 59–69. doi:10.5194/gh-74-59-2019
Vuyovich, C., and Jacobs, J. M. (2011). Snowpack and runoff generation using AMSR-E passive microwave observations in the upper helmand watershed, Afghanistan. Remote Sens. Environ. 115 (12), 3313–3321. doi:10.1016/j.rse.2011.07.014
Wufu, A., Chen, Y., Yang, S., Lou, H., Wang, P., Li, C., et al. (2021). Changes in glacial meltwater runoff and its response to climate change in the tianshan region detected using unmanned aerial vehicles (UAVs) and satellite remote sensing. Water 13 (13), 1753. doi:10.3390/w13131753
Walter, B., Huwald, H., Gehring, J., Bühler, Y., and Lehning, M. (2020). Radar measurements of blowing snow off a mountain ridge. Cryosphere 14 (6), 1779–1794. doi:10.5194/tc-14-1779-2020
Wang, W., Zhang, T., Yao, T., and An, B. (2022). Monitoring and early warning system of cirenmaco Glacial Lake in the central Himalayas. Int. J. Disaster Risk Reduct. 73, 102914. doi:10.1016/j.ijdrr.2022.102914
Weather Forecasting Through the Ages (2002). Text.Article. NASA earth observatory. Available at: https://earthobservatory.nasa.gov/features/WxForecastywx4.php February 25, 2002).
What Is an Ice Jam? (2022). Noaa. Available at: https://scijinks.gov/ice-jams/.
Wigmore, O., and Mark, B. (2017). Monitoring tropical debris-covered glacier dynamics from high-resolution unmanned aerial vehicle photogrammetry, cordillera Blanca, Peru. Cryosphere 11 (6), 2463–2480. doi:10.5194/tc-11-2463-2017
Winsvold, S. H., Havstad, S., Kaab, A., and Nuth, C. (2016). Regional Glacier mapping using optical satellite data time series. IEEE J. Sel. Top. Appl. Earth Observations Remote Sens. 9 (8), 3698–3711. doi:10.1109/JSTARS.2016.2527063
Winter Storms (2022). UCAR center for science education. Available at: https://scied.ucar.edu/learning-zone/storms/winter-storms (Accessed November 1, 2022).
Wolfe, V., Frobe, W., Shrinivasan, V., and Hsieh, T.-Y. (2015). “Detecting and locating cell phone signals from avalanche victims using unmanned aerial vehicles,” in 2015 International Conference on Unmanned Aircraft Systems (ICUAS), Denver, CO, 9-12 June 2015 (New York, NY: IEEE), 704–713.
Yalcin, E. (2019). Two-dimensional hydrodynamic modelling for urban flood risk assessment using unmanned aerial vehicle imagery: A case study of kirsehir, Turkey. J. Flood Risk Manag. 12, e12499. S1. doi:10.1111/jfr3.12499
Yildiz, S., Akyurek, Z., and Binley, A. (2021). Quantifying snow water equivalent using terrestrial ground penetrating radar and unmanned aerial vehicle photogrammetry. Hydrol. Process. 35 (5), e14190. doi:10.1002/hyp.14190
Zhang, J. (2010). Multi-source remote sensing data fusion: status and trends. Int. J. Image Data Fusion 1 (1), 5–24. doi:10.1080/19479830903561035
Zhong, W., Zhang, T., Chen, J., Shang, J., Wang, S., Mu, C., et al. (2021). Seasonal deformation monitoring over thermokarst landforms using terrestrial laser scanning in northeastern Qinghai-Tibetan plateau. Int. J. Appl. Earth Observation Geoinformation 103, 102501. December. doi:10.1016/j.jag.2021.102501
Keywords: UAV, UAS, cold region, flooding, erosion, permafrost, avalanches, winter storms
Citation: Verfaillie M, Cho E, Dwyre L, Khan I, Wagner C, Jacobs JM and Hunsaker A (2023) UAS remote sensing applications to abrupt cold region hazards. Front. Remote Sens. 4:1095275. doi: 10.3389/frsen.2023.1095275
Received: 11 November 2022; Accepted: 24 July 2023;
Published: 14 August 2023.
Edited by:
Matt Westoby, University of Plymouth, United KingdomReviewed by:
Daniel McGrath, Colorado State University, United StatesEric A. Sproles, Montana State University, United States
Copyright © 2023 Verfaillie, Cho, Dwyre, Khan, Wagner, Jacobs and Hunsaker. This is an open-access article distributed under the terms of the Creative Commons Attribution License (CC BY). The use, distribution or reproduction in other forums is permitted, provided the original author(s) and the copyright owner(s) are credited and that the original publication in this journal is cited, in accordance with accepted academic practice. No use, distribution or reproduction is permitted which does not comply with these terms.
*Correspondence: Megan Verfaillie, megan.verfaillie@unh.edu
†These authors have contributed equally to this work