Analysis of Urban Energy Resources to Achieve Net-Zero Energy Neighborhoods
 Caroline Hachem-Vermette
 Kuljeet Singh
- School of Architecture, Planning and Landscape, University of Calgary, Calgary, AB, Canada
This paper summarizes a methodology developed to optimize urban-scale energy mix. An optimal capacity estimation method based on energy credits is proposed, the objective of which is to plan renewable and alternative energy sources to yield zero (or positive) year-end energy credits. Several renewable and alternative energy resources are considered, including photovoltaic systems, solar thermal collectors, wind turbines, waste to energy (WtE) potential, as well as thermal seasonal storage. The methodology employs several energy simulation and optimization tools, including Energy Plus, TRNSYS and MATLAB. The optimization employs a non-linear process that uses objective function, boundaries and non-linear/linear constraints as input. The methodology is demonstrated on a hypothetical mixed-use neighborhood, designed to achieve high-energy performance objectives, with three scenarios of energy operations: 1) all electric, 2) all-electric except for DHW, and 3) DHW and space heating arenon-electric. The pilot location of this mixed-use neighborhood, including residential and commercial buildings, is Calgary (AB, Canada). For the all-electric scenario, PV systems implemented in all available south facing roof areas together with a limited number of wind turbines can achieve NZE status. For the other two scenarios, solar thermal collectors coupled to borehole thermal storage (STC and BTES) need to be considered. Although in all cases of the considered scenarios waste-based energy is not required, it can be used to shave the peak electric load, reducing the stress on the grid. This methodology can be employed for the design of an integrated urban energy systems, in different neighborhood designs, to achieve energy self-sufficient, or energy positive status.
Introduction
The worldwide rapid increase of urbanization is leading to significant surge in energy requirement and related negative environmental impact. To mitigate such impact, urban-scale targeted efforts should focus on switching from fossil fuel to renewable and low carbon energy sources, and on enhancing urban scale integrated energy solutions. Such efforts should consider various aspects of an urban area planning, including the energy landscape that encompasses the conventional energy grid, potential renewable energy and low impact alternative energy solutions. The design of high-energy performance neighborhoods is anticipated to be heavily dependent on the integration of renewable and alternative energy sources (RES and AES) with the existing grid. RES includes electricity-generating technologies (e.g., PV, small wind turbine, fuel cells), heat generating (e.g., PV/T, thermal collectors), and energy efficient technologies (Loonen et al., 2013). AES include various low environmental impact technologies, such as Waste to Energy (WtE), biomass and other co-generation/tri-generation combinations. Although RES and AES technologies are increasingly employed, methods to determine potential synergy between these technologies, and their optimal mix within a specific urban development, as well as the impact of the design and characteristics of this development on the optimal energy mix are yet to be explored.
A number of research works are available focusing on developing methodologies for the optimization of distributed energy sources, in given building and neighborhood types, in order to achieve specific objectives. For instance, Li et al. (2016) implemented multi-objective optimization of distributed energy resources aiming at minimizing annual cost and CO2 emissions, for a cluster of two residential and two office buildings. Falke et al. (2016) proposed a multi-objective optimization methodology for the design of heat and power generation units within a small cluster of buildings. Fonseca et al. (2016) employed City Energy Analyst (CEA) in the multi-objective optimization to minimize CO2 emissions, total annual cost and primary energy needs for various scenarios of neighborhood usage. Murray et al. (2018) not only considered the onsite generation from various resources for the neighborhood, but optimized energy storage technologies to minimize both cost and GHG emissions. Jing et al. (2018) explored a game theory-based optimization of the energy network of a number of commercial buildings. Other research focused on the potential of energy storage to achieve optimal load management (Parra et al., 2017). Sikder et al. (2016) developed a conceptual energy optimization model to improve energy use in residential developments. The study involved various methods such as interviews and collection of data a from local sources. The work highlights the role of governance in a successful planning of urban energy systems.
Apart from designing the energy infrastructure, focusing on the operation side, La Scala et al. (2014) proposed the optimization methodology to optimize the energy flow in multicarrier energy network including various electrical and thermal energy resources. A similar energy dispatch optimization problem is also addressed by Wang et al. (2019) for multiple stake holders. Hachem-Vermette and Singh (2020) proposed an optimization methodology to plan the mix of energy resources, including renewable and alternative energy, and the interaction with the conventional grid employing two neighborhood concepts; a stand-alone mixed-use neighborhood and, and a grid-tied mixed-use neighborhood. This study did not take into account however solar thermal collectors and thermal storage. Further, the economic aspects of energy resources including tariff schemes, return on investment and payback period is investigated by Singh and Hachem-vermette (2021).
The work presented in this paper is a part of an ongoing research that aims at determining optimal mixtures of energy resources, within an integrated urban energy system, for various types and designs of building clusters. The current paper proposes a methodology to optimize the energy resources mix, for a grid-tied hypothetical mixed-use neighborhood, focusing on the technical aspects of energy resources and their theoretical application to the hypothetical neighborhood. The explored energy resources include PV and solar thermal collectors (STC) integrated in roofs, wind turbines, waste-to-energy, and borehole thermal energy (BTES) storage. The optimization methodology accounts simultaneously for the neighborhood hourly electrical load, space heating and domestic hot water loads.
Methodology
This paper assumes a grid-tied neighborhood concept. As such, this neighborhood supplies excess energy generated on site (from various energy sources) to the grid, while the grid supplements the on-site energy to meet its demand, when it is needed. Three scenarios of neighborhoods are studied: SC1 is an all electrical neighborhood; SC2, is similar to SC1 with the exception that domestic hot water (DHW) is fulfilled by other energy sources than electricity; and SC3 assumes that heating and DHW are non-electric.
A high performance mixed-use neighborhood example is employed to develop the methodology (Hachem, 2016; Hachem et al., 2016). The neighborhood consists of residential buildings of different types–detached houses, attached townhouses and apartment buildings, and of various commercial buildings including a supermarket, office buildings, retail buildings and a school. Houses are designed to optimize the utilization of passive solar energy for space heating, through the window to wall ratio and the plan layout. Spaces between buildings are designed to reduce mutual shading between buildings (Hachem, 2016; Hachem et al., 2016).
A Northern cold climate location–Calgary, Canada, 51°N, is assumed in the study. Energy Plus [National Renewable Energy Laboratory (NREL), (2016)] is employed to determine the yearly base load of the whole neighborhood. In addition, energy consumption for heating and cooling assuming heat pump is estimated using TRNSYS (University of Wisconsin Solar Energy Lab, 1990) (for SC1 and SC2). The base load accounts as well for all electrical energy load associated with various appliances and equipment according to the building types and occupation (schedule, density, etc.).
The general methodology consists of first optimizing the size of renewable and alternative energy resources to fulfill all (or portion of) the electrical needs of the neighborhood scenarios described above. The potential of fulfilling the thermal energy, for Scenarios 2 and 3, employing STC, WtE and thermal storage is then addressed.
The different energy sources employed in this study and related assumptions are summarized in the following:
• PV systems: PV modules are assumed to be integrated in south facing roof areas of the studied neighborhood buildings, with an upper limit of 52,451 m2 corresponding to the maximum available south facing roof areas. PV panels with 18.65% efficiency are assumed to be installed on potential surfaces (identified from the neighborhood configuration and optimally used by the proposed optimization process) (Hachem-Vermette and Singh, 2020). The hourly per m2 output from PV panels (as per various orientations) is extracted from Energy Plus using appropriate weather file (representing Calgary weather in this case). The weather file provides the input hourly radiation data for whole year (8,760 values).
• Wind turbines (WT): vertical axis wind turbines of 5 kW capacity are employed in this work (Windspire, 2019). These WT are assumed to be installed along the main streets of the neighborhood, employing a distance and turbine settings that aims at reducing potential turbulence [cluster staggered approach (Hezaveh et al., 2018)]. Based on this method, an upper bound of 1,200 turbines installation is estimated. Energy Plus simulations are used to obtain the output from wind turbines. The above-mentioned wind turbine is assumed and subjecting to weather file (consist of hourly wind speed and direction values), the output from a given wind turbine is evaluated.
• Waste to Energy (WtE): WtE-CHP plant size is estimated based upon the unavailability of energy from RES, assuming that waste can be provided by the neighborhood waste disposal. Likewise, based on the literature it is assumed that 1 t of waste can generate 650 kWh/t of electricity [Harley and Infrastructure, 2012; International Solid Waste Association (ISWA), 2013; Llanes and Kalogirou, 2019; Tsai, 2019], whereas, using CHP concept additional heat of around 2,000 kWh/t can be also produced (heat to power ratio varies between 2.3 and 4) [International Solid Waste Association (ISWA), 2013; Catalogue of WtE Facilities in the Sweden, 2015; Yin et al., 2020].
• Solar thermal collectors (STC): STC are assumed to be integrated within the areas of south facing roof. The maximum sum of PV and STC areas is equal to 52,451 m2 corresponding to the total available areas of south facing roofs (of the studied neighborhood). The output of STC is estimated using Energy Plus simulations using local yearlong weather data.
Optimization Methodology
An optimal capacity estimation method based on energy credits is developed to yield zero year-end energy credits. The optimization employs a non-linear process that use objective function, energy resource installation bounds and non-linear/linear constraints as input.
The optimization methodology, illustrated in the flowchart of Figure 1, aims at resolving the objective function, defined in Equation 1, formulated to maximize the on-site energy generation by RES, while considering various constraints (Equations 2a–d).
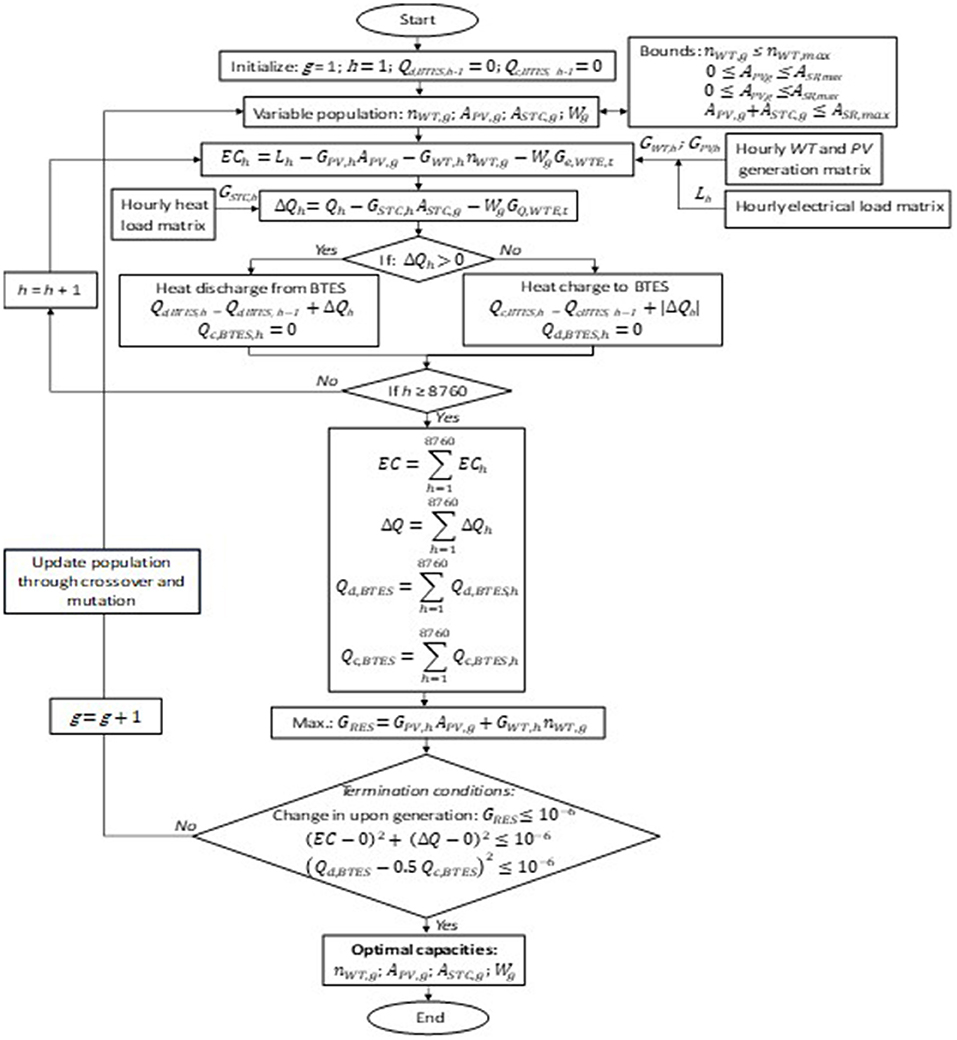
Figure 1. Proposed optimization methodology.
In Equation 1, the hourly electrical generation matrices (with hourly 8,760 values of GPV,h and GWT,h) are estimated on per unit area basis for PV and for vertical wind turbine (WT) of 5 kW using EnergyPlus. APV,g and nWT,g are the guessed values of the total PV area and of the number of WT, that are continuously updated by the optimization algorithm. Equations 2a,b represents lower and upper bounds for APV,g and nWT,g. Lower bounds for both these variables are kept at 0, whereas upper bounds ASR,max and nWT,max are assumed as 52,451 m2 and 1,200 as per the available surfaces within the neighborhood (see above). Equations 2c,d represent non-linear constraints for the problem. Equation 2d is formulated to design the BTES within this optimization process to meet the thermal load. Equation 3 presents EC which is the annual difference between annual electrical load (yearly summation of Lh) and generations by PV, WT and WtE-CHP is estimated.
To evaluate EC, the hourly yearly electrical load matrix presenting 8,760 values of Lh is supplied as input. This matrix is evaluated using Energy Plus simulations. GPV,hAPV,g and GWT,hnWT,g indicate the electrical generations by PV and WT. WgGe,WTE,t represents the yearly generation by WTE-CHP plant, where, Wg is the guessed value of annual waste input and Ge,WTE,t is electricity generation by one ton of municipal waste (i.e., 650 kWh) (Hachem and Grewal, 2019). First the problem is minimized limiting Wg at zero. If the value of EC doesn't approach zero, then the guessed value of Wg becomes non-zero. In summary, the given objective function (Equation 1) is first minimized using renewable energy sources, and then, if the generation by renewable energy resources is not sufficient, WtE-CHP is employed to bridge the gap in electric energy requirement.
Thermal Energy in SC2 and SC3
For SC2 and SC3, the thermal loads need to be satisfied. The generation from flat plate solar thermal collectors and WtE-CHP is considered simultaneously (see Equation 4). The difference between thermal load and thermal generation by STC and WtE-CHP (△Q in Equation 2c) is evaluated using Equation 4 below:
where, Qh and GSTC,h are hourly thermal load and STC generation for per m2 area estimated using Energy Plus. The positive value of △Q means that the generation by STC and WtE-CHP is insufficient, while its negative value indicates the availability of excessive thermal energy. This excess heat is stored in BTES, represented by the term Qc,BTES in Equation 2d. Qd,BTES indicates the heat discharged from BTES when the value of △Q is non-positive. Around 50% of heat charged into BTES is assumed to be utilized in the neighborhood, leading to the formulation of the constraint in Equation 2d (Cabeza, 2014). Equation 2c ensures meeting of electrical and heating loads.
Furthermore, since the total south facing roof area (ASR,max) can be used for PV and STC installations, the formulation of the following constraint (Equation 5) is required in solving the optimization problem.
The genetic algorithm (GA) (Singh and Hachem-Vermette, 2019) is employed for the optimization process presented in the flowchart of Figure 1. GA toolbox of Mat lab is employed in this process (Math Works, 2020b), which starts with the generation or iteration (g = 1) of GA along with initialization of hour, h = 1, Qd,BTES,h−1 = 0, and Qc,BTES,h−1 = 0. Then GA creates initial random population for given variables – APV,g, nWT,g, ASTC,g and Wg. In the next step energy credits at given hour (ECh) followed by of △Qh are estimated. Accordingly, heat storage or extraction from BTES is decided as explained above. This process repeats till the value of hour reaches 8,760 (annual number of hours). Thereafter, cumulative yearly values of EC, △Q, Qd,BTES, and Qc,BTES are evaluated. Finally, the objective function GRES is evaluated followed by a check on termination conditions. There are three criteria for termination of the optimization process and all three have to be met: (i) change in objective function upon successive generation is <10−6, (ii) year-end EC and total heat load have to be fulfilled, (EC − 0)2 + (△Q − 0)2 ≤ 10−6, and (iii) heat discharge y can be applied to different sites employing yearlong hourly matrices for solar and from BTES must be equal to 50% of heat charged into BTES . This calculation process is supplied to GA toolbox as a function (Math Works, 2020a).
If termination conditions remain unsatisfied, next generation/iteration is performed (g = g + 1) by updating the population using mutation and crossover processes. Once all the termination conditions are satisfied, the optimal mixture of energy resources is identified.
The proposed methodology can be applied to different sites employing yearlong hourly matrices for solar and wind. Hence, user can perform Energy Plus simulations with local weather data file to plug the site-specific matrices to the optimization process.
Results
This section summarizes the main results in two sub-sections. In the first sub-section, the optimal mixtures of energy resources obtained by employing the proposed optimization methodology are discussed. Thereafter, the hourly energy generation and demand profiles are simultaneously analyzed to visualize the interaction between various energy resources, on a yearly basis as well as on peak electrical load days (PELDs) and peak heat load days (PHLDs).
Optimal Mixtures
The developed optimization methodology is applied to a mixed-use sample neighborhood (see description above). The results aim at determining optimal and near optimal mix of renewable and alternative energy sources, to achieve net zero energy status. Table 1 presents the near optimal combinations of energy mixture, associated with the three scenarios SC1, SC2 and SC3 (characterized by the source of energy for various building operations–see above).
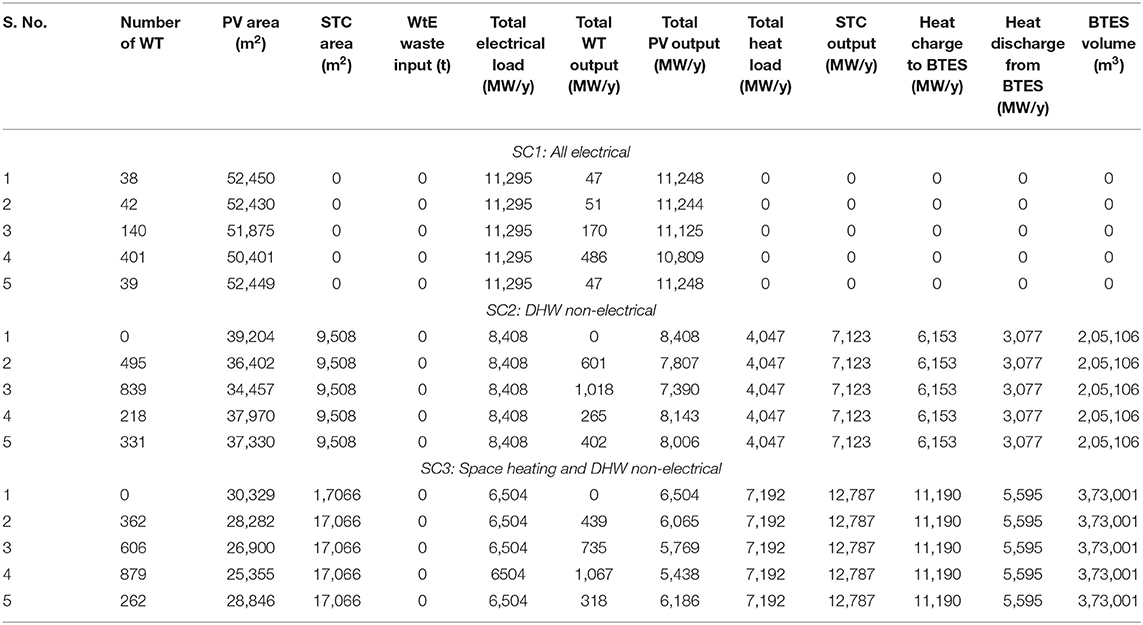
Table 1. Near optimal combinations of energy resource mixture for net-zero energy mixed-use neighborhood.
For SC1–an all-electrical neighborhood, the satisfaction of the total electrical load can be ensured by utilizing a maximum south facing roof area for PV panels (52,450 m2) and 38 wind turbines (WT). For this scenario, no STC and BTES are required since space heating and DHW are satisfied by electricity. Various near optimal combinations are presented for SC1 (see Table 1), as well.
The analysis of SC2-all electrical except for DWH-, combination one shows that no wind turbine (WT) is required to achieve net-zero energy status, whereas, 39,204 m2 and 9,508 m2 of PV and STC, associated with 75% (for PV) and 25% (for STC) of the total available roof area, are needed. The thermal energy is served partially by STC (about 24%) and by the BTES (76%) which store the excess generation of the STC system. A BTES volume of 2,05,106 m3 is estimated to fulfill the total thermal load. Interestingly, no WtE generation is required to achieve net-zero energy for this scenario (SC2). Alternatively, other mixtures of wind turbines and PV panels reaching net-zero energy mixed-use neighborhood can be obtained (see combinations two to five). STC area and BTES volume along with energy contents remain unchanged.
Similarly, near optimal combinations are estimated for SC3–where both heating and DHW are non-electric. Due to less electrical load, a PV area of 30,329 m2 (58% of available roof area) and STC area of 17,066 m2 (32% of available roof) are required. No wind turbines are needed in this combination. To serve the yearly heat load of 7,192 MW, STC produce 12,787 MW/y of thermal output, out of which 11,190 MW is charged to the BTES. To fulfill the hourly demand of heat load, 5,595 MW (50%) of thermal energy is discharged from the BTES. Other near optimal combinations of WT and PV to achieve net-zero energy status SC3 are presented in Table 1.
Hourly Load Variation
This sub-section presents selected results of the interaction between the energy generated by renewable sources and the electric grid. This is discussed on a yearly basis (Figure 2) and for specific days–peak electric load days (PELDs) (see Figure 3). The peak heat load days (PHLDs) and interaction between demand, STC and BTES, for SC2 and SC3 are presented as well (Figure 4).
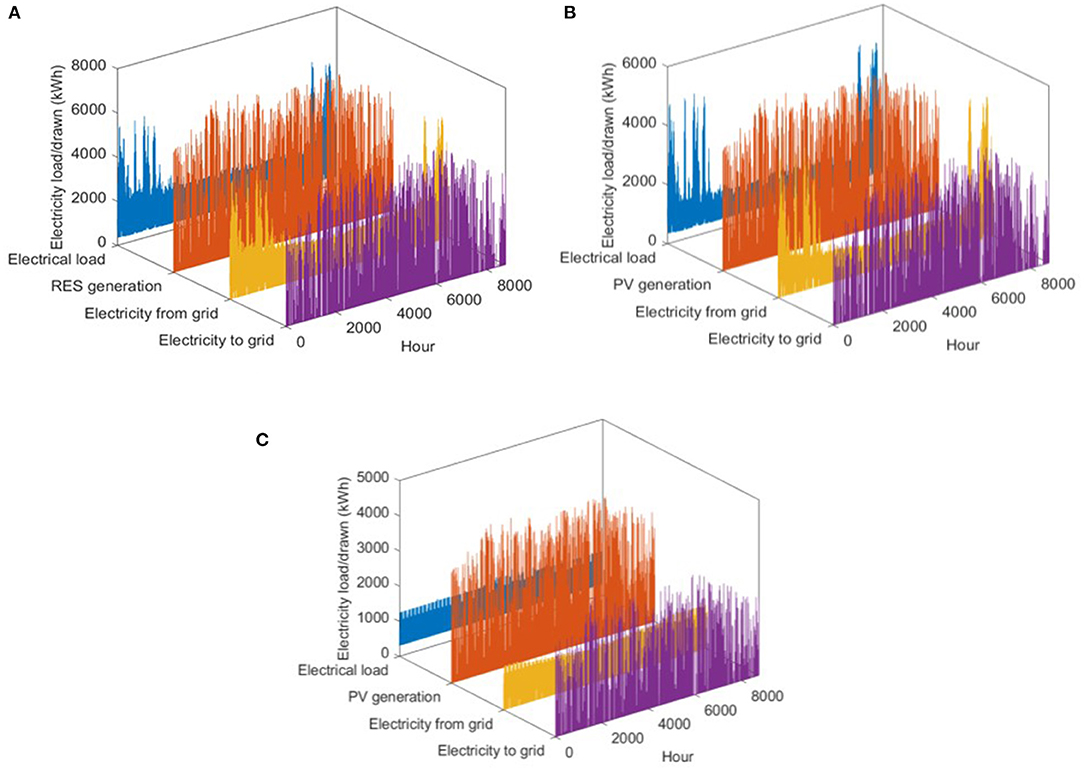
Figure 2. Hourly electrical load, PV generation, electricity sold to grid and bought from grid for (A) SC1, (B) SC2 and (C) SC3.
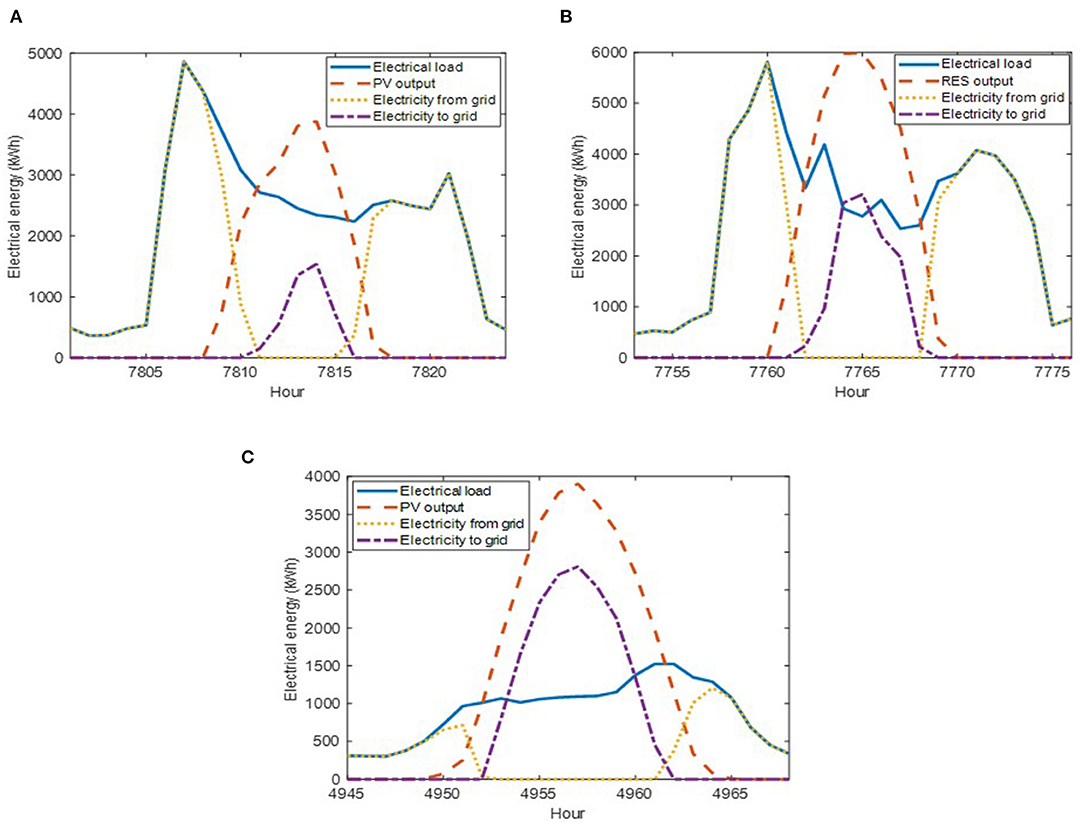
Figure 3. Electrical load, PV output, electricity received from grid, and electricity supplied from grid for peak electrical load days (PELDs) in (A) SC2 SC1, (B) SC2 and (C) SC3.
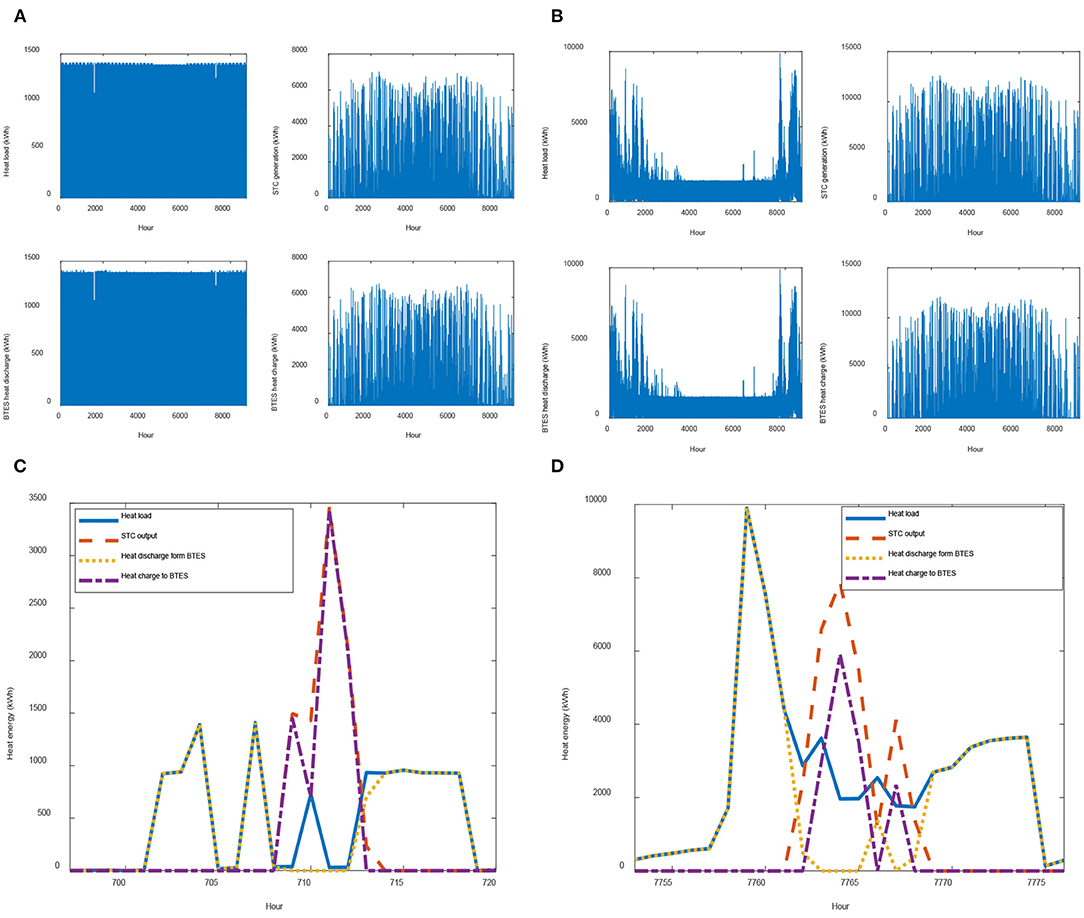
Figure 4. Hourly heat load, STC generation, heat discharged from BTES and charged to BTES for (A) SC2 and (B) SC3; for peak heat load days (PHLDs) in (C) SC2 and (D) SC3.
In Figure 2A, the hourly variation in electrical load, RES generation (PV + WT), and electricity drawn from and supplied to the grid of SC1 are presented. The maximum hourly load reaches 5,810 kWh (8 a.m. in the morning of a winter day) and to fulfill this load all the electricity is drawn from the grid due to non-availability of electricity from RES. The RES generation hourly peak reaches 7,252 kWh and the maximum peaks electricity supplied to the grid is about 6,209 kWh.
Figure 2B presents the energy interaction of the first combination of SC2 (no WT required), including the hourly electrical load, the hourly variation of PV generation, electricity drawn from grid, and supply of excessive electricity to the grid. It can be noticed that excess electricity is generated in non-winter months from PV panels, the majority of which can be sold to the grid, earning energy credits. During winter peak load months, electricity can be withdrawn from the grid against earned energy credits. Maximum hourly PV generation reaches around 5,400 kWh during summer months, whereas, excessive hourly supply to the grid reaches around 4,700 kWh. Similarly, results of SC3 are presented in Figure 2C. In this case the maximum hourly PV generation reaches around 4,200 kWh and maximum hourly electricity sold to the grid reaches 3,650 kWh during summer months. The maximum hourly electrical load is about 1,522 kWh, whereas, a maximum of 1,269 kWh of electricity is drawn from the grid during the insufficient on-site generation. The analysis of days with peak electrical load (PELD-yearly maximum) is briefly discussed below.
Figure 3 presents the electrical load, generation and grid interaction profiles of three PELDs associated with SC1, SC2 and SC3. In Figure 3A, for SC1 an hourly peak load of around 5,810 kWh is satisfied using the grid due to non-availability from RES (8 a.m. in the morning, winter day). The excess generation by RES supplied to the grid reaches a maximum of 3,000 kWh during daytime due to excess production by the PV system at 12 p.m.
Similarly, for SC2, the peak load is observed during the non-availability of PV electricity (Figure 3B). This peak is due to excessive space heating requirements of the mixed-use neighborhood. During the daytime, the peak load decreases while the PV generation surges. An excess electricity generation by PV panels is supplied to the grid (maximum reaches around 1,400 kWh).
For SC3 in Figure 3C, the maximum hourly electrical load is significantly less than the two other scenarios. The maximum electricity supplied to the grid is around 2,700 kWh during the maximum peak load day. The comparison between SC2 and SC3 shows that, to achieve net-zero energy status, SC3 imposes less stress on the grid.
The hourly variations in thermal load, generation by STC, and heat charge and discharge flows to/from BTES are indicated in Figure 4, for SC2 and SC3. The maximum yearly thermal load for SC2 (DHW only) is around 1,409 kWh (Figure 4A), and the maximum STC thermal output reaches around 7,000 kWh. The maximum thermal energy hourly employed to charge the BTES is around 6,750 kWh, whereas, the maximum hourly heat discharge is equal to the maximum heat load (i.e., 1409 kWh). Similarly, for SC3 (Figure 4B), the yearly maximum hourly heat load is around 9,897 kWh. The maximum thermal output by STC is close to 12,580 kWh, while the maximum hourly charge and discharge are 12,086 kWh and 9,897 kWh, respectively.
The hourly variations of peak heat load days (PHLDs) in case of SC2 and SC3, are presented in Figures 4C,D. Two morning peaks are observed for SC2 (Figure 4C) due to DHW demand. These peaks are satisfied using heat discharged from the BTES. The maximum STC thermal output during the PHLD reaches around 3,500 kWh, which is employed to charge the BTES. Similarly, during the evening, the DHW heat load is served using the BTES. For SC3, as depicted in Figure 4D, a significant morning heat load peak of 10,000 kWh (space heating + DHW) is served using the BTES. The maximum hourly thermal output by STC is about 8,000 kWh, whereas the maximum heat charged to BTES reaches a peak of about 6,000 kW.
Discussion and Concluding Remarks
This paper presents a methodology developed to optimize the mixed of energy resources, within a neighborhood, to achieve net-zero energy status. The energy resources include PV systems, solar thermal collectors, wind turbines, waste to energy and thermal storage. The methodology prioritizes the implementation of PV and wind turbines to satisfy the electric load, subsequently, if the electrical requirement is not fulfilled, it estimates waste based energy needed to meet the electric load. For scenarios where DHW and/or space heating are non-electric, STC and BTES are exploited and sized to meet the thermal load of the neighborhood. STC and PV are assumed to share the south facing available roof areas, in all neighborhood buildings. The developed methodology allows to identify days with maximum peak electric and thermal loads, and interaction between various technologies and the conventional electric grid.
The methodology is applied to a sample mixed use neighborhood, with three scenarios of energy operations: SC1-all electric, SC2-all-electric except for DHW, and SC3-both DHW and space heating are non-electric. For all electric scenario PV systems, implemented in all available south facing roof areas together with a limited number of wind turbines can achieve NZE status. Different combinations of these two technologies yield relatively similar results. For the other two scenarios SC2 and SC3, STC and BTES need to be considered to fulfill the partial or total thermal loads, allowing significant size reduction of the PV system and number of wind turbines (WT). The area employed for PV is reduced by 25% for SC2, and 48% for SC3, whereas WT installation is cut by up to 100% for both SC2 and SC3. The remaining areas of the roofs are then employed to integrate the STC systems.
Although in all cases of the considered scenarios WtE is not required, it can be used to shave peak electrical load, reducing the stress on the grid. This methodology can be employed for the design of an integrated urban energy system, in different neighborhood configurations.
Concluding Remarks
The optimization methodology presented in this paper is applied to a hypothetical high energy performance neighborhood, designed under a Northern, mid-latitude climatic zone. This methodology can be however applied to existing and new neighborhoods, in different climatic zones, and with different geographic and energy characteristics.
This work concentrates on the technical aspects of energy resources and their theoretical feasibility within the proposed hypothetical neighborhood. Other aspects related to governance and regulatory challenges may play an important role in the application of such urban energy mix into actual neighborhoods and can be considered in future studies. Gaining insight into optimal mix of urban energy systems and their feasibility can assist many sectors including public and private stakeholders in their efforts to increase resilience and sustainability of urban areas.
Data Availability Statement
The original contributions presented in the study are included in the article/supplementary material, further inquiries can be directed to the corresponding author.
Author Contributions
All authors listed have made a substantial, direct and intellectual contribution to the work, and approved it for publication.
Conflict of Interest
The authors declare that the research was conducted in the absence of any commercial or financial relationships that could be construed as a potential conflict of interest.
Publisher's Note
All claims expressed in this article are solely those of the authors and do not necessarily represent those of their affiliated organizations, or those of the publisher, the editors and the reviewers. Any product that may be evaluated in this article, or claim that may be made by its manufacturer, is not guaranteed or endorsed by the publisher.
Abbreviations
AES, alternative energy sources; APV, area of PV installation [m2]; ASR,max, maximum available area for solar installations [m2]; APV,STC, area of solar thermal installation [m2]; CHP, combined heat and power; DHW, domestic hot water; GPV, electricity generated by PV [kWh]; GSTC, STC generation for per m2 of area [kWh]; GWT, electricity generated by WT [kWh]; Ge,WTE,t, electricity generated by WtE-CHP per ton of waste [kWh]; EC, energy credits [kWh]; L, electrical load [kWh]; nWT, number of WT; NZE, Net zero energy; PELDs, peak electric load days; PHLDs, Peak heat load days; Q, heat [kWh]; RES, renewable energy sources; SC, neighborhood energy scenario; STC, solar thermal collectors; W, quantity of waste [t].; Subscripts: BTES, borehole thermal storage; c, heat charged into BTES; d, heat discharged from BTES; h, hourly; g, guessed value; max, maximum value; min, minimum value; NG, natural gas; PV, photovoltaic; WT, wind turbines; WtE, waste to energy.
References
Cabeza, L. F. (2014). Advances in Thermal Energy Storage Systems: Methods and Applications. Cambridge: Elsevier Science.
Catalogue of WtE Facilities in the Sweden (2015). Available online at: https://research.gsd.harvard.edu/wte/files/2017/01/160602CatalogueSweden2.pdf (accessed February 2020).
Falke, T., Krengel, S., Meinerzhagen, A. K., and Schnettler, A. (2016). Multi-objective optimization and simulation model for the design of distributed energy systems. Appl. Energy 184, 1508–1516. doi: 10.1016/j.apenergy.2016.03.044
Fonseca, J. A., Nguyen, T. A., Schlueter, A., and Marechal, F. (2016). City energy analyst (CEA): integrated framework for analysis and optimization of building energy systems in neighborhoods and city districts. Energy Build. 113, 202–226. doi: 10.1016/j.enbuild.2015.11.055
Hachem, C. (2016). Impact of neighborhood design on energy performance and GHG emissions. Appl. Energy 177, 422–434. doi: 10.1016/j.apenergy.2016.05.117
Hachem, C., Cubi, E., and Bergerson, J. (2016). Energy performance of a solar mixed-use community. Sustain. Cities Soc. 27, 145–151. doi: 10.1016/j.scs.2015.08.002
Hachem, C., and Grewal, K. S. (2019). Investigation of the impact of residential mixture on energy and environmental performance of mixed use neighborhoods. Appl. Energy 241, 362–379. doi: 10.1016/j.apenergy.2019.03.030
Hachem-Vermette, C., and Singh, K. (2020). Developing an optimization methodology for urban energy resources mix. Appl. Energy 269:115066. doi: 10.1016/j.apenergy.2020.115066
Harley, R. G., and Infrastructure, X. (2012). Waste-to-Energy. Available online at: http://web-resol.org/textos/09_st_01_xicon_waste-2-energy.pdf
Hezaveh, S. H., Bou-Zeid, E., Dabiri, J., Kinzel, M., Cortina, G., and Martinelli, L. (2018). Increasing the power production of vertical-axis wind-turbine farms using synergistic clustering. Bound. Layer Meteorol. 169, 275–296. doi: 10.1007/s10546-018-0368-0
International Solid Waste Association (ISWA) (2013). Guidelines: Waste to Energy in Low and Middle Income Countries. International Solid Waste Association (ISWA).
Jing, R., Wang, M., Liang, H., Wang, X., Li, N., Shah, N., et al. (2018). Multi-objective optimization of a neighborhood-level urban energy network: considering game-theory inspired multi-benefit allocation constraints. Appl. Energy 231, 534–548. doi: 10.1016/j.apenergy.2018.09.151
La Scala, M., Vaccaro, A., and Zobaa, A. F. (2014). A goal programming methodology for multiobjective optimization of distributed energy hubs operation. Appl. Therm. Eng. 71, 658–666. doi: 10.1016/j.applthermaleng.2013.10.031
Li, L., Mu, H., Li, N., and Li, M. (2016). Economic and environmental optimization for distributed energy resource systems coupled with district energy networks. Energy 109, 947–960. doi: 10.1016/j.energy.2016.05.026
Llanes, J. L., and Kalogirou, E. (2019). Waste-to-energy conversion in Havana: technical and economic analysis. Soc. Sci. 8:119. doi: 10.3390/socsci8040119
Loonen, R. C. G. M., Trčka, M., Cóstola, D., and Hensen, J. L. M. (2013). Climate adaptive building shells: state-of-the-art and future challenges. Renew. Sustain. Energy Rev. 25, 483–493. doi: 10.1016/j.rser.2013.04.016
Math Works (2020a). Declare Function Name, Inputs, and Outputs–MATLAB function. Available online at: https://www.mathworks.com/help/matlab/ref/function.html (accessed April 27, 2021).
Math Works (2020b). Genetic Algorithm–MATLAB and Simulink–MathWorks. Available online at: https://www.mathworks.com/help/gads/genetic-algorithm.html (accessed April 27, 2021).
Murray, P., Orehounig, K., Grosspietsch, D., and Carmeliet, J. (2018). A comparison of storage systems in neighbourhood decentralized energy system applications from 2015 to 2050. Appl. Energy 231, 1285–1306. doi: 10.1016/j.apenergy.2018.08.106
National Renewable Energy Laboratory (NREL) (2016). EnergyPlus. Available online at: https://energyplus.net/ (accessed November 28, 2018).
Parra, D., Norman, S. A., Walker, G. S., and Gillott, M. (2017). Optimum community energy storage for renewable energy and demand load management. Appl. Energy 200, 358–369. doi: 10.1016/j.apenergy.2017.05.048
Sikder, S., Eanes, F., Asmelash, H., Kar, S., and Koetter, T. (2016). The contribution of energy-optimized urban planning to efficient resource use–a case study on residential settlement development in Dhaka City, Bangladesh. Sustainability. 8:119. doi: 10.3390/su8020119
Singh, K., and Hachem-Vermette, C. (2019). Impact of commercial land mixture on energy and environmental performance of mixed use neighbourhoods. Build. Environ. 154, 182–199. doi: 10.1016/j.buildenv.2019.03.016
Singh, K., and Hachem-vermette, C. (2021). Economical energy resource planning to promote sustainable urban design. Renew. Sustain. Energy Rev. 137:110619. doi: 10.1016/j.rser.2020.110619
Tsai, W. T. (2019). An analysis of operational efficiencies in the waste-to-energy (WTE) plants of Kaohsiung municipality (Taiwan). Resources 8:125. doi: 10.3390/resources8030125
University of Wisconsin Solar Energy Lab (1990). TRNSYS: A Transient System Simulation Program. University of Wisconsin. Available online at: https://books.google.ca/books?id=f3oSPQAACAAJ (accessed March, 2020).
Wang, L., Zhang, B., Li, Q., Song, W., and Li, G. (2019). Robust distributed optimization for energy dispatch of multi-stakeholder multiple microgrids under uncertainty. Appl. Energy 255:113845. doi: 10.1016/j.apenergy.2019.113845
Keywords: optimization methodology, urban energy mix, renewable energy, alternative energy, waste to energy, net zero energy
Citation: Hachem-Vermette C and Singh K (2021) Analysis of Urban Energy Resources to Achieve Net-Zero Energy Neighborhoods. Front. Sustain. Cities 3:663256. doi: 10.3389/frsc.2021.663256
Received: 02 February 2021; Accepted: 28 September 2021;
Published: 27 October 2021.
Edited by:
Ursula Eicker, Concordia University, CanadaReviewed by:
Edgar Antonio Barragán, Salesian Polytechnic University, EcuadorSujit Sikder, Leibniz Institute for Ecological Urban and Regional Development (IOER), Germany
Copyright © 2021 Hachem-Vermette and Singh. This is an open-access article distributed under the terms of the Creative Commons Attribution License (CC BY). The use, distribution or reproduction in other forums is permitted, provided the original author(s) and the copyright owner(s) are credited and that the original publication in this journal is cited, in accordance with accepted academic practice. No use, distribution or reproduction is permitted which does not comply with these terms.
*Correspondence: Caroline Hachem-Vermette, caroline.hachem@ucalgary.ca