On translational control by ribosome speed in S. cerevisiae
 Eleanna Kazana
  Tobias von der Haar*
- Kent Fungal Group, School of Biosciences, University of Kent, Canterbury, United Kingdom
Introduction: In addition to the widespread and well documented control of protein synthesis by translation initiation, recent evidence suggests that translation elongation can also control protein synthesis rates. One of the proposed mechanisms leading to elongation control is the interference of slow ribosome movement around the start codon with efficient translation initiation. Here we estimate the frequency with which this mode of control occurs in baker’s yeast growing in rich medium.
Methods: We interrogate published genome-wide datasets for evidence of transcripts associated with queueing small ribosomal subunits, and confirm results from these surveys using additional experimental work.
Results: Our analyses reveal that transcripts from around 20% of yeast genes show evidence of queueing ribosomes, which may be indicative of translation elongation control. Moreover, this subset of transcripts is sensitive to distinct regulatory signals compared to initiation-controlled mRNAs, and such distinct regulation occurs, for example, during the response to osmotic stress.
Discussion: Our analyses provide a first quantitative estimate for the prevalence of translational control exerted via the elongation stage in a commonly used model organism, and suggest that transcript under elongation control form a separately addressable RNA regulon.
Introduction
Translation exerts rate control over gene expression, in the sense that it determines the basal protein production rate for all cellular transcripts under any given growth condition. Because translation controls basal gene expression rates, it is also an important target for regulation when gene expression rates need to be adapted to challenging environments or to developmental needs (Hershey et al., 2012). Here we examine the relationship between “control” and “regulation” in translation, where we strictly use control to mean rate control, i.e., the reason why a process occurs with a particular rate in a steady state, whereas we use regulation to mean a process that acts to change control and thereby change the rates of the process. By way of example, the amount of protein made from most eukaryotic transcripts is assumed to be limited by translation initiation rates (these transcripts are initiation controlled), and under conditions of stress the amount of protein made from these transcripts can be changed by regulating the different translation initiation factor activities.
The three stages of translation (initiation, elongation and termination) make distinct contributions to translational control and translational regulation. Translation initiation, i.e., the formation of productive ribosome-mRNA contacts, was long thought to more or less exclusively exert translational control. However, recent studies have revealed that translation elongation, i.e., the movement of ribosomes along the ORF and the concurrent tRNA-dependent decoding of the codon sequence, can also control gene expression, and can be targeted to regulate protein levels (Knight et al., 2020). For example, elongation can be rate limiting in cancers (Faller et al., 2015), dynamic tRNA modifications (Roundtree et al., 2017) and regulation of translation elongation factor 2 by phosphorylation (Kenney et al., 2014) can regulate individual transcripts by modifying elongation rates, and the regulation of translation elongation during cooling (Knight et al., 2015) mediates effects of sub-physiological temperatures (Bastide et al., 2017).
While it is clear that translation elongation can control gene expression levels, the molecular mechanisms by which this happens are not comprehensively understood. Two specific mechanisms that have been identified which can connect translation elongation rates to expression levels is the Dhh1-dependent destabilisation of mRNAs containing slowly decoded codons (Pelechano et al., 2015; Presnyak et al., 2015; Radhakrishnan et al., 2016), and interference of slow moving ribosomes with efficient translation initiation (Chu et al., 2014). The relative importance of these two mechanisms for different genes has not been studied on a genome-wide basis, although our previous study on four recombinant proteins suggests that both predominantly ribosome movement-mediated and predominantly mRNA stability-mediated control can co-exist in different transcripts in the same cell (cf. Figure 2 in Chu et al. (2014)).
The identification of individual translation elongation-controlled mRNAs has so far been mostly anecdotal (Chan et al., 2012; Zhou et al., 2013; Bastide et al., 2017). Here, we sought to systematically identify translation elongation-controlled genes in baker’s yeast, focussing specifically on such genes where elongation control is mediated at the level of translational efficiency, rather than Dhh1-dependent mRNA stability effects. We find that around 20% of yeast genes display signals in ribosome footprinting experiments that may be consistent with translation elongation control, and for a small selection of these genes we provide experimental evidence that enhancing elongation speed does indeed increase their translation rates. We show that this subset of the transcriptome can be regulated by distinct regulatory signals, and that this may lead to distinct response dynamics during the onset of stresses.
Materials and methods
Analyses and data availability. Unless otherwise stated, data analyses were conducted using Python 3.0. Statistical analyses were performed using scipy.stats (Oliphant, 2007). All analysis scripts, Literature datasets and experimental raw data are available on GitHub.1
Data sources. Protein expression levels were retrieved from a meta-analysis of protein abundance data by (Ho et al., 2018). 5′-UTR length data were retrieved from the Supplementary Material from a number of studies (Miura et al., 2006; Nagalakshmi et al., 2008; Waern and Snyder, 2013). The longest 5’-UTR value reported in any of these three studies was used to apply the 45-nucleotide length cut-off for analysis of the SSU footprinting data. The SSU footprinting data published by (Archer et al., 2016) were retrieved using the table browser function of GWIPS-Wiz (Michel et al., 2014). uORF data were retrieved from (Ingolia et al., 2009). Data on secondary structure content were from (Kertesz et al., 2010) and translation initiation rates from (Ciandrini et al., 2013).
Yeast strains and plasmids. The standard yeast strain used in this work was BY4741 (Brachmann et al., 1998). All gene deletions were in this background and were from the systematic deletion collection (Giaever et al., 2002) except for the tef1::HIS3 deletion strain which was a kind gift from Paula Ludovico (University of Minho, Portugal).
Plasmids are listed in Table 1. Plasmid DNA, detailed plasmid maps and sequences are available through the Addgene repository.2
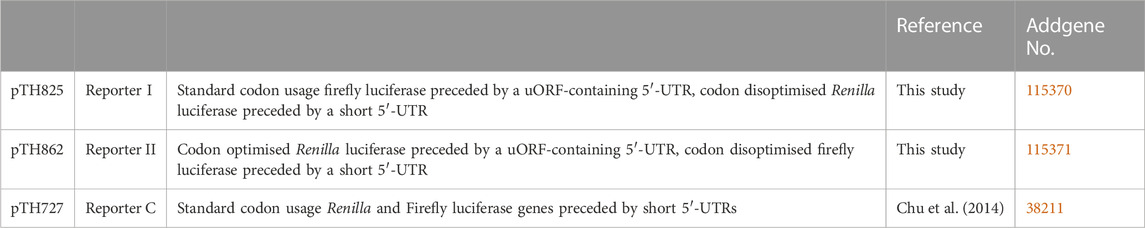
TABLE 1. Plasmids used in this study.
pTH825 (Reporter I) was generated by replacing the Renilla luciferase (RLuc) gene in pTH743 (Chu et al., 2011; 2014) with a codon-disoptimised RLuc gene described in the same publication, using XmaI and EcoRI restriction sites introduced adjacent to the start and stop codon by PCR.
pTH862 (Reporter II) was generated by cloning a Renilla luciferase gene which had been codon optimised as described (Chu et al., 2014) into pTH644 (Chu et al., 2011) using XmaI and EcoRI sites. A Gcn4-derived, uORF containing 5′-UTR sequence was amplified from pTH743 and introduced into the XmaI site preceding the codon-optimised RLuc gene. Finally, the firefly luciferase gene from pTH726 (Chu et al., 2014) was introduced into the BamHI and HindIII sites of the new vector.
Gene replacement strains. A strain containing the codon optimised HIS3 gene has been described (Chu et al., 2014).
To compare expression levels of the wild-type and optimised SUP35 gene, the optimised ORF sequence was combined with the natural SUP35 promoter and terminator sequences in plasmid pUKC1620 (von der Haar et al., 2007) using a Gibson assembly strategy (Gibson et al., 2009). The resulting plasmid and a wild-type plasmid for comparison were shuffled into yeast strain LJ14, which contains a chromosomal deletion of the SUP35 gene (von der Haar et al., 2007).
For the five remaining genes analysed in this study, the general strategy for constructing the gene replacement strains included the following steps: 1) design and synthesis of codon optimised sequences including upstream and downstream flanking sequences to facilitate homologous recombination with the corresponding genomic locus; 2) generation of CRISPR guide RNA vectors targeting the gene; 3) co-transformation of a wild type yeast strain with a guide RNA vector and the matching linearised, optimised gene; 4) confirmation of integration of the optimised gene by diagnostic PCR; and 5) assessing resulting changes to protein and RNA levels using western blotting and qPCR. Detailed procedures for these steps are given in Supplementary Figure S2.
Dual luciferase assays. These were conducted in 96-well format as described (Merritt et al., 2010). Prior to analyses, plates containing the source cultures were visually inspected for contaminated wells, and corresponding data points were disregarded for data analyses.
Western Blots. Protein extracts were prepared and western blots performed as described (von der Haar, 2007). Rabbit antibodies were sourced from the following publications or companies: anti-HA (Sigma Aldrich, United Kingdom, H6908), anti-Cdc10 (Abmart, NJ, United States, X2-P25342), anti-Ras2 (santa Cruz Biotechnology, TX, United States, Sc-6759), anti-Sup35 (von der Haar et al., 2007), anti-Ade2 (Allen et al., 2005), anti-Grx5 (Rodriguez-Manzaneque et al., 2002), anti-NBP35 (Hausmann et al., 2005).
Results
5′-proximal ribosome speed throughout the yeast transcriptome
Because start codons can only be occupied by a single ribosome at a time, mRNA-specific protein synthesis rates are controlled by translation elongation whenever the rate of translation initiation attempts exceeds the rate with which ribosomes elongate away from the start codon (Chu et al., 2014). The rate of ribosome movement is sequence dependent and controlled by codon usage patterns (Gardin et al., 2014), mRNA secondary structure (Tuller et al., 2011), the charge of the nascent chain within the ribosomal exit tunnel (Charneski and Hurst, 2013), and the readiness of particular amino acids to undergo peptidyl transfer (Pavlov et al., 2009). Although ribosome speed can thus be affected by many different mechanisms, models which exclusively consider tRNA:codon interactions as determinants of ribosome speed can predict protein yields with high degrees of accuracy (Chu et al., 2014). This, together with the recent finding that ribosome collision sites are strongly enriched near the start codon (Diament et al., 2018), predicts that codon-dependent ribosome speed near the start codon is an important determinant of translational control. We therefore initiated our analyses of elongation-controlled mRNAs in the yeast transcriptome by analysing codon-dependent ribosome speed immediately following the start codon, as a non-exhaustive but useful potential indicator of mRNAs which might be subject to control by translation elongation.
We used our published, model-based decoding time estimates for each codon (Chu et al., 2014) to calculate the speed of decoding of the first ten codons following the start codon (approximately the span of one ribosome) throughout the entire yeast transcriptome. In addition to the decoding speed of the observed sequences, we also computed decoding speeds of random sequences encoding the same peptides as the actual genes, and determined the proportion of sequences that were more extreme in their speed than the observed sequence. If the observed sequence was faster than the mean decoding speed of the random sequences “more extreme” meant the proportion of random sequences faster than the observed sequence, whereas if the observed sequence was slower than the mean random sequence “more extreme” meant the proportion of random sequences slower than the observed sequence. The negative logarithm of this proportion (p) gives an estimate of the probability of observing the actual decoding speed of a gene if codon usage for this gene was entirely random.
Plotting p against absolute speed for all yeast genes results in a volcano plot (Figure 1A) which displays a clear skew towards fast sequences, reflecting the well-documented general codon bias in the yeast genome (Behura and Severson, 2013). To explore the observed distribution further, we selected the fastest, slowest, and central 5% of genes and analysed these groups with respect to particular features. The fastest group was associated with significantly higher expression levels than the other two groups, and the very highest expressed proteins were found exclusively within this group (Figure 1B). The fastest group also showed strong association with specific GO terms including cytoplasmic translation, consistent with the observation that ribosomal proteins show particularly high codon usage bias (Sharp et al., 1986). In contrast, the slowest group of genes was not associated with lower expression levels compared to the central group and was much less strongly associated with specific GO terms. This indicates that fast sequences are favoured in the yeast genome through evolutionary selection on genes whose functions require particularly high expression. In contrast, we detected no significant selection for slowly decoded sequences.
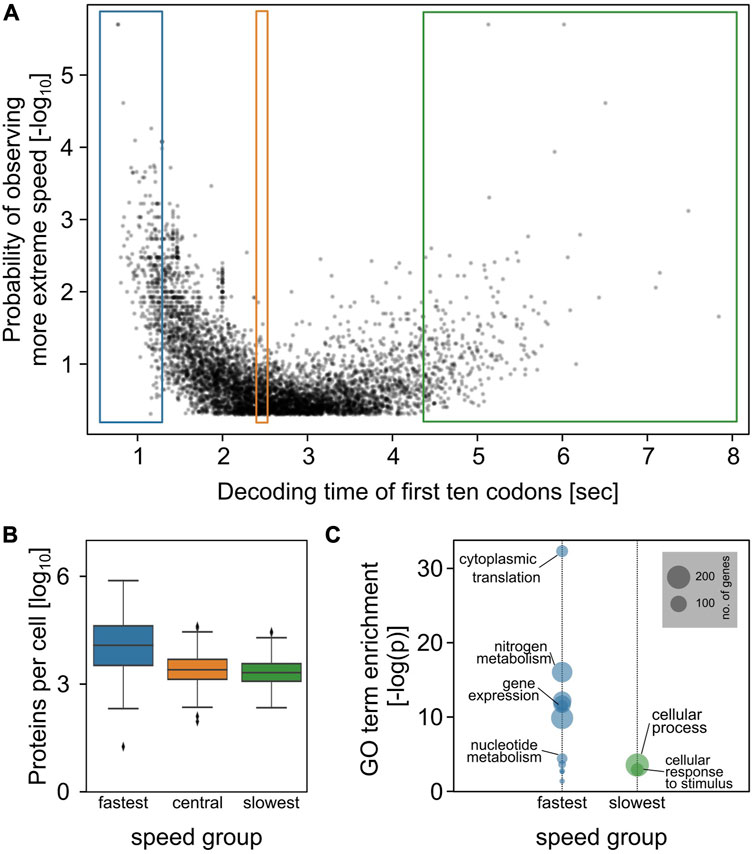
FIGURE 1. AUG-proximal speed throughout the yeast genome. (A), the decoding speed of the first ten codons of each yeast ORF was estimated based on our published computational models of codon decoding (Chu et al., 2014), and compared to the distribution of possible speeds for the same protein sequence. The plot relates the observed decoding time with the log probability of observing a more extreme decoding time. The coloured boxes indicate data points analysed in panels (B,C). (B) protein abundance of indicated data points. (C) Go annotation enrichment for indicated data points.
This observation is relevant to the question how and why elongation-controlled mRNAs arose in the yeast genome. A feature that places an mRNA under control of translation elongation is a combination of (relatively) high initiation and (relatively) slow elongation rates. In a population of mRNAs where initiation and elongation rates evolve randomly and independently, combinations of fast initiation and slow elongation could arise simply by chance. In this case, elongation-controlled mRNAs would be enriched among those that contain particularly slow codons, where the probability of a high initiation/elongation rate ratio is highest. Our observation that such mRNAs are not widely selected for implies that either elongation-controlled mRNAs themselves are also not widely selected for, or that selection for elongation-controlled mRNAs occurs by combined selection on initiation-and elongation-rate determining features.
Characterisation of the elongation-controlled transcriptome
In recent work, Archer et al. (2016) used translation complex profiling, a variant of the ribosome profiling approach (Iwasaki and Ingolia, 2017), to study footprints on mRNAs derived solely from small ribosomal subunits (SSUs). Since our previous findings indicate that mRNAs become elongation controlled when initiating ribosomes are prevented from accessing the start codon because the previous ribosome has not yet liberated this site (Chu et al., 2014), we expected that scanning 40S subunits may form queues 5’ of the start codon on such mRNAs. Queueing 40 S subunits should be detectable in the Archer et al. dataset. If we assume that initiating ribosomes physically cover around 30 nucleotides centred around the start codon itself, the centre of any small ribosomal subunit queueing immediately upstream should be somewhere in the region spanning nucleotides −60 to −15 upstream of the AUG (note that due to the trailing mass of translation initiation factors, scanning 40 S subunits produce larger footprints with less clearly defined boundaries compared to elongating ribosomes (Archer et al., 2016).
We retrieved the footprinting data generated by Archer et al. from the GWIPS-viz database (Michel et al., 2014), processed the data for each gene using a peak calling algorithm, and classified the genes into those containing an identifiable second peak of SSU footprints within the −60 to −15 region adjacent to the main SSU footprint peak over the ORF start codon, and those without such a peak (Figure 2A). Because upstream footprints can only occur on sufficiently long 5′-UTRs, we restricted this analysis to those mRNAs having 5′-UTRs longer than 45 nucleotides. All of the 3,477 genes with a 5′-UTR length above this cut-off showed a detectable small subunit peak centering round the start codon. In addition, 638 (18.3%) of these genes also showed a detectable second upstream peak, with a mean peak location around 50 nucleotides from the start codon (Figure 2A).
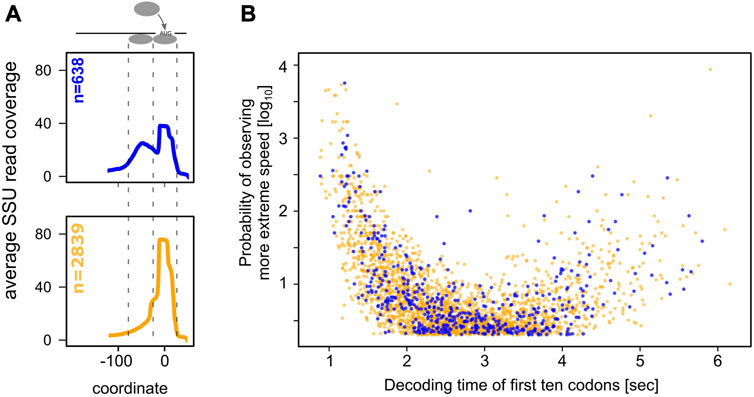
FIGURE 2. Scanning queues throughout the yeast genome. (A), metagene plots of small ribosomal subunit footprinting data from Archer et al. (2016), for genes with 5′-UTR lengths longer than 45 nucleotides. Separate metagene plots are shown for two classes of footprints, classified by the presence or absence of a second peak upstream of the main AUG peak corresponding to initiating subunits. Metagene plots are aligned to the start codon at position zero. (B), mapping of genes displaying signals for waiting small ribosomal subunits throughout the yeast genome. Colours correspond to panel (A). The volcano pot is identical to Figure 1A, but only shows genes with 5′-UTR lengths above 45 nucleotides.
We propose that the mRNAs displaying a second 40 S peak correspond to the elongation-controlled transcriptome (further experimental evidence for this is given below). However, our analyses could be confounded by other mechanisms attracting small ribosomal subunits to sites upstream of the main start codon, notably by translation initiation events on upstream open reading frames (uORFs). We therefore analysed the relationship between uORFs and apparent queuing SSU peaks in more detail. The proportion of genes with uORFs is similar in the gene subsets with and without a second peak (p = 0.67 by Fisher’s Exact Test), and second SSU peaks are therefore not generally associated with uORFs. Of those genes displaying second SSU peaks and also containing uORFs, the majority of uORF locations is outside of the −15 to −60 nt analysis window, and the observed second footprint peaks can thus not be results of uORF initiation (Supplementary Figure S1). Genes which do have uORFs within the analysis window comprise less than 5% of the “second SSU” set. Spot checks with representative genes (Supplementary Figure S1) indicate that for some but not all of these the second SSU footprints may indeed arise from uORF initiation events rather than from ribosome queuing, in particular those where the main ORF AUG footprints are substantially lower than the queuing footprints. In addition to uORFs with AUG start codons, yeast contain comparable numbers of uORFs with non-AUG start codons which are however less efficiently recognised (Spealman et al., 2018), and which could therefore contribute 40S peaks in locations where they could be mis-interpreted as queueing ribosomes at lower levels than AUG uORFs.Overall this suggests the proportion of genes mis-annotated as subunit queuing genes in our analyses due to interference from uORFs is < 5%.
When mapped against the 5′-decoding speed of the yeast transcriptome, the corresponding mRNAs appear randomly distributed without any strong association with specific speed properties (Figure 2B). Based on the considerations outlined in the previous section, this suggests that such mRNAs may have arisen as the result of selection on particular initiation/elongation rate ratios, rather than selection solely for slow movement. To explicitly test the assumption that mRNAs displaying a second peak in the Archer et al. dataset correspond to elongation-controlled mRNAs, we manipulated the ribosomal decoding speed of a number of yeast genes at their normal chromosomal loci in vivo. This involved designing and synthesizing speed-optimised gene sequences, replacing the original genes in the yeast genome using a CRISPR-based approach, and finally assessing the effect of speed optimisation on mRNA and protein expression levels for this gene. For any gene where ribosome speed restricts achievable translation initiation rates, we expect increases in decoding speed to increase the protein/mRNA ratio, but this should not be the case for initiation-controlled genes.
This assay, which we had originally used to demonstrate elongation control of the yeast HIS3 gene (Chu et al., 2014), is laborious and cannot be applied to large numbers of genes, but we reasoned that it would be a good way of verifying predictions from the Archer et al. dataset using a smaller number of genes. In addition to the HIS3 gene, we applied the assay here to six additional genes, for which we could source high quality antibodies and which span a range of decoding speeds (Figure 3A). Importantly, these genes were selected before the results from the SSU foot-printing analyses had been completed, and the experimenters were blind to the results from these analyses throughout the experimental procedure.
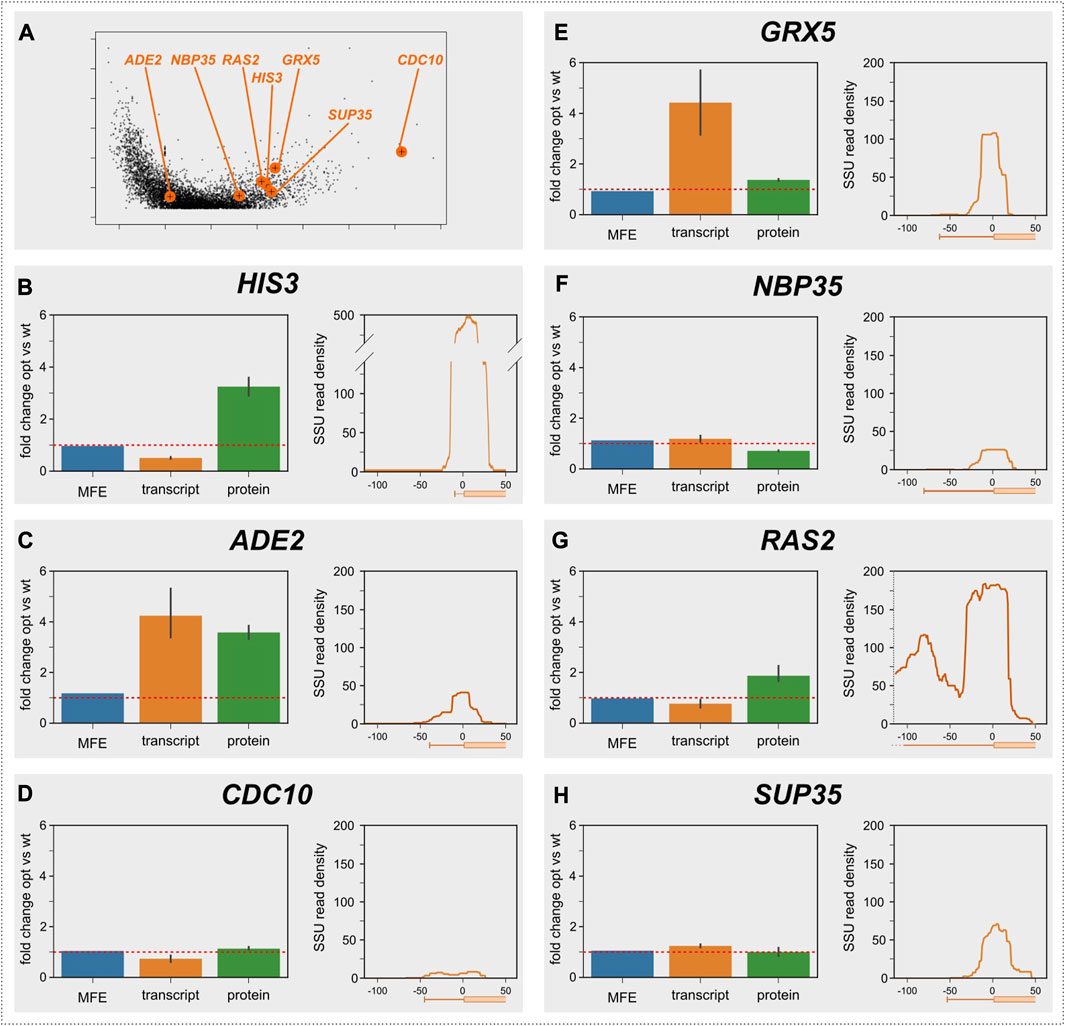
FIGURE 3. Control analysis of selected genes. (A), the location of the selected genes is indicated in the volcano plot from Figure 1A. (B–H), analyses of individual genes. For each gene, the predicted change in folding energy (as the mean free energy of the ensemble, MFE), the measured change in mRNA abundance, and the measured change in protein abundance are shown for the codon optimised vs. the original gene. The red lines indicate a ratio of 1, i.e., where codon optimisation does not change the quantified parameter.
The results of these assays are displayed in Figures 3B–H. The HIS3 gene (Figure 3B) has a very short 5′-UTR of 10 nt (Nagalakshmi et al., 2008), which is too short to accommodate a queueing 40S subunit. Although the protein/mRNA ratio for the His3 protein is increased by speed optimising the gene, confirming that the mRNA is elongation-controlled, this gene therefore does not show a second SSU peak in the Archer et al. dataset. The remaining six genes all have 5′-UTR lengths that should permit queueing ribosomes to form footprints, but only one of these (RAS2) actually showed clear evidence of a second footprint. RAS2 is also the only one of the six additionally tested genes for which the replacement assay led to a clear increase in the protein/mRNA ratio, confirming the link between elongation control of protein abundance and the presence of an upstream SSU footprint. CDC10 showed a weak increase in the protein/mRNA ratio as well as displaying a weak queueing ribosome peak, however these signals were obscured by the very low expression levels for this gene. The other four genes neither showed increased mRNA/protein ratios, nor evidence of upstream SSU footprints. Thus, for the sample of genes tested with this assay, the codon replacement assay and the SSU footprinting dataset arrive at a unanimous classification of genes as either elongation or initiation controlled. The observation that 18% of yeast genes with sufficiently long 5′-UTRs show footprints for queueing small ribosomal subunits thus suggests that this number is a good first estimate for the proportion of elongation-controlled genes in the yeast genome generally.
It should be noted that this proportion is specific to the physiological conditions of our assays, i.e., logarithmic growth in rich medium. Any change in growth conditions that entails, for example, a specific reduction in translation elongation rates would lead to the transfer of additional mRNAs into the elongation-controlled pool and vice versa. Under conditions of strong regulation (e.g., when translation initiation is essentially halted by phosphorylation of eIF2 during amino acid starvation, or when translation elongation is stalled globally by activation of eEF2 kinases) all mRNAs should become controlled by either translation initiation or elongation.
Separable regulation of initiation- and elongation-controlled transcripts
While substantial regulation of translation factor activity is predicted to eventually affect all transcripts, we reasoned that limited regulation of initiation factor activity should preferentially affect initiation-controlled mRNAs, whereas limited regulation of elongation factors should preferentially affect elongation-controlled mRNAs. The co-existence of initiation- and elongation-controlled sets of mRNAs in a cell could thus split the transcriptome into two separately addressable regulons.
To test the concept that such separate regulation can indeed occur, we designed a series of reporter constructs expressing two luciferases (Figure 4A). mRNAs encoding the two luciferases were placed either under initiation control (by combining an inefficient, uORF-containing 5′-UTR with an efficient, codon-optimised ORF), or under elongation control (by combining an efficient 5′-UTR with an inefficient, slow-codon containing ORF). The use uORFs to limit translation initiation activity on the main ORF means that the initiation controlled luciferase is synthesised following re-initiation, whereas the elongation-controlled luciferase is synthesised following normal translation initiation. However, we have previously demonstrated that the hand-over from elongation to initiation control on re-initiating constructs quantitatively matches model predictions built on the assumption of normal initiation, so that we do not expect that the choice of a re-initiation system fundamentally affects the behaviour of our constructs.
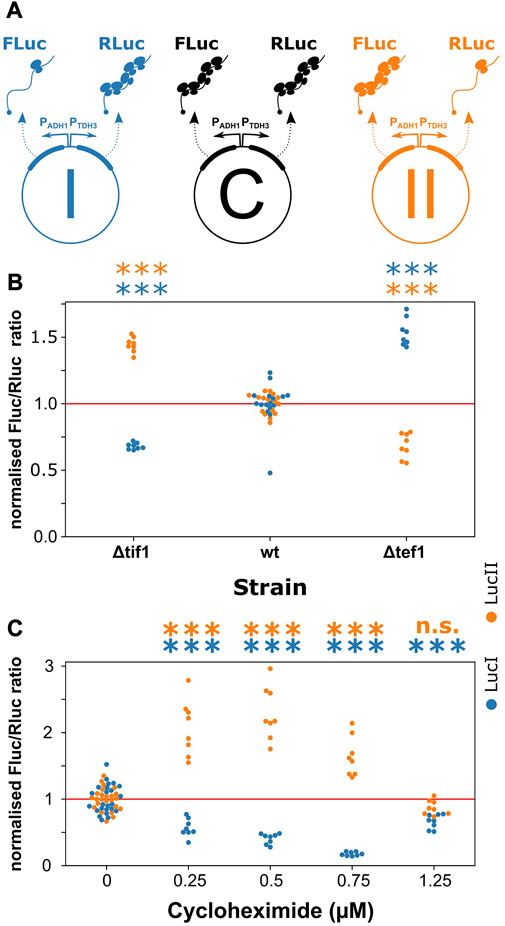
FIGURE 4. Elongation- and initiation-controlled mRNAs have distinct regulatory properties. (A), a series of reporter plasmids containing separately assayable luciferase genes either under initiation-control (FLuc in repoter I and RLuc in reporter II) or under elongation-control (Rluc in reporter I and FLuc in reporter II). Reporter C is designed to control for changes in transcriptional and post-translational regulation, and all data are normalised against the FLuc/RLuc ratio of this reporter. (B), strains which contain moderate translation initiation defects (Δtif1) or moderate translation elongation defects (Δtef1) shift the expression ratio between the luciferases, favouring expression of the mRNA controlled by the non-deficient pathway. (C), upon application of various concentrations of cycloheximide, which acts as a translation initiation inhibitor at low concentrations but as an elongation inhibitor at high concentrations, the expression ratios initially favour the elongation-controlled reporter before returning to a neutral ratio. Significance of the difference to the control condition (samples “wt” in panel (B) and “0” in panel (C)) was determined by ANOVA and Tukey’s test and is indicated (***, p < 0.001; n. s., p > 0.05).
In construct I (Figure 4A), we paired an initiation-controlled firefly luciferase with an elongation-controlled Renilla-luciferase gene, whereas the control regimes were inverted in construct II. In a control construct, C, both luciferases were placed under elongation control. By normalising the expression ratios observed with constructs I and II to construct C, and by ensuring that constructs I and II changed expression in opposite ways, we could reliably separate changes in expression resulting from the regulation of translation initiation or elongation from expression changes resulting from other regulatory events including transcription and protein turnover.
We measured changes in the expression ratio of the two luciferases in yeast strains containing a deletion of one of two identical isogenes for translation initiation factor 4A (tif1Δ, mimicking limited regulation of translation initiation), or a deletion of one of two identical isogenes for translation elongation factor 1A (tef1Δ, mimicking limited regulation of translation elongation). We observed that in the tif1Δ strain, where initiation activity was reduced, the expression ratio changed in favour of the elongation-controlled luciferase in both constructs I and II (Figure 4B). In contrast, in the tef1Δ strain, the expression ratio changed in favour of the initiation-controlled luciferase in each construct. We further tested the behaviour of our constructs upon addition of the translational inhibitor, cycloheximide. This inhibitor is generally used at high concentrations as a translation elongation inhibitor that interferes with the translocation step (Schneider-Poetsch et al., 2010), although at low concentrations in vivo it is thought to act as a translation initiation inhibitor before inhibiting elongation at higher concentrations (Oleinick, 1977). In our reporter constructs, the ratios of the two luciferases changed with cycloheximide addition in a concentration dependent manner consistent with this notion of dual inhibition. At low concentrations, the elongation-controlled luciferases were initially favoured but this trend became reversed at higher concentrations (Figure 4C). Thus, both genetic and chemical manipulation of translation initiation and elongation rates indicated that transcripts under distinct control regimes can indeed be separately addressed by translational control mechanisms.
Initiation-and elongation-control and regulation of gene expression during stresses
Having shown that initiation- and elongation-controlled yeast transcripts could in principle be addressed via distinct regulatory mechanisms, we wished to explore in how far this was used during natural gene expression regulation. For this purpose, we measured the luciferase ratios of our reporter assays under a number of different growth and stress conditions. We observed conspicuous divergent shifts of the luciferase ratios with changes in temperature (Figure 5A), which were consistent with relatively slower elongation rates at lower temperatures, and increased elongation rates at higher temperatures. Although this is to our knowledge the first report of regulation of translation elongation in sub-physiological temperatures in yeast, these findings mirror the known regulation of translation elongation during cooling in mammalian cells (Knight et al., 2015) and tissues (Bastide et al., 2017).
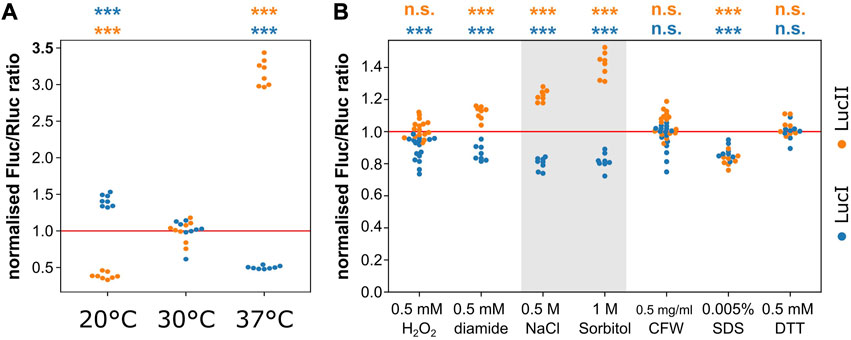
FIGURE 5. Distinct elongation- and initiation-control under stress conditions in yeast. (A), changes in temperature shift the expression ratio of the reporter RNAs consistent with an elongation block at lower temperatures. (B), some stress conditions shift expression ratios of the reporter mRNAs consistent with distinct regulation of translation initiation and elongation pathways. This appears particularly strong for osmotic stresses (0.5 M NaCl and 1 M sorbitol, shaded). Significance of the difference to the control condition (sample “30°C” in panel (A) and non-supplemented medium in panel (B) was determined by ANOVA and Tukey’s test and is indicated (***, p < 0.001; n. s., p > 0.05).
We also tested a number of stress conditions including oxidative, osmotic and cell wall stresses. Most of these did not affect the expression balance between the initiation- and elongation-controlled reporter genes, with the conspicuous exception of the two osmotic stress conditions we tested (0.5 M NaCl and 1 M sorbitol, Figure 5B). For both of these conditions, the observed expression pattern was consistent with a clear initiation block. The response to osmotic stress has been studied in detail by a number of authors and this response is known to involve regulation at both the levels of translation elongation (Teige et al., 2001) and initiation (Garre et al., 2012). The elongation response, which involves activation of the Hog1 kinase, is known to be transient persisting for less than 10 min under a low intensity stress (0.2 M NaCl, Mettetal et al., 2008) and for around 30 min for a stronger stress (0.8 M NaCl, Marques et al., 2006). The dynamics of the regulation of initiation has not been studied in detail but it is known that this component is important for re-establishing translation following the initial sharp downregulation upon onset of the stress. Since the measurements in Figure 5B are performed under steady-state stress conditions (i.e., after the initial, transient regulatory events have passed), these findings indicate that an initial translational arrest due predominantly to the inhibition of translation elongation is followed by a steady-state response in which translation elongation recovers, but translation initiation is partially inhibited compared to pre-stress conditions.
We sought to more closely examine the responses of initiation- and elongation-controlled mRNAs during the initial, elongation-regulating adaptation to osmotic stress conditions. We attempted to measure the luciferase ratios from our reporter constructs, but found that due to different protein half-lives of the firefly and Renilla luciferases this assay is not suitable for application outside of steady-state conditions (data not shown). However, Lee et al. (2011) generated detailed, genome-wide mRNA and protein abundance data at timepoints immediately following the onset of a 0.7 M NaCl stress, and we used these data to study the evolution of protein/mRNA ratios over time following the onset of the stress. For this analysis, we initially split the yeast transcriptome into elongation- and initiation-controlled sets as shown in Figure 2A (again only using the subset of mRNAs with 5′-UTR lengths >45 nt, for which footprints of queueing SSUs are observable). We then clustered each of the two sets according to the time-evolution of the protein/mRNA ratios, in order to determine subsets of mRNAs that showed similar behaviour (Figure 6). For a cluster number of four, this analysis revealed qualitatively very similar clusters for both initiation- and elongation-controlled mRNAs. However, although the behaviour was qualitatively similar, a quantitative comparison showed that, on average, within each cluster the elongation controlled mRNAs were more repressed at the initial time point (t = 10 min) than the initiation controlled mRNAs. At this time point, the Hog1 response is known to be maximal (Marques et al., 2006). For all four clusters, this difference at the initial time point was statistically significant (Figure 6). Overall, these analyses showed that under a stress condition where the regulation of translation elongation makes a strong contribution to the cellular response, the initiation- and elongation-controlled subsets of the transcriptome respond with distinct dynamics.
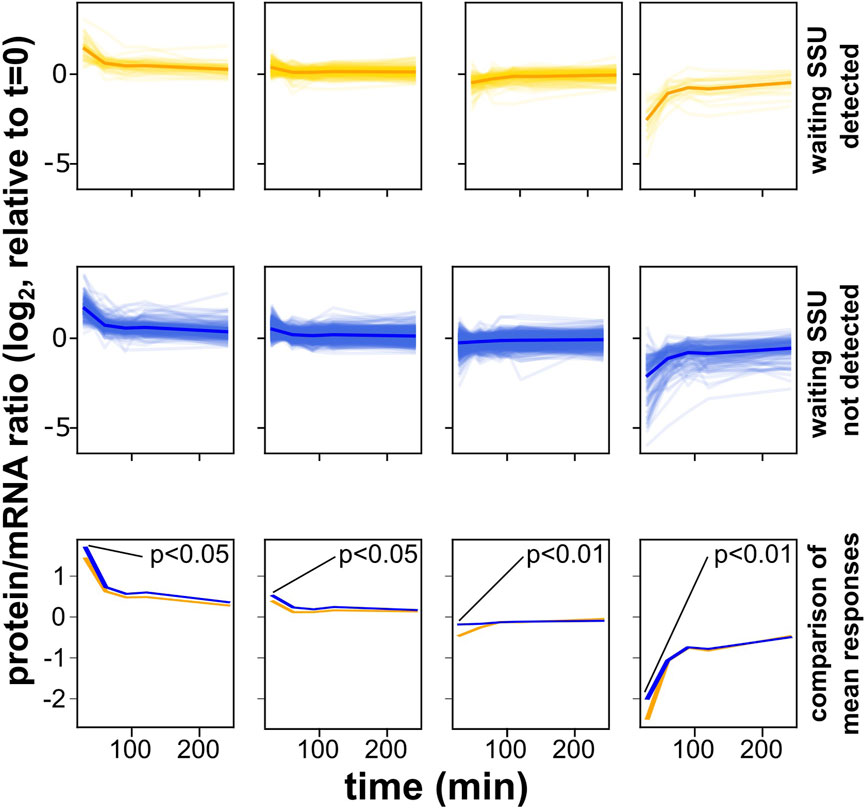
FIGURE 6. Distinct response dynamics of initiation- and elongation-controlled mRNAs under conditions known to entail regulation of translation elongation. These analyses are based on a dataset published by Lee et al. (2011), which reported the evolution of protein and mRNA abundances following the acute onset of an osmotic stress. All genes with 5′-UTR lengths >45 nt were divided into those containing evidence of queueing small ribosomal subunits (yellow) or no such evidence (blue). Genes were then clustered into classes where the protein/mRNA ratio followed similar time evolution. In the top two rows, faint traces correspond to individual genes whereas solid traces are metagene plots for all genes in that same plot. In the bottom row, the metagene traces of the plots above are replotted to facilitate comparison. In all classes, mRNAs with queueing subunits show reduced protein:mRNA ratios at the initial time-point where activation of the Hog1 kinase, which suppresses elongation factor 2 activity, is known to be strongest. Significance of the difference for the timepoint at t = 10 min is indicated.
Discussion
The translational control field has historically focussed on the role of translation initiation factors in regulating protein synthesis efficiency (Hershey et al., 2012). Following several anecdotal descriptions of individual mRNAs from various organisms for which elongation was found to be rate limiting (Zhou et al., 2013; Chu et al., 2014; Gu et al., 2014; Bastide et al., 2017), we sought to determine how widespread this mode of control is in the model eukaryote, baker’s yeast. We found that within the substantial proportion (∼50%) of the transcriptome that has sufficiently long 5′-UTRs to directly observe queueing small ribosomal subunits, 18% show evidence of such queues, which could be indicative of elongation control. Detailed analyses on a smaller number of genes confirm that at least a sub-section of these queues are indicators of translation elongation-limited transcripts. In the absence of any further information, the number of 18% thus puts a tentative upper limit on the proportion of elongation-controlled transcripts in fast growing yeast in general. This number also appears consistent with published data reporting genome-wide translational efficiencies upon depletion of eIF4A (Sen et al., 2015). Despite being the most abundant translation initiation factor in yeast (von der Haar and McCarthy, 2002) its levels limit global translational activity in yeast, based on the observation that even minor depletion reduces growth rates proportionally (Firczuk et al., 2013) and that addition of eIF4A to cell-free extracts over and above wild-trype levels increases reporter expression (Blum et al., 1989). Upon ablation of the factor, the predominant effect is a down-regulation of translational efficiency, whereas a smaller number of transcripts appear relatively up-regulated (Sen et al., 2015), overall confirming the notion of subsets of transcripts that do or do not respond to regulation via translation initiation factors.
Importantly, the statement that 18% of transcripts may be elongation-controlled only applies to the particular growth conditions investigated here. Under stress conditions, the well-studied translational control mechanisms such as Gcn2-mediated phosphorylation of eIF2 (Hinnebusch, 2005) or eEF2K-mediated phosphorylation of eEF2 (Kenney et al., 2014) produce a near-complete cessation of translation. If either initiation or elongation activity are strongly reduced, this activity would become rate-limiting for the entire transcriptome, and the distinction between initiation- or elongation-controlled transcripts would then become meaningless. However, as our data show, for moderate regulation the division of the transcriptome into the two pools means that these pools may be separately regulatable, and this appears to occur, e.g., during adapted growth under osmotic stress. Moreover, even during strong translational regulation, the dynamics with which the two pools respond can be different (Figure 6).
Following the identification of a potential pool of elongation-controlled mRNAs in yeast we asked whether this regulation was associated with particular pathways. However, GO analyses of the 638 genes showing evidence of a queueing SSU did not reveal any enrichment for particular processes, functions or components (data not shown). This is consistent with the anecdotal evidence from the literature which does not highlight particular functions of elongation controlled mRNAs either, having, for example, identified components of the molecular clock in Neurospora crassa (Zhou et al., 2013), ribosomal proteins in baker’s yeast (Chan et al., 2012), and proteins with neuronal functions in mammals (Bastide et al., 2017). Thus, it appears that evolution placed particular genes throughout the wider landscape of molecular processes under the control of translation elongation. Further work will be required to elucidate the detailed role of these genes in regulating individual pathways.
Data availability statement
All data and analysis scripts used to generate the figures are available on GitHub (https://github.com/tobiasvonderhaar/ribosomespeedcontrol). Further inquiries can be directed to the corresponding author.
Author contributions
EK and TH designed the study, conducted experimental work, analysed data, and wrote the manuscript. All authors contributed to the article and approved the submitted version.
Funding
We are grateful to the Leverhulme Trust (United Kingdom) for funding this work through a Research Project Grant (RPG_2014_32, to TH).
Acknowledgments
We are grateful for their kind gifts of antibodies to Prof. Yury Chernoff at the Georgia Institute of Technology (Atlanta, United States), Jordi Tamarit at the Universitat de Lleida (Spain), Prof. Roland Lill at the Universität Marburg (Germany), and Campbell Gourlay at the University of Kent (United Kingdom); and for the gift of a tef1 deletion strain to Paula Ludovico at the Universidade do Minho (Portugal).
Conflict of interest
The authors declare that the research was conducted in the absence of any commercial or financial relationships that could be construed as a potential conflict of interest.
The author TvdH declared that they were an editorial board member of Frontiers at the time of submission. This had no impact on the peer review process and the final decision.
Publisher’s note
All claims expressed in this article are solely those of the authors and do not necessarily represent those of their affiliated organizations, or those of the publisher, the editors and the reviewers. Any product that may be evaluated in this article, or claim that may be made by its manufacturer, is not guaranteed or endorsed by the publisher.
Supplementary material
The Supplementary Material for this article can be found online at: https://www.frontiersin.org/articles/10.3389/frnar.2023.1240635/full#supplementary-material
Footnotes
1github.com/tobiasvonderhaar/ribosomespeedcontrol
References
Allen, K. D., Wegrzyn, R. D., Chernova, T. A., Muller, S., Newnam, G. P., Winslett, P. A., et al. (2005). Hsp70 chaperones as modulators of prion life cycle. Genetics 169, 1227–1242. doi:10.1534/genetics.104.037168
Archer, S. K., Shirokikh, N. E., Beilharz, T. H., and Preiss, T. (2016). Dynamics of ribosome scanning and recycling revealed by translation complex profiling. Nature 535, 570–574. doi:10.1038/nature18647
Baker Brachmann, C., Davies, A., Cost, G. J., Caputo, E., Li, J., Hieter, P., et al. (1998). Designer deletion strains derived from Saccharomyces cerevisiae S288C: A useful set of strains and plasmids for PCR-mediated gene disruption and other applications. Yeast 14, 115–132. doi:10.1002/(SICI)1097-0061(19980130)14:2<115::AID-YEA204>3.0.CO;2-2
Bastide, A., Peretti, D., Knight, J. R. P., Grosso, S., Spriggs, R. V., Pichon, X., et al. (2017). RTN3 is a novel cold-induced protein and mediates neuroprotective effects of RBM3. Curr. Biol. 27, 638–650. doi:10.1016/j.cub.2017.01.047
Behura, S. K., and Severson, D. W. (2013). Codon usage bias: causative factors, quantification methods and genome-wide patterns: with emphasis on insect genomes. Biol. Rev. 88, 49–61. doi:10.1111/j.1469-185X.2012.00242.x
Blum, S., Mueller, M., Schmid, S. R., Linder, P., and Trachsel, H. (1989). Translation in Saccharomyces cerevisiae: initiation factor 4A-dependent cell-free system. Proc. Natl. Acad. Sci. U.S.A. 86, 6043–6046. doi:10.1073/pnas.86.16.6043
Chan, C. T. Y., Pang, Y. L. J., Deng, W., Babu, I. R., Dyavaiah, M., Begley, T. J., et al. (2012). Reprogramming of tRNA modifications controls the oxidative stress response by codon-biased translation of proteins. Nat. Commun. 3, 937. doi:10.1038/ncomms1938
Charneski, C. A., and Hurst, L. D. (2013). Positively charged residues are the major determinants of ribosomal velocity. PLoS Biol. 11, e1001508. doi:10.1371/journal.pbio.1001508
Chu, D., Barnes, D. J., and von der Haar, T. (2011). The role of tRNA and ribosome competition in coupling the expression of different mRNAs in Saccharomyces cerevisiae. Nucleic Acids Res. 39, 6705–6714. doi:10.1093/nar/gkr300
Chu, D., Kazana, E., Bellanger, N., Singh, T., Tuite, M. F., and von der Haar, T. (2014). Translation elongation can control translation initiation on eukaryotic mRNAs. EMBO J. 33, 21–34. doi:10.1002/embj.201385651
Ciandrini, L., Stansfield, I., and Romano, M. C. (2013). Ribosome traffic on mRNAs maps to gene ontology: genome-wide quantification of translation initiation rates and polysome size regulation. PLoS Comput. Biol. 9, e1002866. doi:10.1371/journal.pcbi.1002866
Diament, A., Feldman, A., Schochet, E., Kupiec, M., Arava, Y., and Tuller, T. (2018). The extent of ribosome queuing in budding yeast. PLoS Comput. Biol. 14, e1005951. doi:10.1371/journal.pcbi.1005951
Faller, W. J., Jackson, T. J., Knight, J. R. P., Ridgway, R. A., Jamieson, T., Karim, S. A., et al. (2015). mTORC1-mediated translational elongation limits intestinal tumour initiation and growth. Nature 517, 497–500. doi:10.1038/nature13896
Firczuk, H., Kannambath, S., Pahle, J., Claydon, A., Beynon, R., Duncan, J., et al. (2013). An in vivo control map for the eukaryotic mRNA translation machinery. Mol. Syst. Biol. 9, 635. doi:10.1038/msb.2012.73
Gardin, J., Yeasmin, R., Yurovsky, A., Cai, Y., Skiena, S., and Futcher, B. (2014). Measurement of average decoding rates of the 61 sense codons in vivo. eLife 3, e03735. doi:10.7554/eLife.03735
Garre, E., Romero-Santacreu, L., De Clercq, N., Blasco-Angulo, N., Sunnerhagen, P., and Alepuz, P. (2012). Yeast mRNA cap-binding protein Cbc1/Sto1 is necessary for the rapid reprogramming of translation after hyperosmotic shock. MBoC 23, 137–150. doi:10.1091/mbc.e11-05-0419
Giaever, G., Chu, A. M., Ni, L., Connelly, C., Riles, L., Véronneau, S., et al. (2002). Functional profiling of the Saccharomyces cerevisiae genome. Nature 418, 387–391. doi:10.1038/nature00935
Gibson, D. G., Young, L., Chuang, R.-Y., Venter, J. C., Hutchison, C. A., and Smith, H. O. (2009). Enzymatic assembly of DNA molecules up to several hundred kilobases. Nat. Methods 6, 343–345. doi:10.1038/nmeth.1318
Gu, C., Begley, T. J., and Dedon, P. C. (2014). tRNA modifications regulate translation during cellular stress. FEBS Lett. 588, 4287–4296. doi:10.1016/j.febslet.2014.09.038
Hausmann, A., Aguilar Netz, D. J., Balk, J., Pierik, A. J., Mühlenhoff, U., and Lill, R. (2005). The eukaryotic P loop NTPase Nbp35: an essential component of the cytosolic and nuclear iron–sulfur protein assembly machinery. Proc. Natl. Acad. Sci. U.S.A. 102, 3266–3271. doi:10.1073/pnas.0406447102
Hershey, J. W. B., Sonenberg, N., and Mathews, M. B. (2012). Principles of translational control: an overview. Cold Spring Harb. Perspect. Biol. 4, a011528. doi:10.1101/cshperspect.a011528
Hinnebusch, A. G. (2005). Translational regulation of Gcn4 and the general amino acid control of yeast. Annu. Rev. Microbiol. 59, 407–450. doi:10.1146/annurev.micro.59.031805.133833
Ho, B., Baryshnikova, A., and Brown, G. W. (2018). Unification of protein abundance datasets yields a quantitative Saccharomyces cerevisiae proteome. Cell Syst. 6, 192–205.e3. doi:10.1016/j.cels.2017.12.004
Ingolia, N. T., Ghaemmaghami, S., Newman, J. R. S., and Weissman, J. S. (2009). Genome-wide analysis in vivo of translation with nucleotide resolution using ribosome profiling. Science 324, 218–223. doi:10.1126/science.1168978
Iwasaki, S., and Ingolia, N. T. (2017). The growing toolbox for protein synthesis studies. Trends Biochem. Sci. 42, 612–624. doi:10.1016/j.tibs.2017.05.004
Kenney, J. W., Moore, C. E., Wang, X., and Proud, C. G. (2014). Eukaryotic elongation factor 2 kinase, an unusual enzyme with multiple roles. Adv. Biol. Regul. 55, 15–27. doi:10.1016/j.jbior.2014.04.003
Kertesz, M., Wan, Y., Mazor, E., Rinn, J. L., Nutter, R. C., Chang, H. Y., et al. (2010). Genome-wide measurement of RNA secondary structure in yeast. Nature 467, 103–107. doi:10.1038/nature09322
Knight, J. P., Bastide, A., Roobol, A., Roobol, J., Jackson, T. J., Utami, W., et al. (2015). Eukaryotic elongation factor 2 kinase regulates the cold stress response by slowing translation elongation. Biochem. J. 465, 227–238. doi:10.1042/BJ20141014
Knight, J. R. P., Garland, G., Pöyry, T., Mead, E., Vlahov, N., Sfakianos, A., et al. (2020). Control of translation elongation in health and disease. Dis. Models Mech. 13, dmm043208. doi:10.1242/dmm.043208
Lee, M. V., Topper, S. E., Hubler, S. L., Hose, J., Wenger, C. D., Coon, J. J., et al. (2011). A dynamic model of proteome changes reveals new roles for transcript alteration in yeast. Mol. Syst. Biol. 7, 514. doi:10.1038/msb.2011.48
Marques, J. M., Rodrigues, R. J., de Magalhães-Sant’Ana, A. C., and Gonçalves, T. (2006). Saccharomyces cerevisiae Hog1 protein phosphorylation upon exposure to bacterial endotoxin. J. Biol. Chem. 281, 24687–24694. doi:10.1074/jbc.M603753200
Merritt, G. H., Naemi, W. R., Mugnier, P., Webb, H. M., Tuite, M. F., and von der Haar, T. (2010). Decoding accuracy in eRF1 mutants and its correlation with pleiotropic quantitative traits in yeast. Nucleic Acids Res. 38, 5479–5492. doi:10.1093/nar/gkq338
Mettetal, J. T., Muzzey, D., Gomez-Uribe, C., and van Oudenaarden, A. (2008). The frequency dependence of osmo-adaptation in Saccharomyces cerevisiae. Science 319, 482–484. doi:10.1126/science.1151582
Michel, A. M., Fox, G., M Kiran, A., De Bo, C., O’Connor, P. B. F., Heaphy, S. M., et al. (2014). GWIPS-Viz: development of a ribo-seq genome browser. Nucleic acids Res. 42, D859–D864. doi:10.1093/nar/gkt1035
Miura, F., Kawaguchi, N., Sese, J., Toyoda, A., Hattori, M., Morishita, S., et al. (2006). A large-scale full-length cDNA analysis to explore the budding yeast transcriptome. Proc. Natl. Acad. Sci. 103, 17846–17851. doi:10.1073/pnas.0605645103
Nagalakshmi, U., Wang, Z., Waern, K., Shou, C., Raha, D., Gerstein, M., et al. (2008). The transcriptional landscape of the yeast genome defined by RNA sequencing. Science 320, 1344–1349. doi:10.1126/science.1158441
Oleinick, N. L. (1977). Initiation and elongation of protein synthesis in growing cells: differential inhibition by cycloheximide and emetine. Archives Biochem. Biophysics 182, 171–180. doi:10.1016/0003-9861(77)90296-X
Oliphant, T. E. (2007). Python for scientific computing. Comput. Sci. Eng. 9, 10–20. doi:10.1109/MCSE.2007.58
Pavlov, M. Y., Watts, R. E., Tan, Z., Cornish, V. W., Ehrenberg, M., and Forster, A. C. (2009). Slow peptide bond formation by proline and other N -alkylamino acids in translation. Proc. Natl. Acad. Sci. U.S.A. 106, 50–54. doi:10.1073/pnas.0809211106
Pelechano, V., Wei, W., and Steinmetz, L. M. (2015). Widespread Co-translational RNA decay reveals ribosome dynamics. Cell 161, 1400–1412. doi:10.1016/j.cell.2015.05.008
Presnyak, V., Alhusaini, N., Chen, Y.-H., Martin, S., Morris, N., Kline, N., et al. (2015). Codon optimality is a major determinant of mRNA stability. Cell 160, 1111–1124. doi:10.1016/j.cell.2015.02.029
Radhakrishnan, A., Chen, Y.-H., Martin, S., Alhusaini, N., Green, R., and Coller, J. (2016). The DEAD-box protein Dhh1p couples mRNA decay and translation by monitoring codon optimality. Cell 167, 122–132.e9. doi:10.1016/j.cell.2016.08.053
Rodrıguez-Manzaneque, M. T., Tamarit, J., Bellı, G., Ros, J., and Herrero, E. (2002). Grx5 is a mitochondrial glutaredoxin required for the activity of iron/sulfur enzymes. MBoC 13, 1109–1121. doi:10.1091/mbc.01-10-0517
Roundtree, I. A., Evans, M. E., Pan, T., and He, C. (2017). Dynamic RNA modifications in gene expression regulation. Cell 169, 1187–1200. doi:10.1016/j.cell.2017.05.045
Schneider-Poetsch, T., Ju, J., Eyler, D. E., Dang, Y., Bhat, S., Merrick, W. C., et al. (2010). Inhibition of eukaryotic translation elongation by cycloheximide and lactimidomycin. Nat. Chem. Biol. 6, 209–217. doi:10.1038/nchembio.304
Sen, N. D., Zhou, F., Ingolia, N. T., and Hinnebusch, A. G. (2015). Genome-wide analysis of translational efficiency reveals distinct but overlapping functions of yeast DEAD-box RNA helicases Ded1 and eIF4A. Genome Res. 25, 1196–1205. doi:10.1101/gr.191601.115
Sharp, P. M., Tuohy, T. M. F., and Mosurski, K. R. (1986). Codon usage in yeast: cluster analysis clearly differentiates highly and lowly expressed genes. Nucl. Acids Res. 14, 5125–5143. doi:10.1093/nar/14.13.5125
Spealman, P., Naik, A. W., May, G. E., Kuersten, S., Freeberg, L., Murphy, R. F., et al. (2018). Conserved non-AUG uORFs revealed by a novel regression analysis of ribosome profiling data. Genome Res. 28, 214–222. doi:10.1101/gr.221507.117
Teige, M., Scheikl, E., Reiser, V., Ruis, H., and Ammerer, G. (2001). Rck2, a member of the calmodulin-protein kinase family, links protein synthesis to high osmolarity MAP kinase signaling in budding yeast. Proc. Natl. Acad. Sci. U.S.A. 98, 5625–5630. doi:10.1073/pnas.091610798
Tuller, T., Veksler-Lublinsky, I., Gazit, N., Kupiec, M., Ruppin, E., and Ziv-Ukelson, M. (2011). Composite effects of gene determinants on the translation speed and density of ribosomes. Genome Biol. 12, R110. doi:10.1186/gb-2011-12-11-r110
von der Haar, T., Jossé, L., Wright, P., Zenthon, J., and Tuite, M. F. (2007). Development of a novel yeast cell-based system for studying the aggregation of alzheimer’s disease-associated aβ peptides in vivo. Neurodegener. Dis. 4, 136–147. doi:10.1159/000101838
von der Haar, T., and McCarthy, J. E. G. (2002). Intracellular translation initiation factor levels in Saccharomyces cerevisiae and their role in cap-complex function: translation initiation factor levels in yeast. Mol. Microbiol. 46, 531–544. doi:10.1046/j.1365-2958.2002.03172.x
von der Haar, T. (2007). Optimized protein extraction for quantitative proteomics of yeasts. PLoS ONE 2, e1078. doi:10.1371/journal.pone.0001078
Waern, K., and Snyder, M. (2013). Extensive transcript diversity and novel upstream open reading frame regulation in yeast. G3 Genes|Genomes|Genetics 3, 343–352. doi:10.1534/g3.112.003640
Keywords: protein synthesis, translation initiation, translation elongation, rate control, codon usage
Citation: Kazana E and von der Haar T (2023) On translational control by ribosome speed in S. cerevisiae. Front. RNA Res. 1:1240635. doi: 10.3389/frnar.2023.1240635
Received: 15 June 2023; Accepted: 02 August 2023;
Published: 14 August 2023.
Edited by:
Nikolay Shirokikh, Australian National University, AustraliaReviewed by:
Seán O'Leary, University of California, United StatesColin Echeverría Aitken, Vassar College, United States
Copyright © 2023 Kazana and von der Haar. This is an open-access article distributed under the terms of the Creative Commons Attribution License (CC BY). The use, distribution or reproduction in other forums is permitted, provided the original author(s) and the copyright owner(s) are credited and that the original publication in this journal is cited, in accordance with accepted academic practice. No use, distribution or reproduction is permitted which does not comply with these terms.
*Correspondence: Tobias von der Haar, t.von-der-haar@kent.ac.uk