Spatial and temporal metagenomics of river compartments reveals viral community dynamics in an urban impacted stream
 Josué Rodríguez-Ramos1
  Angela Oliverio1,2
  Mikayla A. Borton1,3 Robert Danczak3 Birgit M. Mueller4 Hanna Schulz4,5 Jared Ellenbogen1 Rory M. Flynn1 Rebecca A. Daly1 LeAundra Schopflin1 Michael Shaffer1
  Amy Goldman3
  Joerg Lewandowski4,5
  James C. Stegen3 Kelly C. Wrighton1*
- 1Department of Soil and Crop Sciences, Colorado State University, Fort Collins, CO, United States
- 2Department of Biology, Syracuse University, Syracuse, NY, United States
- 3Biological Sciences Division, Pacific Northwest National Laboratory, Richland, WA, United States
- 4Leibniz Institute of Freshwater Ecology and Inland Fisheries, Berlin, Germany
- 5Humboldt University, Berlin, Germany
Although river ecosystems constitute a small fraction of Earth’s total area, they are critical modulators of microbially and virally orchestrated global biogeochemical cycles. However, most studies either use data that is not spatially resolved or is collected at timepoints that do not reflect the short life cycles of microorganisms. To address this gap, we assessed how viral and microbial communities change over a 48-hour period by sampling surface water and pore water compartments of the wastewater-impacted River Erpe in Germany. We sampled every 3 hours resulting in 32 samples for which we obtained metagenomes along with geochemical and metabolite measurements. From our metagenomes, we identified 6,500 viral and 1,033 microbial metagenome assembled genomes (MAGs) and found distinct community membership and abundance associated with each river compartment (e.g., Competibacteraceae in surfacewater and Sulfurimonadaceae in pore water). We show that 17% of our viral MAGs clustered to viruses from other ecosystems like wastewater treatment plants and rivers. Our results also indicated that 70% of the viral community was persistent in surface waters, whereas only 13% were persistent in the pore waters taken from the hyporheic zone. Finally, we predicted linkages between 73 viral genomes and 38 microbial genomes. These putatively linked hosts included members of the Competibacteraceae, which we suggest are potential contributors to river carbon and nitrogen cycling via denitrification and nitrogen fixation. Together, these findings demonstrate that members of the surface water microbiome from this urban river are stable over multiple diurnal cycles. These temporal insights raise important considerations for ecosystem models attempting to constrain dynamics of river biogeochemical cycles.
Introduction
Rivers are key modulators of global biogeochemical cycles and provide a dynamic, moving passageway between terrestrial and aquatic ecosystems (Allen and Pavelsky, 2018). Corresponding to ~7% of global CO2 and ~5% of global CH4 emissions per year, rivers contribute up to 2,508 Tg yr-1of carbon dioxide (CO2), and ~30.5 Tg yr-1 of methane (CH4) (Villa et al., 2020; Rosentreter et al., 2021; Friedlingstein et al., 2022; Liu et al., 2022). Microbial communities are key orchestrators of carbon and nitrogen transformations in rivers, where they contribute between 40-90% of hyporheic zone respiration (Pusch and Schwoerbel, 1994; Naegeli and Uehlinger, 1997; Rodríguez-Ramos et al., 2022). Despite a general understanding of the importance of microbial metabolism, river viral communities and their impacts on microbial communities remain poorly described.
Viruses are the most abundant organism on the planet, with estimates of up to 1031 viral particles worldwide (Hendrix et al., 1999; Munn, 2006; Bar-On et al., 2018; Mushegian, 2020). These viral predators are mostly studied in marine ecosystems, where viruses can lyse 20-40% of bacteria daily (Weinbauer, 2004; Weinbauer and Rassoulzadegan, 2004; Suttle, 2007; Chow and Suttle, 2015; Guidi et al., 2016) and play key roles reprogramming their bacterial hosts with ecosystem-wide consequences (Sullivan et al., 2006; Anantharaman et al., 2014; Hurwitz and U’Ren, 2016). Although research has mostly focused on marine ecosystems, recent efforts have been made to expand our knowledge of natural viral communities in freshwater aquatic environments like lakes (Roux et al., 2017; Berg et al., 2021) and estuaries (Hewson et al., 2001; Cissoko et al., 2008). Early studies in these systems have shown viral like particle (VLP) abundances and viral productivity (i.e., the number of viruses produced per hour) in rivers can be equivalent, or higher, than those in marine systems (Peduzzi and Luef, 2008; Corinaldesi et al., 2010; Rowe et al., 2012; Peduzzi, 2016). Additionally, early river studies found that up to 80% of bacterial isolate strains from sediments had virulent phage that could be isolated (Lammers, 1992). Together, these foundational works highlight the importance of viral predation in regulating microbial dynamics in river ecosystems.
There are two key reasons why it remains difficult to link viral communities to river ecosystem function. First, river microbiome studies are rarely genome-resolved, both from a bacterial and viral perspective. While there is still much to explore, most information on aquatic virus dynamics pertains to oceanic studies (Vincent and Vardi, 2023), and rivers are described as one of the most underexplored aquatic ecosystem with metagenomics, second only to glacier microbiomes (Chu et al., 2020). Although the taxonomic composition of microbial communities in rivers has been well-described by 16S rRNA gene amplicon surveys (Hou et al., 2017; Nelson et al., 2019), it remains unclear how microbial membership relates to relevant ecosystem processes. Likewise, our ability to link the viral community to their respective microbial hosts, and subsequently to ecosystem biogeochemistry, remains hindered by a lack of genome-resolved studies. Second, river studies are often not temporally constrained. Although significant changes in river chemistry and hydrology are observed at seasonal periods (Tomalski et al., 2021), they are also known to change at sub-daily scales (Lundquist and Cayan, 2002; Alonso et al., 2017), particularly in human-impacted rivers affected by wastewater treatment plant effluent and reservoirs (Luo et al., 2020; Wang et al., 2021; Lu et al., 2022). This is particularly important when considering the microbial component of river systems, as microbial generations are on the scale of minutes to hours, and microbiomes can shift metabolically in hours (Wang et al., 2015; Erbilgin et al., 2017; Gibson et al., 2018). Nonetheless, river microbiome time-series are often resolved at seasonal scales (Kaevska et al., 2016; Malki et al., 2021), meaning our understanding of viral and microbial community dynamics across relevant temporal gradients (i.e. hours) remains poorly understood.
To address these knowledge gaps, we collected a finely resolved metagenomic time-series at the River Erpe near Berlin, Germany, a lowland river receiving treated wastewater. Our sampling campaign included biogeochemical measurements every 3 hours for 48 hours across both surface water (SW) and pore water (PW) compartments that were paired to metagenomics and metabolomics (Figures 1A–D). This study design provided a metagenomically resolved dataset which enabled us to interrogate how viral and microbial communities are structured across river compartments, and how this metabolic potential could modulate biogeochemical processes. Additionally, the temporal resolution of our dataset allowed us to analyze both the persistence of viral and microbial communities across compartments, as well as the individual genome stability throughout the 48 hours of sampling. Finally, by using genome-resolved metagenomics, we show that viruses can be linked to hosts in river ecosystems, and that these linkages can reveal putative interactions that may be relevant to understanding the temporal dynamics of ecosystem biogeochemistry.
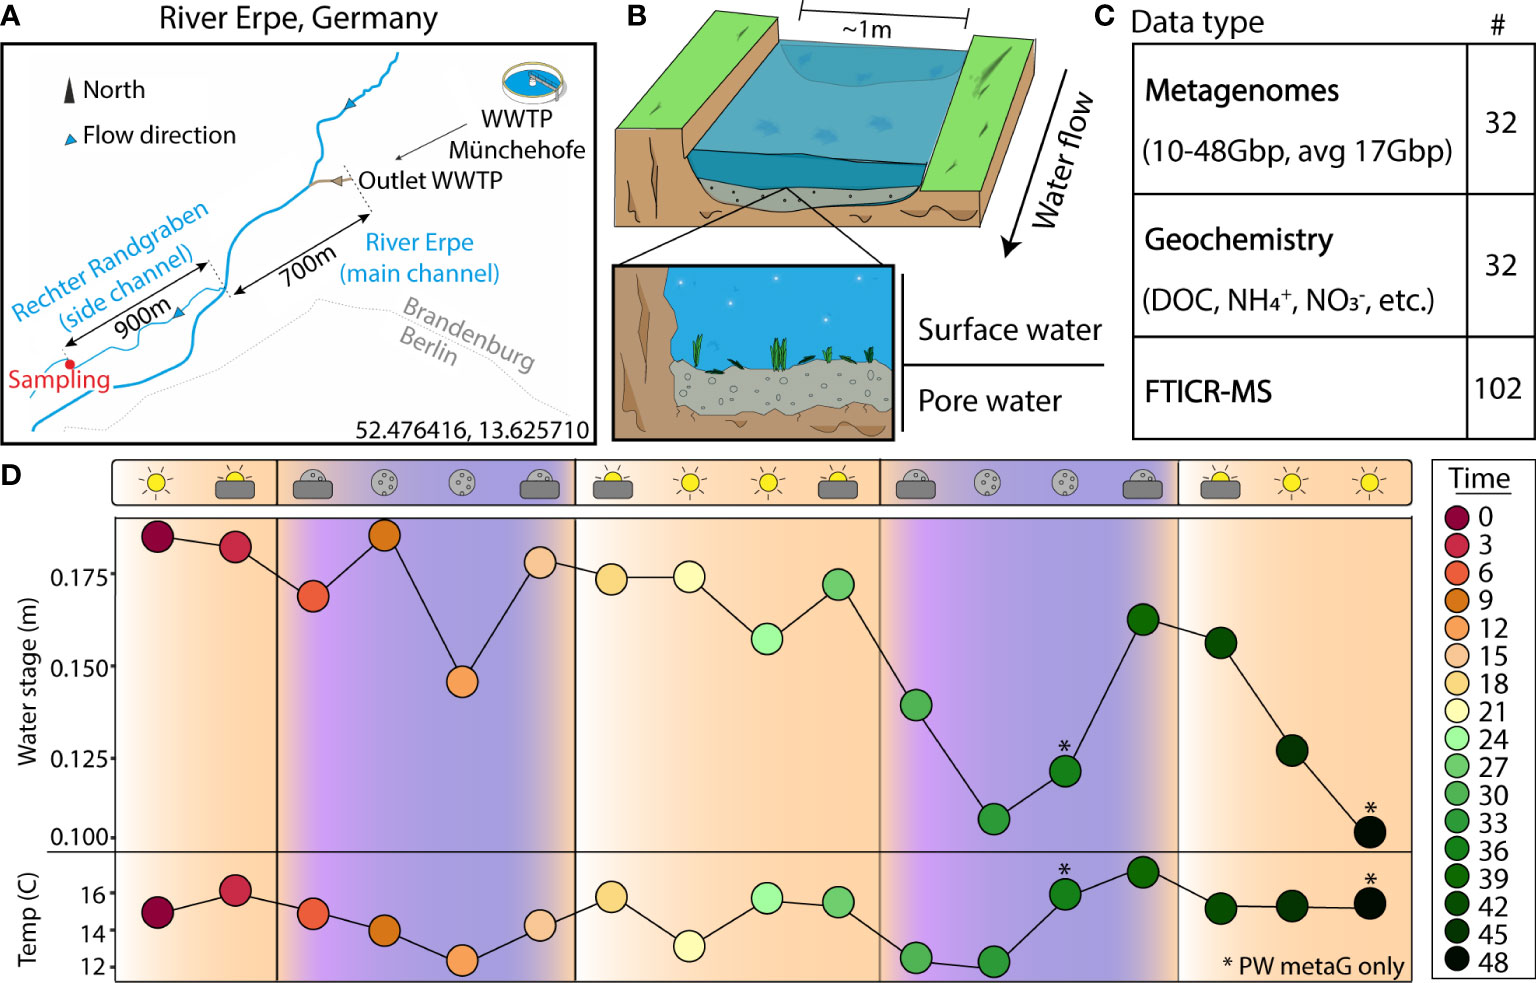
Figure 1 Experimental design enables a genome- and time-resolved view of microbial communities at a finely scaled resolution. (A) River Erpe sampling site that is located near Berlin, Germany. (B) Conceptual schematic of the surface and pore water compartments that were sampled as part of this research. (C) Table of data types that were collected as part of this sampling effort. (D) Sampling schematic over 48-hour period with two ecological variables (water stage, and temperature) shown across the timepoints collected. The colors and icons highlight the hour of the day when samples were collected. Asterisks (*) denote samples where only pore water metagenomes were collected
Methods
Sample collection, DNA isolation, and chemical characterization
The River Erpe is highly influenced by diurnally fluctuating effluent volumes of the Münchehofe wastewater treatment plant and consists of up to 80% treated wastewater (Mueller et al., 2021). Our sampling site is in a side channel with a mean discharge of 25 l/s (Lewandowski et al., 2011; Mueller et al., 2021) (Figure 1A). For sample collection, a sampling station was set up ~1m from the shoreline of the River Erpe side channel “Rechter Randgraben” (52.476416, 13.625710), 1.6km from the wastewater treatment plant outlet leading the same water as in the main channel as previously described (Mueller et al., 2021), and in accordance to the Worldwide Hydrobiogeochemistry Observation Network for Dynamic River Systems (WHONDRS) protocol (Stegen and Goldman, 2018). Samples were collected on September 25, 2018. More information on the River Erpe sampling methods can be found in another publication from our team, as well as the original public data repository (Wells et al., 2019; Mueller et al., 2021). Briefly, for surface water (SW), 60ml at a time of SW were collected manually with a syringe and tubing fixed in the water column and then passed through a 0.20μm filter until clogged. A cap was then put on the filter, filled with 3ml RNAlater, and refrigerated until extraction. For pore water (PW), 60ml of PW from 25cm sediment depth were collected with a stainless-steel rod in the middle of the channel. The rods were covered with a filter mesh sock over the screened area at the tip, pushed into the sediment, and equipped with a Teflon suction line. Samples were then taken by manually pulling 60ml of PW with syringes attached to the suction line and filtering them through a 0.20μm filter until clogged. The filter was then capped, filled with 3ml RNAlater, and refrigerated until extraction. Each of these processes were repeated every 3 hours over a period of 48hrs in September of 2018, resulting in 15 SW and 17 PW metagenomes. 2 SW samples failed due to lack of biomass. For DNA isolation, filters were cut into ~5mm2 pieces and added to the bead bashing tubes of Quick-DNA Soil Microbe Microprep Kit (Zymo). The nucleic acids were then extracted according to the manufacturer protocol and sequenced at the Genomics Shared Resource Anschutz Medical Campus, Colorado. Accession numbers, total metagenomic reads, and sample sizes can be found on Supplemental Table 1 and the original data repository (Wells et al., 2019).
Chemical characterization was performed as previously described (Mueller et al., 2021). Water samples were filtered with 0.2μm polyethersulfone Sterivex for Fourier transform ion cyclotron resonance mass spectrometer (FTICR-MS) analysis or regenerated cellulose for all other analytes, then acidified to a pH of 2 with 2M HCl and stored at -18°C until analysis. Samples were analyzed at the Leibniz Institute of Freshwater Ecology and Inland Fisheries for nitrate and sulfate (ion chromatography, Metrohm 930 Compact IC Flex), ammonium and soluble reactive phosphorous (SRP) (segmented flow analyzer Skalar SAN, Skalar Analytical B.V., Netherlands), and manganese and iron (inductively coupled plasma optical emission spectrometry (ICP-OES), (ICP iCAP 6000 series, Thermo Fisher Scientific Inc.). Dissolved organic carbon (DOC) concentrations were analyzed via infrared gas analyzer (NDIR) after combustion (TOC/TN Analyzer, Shimadzu). Dissolved organic matter (DOM) data is part of the WHONDRS dataset (Wells et al., 2019) and was analyzed using a 12T Bruker SolariX FTICR-MS (Bruker, SolariX, Billerica, MA, USA) at the Environmental Molecular Sciences Laboratory in Richland, WA. Once peaks were picked using the Bruker data analysis software and formulas were assigned using Formularity (Tolić et al., 2017), DOM was classified into seven compound classes based upon hydrogen to carbon ratio (H:C), and oxygen to carbon (O:C) ratios (Kim et al., 2003). FTICR-MS analysis does not allow for a quantitative approach, therefore compound class data was analyzed qualitatively, and DOM composition was evaluated using the number of molecular formulas in every compound class as described in the original publication (Mueller et al., 2021). The biogeochemical measurements for this study can all be found on Supplemental Table 1.
Metagenome data processing and assembly
Each set of metagenomic reads were trimmed using Sickle v1.33 with default settings (Joshi NA, 2011), and assessed using FastQC (v0.11.2) (Andrews, n.d.). Trimmed reads were then assembled with either 1) metaSPAdes BBCMS pipeline (v3.13.0) (Metagenome Assembly Workflow (v1.0.1) — NMDC Workflows 0.2a documentation, n.d.), 2) Megahit (v1.2.9) (Li et al., 2015), or 3) IDBA UD (v.1.1.0) (Peng et al., 2012). For metaSPAdes pipeline, reads were merged into a single.fa file using fq2fa (Shen et al., 2016). Then, bbcms was run with flags “mincount = 2”, and “highcountfraction = 0.6”, followed by metaSPAdes using kmers 33, 55, 77, 99, 127, and flag “–meta”. For Megahit, reads were assembled with flags “k-min = 31”, “k-max = 121”, “k-step = 10”, and “m = 0.4”. For IDBA_UD, samples were rarefied to 25% of reads using BBMAP’s reformat.sh (Bushnell, 2014) with flags “samplerate = 0.25” and “sampleseed = 1234”. These 25% of subset reads were then merged into a single.fa file using fq2fa (Shen et al., 2016) and then assembled with default parameters. Assembly statistics for each sample can be found in Supplemental Table 1.
Viral identification, taxonomy, and annotations
Viral metagenome assembled genomes (vMAGs) were identified from each set of assemblies using Virsorter2 and CheckV using the established protocols.io methods (Guo et al., 2021a; Guo et al., 2021b). Resulting genomes were then screened based on VirSorter2 and checkV output for viral and host gene counts, VirSorter2 viral scores, and hallmark gene counts (Guo et al., 2021b). Viruses were then annotated with DRAM-v using the “–use_uniref” flag, and further manually curated according to the established protocol (Shaffer et al., 2020; Guo et al., 2021b). The resulting subset of 6,500 viral genomes were clustered at 95% ANI across 85% of shortest contig per MIUViG standards (Roux et al., 2018) resulting in 1,230 viral populations.
Viral taxonomic identification of viral populations was performed using protein clustering methods with vContact2 using default methods (Bin Jang et al., 2019). We supplemented the standard RefSeq v211 database containing 4,533 vMAGs with viral genomes from an additional 303 river and wastewater treatment plant metagenomes that were publicly available from 1) JGI IMG/VR (6,254 vMAGs ≥10kb), 2) two previously unpublished anaerobic digestor metagenomic datasets that were mined in-house (14,436 vMAGs ≥10kb) (https://doi.org/10.5281/zenodo.7709817), 3) a previously published wastewater treatment plant sludge database (7,443 vMAGs ≥10kb) (Shi et al., 2022), 4) a previously available reference database that included freshwater ecosystem viruses (2,032 vMAGs ≥10kb) (Rodríguez-Ramos et al., 2022), and 5) the 43 TARA Oceans Virome datasets (5,476 vMAGs ≥10kb) (Brum et al., 2015). This resulted in an additional 35,641 reference vMAGs in our network. Proteins file for all vMAGs used in the network as well as accession numbers are available on Zenodo (https://doi.org/10.5281/zenodo.7709817). Results from vContact2 can be found in Supplemental Table 2.
Viral population genome representatives were annotated using DRAM-v (Shaffer et al., 2020). To identify putative auxiliary metabolic genes (AMGs), auxiliary scores were assigned by DRAM-v to each annotated gene based on the following previously described ranking system: A gene is given an auxiliary score of 1 if there is at least one hallmark gene on both the left and right flanks, indicating the gene is likely viral. An auxiliary score of 2 is assigned when the gene has a viral hallmark gene on one flank and a viral-like gene on the other flank. An auxiliary score of 3 is assigned to genes that have a viral-like gene on both flanks (Shaffer et al., 2020; Rodríguez-Ramos et al., 2022). Genes identified by DRAM-v as being high-confidence possible AMGs (auxiliary scores 1-3) were subjected to protein modeling using Protein Homology/AnalogY Recognition Engine (PHYRE2) (Kelley et al., 2015), and manually verified. All files for vMAG quality and annotations can be found in Supplemental Table 2.
Bacterial and archaeal metagenomic binning, quality control, annotation, and taxonomy
Bacterial and archaeal genomes were binned from each set of assemblies with MetaBAT v2.12.1 (Kang et al., 2019) as previously described (Rodríguez-Ramos et al., 2022). Briefly, reads were mapped to each respective assembly to get coverage information using BBmap (Bushnell, 2014), and then MetaBAT was run with default settings on each assembly after filtering for scaffolds ≥2,500bp. Quality for each MAG was then assessed using CheckM (v1.1.2) (Parks et al., 2015). To ensure that only quality MAGs were utilized for analyses, we discarded all MAGs that were not medium quality (MQ) to high quality (HQ) according to MIMAG standards (Bowers et al., 2017), resulting in 1,033 MAGs. These MAGs were dereplicated using dRep (Olm et al., 2017) at 95% identity, resulting in 125 MAGs. These 125 MQHQ MAGs were annotated using the DRAM pipeline (Shaffer et al., 2020) as previously described (Rodríguez-Ramos et al., 2022). For taxonomic analyses, MAGs were classified using the Genome Taxonomy Database (GTDB) Toolkit v1.5.0 on November 2021 using the r202 database (Chaumeil et al., 2019). Genome quality, annotations, and taxonomy are reported in Supplemental Table 3.
Virus host linkages
To identify virus-host linkages, we used 1) CRASS (Direct Repeat/Spacer based) v1.0.1 (Skennerton et al., 2013), 2) VirHostMatcher (alignment-free oligonucleotide frequency based) v.1.0.0 (Ahlgren et al., 2017), and 3) PHIST (all-versus-all exact matches based) v.1.0.0 (Zielezinski et al., 2021). CRASS protocol and scripts used are described in detail on GitHub (see Data availability). VirHostMatcher was run with default settings, and the best possible hit for each virus was considered only if it had a d2* dissimilarity score of < 0.2. PHIST was run with flag “-k = 25”, and a PHIST hit was considered only if it had a significant adjusted p-value of < 0.05. To be classified as a virus-host linkage, a virus-host pair had to be predicted by the significant consensus of both VirHostMatcher and PHIST or a virus-host pair had to have a CRASS linkage. With this consensus method, CRASS links, which were always considered good hits, agreed across 60% of predictions at the Genus level, 80% of predictions at the Order level, and 87% at the Class level, suggesting high accuracy of consensus-only, non-CRASS linked virus-host pairs. All virus-host predictions are in Supplemental Table 2.
Genome relative abundance and normalization
To estimate the relative abundance of each vMAG and MAG, metagenomic reads for each sample were mapped to a database of vMAGs or MAGs with Bowtie2 (Langmead and Salzberg, 2012) at an identity of 95%, with minimum contig coverage of 75% and minimum depth coverage of 3x. To normalize abundances for known temporal omics data biases (Coenen et al., 2020), we performed a library size normalization of abundance tables using TMM (Robinson and Oshlack, 2010). Given that PW and SW organism abundances were drastically different in magnitude, and that abundance zeroes across compartments are likely real zeroes, vMAGs and MAGs were considered to be present if detectable in at least 10% of samples in either compartment. Organisms detected in > 10% PW samples were labeled “pore”, organisms detected in > 10% SW samples were labeled “surface”, organisms > 10% PW and SW samples were labeled “both”, and organisms that were in < 10% SW and PW samples were removed. Based on these groups, the TMM abundances file was split into two different files, one for PW samples (n = 17) including “pore” and “both” organisms, and one for SW samples (n = 15) including “surface” and “both” organisms. Abundances for vMAGs and MAGs can be found in Supplemental Table 2, 3, and specific commands can be found on GitHub.
Temporal and statistical analyses
Temporal analyses were all performed in R with the TMM normalized abundances described above. To determine which environmental parameters were significantly driving differences across our compartments, we performed multiple regressions using envfit in the vegan R package (Oksanen et al., 2016) across multiple types of ordinations. Principal Coordinate Analysis (PCA) for biogeochemistry were done with vegan in R. Dissimilarities in community composition were calculated with the Bray-Curtis metric in vegan (Oksanen et al., 2016) for all vMAGs and MAGs that were present in >3 samples per each compartment. Nonmetric multidimensional scaling (NMDS) was then used with k = 2 dimensions for visualization. An analysis of similarity (ANOSIM) was performed using the base R stats package in order to determine community similarity between river compartments. PERMANOVA analyses were done in R using the adonis function from vegan. The NMDS ordinations of the vMAGs and MAGs were compared using the PROCRUSTES function in vegan. To visualize the relative contribution of each biogeochemical variable, we calculated the envfit vector using function ordiArrowMul and plotted them using ggplot. Shannon’s H’ were done using TMM normalized values with vegan in R. Species accumulation curves were done using the vegan function specaccum in R. All R code and files are available on GitHub.
To determine the relative stability of surface and pore water communities, we first calculated the differences in Bray-Curtis dissimilarity for each sample and its prior timepoint and then ran an unpaired t test to compare the mean differences across compartments with the vegan package in R. For assigning the persistence of the different genomes, we used previously established metrics to assess persistent (present in ≥ 75% of samples), intermittent (present > 25% <75% of samples), or ephemeral (present in ≤ 25% of samples) categories (Chow and Fuhrman, 2012). For establishing the abundance stability, we assessed the total number of samples in which each individual persistent genome fluctuated by ± 25% of the median relative abundance value across all samples. Then, using the established cutoffs by Fuhrman and Chow et al. (Chow and Fuhrman, 2012)., we categorized our genomes as stable (shifting in ≤ 25% of samples), intermediately stable (shifting in > 25% < 75% of samples) and unstable (shifting in ≥ 75% of samples). Fishers exact test for count data was used for assessing the significance of difference in stability metrics using fisher.test from R base stats package. The enrichment analyses for AMGs were performed using a hypergeometric test between the total AMGs in our dataset and the individual groups of AMGs present in either compartment. The code used is available on GitHub. All temporal analyses and results are in Supplemental Table 4.
To reduce the complexity of our microbial data so we could link viral and microbial communities more concretely to ecosystem biogeochemical cycling, we applied a Weighted Gene Correlation Network Analysis (WGCNA) to identify which groups of organisms co-occurred using TMM normalized values in R with package WGCNA (Langfelder and Horvath, 2008; R Core Team, 2018). A signed hybrid network was performed with a combined dataset of MAGs and vMAGs on a per-compartment basis. For SW, we used a minimum power threshold of 14 and a minimum module size of 20. For PW, we used a minimum power threshold of 8 with and a minimum module size of 20. For both networks, a reassign threshold of 0, and a merge cut height of 0.3 were used.
To link the modules to ecosystem biogeochemistry, we performed sparse partial least square regressions (sPLS) on the groups of organisms in each module. sPLS were done using TMM normalized values of co-occurring communities that resulted from WGCNA above in R with package PLS (Chung et al., 2012). Subnetwork membership was related to the overall genome significance for nitrate as described in the WGCNA tutorials document (see GitHub code) using R and the WGCNA package (Langfelder and Horvath, 2008). Full code for WGCNA and SPLS are available on GitHub along with detailed instructions and input files. Visualizations for the AMG and WGCNA figures were made using RawGraphs (Mauri et al., 2017).
Results
Metagenomics uncovers viral novelty and biogeography of River Erpe viruses
We sampled 17 pore water (PW) and 15 surface water (SW) metagenomes collected over a 48-hour period using a Eulerian sampling scheme (i.e., at a fixed location) and collected 565.5Gbp of paired metagenomic sequencing (10.2-47.9Gbp/sample, 17.7Gbp avg.) (Figure 1 and Supplemental Table 1). Assembly of these samples revealed 6,861 viral metagenome assembled genomes (vMAGs), of which 6,500 vMAGs were ≥10kb in length and were subsequently clustered into 1,230 species-level vMAGs (Supplemental Table 2). The average vMAG genome fragment was 24,164bp (180,216bp max) in the PW, and 19,553bp (153,177bp max) in the SW (Supplemental Table 2). Viral MAG richness was consistently 8 times higher (p < 0.01) in the SW (845.0 ± 124.4) compared to the PW (108.3 ± 49.7) and likely drove differences (p < 0.01) in Shannon’s diversity (H’) recorded for the SW (SW = 6.05 ± 0.17, PW = 3.67 ± 0.49) (Supplemental Figure 1). In addition to our vMAGs, we identified 1033 metagenome assembled genomes (MAGs) that were dereplicated at 95% identity into 125 medium and high-quality genome representatives. Similarly, MAG richness was higher (p < 0.01) in the SW (SW = 62.6 ± 7.2, PW = 21.8 ± 9.0), and showed significantly different patterns (p < 0.01) in terms of Shannon’s (H’) (SW = 2.9 ± 0.17, PW = 2.6 ± 0.3) (Supplemental Figure 1).
Viruses from freshwater systems are not well sampled in the databases commonly used for taxonomic assignment in viral studies (Elbehery and Deng, 2022). To determine the extent of novel viral diversity recovered, we mined additional set of 21,022 vMAGs from a variety of freshwater, wastewater, and marine samples and added this to the original vContact2 database (Supplemental Table 2, see Materials and Methods). We then performed protein clustering of our unique 1,230 viruses with this modified aquatic database, revealing 3,030 viral clusters (VCs). This network was composed of 19,623 nodes with 679,402 edges, which was simplified to only show protein clusters that contained at least 1 vMAG from this study (Figures 2A–C).
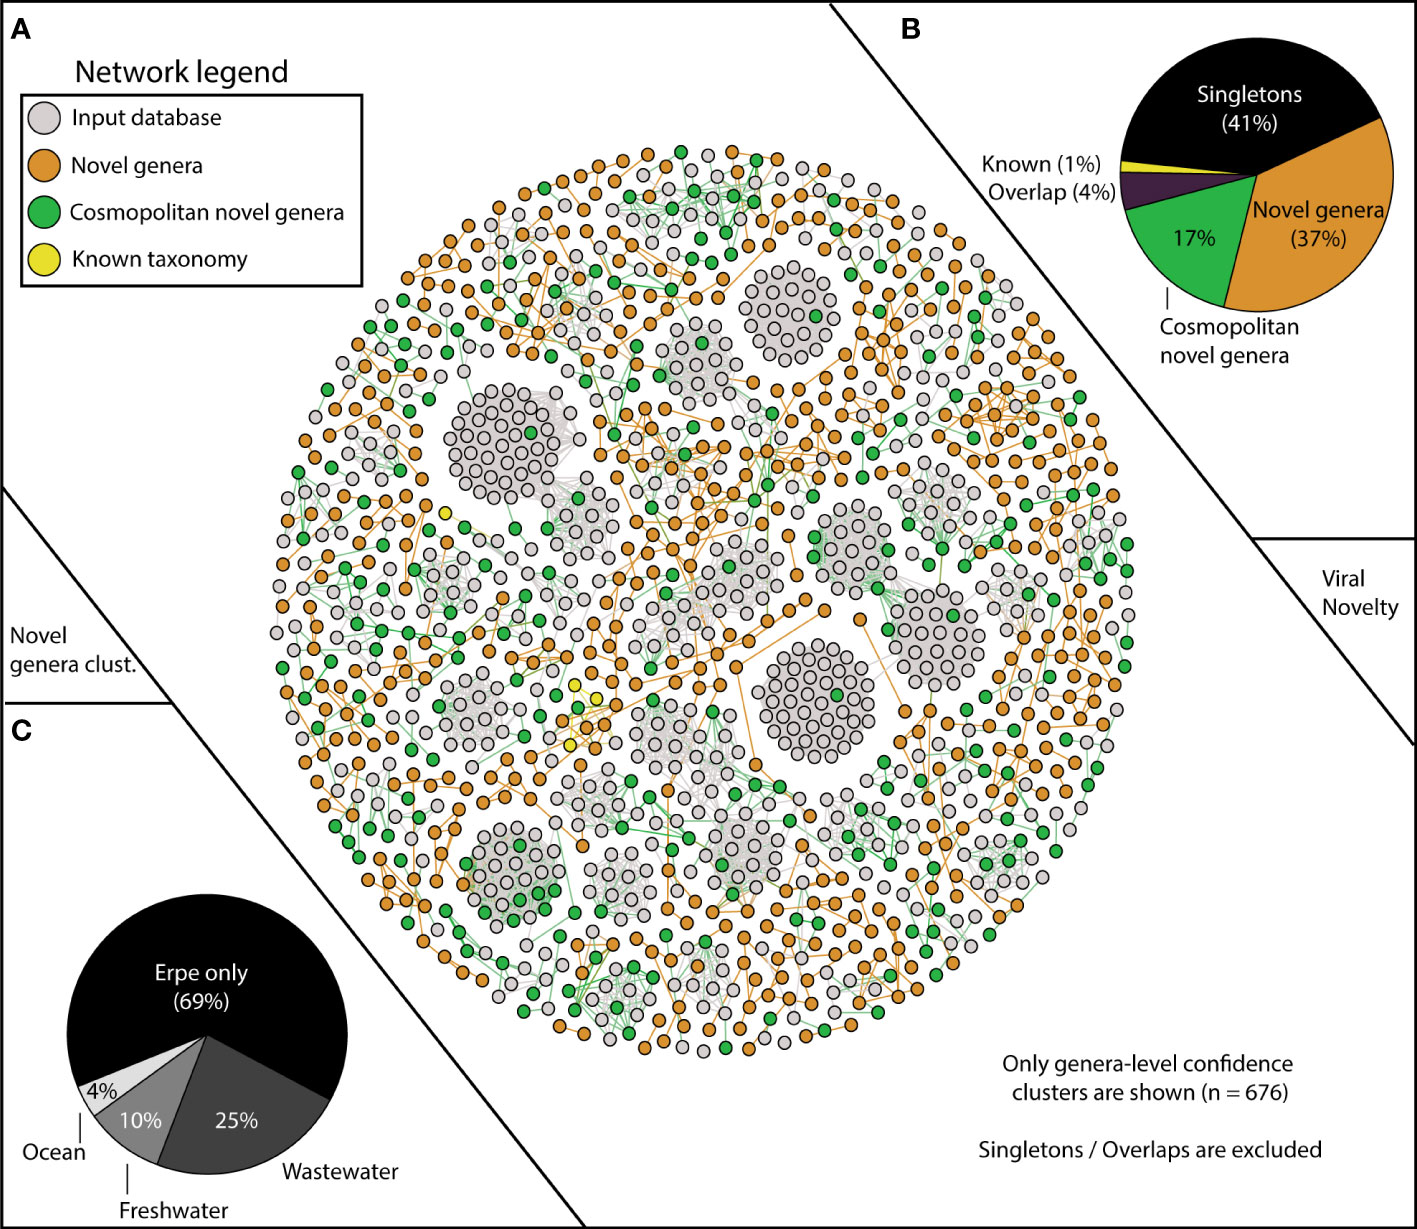
Figure 2 vContact2 reveals Erpe vMAG database constitutes mostly novel genera, and a portion of these are cosmopolitan. (A) vContact2 protein cluster (PC) similarity network where nodes represent vMAGs and edges show similarity across edges. Only high-confidence genera-level clusters are shown (n=676) with node color representing whether the vMAG pertains to our input databases (gray) or other categories assigned to vMAGs recovered here: orange shows novel genera (clustering only with Erpe genomes), green shows cosmopolitan novel genera (clustering with viruses from additional input database not from RefSeq), and yellow represents vMAGs with known taxonomy (clustering with known RefSeq vMAGs). Singletons (genomes that do not cluster with any other genomes) are excluded from the visualization (n=518). (B) Pie chart shows the distribution of the different categories from the vContact2 network of vMAGs recovered. “Overlap” refers to a category where vContact2 assigns a vMAG to more than one cluster but cannot confidently place in either. (C) Pie chart shows the proportion of vMAGs from novel genera in this study that were clustering with vMAGs from different environmental input databases.
Of our 1,230 vMAGs, 1% clustered to known taxonomic representatives of the Caudovirales Order (8 Podoviridae, 7 Siphoviridae, 3 Myoviridae). Of the remaining vMAGs, 37% clustered only to Erpe viruses, constituting 189 novel genera. An additional 41% did not cluster to any vMAG in our database and were “singletons” or “outliers”. Interestingly, 17% of our total vMAGs and nearly half of our novel genera were cosmopolitan in aquatic ecosystems, meaning that while these vMAGs failed to cluster with taxonomically known strains, they did cluster with vMAGs recovered from other ecosystems (Figure 2B). Specifically, our cosmopolitan novel genera clustered with vMAGs from wastewater treatment plant sludge or effluent (n=168), other rivers surface or sediment samples (n=65), and marine samples of the TARA oceans dataset (n=25) (Figure 2C). Notably, adding these additional viral genomes reduced the total number of River Erpe vMAGs that were categorized as singletons or outliers, resulting in the addition of 49 novel genera.
Viral and microbial River Erpe microbiomes are compartment-specific
The collected biogeochemistry was significantly structured across compartments and explained a large portion of the total variation in our samples (R2 = 0.79, p < 0.01) (Figure 3A). The surface water compartment was driven mostly by 1) the accumulation of alternative terminal electron acceptors (i.e., nitrate (NO3-), and sulfate (SO42-)), 2) the availability of nitrogen compounds (i.e., total nitrogen, avg. N), and 3) a more negative overall nominal oxidative state of carbon (NOSC) and a higher H:C ratio. Conversely, the pore water was characterized by 1) accumulation of NH4, 2) the availability of soluble reactive phosphorous (SRP), and 3) the overall concentration of carbon (avg. C), its aromaticity index (AI), and the quantity of double bond equivalents per molecule (DBE). In summary our data indicated more oxidative conditions in the SW (Mueller et al., 2021) while the FTICR-MS data showed that SW carbon was likely more labile, accessible, and thermodynamically favorable.
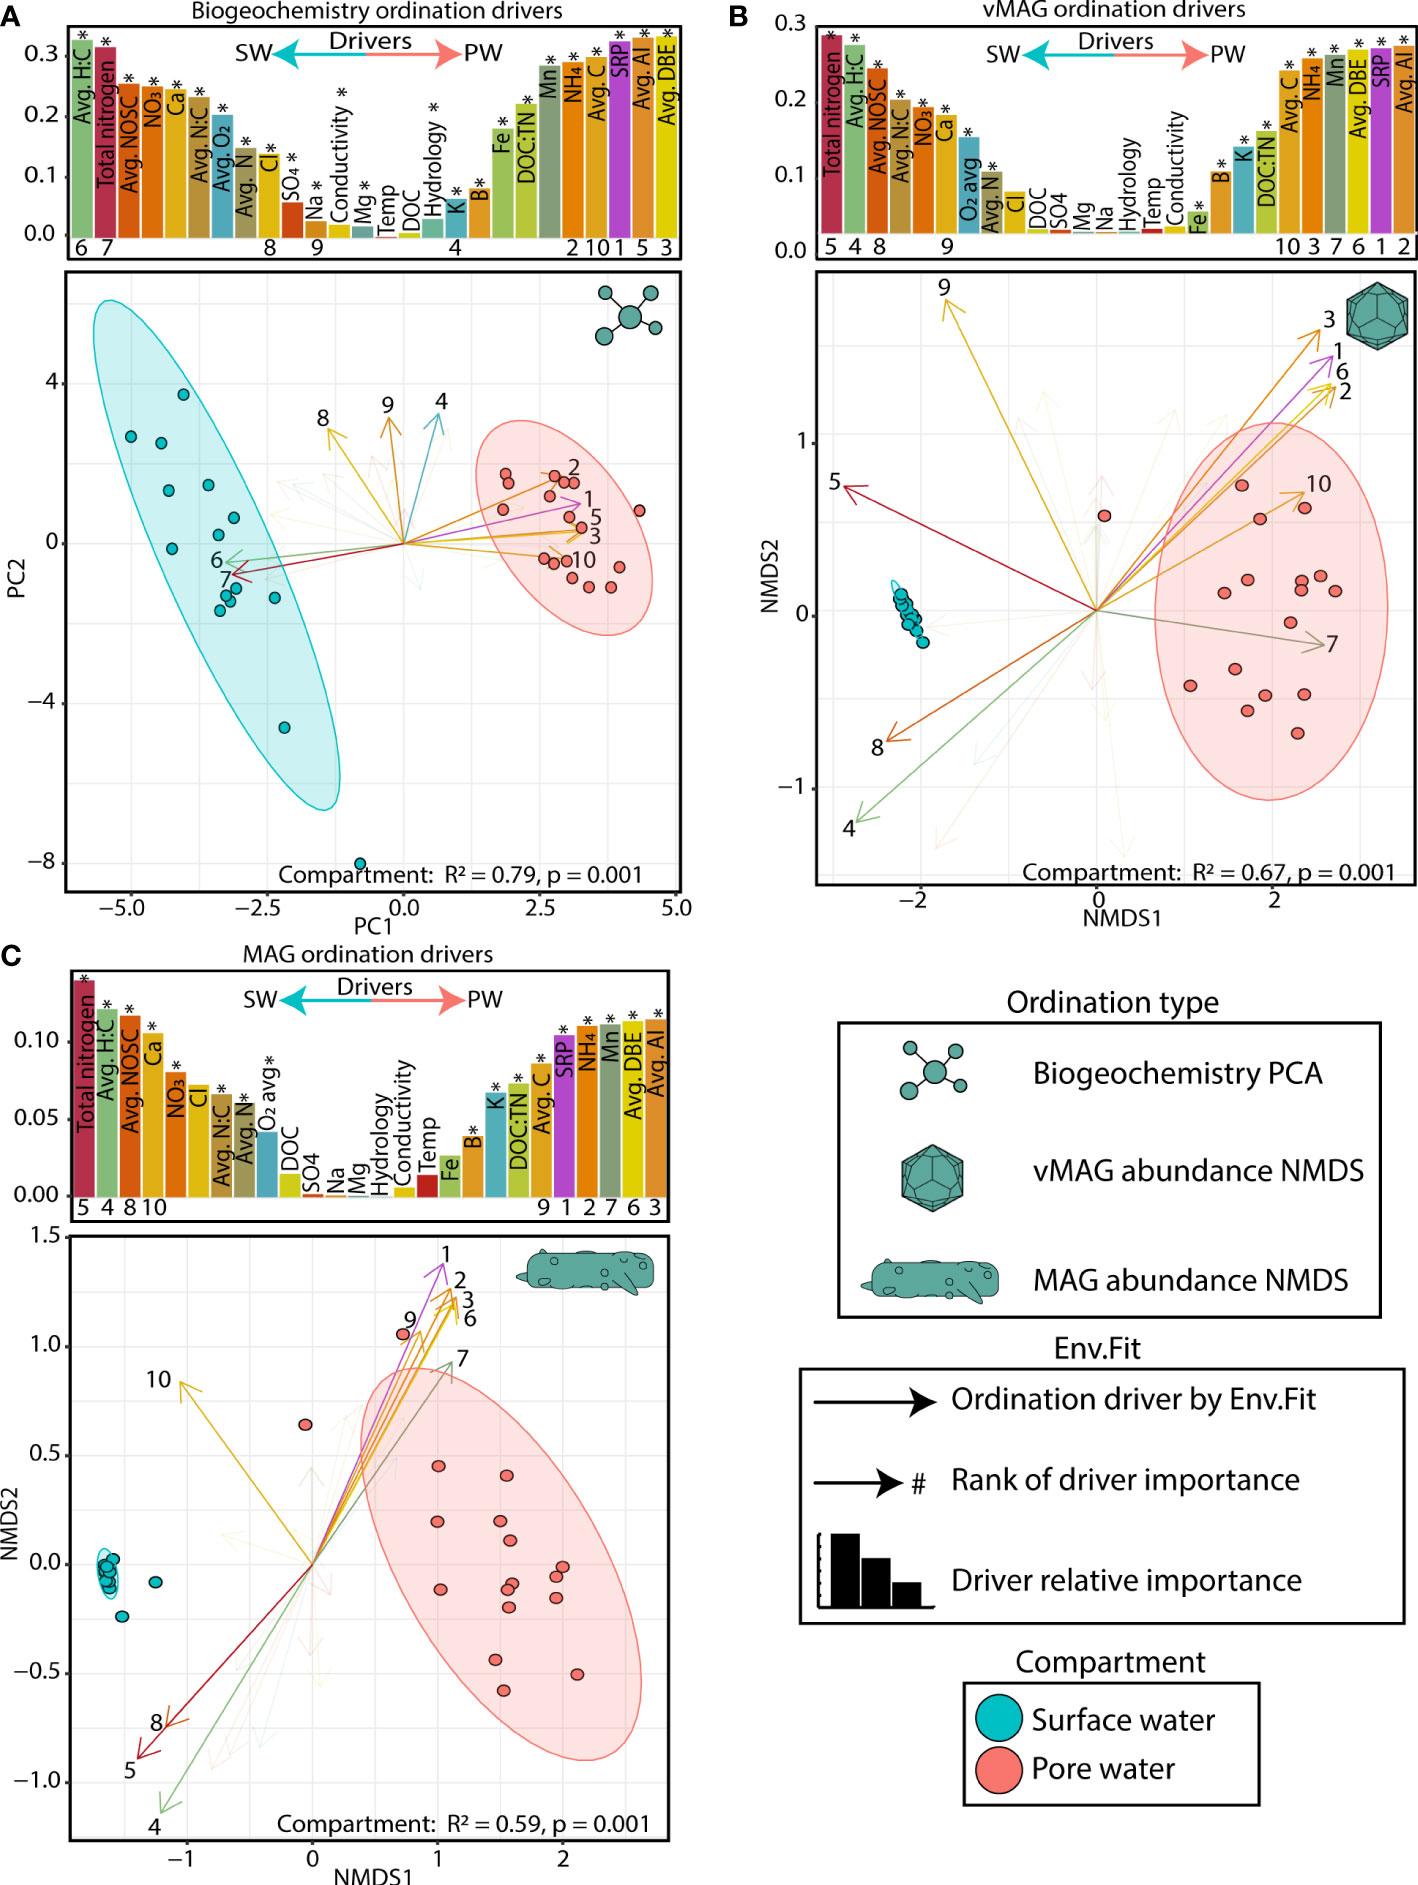
Figure 3 Surface and pore water compartments have distinct viral communities and distributions are driven by biogeochemistry (A) PCA plot of biogeochemical measurements where loadings and bars show the biogeochemical drivers per compartment. The size of bars represents the distance between the end of a loading arrow and the center of the plot. Within each bar plot, the drivers are labeled, and asterisks denote significant drivers by env.fit. The top 10 most significant drivers are numbered below each bar and are shown with solid, numbered arrows within the ordination below. (B) NMDS ordination of river pore water and surface water vMAG abundances with bars and arrows showing the same as in (A). (C) NMDS ordination of river pore water and surface water MAG abundances with bars and arrows showing the same as in (A). Non-compound abbreviations are: nominal oxidative state of carbon (NOSC), calcium (Ca), chlorine (Cl), sodium (Na), magnesium (Mg), dissolved organic carbon (DOC), soluble reactive phosphorous (SRP), aromaticity index (AI), and double bond equivalents (DBE). Note: NOSC values are plotted as the absolute value per value per sample (i.e., a higher SW NOSC driver value translates to a more negative NOSC measurement).
To determine how viral and microbial communities were structured across these biogeochemical gradients, we recruited the time-series metagenomic reads to our viral database of 1,230 dereplicated vMAGs and 125 MAGs and then performed non-metric multidimensional scaling (NMDS) ordinations (Figures 3B, C). Like the geochemical PCA plots, PERMANOVA analyses showed that river compartment explained 67% (p < 0.01) and 59% (p < 0.01) of the variation in viral and microbial communities, respectively. The drivers of both viral and microbial communities were nearly identical in both magnitude and direction. Similarly, a PROCRUSTES analyses showed that vMAG and MAG ordinations are highly coordinated with each other (sum of squares = 0.027, corr. = 0.99, p < 0.01) (Supplemental Figure 2) emphasizing the expected dependencies between our identified viral and microbial communities due to our methods. Further highlighting these compartmental distinctions, the abundances of 85% of vMAGs (n = 1051) and 67% of MAGs (n = 87) were indicators of only one compartment (Supplemental Table 5). Interestingly, across both viral and microbial ordinations as well as our PCA, time only explained an additional 4-5% of the total variation, albeit significantly (p = 0.03, p = 0.02, and p < 0.01, respectively), likely due to long travel times and hydrological separation (Supplemental Table 5).
Temporally resolved metagenomics unveils compartment-level stability and persistence of viral and microbial communities of the River Erpe
SW metagenomic temporal samples for both vMAGs and MAGs were on average 2-fold more similar than PW by Bray-Curtis dissimilarities (BC) (vMAG t = 6.3; MAG t = 6.2, p < 0.01) (Figures 4A, B). We next evaluated whether the individual temporal persistence of the viral and microbial genomes shared similar patterns to the BC across compartments, and categorized members using persistence metrics that were previously established (Chow and Fuhrman, 2012). Briefly, if a viral genome was in more than 75% of the samples it was designated as persistent, between 25-75% of samples it was intermittent, and in less than 25% it was ephemeral. Of the 1,035 vMAGs detected in the SW compartment, 70% were categorized as “persistent”, with the remainder being 25% intermittent and 5% ephemeral. Contrastingly, of the 374 vMAGs detected in the PW, only 11% were categorized as persistent, with the remainder being 26% intermittent and 63% ephemeral (Figures 4C, D). Similarly, the bacterial and archaeal MAGs shared comparable persistence patterns across the compartments (Figures 4E, F). Combined, these results showed that SW communities were less temporally dynamic in terms of BC and had more persistently sampled genomes than the PW.
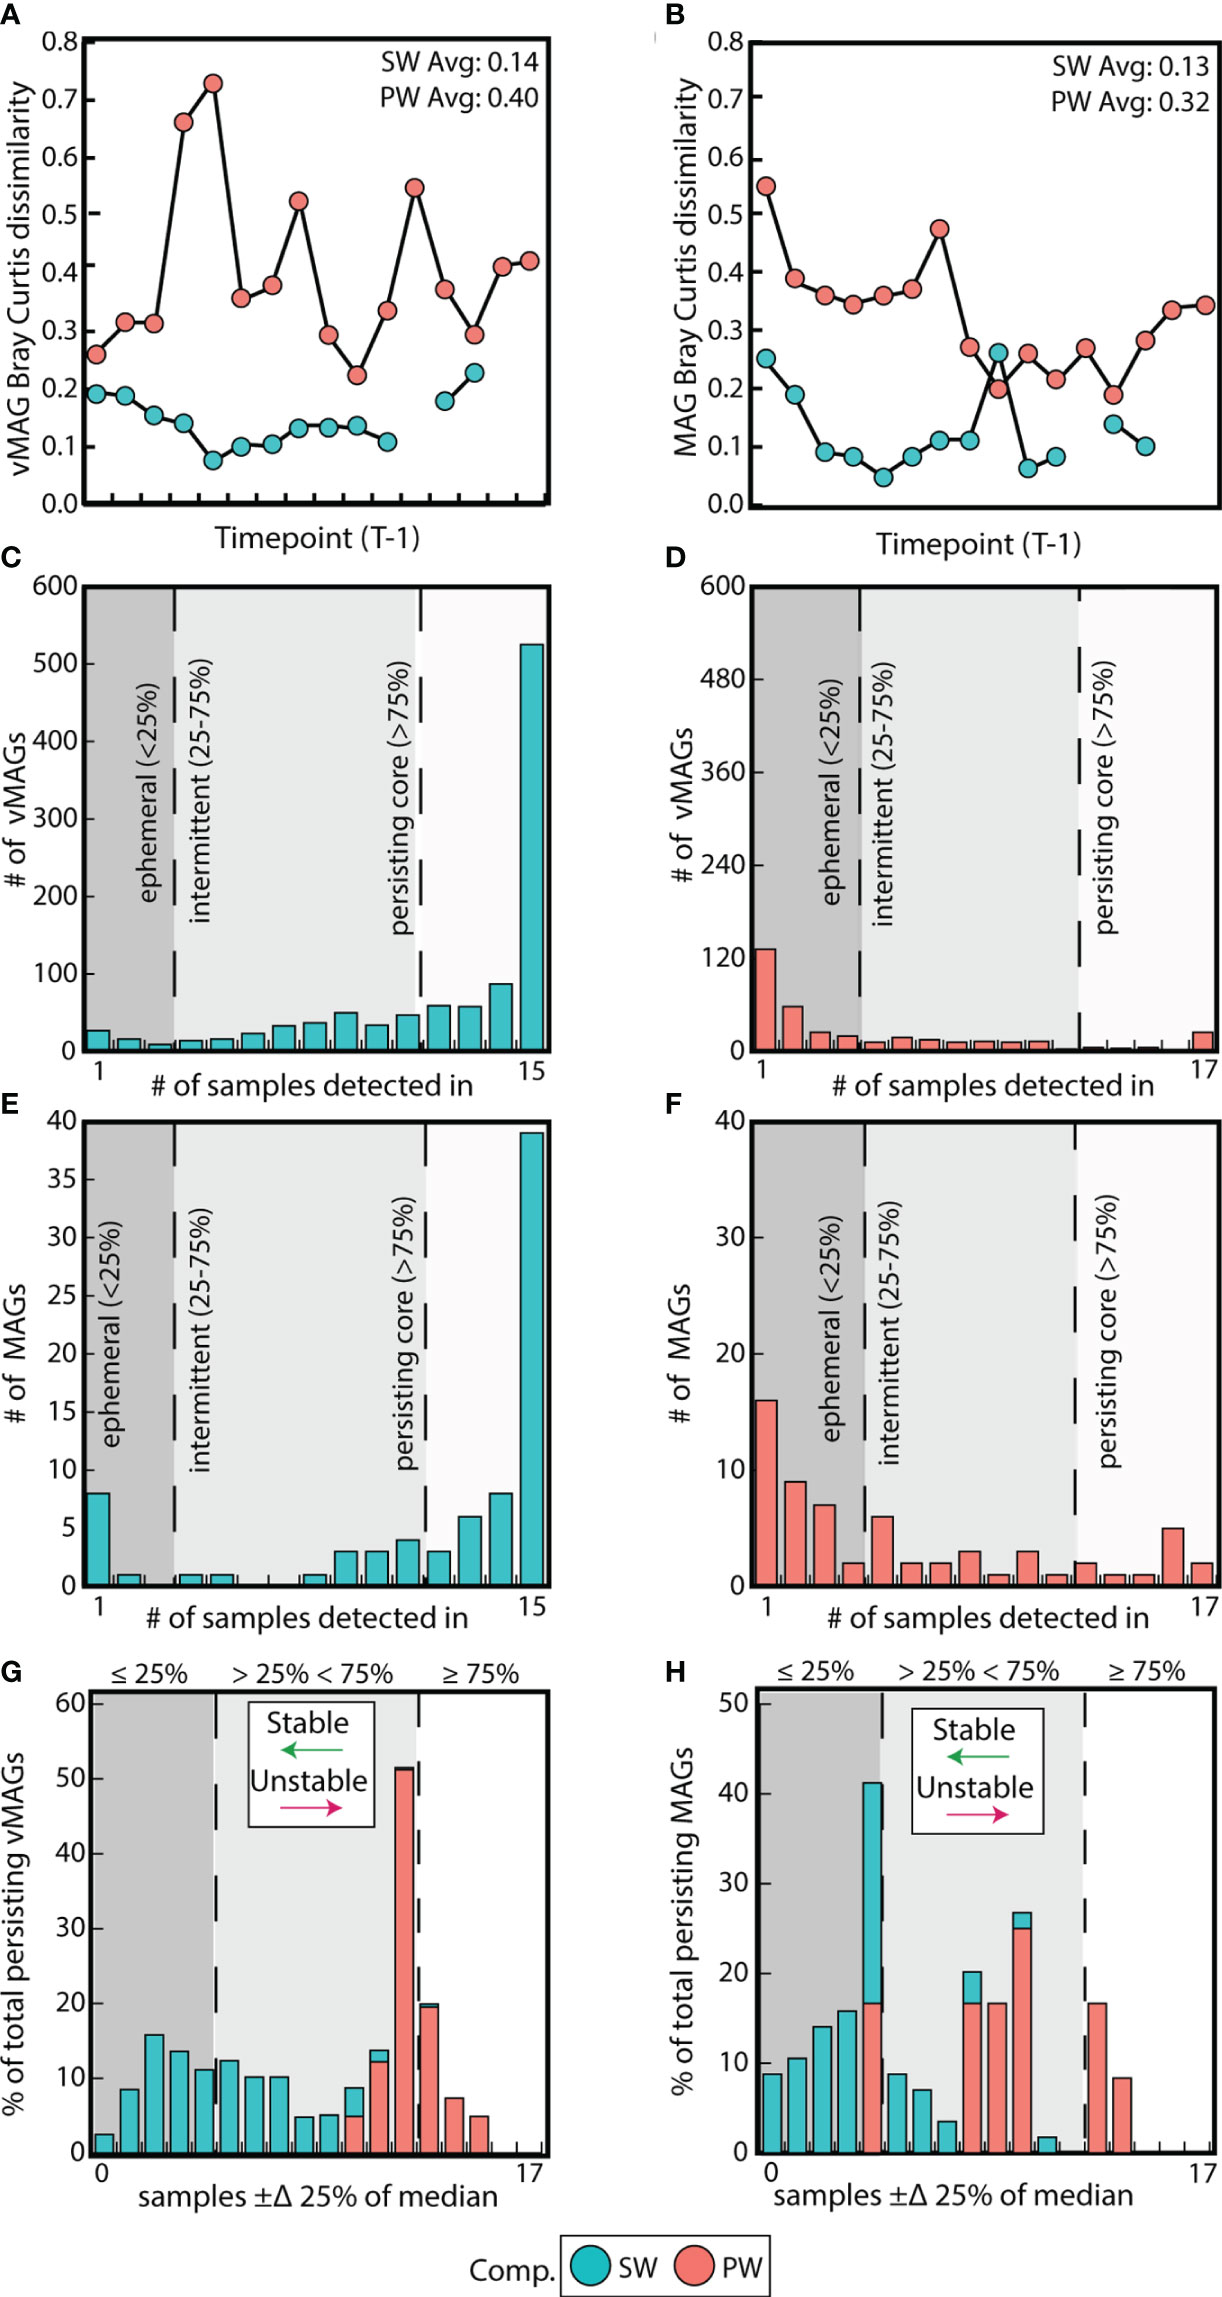
Figure 4 Surface water communities are more stable and persistent than pore water communities. (A) Difference in Bray-Curtis dissimilarities between each sample and its prior timepoint calculated for vMAGs and (B) MAGs per compartment. (C) Bar plots show the number of persistent, intermittent, and ephemeral vMAGs in the SW and (D) the PW. (E) Bar plots show the number of persistent, intermittent, and ephemeral MAGs in the SW and (F) the PW. (G) Bar plot where the x-axis shows the number of samples where each vMAG that fluctuates above or below 25% of their median values and the y-axis shows the normalized total percentage of persistent genomes per each compartment that are fluctuating. (H) Identical bar plots to those in (G) but for MAGs.
We then assessed whether the relative abundance of persistent genomes was also temporally stable. Based on a prior study (Chow and Fuhrman, 2012), we tallied the number of samples in which persistent vMAG and MAG relative abundances exceeded ± 25% of their respective median (Figures 4G, H, Supplementary Table 4). Our results showed that both the relative abundance of vMAGs and MAGs in the SW fluctuate less over time than the PW as shown by Fishers exact t test (p < 0.01). Our persistence and temporal stability results supplement the observation that surface water communities in this urban stream change less over the 48-hour period than pore water communities which are more dynamic.
Genome-resolved virus-host analyses demonstrated viruses could infect highly abundant, phylogenetically diverse microbial genomes
We were able to predict hosts for 73 vMAGs, matching 30% (n = 38) of our total microbial genomes to a viral partner (Figure 5). A majority (62%) of vMAGs with host associations were from the SW compartment, with 22% of host-associated vMAGs found in the PW, and around 10% found across both compartments. MAGs that had viruses linked to them were highly abundant, with 54% of our linked vMAGs infecting hosts of the top 25% most abundant MAGs. At the phylum level, 11 of the 20 identified phyla had evidence for a viral host. Notably, all the phyla that could not be assigned a viral link had 2 or less MAG representatives, with the exception of Desulfobacterota which had 6 MAGs. Additionally, of the 51 Patescibacteria MAGs we recovered in this study, we uncovered 12 possible viral genome links, which to our knowledge is one of the few reports of possible infective agents for members of this phylum (Holmfeldt et al., 2021; Trubl et al., 2021), and is the only one thus far reported in rivers. Ultimately, nearly a third of the genera from our MAG database as defined by GTDB were successfully linked to a vMAG, providing further evidence that viral predation is likely pervasive across these river microbial communities.
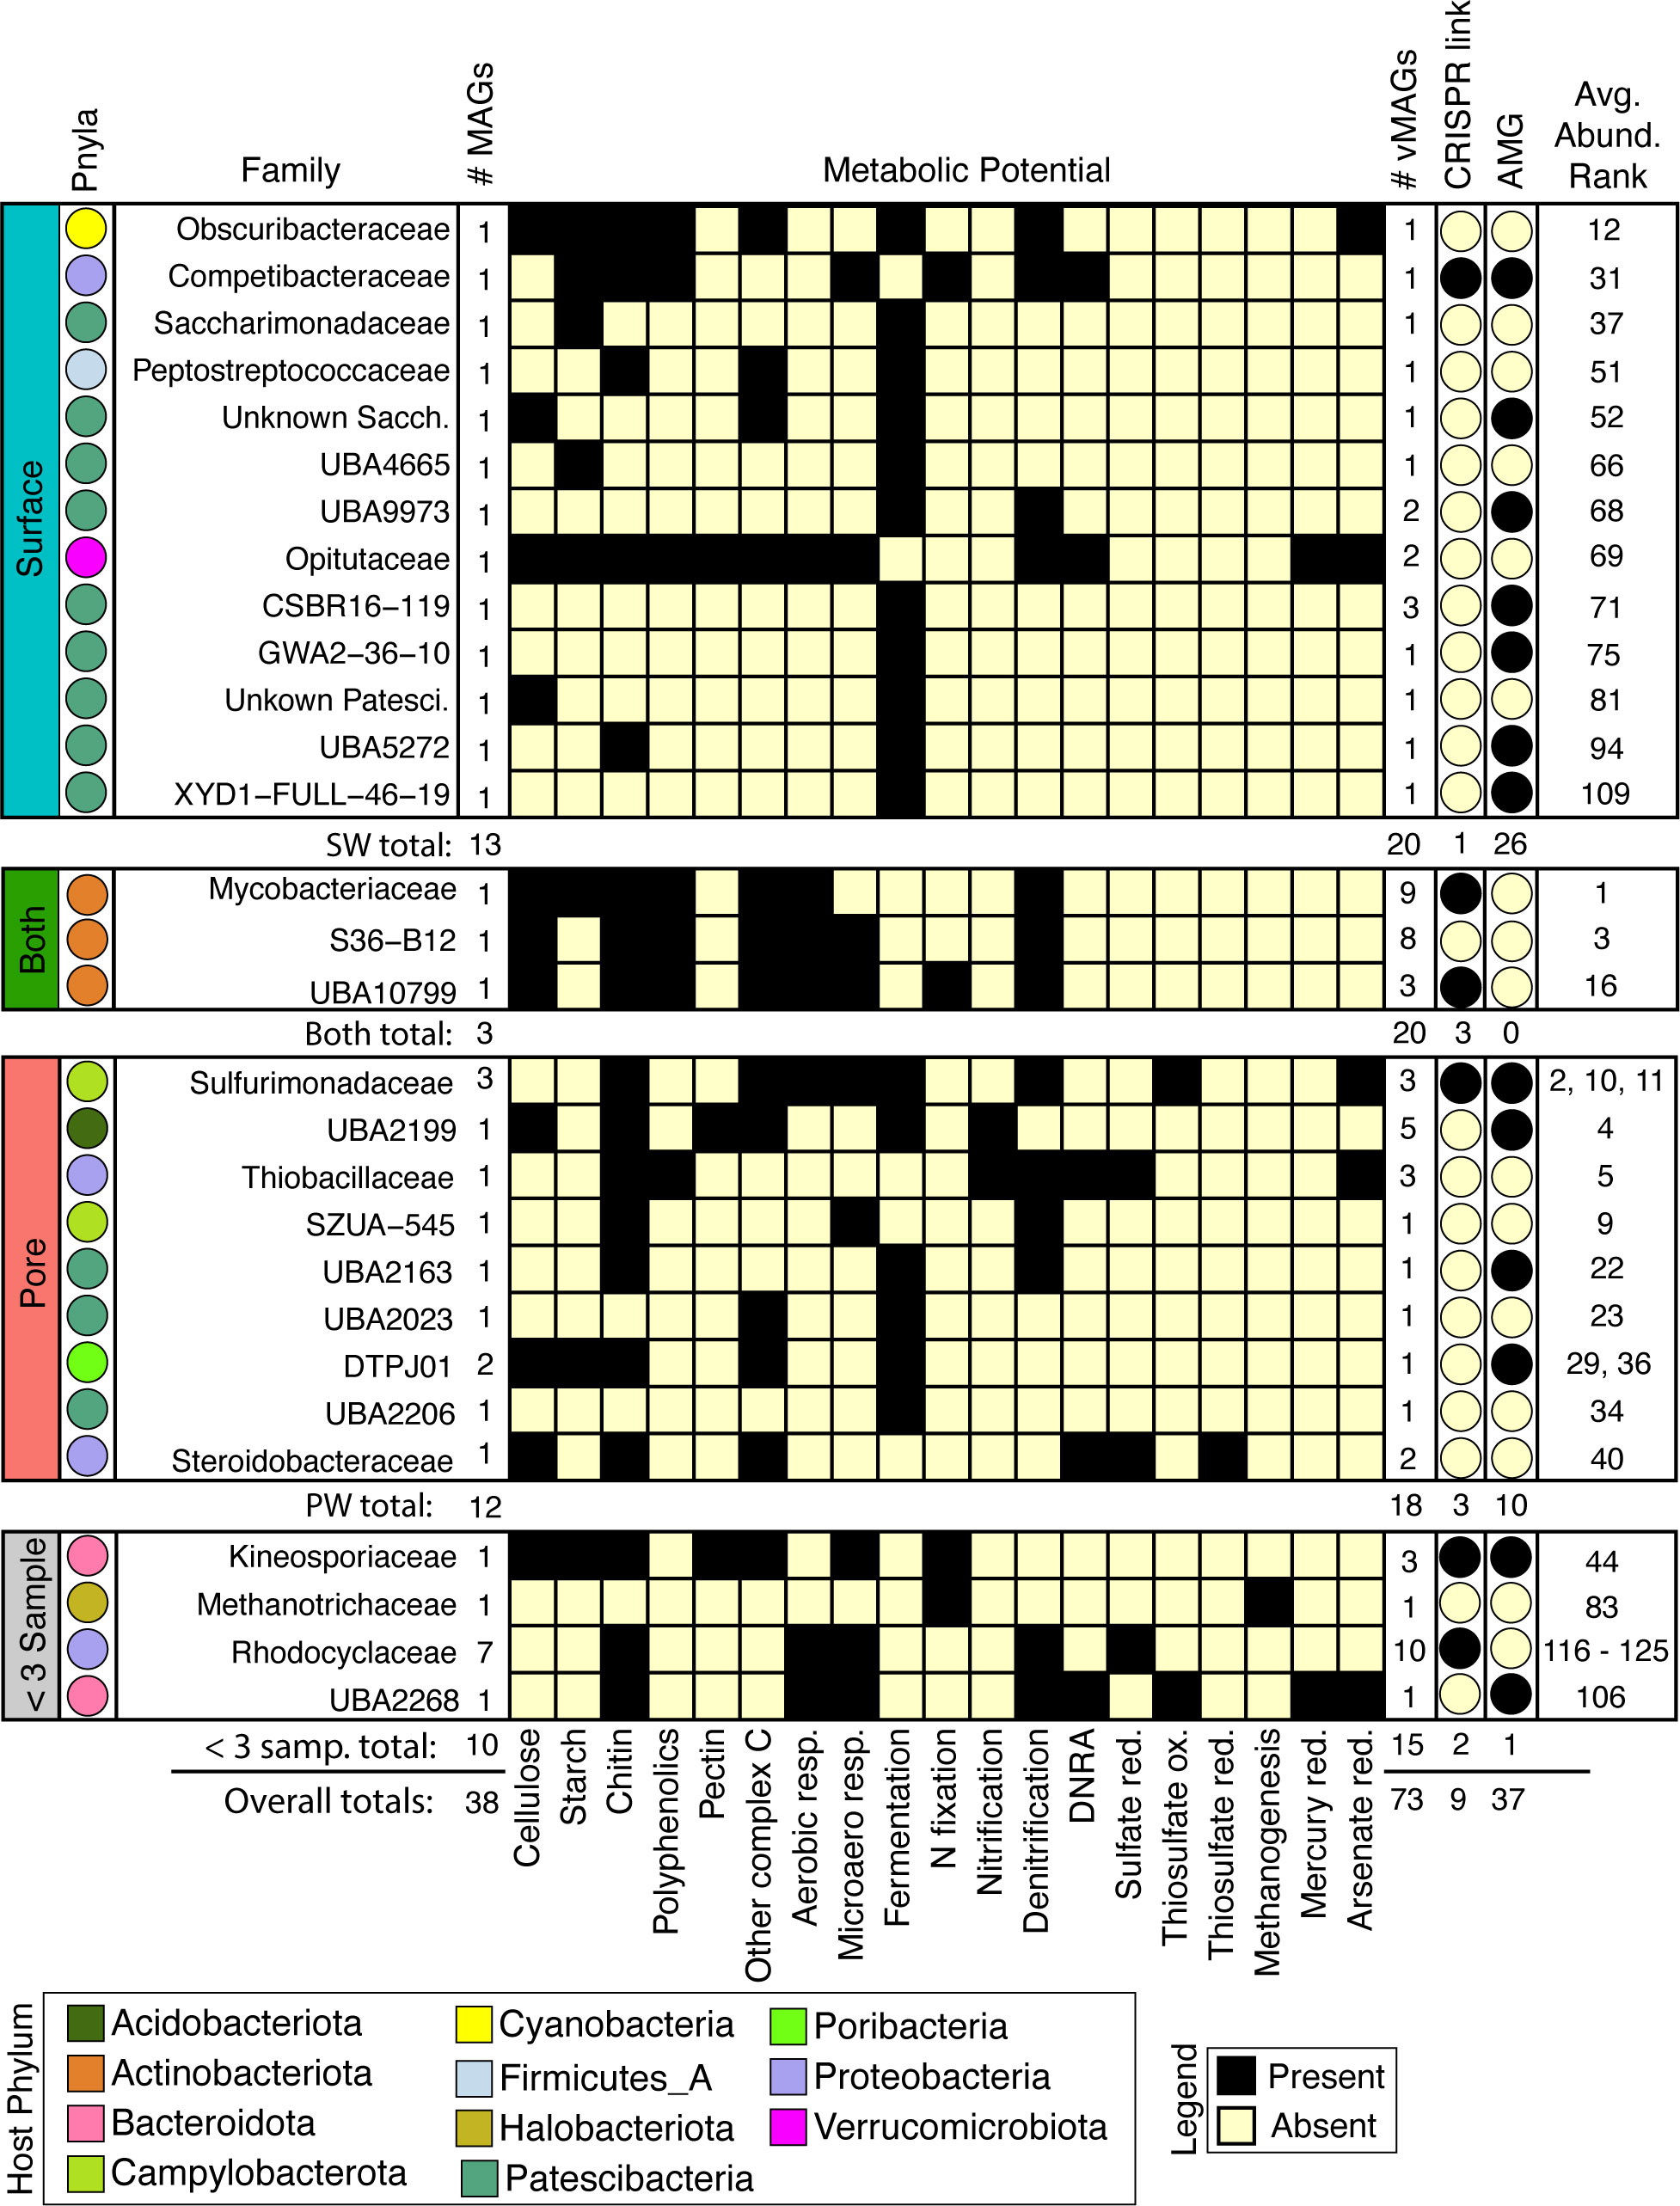
Figure 5 Viruses infect abundant microorganisms in rivers which can influence aerobic and anaerobic C, N, and S cycling by predation or auxiliary metabolic genes. MAG families that had a linkage to a virus are shown and split into their compartment-level distributions. From left to right: Colors of each circle on the leftmost side represent the Phyla, and for each family the total number of MAGs are shown. The presence absence heatmap describes the metabolisms of each family. Following the heatmap are the number of vMAGs that are linked in each family, whether the virus-host link is predicted by CRISPR or consensus method, and if at least 1 infecting vMAG with an AMG is reported. Numbers below each bounding box show totals of above criteria. The overall average rank of each MAG within a family is shown in the rightmost column.
To decipher the potential impacts that viral predation could have on biogeochemical cycling across the collected timeseries, we metabolically characterized the 38 viral-linked MAGs from our genome-resolved database and saw a wide array of metabolisms spanning ecosystem chemical gradients (Figure 5). Across both compartments, viruses were inferred to impact hosts that could modulate both aerobic and microaerophilic metabolism (carbon respiration), as well as anaerobic metabolisms (nitrate reduction, fumarate reduction, fermentation, and nitrogen fixation). For example, vMAGs were predicted to infect hosts with metabolisms such as methanogenesis (e.g., Methanothrix), and sulfur metabolisms (e.g., Sulfurimonas), which were encoded more predominantly by MAGs in the PW. vMAGs were also predicted to infect members that encoded denitrification pathways which were prevalent in organisms across both compartments (e.g., Nanopelagicales). Interestingly, 20% of the vMAGs that infected hosts were cosmopolitan, with representatives identified in other freshwater and wastewater systems (Supplementary Table S2). Together, our genome-resolved database of microbial metabolisms and their putatively infecting viruses gives insight into the underpinnings of River Erpe metabolisms, and show that genome-resolved, river microbiome studies can provide critical perspectives for understanding the impact that viruses can have in river ecosystems.
Virally encoded auxiliary metabolic genes can potentially alter host metabolic machinery in this urban-impacted river
In addition to the impact on microbial communities via predation, viruses can also mediate biogeochemical cycles through enhancing host metabolism with Auxiliary Metabolic Genes (AMGs). We mined our 1,230 vMAGs for putative AMGs and found 165 unique viral AMG candidates after quality filtering, which encompassed 65 unique gene IDs. We failed to see a statistical enrichment for the number of AMGs in either compartment (Fisher’s exact p = 0.77), suggesting their shared importance for the River Erpe. The functionalities of these AMGs at the gene annotation level (e.g., KO number) were mostly conserved across compartments, with only 27% of unique gene IDs present in both compartments. However, at the DRAM-v functional module level (e.g., amino acid metabolism) 69% of metabolisms were present across both our ecological gradients (Figure 6B). Conserved DRAM categories across compartments pertained to carbon utilization (e.g., CAZyme inferred substrates (cellulases), glycolysis), energy generation (e.g., CO2 fixation (reductive pentose phosphate pathway)), and other reactions (methionine degradation). We note that genes necessary for viral replication like nucleotide biosynthesis, ribosomal proteins, host mimicry, glycan biosynthesis, cofactor and vitamin metabolism, and molecular transporters were conserved between compartments.
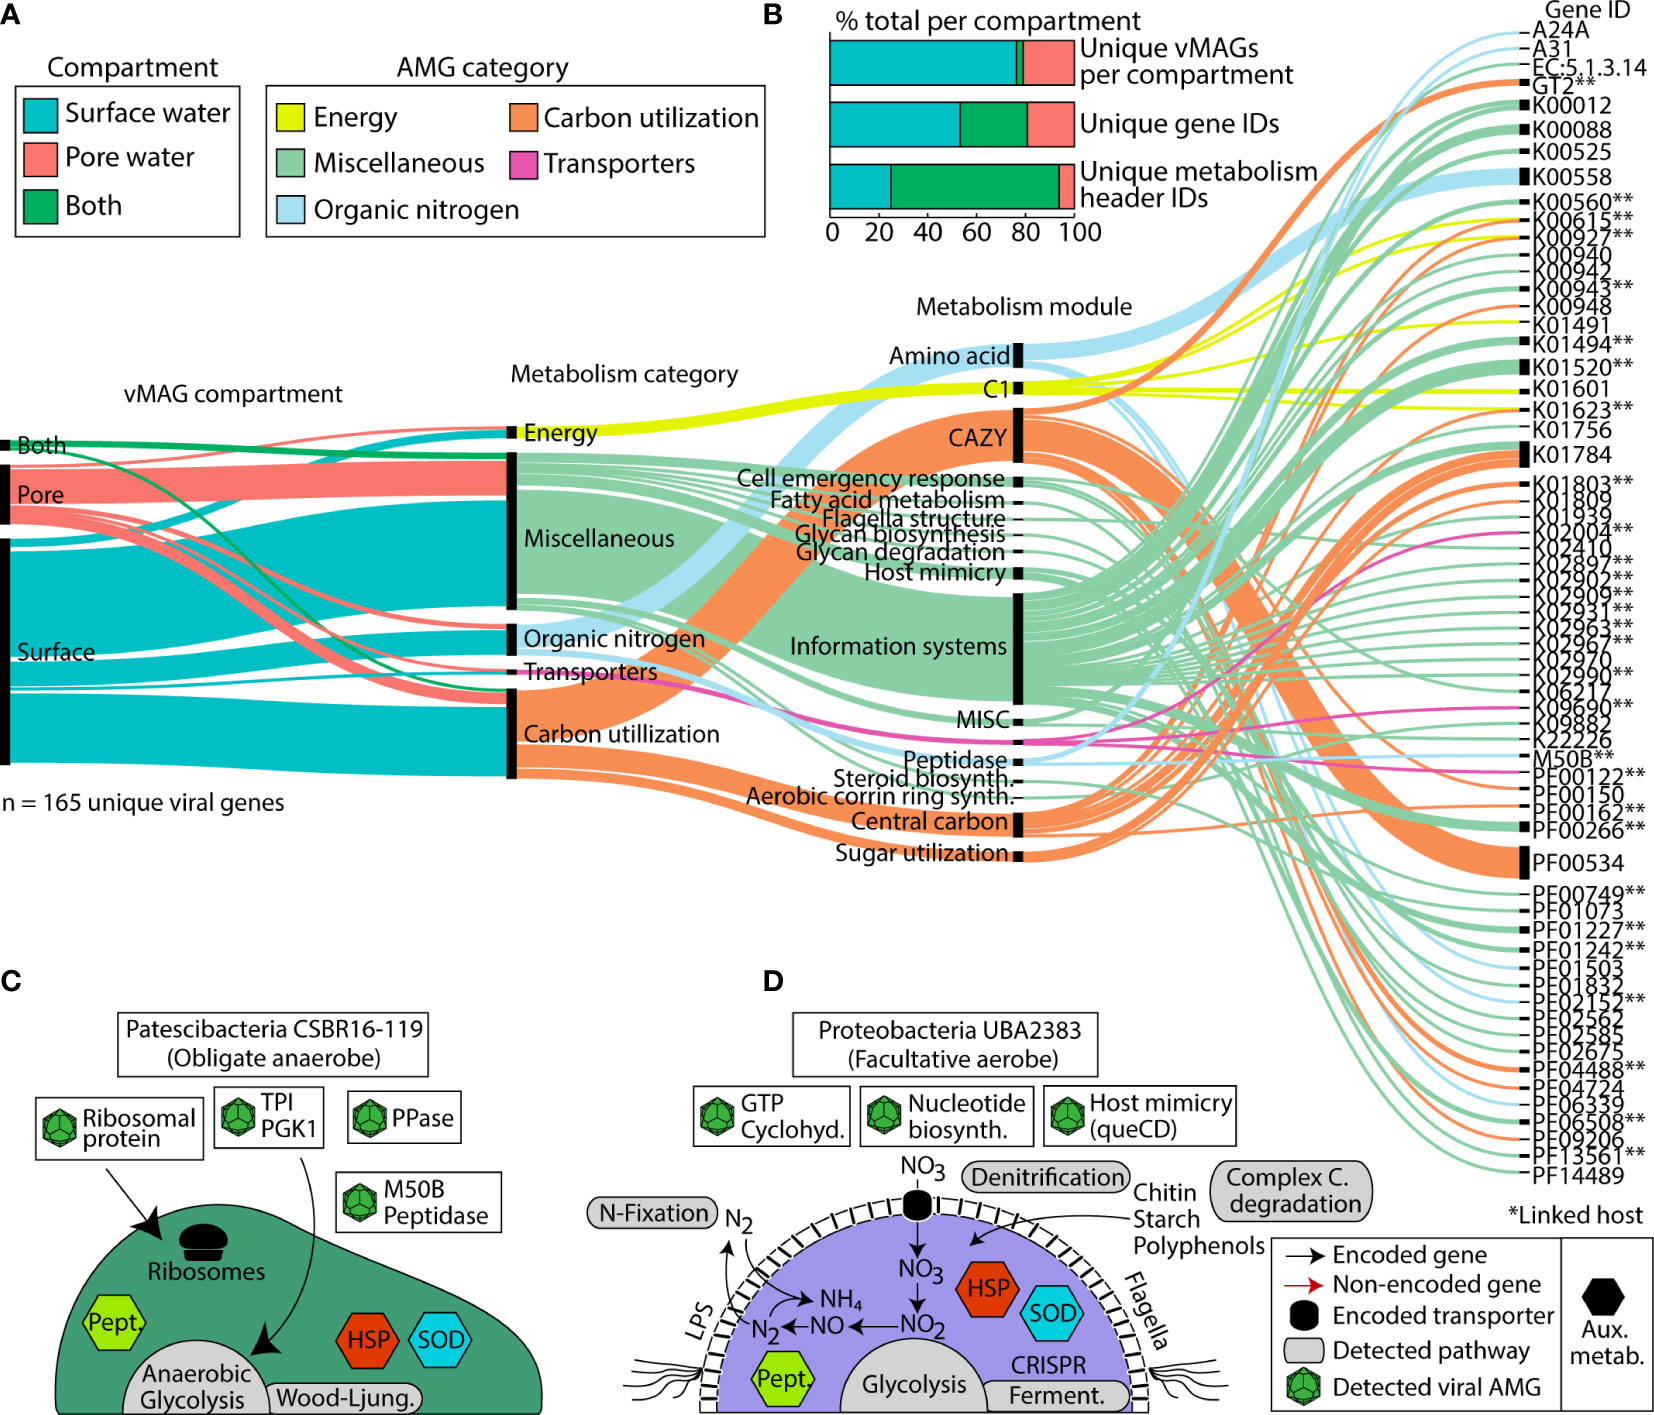
Figure 6 Distribution of viral Auxiliary Metabolic Genes (AMGs) and their function reveals key viral interactions that can enhance host metabolism in river ecosystems. (A) Alluvial plot shows the subset of AMGs (77%, n=165) that had a metabolic function annotated by DRAM-v and were 1) not at the end of a contig and 2) did not contain a transposon like element. In the first vertical line, colors show the compartments that each vMAG with an AMG was detected in. The second vertical line shows the different DRAM-v metabolic categories for each AMG. The next vertical line shows the specific metabolic module name as categorized by DRAM. The final line contains each of the Gene IDs for the detected AMGs. Genes that can have multiple functions (n = 13) are duplicated and treated as individual genes within each category. (B) Stacked bar charts show the proportion of total AMGs encoded in vMAGs from different compartments at the scaffold, gene ID, and metabolism header ID level as shown in (A). (C, D) Genome cartoons of two computationally linked bacterial hosts and their respective metabolisms. Detected viral AMGs are shown as viral icons above each genome cartoon. Pept., peptidases; HSP, heat shock proteins; SOD, superoxide dismutase; queCD, 7-cyano-7-deazaguanine synthase; 6-carboxy-5,6,7,8-tetrahydropterin synthase. Asterisks (**) denote AMGs that were encoded within a virus that had a computationally linked host.
There were also some unique AMGs that did show compartment specificity. For example, within the surface water we exclusively detected AMGs for organic nitrogen mineralization and transcriptional regulation (i.e., peptidase M50), sugar metabolism (i.e., fructose and mannose (mannose-6-phosphate isomerase)), and motility (i.e., flagellar motor switch protein FliG). We note that among our putative AMGs, we also identified several glycosyltransferases (i.e., GT1, GT2, GT17, and a general sugar binding GT) (Figure 6A). These GT genes are commonly reported as carbohydrate degradation enzymes in other studies, particularly those annotated as glycosyltransferase 2 (GT2) because of the breadth of reactions in their CAZyme families. As such, while we report these in our figure and supplemental information for transparency, we urge caution when inferring these activities in carbon degradation.
We next considered AMGs that either expanded the host metabolism or that were complementary to the host metabolism (i.e., Class I AMGs) (Hurwitz and U’Ren, 2016). Of the 12 Patescibacteria MAGs that had possible viral genome links, MAG representative CSBR16-119 had two possible vMAG linkages. A comparison of the metabolic capabilities of the host and viral genomes indicated multiple shared genes (Figure 6C, Supplemental Table 2). For example, a peptidase-like protein (M50) that is inferred transcriptional regulator (Rawlings et al., 2018) was present in both the Patescibacteria MAG and its infecting vMAG. Across the length of the open reading frame, these bacterial and viral genes shared 77% and 99% nucleotide and amino acid similarity, respectively (Supplemental Table 2). The microbial host genome also had a single copy of ribosome L28 encoded, and two viral genomes putatively infecting this host contained a relevant homolog to L28 (>93% identity, over 90% query coverage) (Supplemental Table 2).
A second putatively infected genome was Proteobacteria UBA2383 (a novel unclassified Competibacteraceae) which had broad metabolic capabilities and was persistent in our samples (Figure 6D). This MAG was inferred to be a facultative aerobe encoding genes for aerobic respiration and for denitrification. UBA2383 encoded genes supporting a heterotrophic lifestyle including CAZymes necessary for the degradation of complex carbon substrates (e.g., chitin, starch, and polyphenol) and the enzymatic capacity to utilize these substrates for energy (e.g., glycolysis, tricarboxylic acid cycle). This MAG also encoded the ability to fix nitrogen and denitrify. The two vMAGs that were associated with this genome encoded genes to support host metabolism (e.g., GTP cyclohydrolase) which generates important co-factors for bacterial metabolic processes (Supplemental Table 2) (He and Rosazza, 2003). Additional AMGs encoded by infecting viruses could potentially enhance nucleotide biosynthesis (dCTP deaminase, dUTP pyrophosphatase, thymidylate synthase) as well as other viral functions like host mimicry genes (i.e., 7-cyano-7-deazaguanine synthase, 6-carboxy-5,6,7,8-tetrahydropterin synthase) to avoid the CRISPR defense mechanisms encoded within the host Proteobacteria. More research using non-homology based methods, as well as expression patterns of these AMGs would help confirm their functionality and activity in this urban-impacted stream.
Co-occurrence networks elucidate ecological patterns that inform ecosystem biogeochemistry
To link viral and microbial communities more concretely to ecosystem biogeochemical cycling, we leveraged our collected temporal samples and applied a Weighted Gene Correlation Network Analysis (WGCNA) to identify organismal groups that co-occurred over the 48-hour sampling time. Highlighting the clear distinctions in SW and PW compartments, WGCNA analyses could not be reasonably performed simultaneously on a combined dataset (scale free topology model fit max = 0.32 at power = 20). As such, using only microbial and viral genomic abundances from either SW or PW separately, we identified 15 and 4 co-occurring modules in the SW and PW, respectively (Supplemental Figure 4). The largest module in both networks (turquoise module) contained 254 genomes in the SW and 71 in the PW. In the SW compartment, the overall modules had an average richness of 66 vMAGs and 5 MAGs, while in the PW they had an average richness of 46 vMAGs and 10 MAGs.
Both surface and pore water communities had modules of co-occurring genomes that were significantly related by sparse partial least square regressions (sPLS) to the collected biogeochemical measurements (R2 > 0.3, p < 0.05) (Figure 7A, Supplemental Figure 4). Only total Fe concentrations were related to modules in both the SW (brown, salmon modules) and PW (red module). SW modules were uniquely related to variables pertinent to nitrogen (nitrate, average total nitrogen), carbon (average total carbon, aromaticity index, hydrogen:carbon), as well as physical (temperature, water stage) and geochemical (magnesium, calcium, manganese, ammonium, sulfate) features in these samples. Of the 8 modules that were significantly related to ecosystem hydrobiogeochemical features, viruses had significant variable importance in projection scores (VIP > 1) in 7 of them, and 70% of the most significantly related genomes across all regressions were viral (Figure 7B).
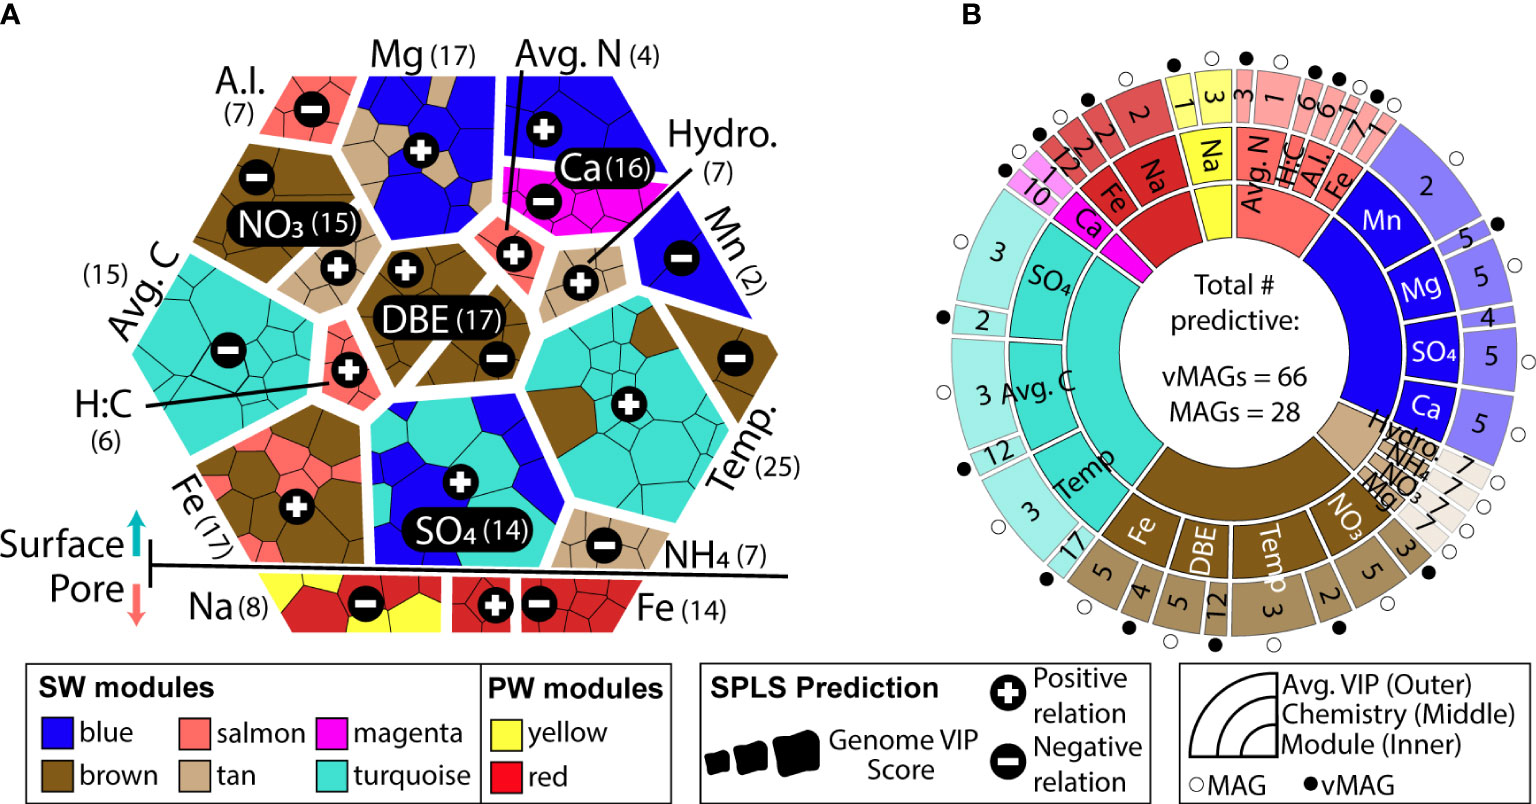
Figure 7 WGCNA co-occurrence networks reveal ecologically similar groups that are related to overall ecosystem biogeochemistry. (A) Voronoi diagram shows VIP values of predictions for each predictive genome using a hierarchy structure. Each amorphous square within a group represents a single MAG or vMAG. At the first level (i.e., splitting of the large hexagon into upper and lower groups), SW (top) and PW (bottom) predictions are shown. At the second level (i.e., grouping of individual chemical variables predicted across each compartment), individual chemical variables are shown, per each compartment, and how many vMAGs/MAGs were predictive are denoted by numbers next to each variable name. At the third level (i.e., individual amorphous square or genomes), shapes are sized by the VIP score (>1) of genomes that predict that variable and are colored by their respective WGCNA module. (B) Sunburst diagram shows the predictive WGCNA modules in the innermost level, followed by what chemical values each module predicts in the middle level. The outer level shows the average variable importance in projection (VIP) score for each genome type: vMAG (black circles) and MAGs (white circles) for that chemical prediction.
Of the 73 vMAGs and 38 MAGs that were computationally linked (Figures 5, 6), nearly a quarter of those vMAGs and a third of MAGs were grouped into the same co-occurring modules. Interestingly, the SW brown module was related to the total nitrate concentrations in our dataset and contained a co-occurring virus-host link (Figure 8A). The host genome was the Competibacteraceae genome in Figure 6D and its putatively infecting a virus, which together could play roles in modulating the nitrogen cycling through both fixation and denitrification. This virus and microbial host pair had significant negative correlations to nitrate concentrations and were the second and fourth most significantly related genomes to nitrate within the brown module. The virus bacterial ratio (VBR) for these two organisms was nearly 1:1 and significantly correlated, which is expected of kill the winner dynamics (Trubl et al., 2021), and ultimately highlighting the possible dependency of an infecting vMAG and its host (Figure 8B). In support of this relationship, the viral genome coverages were on average 10x more than the putative host MAG coverage, suggesting a possible lytic infection lifestyle. Further underlining the importance of these related genomes, both were designated as persistent (i.e., present in >75% of all collected timepoints) and were the 1st (vMAG) and 9th (MAG) most abundant genomes detected in the surface waters.
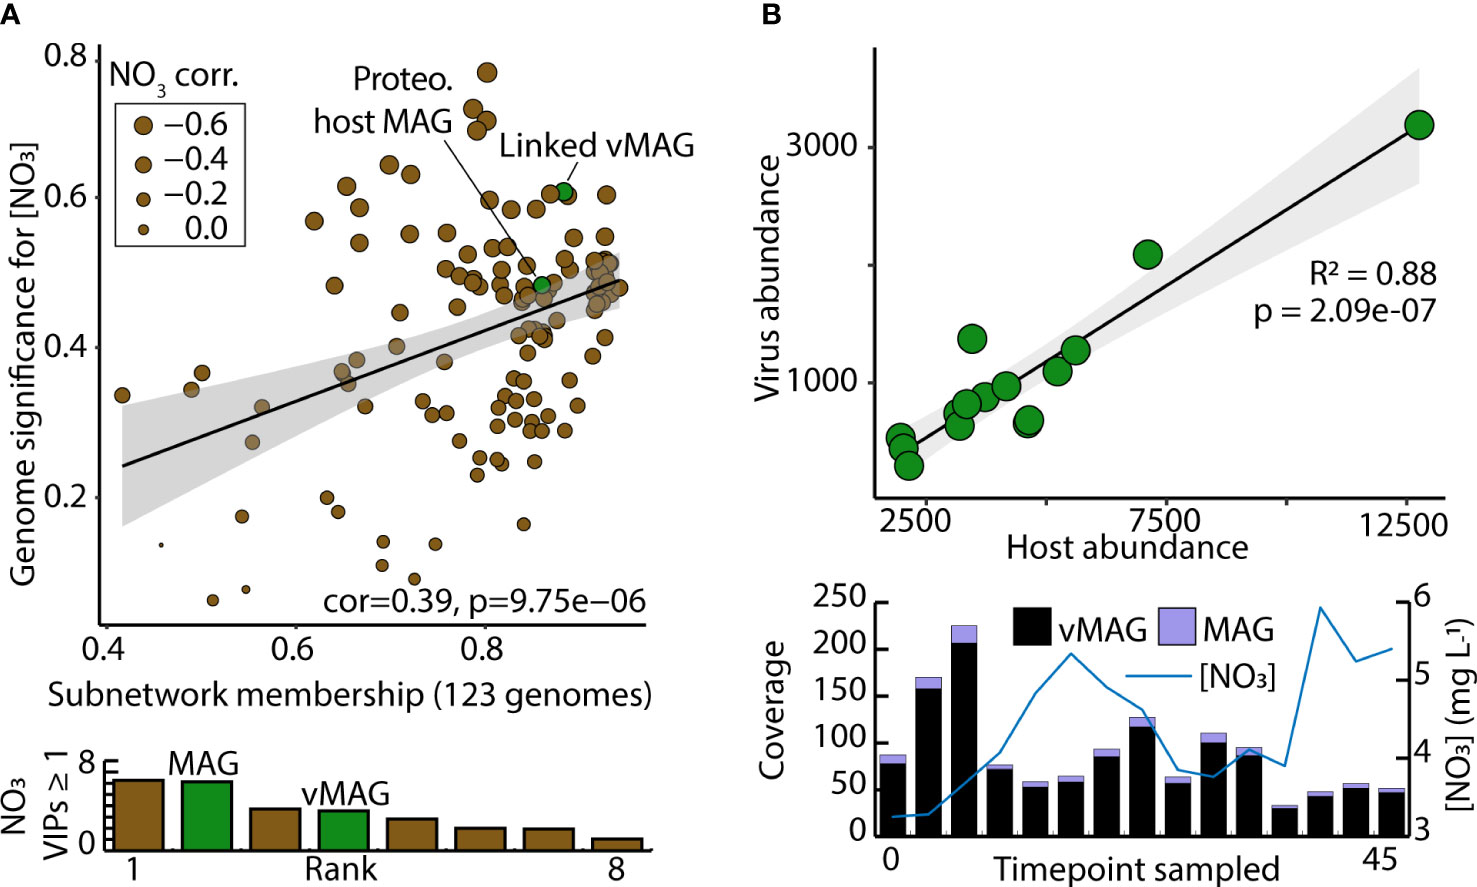
Figure 8 Computationally linked vMAG and MAG pair that share co-occurrence patterns demonstrate high significance for nitrate, and display kill-the-winner dynamics. (A) Scatterplot depicts the genomic significance for nitrate of each of the genomes in the brown module in relation to the membership of those genomes within the WGCNA network modules. Below, bar charts show the VIP score (≥1) of the different organisms in the brown module. (B) A Virus bacteria ratio (VBR) plot of a viral genome within the brown module that was predicted to infect a Proteobacteria genome. Below it, bar plots show the total coverage across all samples for both the vMAG and the MAG, and a line graph shows the measured nitrate concentrations that these genomes predict.
Discussion
Viral reference databases underrepresent certain habitats, missing cosmopolitan, ecologically relevant lineages
Nearly a quarter of our Erpe viruses formed genus-level clusters with viruses from wastewater and freshwater systems, and of those, 11% encoded a putative AMG with functions for metabolisms such as carbon utilization, organic nitrogen transformations, and housekeeping functions (i.e., transporters and flagellar assembly). While the protein clustering of River Erpe vMAGs to wastewater viruses was not entirely surprising given the sampling location was downstream from the wastewater outlet (Mueller et al., 2021), we note that we also clustered a similar proportion of viruses to other viral genomes from river systems. Notably, this similar clustering proportion for River Erpe viruses was not observed with the TARA ocean viruses (Figure 2C, Supplemental Figure 3). These results hint at possible ecosystem filtering that may affect the biogeographical patterns of freshwater viruses. Our results also underscore the importance of customized, ecosystem relevant databases in environmental viromics for extending the ecological relevance of these ecosystem modulators, and further understanding the major drivers for river microbiomes.
Temporally and spatially resolved metagenomics coupled to metabolites and geochemistry enhances our understanding of river microbiome structure
Sampling with a Eulerian method allowed us to detect microbiomes passing through the same space over time in the SW and PW samples. Due to the flow rate of SW, and the potential that PW communities may be more biofilm impacted, we might have expected to see greater microbial and viral changes in the surface compartment than the sediments over the sampled time period. On the contrary, both vMAGs and MAGs were more persistent and had more stable abundance patterns over time in the SW of the River Erpe (Figures 4A, B). A possible explanation is that the strong influence of the wastewater treatment plant, where inputs were relatively uniform and continuous over time (Mueller et al., 2021), could contribute to the increased temporal stability we observed. It is also possible that the mixing in the PW hyporheic zone was more frequent than the flow rate within this channel. In support of the former, we did observe strong clustering between our viral genomes and wastewater treatment viral genomes throughout the timeseries (Figure 2). Our study is consistent with previous research showing surface water microbiomes are not unstable, or intractable (Graham et al., 2017), and could thus be important for the poorly resolved indices of river health and biogeochemistry that currently exist.
Previous reports using non genome-resolved strategies highlight that richness in river PW and sediments are generally higher than those in the SW for bacterial communities (Abia et al., 2018). Contrary to this, our data shows the opposite trends in the Erpe river for both viral and microbial communities (Supplementary Figure 1). One possible explanation could be methodological due to the PW being sampled or assembled less completely as a result of genomic extraction bias caused by fine grain sediments, less sampling volume, or strain level complexity. However, our species area curves did not signify an obvious difference in sampling exhaustion between these compartments (Supplemental Figure 1), leaving open the possibility that this finding may be biological.
A possible biological explanation could be that the effluent of the Münchehofe WWTP is altering viral and microbial community diversity. Our geochemical data showed elevated total nitrogen and soluble reactive phosphorous concentrations, which are commonly reported for WWTP impacted systems (Fox et al., 1989; Effler et al., 2010). However, the role of these WWTP influences on river microbiome diversity are variable, with some studies reporting that WWTPs reduce bacterial diversity and overall nutrient concentrations (Atashgahi et al., 2015; Carles et al., 2022; Xie et al., 2022), and other studies showing increases in diversity resulting from eutrophication (Garnier et al., 1992; Marti and Balcázar, 2014).
Our presented and previously published geochemical data inferred more anoxic conditions in the porewater compared to the surface water (Mueller et al., 2021), while the FTICR-MS data indicated a higher concentration of non-labile, microbially inaccessible carbon in the pore water. Additionally, sediment profiles for our samples ranged from 85.8%-96.6% clay content (Mueller et al., 2021), which may impact groundwater and surface water exchanges, resulting in altered nutrient fluxes to inhibit microbial growth (Newcomer et al., 2016; Huettel et al., 1998). Taken together, it is possible that limited nutrient and carbon accessibility contributes to the decreased microbial and viral diversity observed in the PW compared to the SW.
Viruses have the potential to regulate river biogeochemical cycles by predation and metabolic reprograming of microbial hosts
Although river viral ecology is only recently becoming appreciated, early works suggested that viruses likely play key roles in the structuring of river microbial communities (Peduzzi and Luef, 2009; Peduzzi, 2016). By using a combination of computational methods, we show viruses infect microorganisms that encode a wide array of metabolic functionality critical to river biogeochemistry (e.g., methanogens, denitrifiers, oxygen respirers). In addition to predation, viral auxiliary metabolic genes are recognized across aquatic systems to play key roles in host metabolic reprogramming and can encompass a wide range of processes from photosynthesis to the oxidation of sulfur (Sullivan et al., 2006; Anantharaman et al., 2014). We add to the existing literature and show AMGs in urban river systems may also impact reactions involving nitrogen, carbon, and sulfur cycling. Additionally, one of the vMAGs that was predicted to infect a Patescibacteria genome encoded a ribosomal protein, a finding that has been previously reported in other systems for different bacteria (Mizuno et al., 2019). Candidate phyla radiation (CPR) organisms like Patescibacteria are present in wastewater treatment plants (Wang et al., 2023) and contain non-redundant, small genomes (Tian et al., 2020; Wang et al., 2023). As such, our results of ribosomal AMGs in Patescibacteria-infecting viruses hint at the possibility that viruses may help maintain those small genome sizes by encoding necessary host genes, a concept previously demonstrated for the virus-host dependency of cyanobacterial photosynthesis in oceans (Sullivan et al., 2006).
Other works looking at vMAGs from freshwater lakes and estuaries have shown that some viruses exhibit endemism for certain environments, meaning their distribution is limited to a small geographic area (Ruiz-Perez et al., 2019). This points to an interesting idea that perhaps AMGs may also be tuned to the specific ecological functions of the sampled habitat, and as such that we could expect some degree of endemism in the AMGs. A recent study from an estuary identified significant partitioning of AMG functions between habitat types (water particle and sediment) (Luo et al., 2022). In support of these findings, we identified a subset of unique AMGs within the SW (e.g., flagellar assembly proteins, sugar metabolism) that could potentially be more associated with a lifestyle supported by favorable carbon, and aquatic environments that favor mobility. On the other hand, in the PW we detected AMGs that encoded for plant hemicellulose degradation (Supplementary Table S2), an adaptation that could sustain metabolism in a litter impacted, sediment habitat. However, most AMG functional categories from our dataset were highly similar across compartments suggesting some conservation within River Erpe compartments. As such, it is possible that due to the constant mixing of surface and HZ water in this river, and possibly others, stratification at the genomic potential may be less notable, and expression information may be necessary to capture habitat specific differences. Ultimately, this study highlights how moving forward annotation resolution and expanding reference database(s) are important factors to consider when extrapolating AMG inferences across datasets (Hurwitz and U’Ren, 2016; Shaffer et al., 2020).
In conclusion, our results highlight the power of temporally resolved metagenomics in understanding river microbiome dynamics. Leveraging the community-sequenced dataset of the River Erpe, we provide insights regarding compartment-level microbiome stability and show surface water microbiomes may not be as “untraceable” or “unstable” as previously thought. This stability at a genome-resolved view, suggests microbial content could add to the growing body of indicators for river wellness. Ultimately, this research provides a strong scaffolding foundation for future temporally resolved river studies that couple microbial omics measurements to biogeochemical rates to bridge the gap in understand overall ecosystem functionality.
Data availability statement
The datasets supporting the conclusions of this article are publicly available and collected as part of the Worldwide Hydrobiogeochemistry Observation Network for Dynamic River Systems (WHONDRS) collective sequencing project and are all publicly available on ESS-Dive (Wells et al., 2019). The 125 MAGs are deposited in NCBI BioProject, accession number PRJNA946291, and the 1230 vMAGs have been deposited in NCBI BioProject, under ID SAMN34000891. The 125 MAGs, the 1230 vMAGs, the raw annotations for each genome, and the dataset of freshwater and wastewater viruses we used to cluster to the HUM-V viruses are hosted on Zenodo (https://doi.org/10.5281/zenodo.7709817). All scripts, commands, and input data used for this manuscript are available at https://github.com/jrr-microbio/erpe_river.
Author contributions
JR-R: Conceptualization, Methodology, Validation, Formal analysis, Data curation, Writing - Original Draft, Writing - Review and Editing, Visualization. AO: Conceptualization, Methodology, Writing - Original Draft, Formal analysis, Writing - Review and Editing, MB: Methodology, Software, Writing - Review and Editing. RD: Methodology, Investigation, Writing - Review and Editing. BM: Investigation, Writing - Review and Editing. HS: Investigation, Writing - Review and Editing. JE: Formal analysis, Writing - Review and Editing. RF: Software, Writing - Review and Editing. RAD: Formal analysis, Writing - Review and Editing. LS: Writing - Review and Editing, MS: Software. AG: Conceptualization, Methodology, Supervision, Writing - Review and Editing. JL: Conceptualization, Methodology, Supervision, Writing - Review and Editing. JS: Conceptualization, Methodology, Supervision, Funding acquisition, Writing - Review and Editing. KW: Conceptualization, Methodology, Resources, Writing - Original Draft, Writing - Review and Editing, Supervision, Project administration, Funding acquisition. All authors contributed to the article and approved the submitted version.
Funding
JR-R, AO, MB, RF, RAD, JE, LS, and MS were fully or partially supported by awards to KW, including those from DOE Office of Science, Office of Biological and Environmental Research (BER), grant nos. DE-SC0021350 and DE-SC0023084, as well as the National Science Foundation, grant no. 2149506. A portion of this work was performed by MB, RD, AG, and JS at Pacific Northwest National Laboratory (PNNL) and funded by the U.S. Department of Energy, Office of Science, Office of Biological and Environmental Research, and Environmental System Science (ESS) Program. This contribution originates from the River Corridor Scientific Focus Area (SFA) project at Pacific Northwest National Laboratory (PNNL). PNNL is operated by Battelle Memorial Institute for the U.S. Department of Energy under Contract No. DE-AC05-76RL01830. A subcontract to KW from the River Corridor SFA also supported a portion of this work. Metagenomic sequencing was performed by the University of Colorado Anschutz’s Genomics Shared Resource supported by the Cancer Center Support Grant (P30CA046934).
Acknowledgments
Data used in this manuscript were collected as a part of the WHONDRS 2018 sampling campaign and we thank those that participated in the design and implementation of that effort. Samples were sequenced and processed as a part of the Genome Resolved Open Watersheds (GROW) effort to sequence world rivers. We also thank Tyson Claffey and Richard Wolfe for Colorado State University server management.
Conflict of interest
The authors declare that the research was conducted in the absence of any commercial or financial relationships that could be construed as a potential conflict of interest.
Publisher’s note
All claims expressed in this article are solely those of the authors and do not necessarily represent those of their affiliated organizations, or those of the publisher, the editors and the reviewers. Any product that may be evaluated in this article, or claim that may be made by its manufacturer, is not guaranteed or endorsed by the publisher.
Supplementary material
The Supplementary Material for this article can be found online at: https://www.frontiersin.org/articles/10.3389/frmbi.2023.1199766/full#supplementary-material
References
Abia A. L. K., Alisoltani A., Keshri J., Ubomba-Jaswa E. (2018). Metagenomic analysis of the bacterial communities and their functional profiles in water and sediments of the Apies River, South Africa, as a function of land use. Sci. Total Environ. 616–617, 326–334. doi: 10.1016/j.scitotenv.2017.10.322
Ahlgren N. A., Ren J., Lu Y. Y., Fuhrman J. A., Sun F. (2017). Alignment-free d_2^* oligonucleotide frequency dissimilarity measure improves prediction of hosts from metagenomically-derived viral sequences. Nucleic Acids Res. 45, 39–53. doi: 10.1093/nar/gkw1002
Allen G. H., Pavelsky T. M. (2018). Global extent of rivers and streams. Science 361, 585–588. doi: 10.1126/science.aat0636
Alonso C., Román A., Bejarano M. D., Garcia de Jalon D., Carolli M. (2017). A graphical approach to characterize sub-daily flow regimes and evaluate its alterations due to hydropeaking. Sci. Total Environ. 574, 532–543. doi: 10.1016/j.scitotenv.2016.09.087
Anantharaman K., Duhaime M. B., Breier J. A., Wendt K. A., Toner B. M., Dick G. J. (2014). Sulfur oxidation genes in diverse deep-sea viruses. Science 344, 757–760. doi: 10.1126/science.1252229
Andrews S. FastQC: A quality control analysis tool for high throughput sequencing data. Available at: https://github.com/s-andrews/FastQC (Accessed October 19, 2022).
Atashgahi S., Aydin R., Dimitrov M. R., Sipkema D., Hamonts K., Lahti L., et al. (2015). Impact of a wastewater treatment plant on microbial community composition and function in a hyporheic zone of a Eutrophic river. Sci. Rep. 5, 17284. doi: 10.1038/srep17284
Bar-On Y. M., Phillips R., Milo R. (2018). The biomass distribution on Earth. Proc. Natl. Acad. Sci. U. S. A. 115, 6506–6511. doi: 10.1073/pnas.1711842115
Berg M., Goudeau D., Olmsted C., McMahon K. D., Yitbarek S., Thweatt J. L., et al. (2021). Host population diversity as a driver of viral infection cycle in wild populations of green sulfur bacteria with long standing virus-host interactions. ISME J. 15, 1569–1584. doi: 10.1038/s41396-020-00870-1
Bin Jang H., Bolduc B., Zablocki O., Kuhn J. H., Roux S., Adriaenssens E. M., et al. (2019). Taxonomic assignment of uncultivated prokaryotic virus genomes is enabled by gene-sharing networks. Nat. Biotechnol. 37, 632–639. doi: 10.1038/s41587-019-0100-8
Bowers R. M., Kyrpides N. C., Stepanauskas R., Harmon-Smith M., Doud D., Reddy T. B. K., et al. (2017). Minimum information about a single amplified genome (MISAG) and a metagenome-assembled genome (MIMAG) of bacteria and archaea. Nat. Biotechnol. 35, 725–731. doi: 10.1038/nbt.3893
Brum J. R., Ignacio-Espinoza J. C., Roux S., Doulcier G., Acinas S. G., Alberti A., et al. (2015). Ocean plankton. Patterns and ecological drivers of ocean viral communities. Science 348, 1261498. doi: 10.1126/science.1261498
Bushnell B. (2014) BBMap: A Fast, Accurate, Splice-Aware Aligner (Berkeley, CA (United States: Lawrence Berkeley National Lab. (LBNL). Available at: https://www.osti.gov/servlets/purl/1241166 (Accessed March 23, 2022).
Carles L., Wullschleger S., Joss A., Eggen R. I. L., Schirmer K., Schuwirth N., et al. (2022). Wastewater microorganisms impact microbial diversity and important ecological functions of stream periphyton. Water Res. 225, 119119. doi: 10.1016/j.watres.2022.119119
Chaumeil P.-A., Mussig A. J., Hugenholtz P., Parks D. H. (2019). GTDB-Tk: a toolkit to classify genomes with the Genome Taxonomy Database. Bioinformatics. doi: 10.1093/bioinformatics/btz848
Chow C.-E. T., Fuhrman J. A. (2012). Seasonality and monthly dynamics of marine myovirus communities. Environ. Microbiol. 14, 2171–2183. doi: 10.1111/j.1462-2920.2012.02744.x
Chow C.-E. T., Suttle C. A. (2015). Biogeography of viruses in the sea. Annu. Rev. Virol. 2, 41–66. doi: 10.1146/annurev-virology-031413-085540
Chu H., Gao G.-F., Ma Y., Fan K., Delgado-Baquerizo M. (2020). Soil microbial biogeography in a changing world: recent advances and future perspectives. mSystems 5. doi: 10.1128/mSystems.00803-19
Chung D., Chun H., Keles S. (2012). Spls: sparse partial least squares (SPLS) regression and classification. R package version 2, 1–1. doi: 10.1111/j.1467-9868.2009.00723.x
Cissoko M., Desnues A., Bouvy M., Sime-Ngando T., Verling E., Bettarel Y. (2008). Effects of freshwater and seawater mixing on virio- and bacterioplankton in a tropical estuary. Freshw. Biol. 53, 1154–1162. doi: 10.1111/j.1365-2427.2007.01930.x
Coenen A. R., Hu S. K., Luo E., Muratore D., Weitz J. S. (2020). A primer for microbiome time-series analysis. Front. Genet. 11, 310. doi: 10.3389/fgene.2020.00310
Corinaldesi C., Dell’Anno A., Magagnini M., Danovaro R. (2010). Viral decay and viral production rates in continental-shelf and deep-sea sediments of the Mediterranean Sea. FEMS Microbiol. Ecol. 72, 208–218. doi: 10.1111/j.1574-6941.2010.00840.x
Effler S. W., O’Donnel S. M., Prestigiacomo A. R., O’Donnell D. M., Gelda R. K., Matthews D. A. (2010). The effect of municipal wastewater effluent on nitrogen levels in Onondaga Lake, a 36-year record. Water Environ. Res. 82, 3–19. doi: 10.2175/106143009X407384
Elbehery A. H. A., Deng L. (2022). Insights into the global freshwater virome. Front. Microbiol. 13, 953500. doi: 10.3389/fmicb.2022.953500
Erbilgin O., Bowen B. P., Kosina S. M., Jenkins S., Lau R. K., Northen T. R. (2017). Dynamic substrate preferences predict metabolic properties of a simple microbial consortium. BMC Bioinf. 18, 57. doi: 10.1186/s12859-017-1478-2
Fox I., Malati M. A., Perry R. (1989). The adsorption and release of phosphate from sediments of a river receiving sewage effluent. Water Res. 23, 725–732. doi: 10.1016/0043-1354(89)90206-6
Friedlingstein P., Jones M. W., O’Sullivan M., Andrew R. M., Bakker D. C. E., Hauck J., et al. (2022). Global carbon budget 2021. Earth Syst. Sci. Data 14, 1917–2005. doi: 10.5194/essd-14-1917-2022
Garnier J., Servais P., Billen G. (1992). Bacterioplankton in the Seine River (France): impact of the Parisian urban effluent. Can. J. Microbiol. 38, 56–64. doi: 10.1139/m92-009
Gibson B., Wilson D. J., Feil E., Eyre-Walker A. (2018). The distribution of bacterial doubling times in the wild. Proc. Biol. Sci. 285. doi: 10.1098/rspb.2018.0789
Graham E. B., Crump A. R., Resch C. T., Fansler S., Arntzen E., Kennedy D. W., et al. (2017). Deterministic influences exceed dispersal effects on hydrologically-connected microbiomes. Environ. Microbiol. 19, 1552–1567. doi: 10.1111/1462-2920.13720
Guidi L., Chaffron S., Bittner L., Eveillard D., Larhlimi A., Roux S., et al. (2016). Plankton networks driving carbon export in the oligotrophic ocean. Nature 532, 465–470. doi: 10.1038/nature16942
Guo J., Bolduc B., Zayed A. A., Varsani A., Dominguez-Huerta G., Delmont T. O., et al. (2021a). VirSorter2: a multi-classifier, expert-guided approach to detect diverse DNA and RNA viruses. Microbiome 9, 37. doi: 10.1186/s40168-020-00990-y
Guo J., Vik D., Pratama A. A., Roux S., Sullivan M. (2021b) Viral sequence identification SOP with VirSorter2. protocols.io. Available at: https://www.protocols.io/view/viral-sequence-identification-sop-with-virsorter2-5qpvoyqebg4o/v3 (Accessed July 5, 2022).
He A., Rosazza J. P. N. (2003). GTP cyclohydrolase I: purification, characterization, and effects of inhibition on nitric oxide synthase in nocardia species. Appl. Environ. Microbiol. 69, 7507–7513. doi: 10.1128/AEM.69.12.7507-7513.2003
Hendrix R. W., Smith M. C. M., Neil Burns R., Ford M. E., Hatfull G. F. (1999). Evolutionary relationships among diverse bacteriophages and prophages: All the world’s a phage. Proc. Natl. Acad. Sci. U. S. A. 96, 2192–2197. doi: 10.1073/pnas.96.5.2192
Hewson I., O’Neil J. M., Fuhrman J. A., Dennison W. C. (2001). Virus-like particle distribution and abundance in sediments and overlying waters along eutrophication gradients in two subtropical estuaries. Limnol. Oceanogr. 46, 1734–1746. doi: 10.4319/lo.2001.46.7.1734
Holmfeldt K., Nilsson E., Simone D., Lopez-Fernandez M., Wu X., de Bruijn I., et al. (2021). The Fennoscandian Shield deep terrestrial virosphere suggests slow motion “boom and burst”. cycles. Commun. Biol. 4, 307. doi: 10.1038/s42003-021-01810-1
Hou Z., Nelson W. C., Stegen J. C., Murray C. J., Arntzen E., Crump A. R., et al. (2017). Geochemical and microbial community attributes in relation to hyporheic zone geological facies. Sci. Rep. 7, 12006. doi: 10.1038/s41598-017-12275-w
Huettel M., Ziebis Forster Luther. W. S.G.W. (1998). Advective transport affecting metal and nutrient distributions and interfacial fluxes in permeable sediments. Geochimica et Cosmochimica Acta 62 (4), 613–31. doi: 10.1038/s41598-017-12275-w
Hurwitz B. L., U’Ren J. M. (2016). Viral metabolic reprogramming in marine ecosystems. Curr. Opin. Microbiol. 31, 161–168. doi: 10.1016/j.mib.2016.04.002
Joshi NA F. J. N. (2011) Sickle: A sliding-window, adaptive, quality-based trimming tool for FastQ files. Available at: https://github.com/najoshi/sickle (Accessed October 29, 2020).
Kaevska M., Videnska P., Sedlar K., Slana I. (2016). Seasonal changes in microbial community composition in river water studied using 454-pyrosequencing. Springerplus 5, 409. doi: 10.1186/s40064-016-2043-6
Kang D., Li F., Kirton E. S., Thomas A., Egan R. S., An H., et al. (2019). MetaBAT 2: an adaptive binning algorithm for robust and efficient genome reconstruction from metagenome assemblies. PeerJ 7, e7359. doi: 10.7717/peerj.7359
Kelley L. A., Mezulis S., Yates C. M., Wass M. N., Sternberg M. J. E. (2015). The Phyre2 web portal for protein modeling, prediction and analysis. Nat. Protoc. 10, 845–858. doi: 10.1038/nprot.2015.053
Kim S., Kramer R. W., Hatcher P. G. (2003). Graphical method for analysis of ultrahigh-resolution broadband mass spectra of natural organic matter, the van Krevelen diagram. Anal. Chem. 75, 5336–5344. doi: 10.1021/ac034415p
Lammers W. T. (1992). “Stimulation of Bacterial Cytokinesis by Bacteriophage Predation,” Hydrobiologia 235(1), 261–65.
Langfelder P., Horvath S. (2008). WGCNA: an R package for weighted correlation network analysis. BMC Bioinf. 9, 559. doi: 10.1186/1471-2105-9-559
Langmead B., Salzberg S. L. (2012). Fast gapped-read alignment with Bowtie 2. Nat. Methods 9, 357–359. doi: 10.1038/nmeth.1923
Lewandowski J., Putschew A., Schwesig D., Neumann C., Radke M. (2011). Fate of organic micropollutants in the hyporheic zone of a eutrophic lowland stream: results of a preliminary field study. Sci. Total Environ. 409, 1824–1835. doi: 10.1016/j.scitotenv.2011.01.028
Li D., Liu C.-M., Luo R., Sadakane K., Lam T.-W. (2015). MEGAHIT: an ultra-fast single-node solution for large and complex metagenomics assembly via succinct de Bruijn graph. Bioinformatics 31, 1674–1676. doi: 10.1093/bioinformatics/btv033
Liu S., Kuhn C., Amatulli G., Aho K., Butman D. E., Allen G. H., et al. (2022). The importance of hydrology in routing terrestrial carbon to the atmosphere via global streams and rivers. Proc. Natl. Acad. Sci. U. S. A. 119, e2106322119. doi: 10.1073/pnas.2106322119
Lu Q., Mao J., Xia H., Song S., Chen W., Zhao D. (2022). Effect of wastewater treatment plant discharge on the bacterial community in a receiving river. Ecotoxicol. Environ. Saf. 239, 113641. doi: 10.1016/j.ecoenv.2022.113641
Lundquist J. D., Cayan D. R. (2002). Seasonal and spatial patterns in diurnal cycles in streamflow in the western United States. J. Hydrometeorol. 3, 591–603. doi: 10.1175/1525-7541(2002)003<0591:SASPID>2.0.CO;2
Luo X.-Q., Wang P., Li J.-L., Ahmad M., Duan L., Yin L.-Z., et al. (2022). Viral community-wide auxiliary metabolic genes differ by lifestyles, habitats, and hosts. Microbiome 10, 190. doi: 10.1186/s40168-022-01384-y
Luo X., Xiang X., Huang G., Song X., Wang P., Yang Y., et al. (2020). Bacterial community structure upstream and downstream of cascade dams along the Lancang River in southwestern China. Environ. Sci. pollut. Res. Int. 27, 42933–42947. doi: 10.1007/s11356-020-10159-7
Malki K., Sawaya N. A., Tisza M. J., Coutinho F. H., Rosario K., Székely A. J., et al. (2021). Spatial and temporal dynamics of prokaryotic and viral community assemblages in a lotic system (Manatee springs, Florida). Appl. Environ. Microbiol. 87, e0064621. doi: 10.1128/AEM.00646-21
Marti E., Balcázar J. L. (2014). Use of pyrosequencing to explore the benthic bacterial community structure in a river impacted by wastewater treatment plant discharges. Res. Microbiol. 165, 468–471. doi: 10.1016/j.resmic.2014.04.002
Mauri M., Elli T., Caviglia G., Uboldi G., Azzi M. (2017). “RAWGraphs: A visualisation platform to create open outputs,” in Proceedings of the 12th Biannual Conference on Italian SIGCHI Chapter CHItaly ‘17 (New York, NY, USA: Association for Computing Machinery), 1–5.
Metagenome Assembly Workflow (v1.0.1), NMDC Workflows 0.2a documentation. Available at: https://nmdc-workflow-documentation.readthedocs.io/en/latest/chapters/3_MetaGAssemly_index.html (Accessed October 19, 2022).
Mizuno C. M., Guyomar C., Roux S., Lavigne R., Rodriguez-Valera F., Sullivan M. B., et al. (2019). Numerous cultivated and uncultivated viruses encode ribosomal proteins. Nat. Commun. 10, 752. doi: 10.1038/s41467-019-08672-6
Mueller B. M., Schulz H., Danczak R. E., Putschew A., Lewandowski J. (2021). Simultaneous attenuation of trace organics and change in organic matter composition in the hyporheic zone of urban streams. Sci. Rep. 11, 4179. doi: 10.1038/s41598-021-83750-8
Munn C. B. (2006). Viruses as pathogens of marine organisms—from bacteria to whales. J. Mar. Biol. Assoc. U. K. 86, 453–467. doi: 10.1017/S002531540601335X
Mushegian A. R. (2020). Are there 1031 virus particles on earth, or more, or fewer? J. Bacteriol. 202. doi: 10.1128/JB.00052-20
Naegeli M. W., Uehlinger U. (1997). Contribution of the hyporheic zone to ecosystem metabolism in a prealpine gravel-bed-river. J. North Am. Benthol. Soc 16, 794–804. doi: 10.2307/1468172
Nelson A. R., Sawyer A. H., Gabor R. S., Saup C. M., Bryant S. R., Harris K. D., et al. (2019). Heterogeneity in hyporheic flow, pore water chemistry, and microbial community composition in an alpine streambed. J. Geophys. Res. Biogeosci. 124, 3465–3478. doi: 10.1029/2019JG005226
Newcomer M. E., Hubbard S. S., Fleckenstein J. H., Maier U., Schmidt C., Thullner M., et al. (2016). Simulating bioclogging effects on dynamic riverbed permeability and infiltration. Water Resour. Res. 52, 2883–2900. doi: 10.1002/2015WR018351
Oksanen J., Blanchet F. G., Friendly M., Kindt R., Legendre P., McGlinn D., et al. (2016). vegan: Community Ecology Package. R package version 2.4-3 (Vienna: R Foundation for Statistical Computing).
Olm M. R., Brown C. T., Brooks B., Banfield J. F. (2017). dRep: a tool for fast and accurate genomic comparisons that enables improved genome recovery from metagenomes through de-replication. ISME J. 11, 2864–2868. doi: 10.1038/ismej.2017.126
Parks D. H., Imelfort M., Skennerton C. T., Hugenholtz P., Tyson G. W. (2015). CheckM: assessing the quality of microbial genomes recovered from isolates, single cells, and metagenomes. Genome Res. 25, 1043–1055. doi: 10.1101/gr.186072.114
Peduzzi P. (2016). Virus ecology of fluvial systems: a blank spot on the map? Biol. Rev. Camb. Philos. Soc 91, 937–949. doi: 10.1111/brv.12202
Peduzzi P., Luef B. (2008). Viruses, bacteria and suspended particles in a backwater and main channel site of the Danube (Austria). Aquat. Sci. 70, 186–194. doi: 10.1007/s00027-008-8068-3
Peduzzi P., Luef B. (2009). “Viruses,” in Encyclopedia of Inland Waters. Ed. Likens G. E. (Oxford: Academic Press), 279–294.
Peng Y., Leung H. C. M., Yiu S. M., Chin F. Y. L. (2012). IDBA-UD: a de novo assembler for single-cell and metagenomic sequencing data with highly uneven depth. Bioinformatics 28, 1420–1428. doi: 10.1093/bioinformatics/bts174
Pusch M. T., Schwoerbel J. (1994) Community respiration in hyporheic sediments of a mountain stream (Steina, Black Forest). Available at: https://www.semanticscholar.org/paper/42cf63746d7d54d34807e2e7eaa9c6a5c19ce17e (Accessed January 13, 2020).
Rawlings N. D., Barrett A. J., Thomas P. D., Huang X., Bateman A., Finn R. D. (2018). The MEROPS database of proteolytic enzymes, their substrates and inhibitors in 2017 and a comparison with peptidases in the PANTHER database. Nucleic Acids Res. 46, D624–D632. doi: 10.1093/nar/gkx1134
R Core Team (2018). A Language and Environment for Statistical Computing (Vienna: R Foundation for Statistical Computing). Available at: https://www.R-project.org.
Robinson M. D., Oshlack A. (2010). A scaling normalization method for differential expression analysis of RNA-seq data. Genome Biol. 11, R25. doi: 10.1186/gb-2010-11-3-r25
Rodríguez-Ramos J. A., Borton M. A., McGivern B. B., Smith G. J., Solden L. M., Shaffer M., et al. (2022). Genome-resolved metaproteomics decodes the microbial and viral contributions to coupled carbon and nitrogen cycling in river sediments. mSystems 7, e0051622. doi: 10.1128/msystems.00516-22
Rosentreter J. A., Borges A. V., Deemer B. R., Holgerson M. A., Liu S., Song C., et al. (2021). Half of global methane emissions come from highly variable aquatic ecosystem sources. Nat. Geosci. 14, 225–230. doi: 10.1038/s41561-021-00715-2
Roux S., Adriaenssens E. M., Dutilh B. E., Koonin E. V., Kropinski A. M., Krupovic M., et al. (2018). Minimum information about an uncultivated virus genome (MIUViG). Nat. Biotechnol. doi: 10.1038/nbt.4306
Roux S., Chan L.-K., Egan R., Malmstrom R. R., McMahon K. D., Sullivan M. B. (2017). Ecogenomics of virophages and their giant virus hosts assessed through time series metagenomics. Nat. Commun. 8, 858. doi: 10.1038/s41467-017-01086-2
Rowe J. M., DeBruyn J. M., Poorvin L., LeCleir G. R., Johnson Z. I., Zinser E. R., et al. (2012). Viral and bacterial abundance and production in the Western Pacific Ocean and the relation to other oceanic realms. FEMS Microbiol. Ecol. 79, 359–370. doi: 10.1111/j.1574-6941.2011.01223.x
Ruiz-Perez C. A., Tsementzi D., Hatt J. K., Sullivan M. B., Konstantinidis K. T. (2019). Prevalence of viral photosynthesis genes along a freshwater to saltwater transect in Southeast USA. Environ. Microbiol. Rep. 11, 672–689. doi: 10.1111/1758-2229.12780
Shaffer M., Borton M. A., McGivern B. B., Zayed A. A., La Rosa S. L., Solden L. M., et al. (2020). DRAM for distilling microbial metabolism to automate the curation of microbiome function. Nucleic Acids Res. 48, 8883–8900. doi: 10.1093/nar/gkaa621
Shen W., Le S., Li Y., Hu F. (2016). SeqKit: A cross-platform and ultrafast toolkit for FASTA/Q file manipulation. PloS One 11, e0163962. doi: 10.1371/journal.pone.0163962
Shi L.-D., Dong X., Liu Z., Yang Y., Lin J.-G., Li M., et al. (2022). A mixed blessing of viruses in wastewater treatment plants. Water Res. 215, 118237. doi: 10.1016/j.watres.2022.118237
Skennerton C. T., Imelfort M., Tyson G. W. (2013). Crass: identification and reconstruction of CRISPR from unassembled metagenomic data. Nucleic Acids Res. 41, e105. doi: 10.1093/nar/gkt183
Stegen J. C., Goldman A. E. (2018). WHONDRS: a community resource for studying dynamic river corridors. mSystems 3. doi: 10.1128/mSystems.00151-18
Sullivan M. B., Lindell D., Lee J. A., Thompson L. R., Bielawski J. P., Chisholm S. W. (2006). Prevalence and evolution of core photosystem II genes in marine cyanobacterial viruses and their hosts. PloS Biol. 4, e234. doi: 10.1371/journal.pbio.0040234
Suttle C. A. (2007). Marine viruses–major players in the global ecosystem. Nat. Rev. Microbiol. 5, 801–812. doi: 10.1038/nrmicro1750
Tian R., Ning D., He Z., Zhang P., Spencer S. J., Gao S., et al. (2020). Small and mighty: adaptation of superphylum Patescibacteria to groundwater environment drives their genome simplicity. Microbiome 8, 51. doi: 10.1186/s40168-020-00825-w
Tolić N., Liu Y., Liyu A., Shen Y., Tfaily M. M., Kujawinski E. B., et al. (2017). Formularity: software for automated formula assignment of natural and other organic matter from ultrahigh-resolution mass spectra. Anal. Chem. 89, 12659–12665. doi: 10.1021/acs.analchem.7b03318
Tomalski P., Tomaszewski E., Wrzesiński D., Sobkowiak L. (2021). Relationships of hydrological seasons in rivers and groundwaters in selected catchments in Poland. Water 13, 250. doi: 10.3390/w13030250
Trubl G., Kimbrel J. A., Liquet-Gonzalez J., Nuccio E. E., Weber P. K., Pett-Ridge J., et al. (2021). Active virus-host interactions at sub-freezing temperatures in Arctic peat soil. Microbiome 9, 208. doi: 10.1186/s40168-021-01154-2
Villa J. A., Smith G. J., Ju Y., Renteria L., Angle J. C., Arntzen E., et al. (2020). Methane and nitrous oxide porewater concentrations and surface fluxes of a regulated river. Sci. Total Environ. 715, 136920. doi: 10.1016/j.scitotenv.2020.136920
Vincent F., Vardi A. (2023). Viral infection in the ocean-A journey across scales. PloS Biol. 21, e3001966. doi: 10.1371/journal.pbio.3001966
Wang J., Atolia E., Hua B., Savir Y., Escalante-Chong R., Springer M. (2015). Natural variation in preparation for nutrient depletion reveals a cost-benefit tradeoff. PloS Biol. 13, e1002041. doi: 10.1371/journal.pbio.1002041
Wang J., Fan H., He X., Zhang F., Xiao J., Yan Z., et al. (2021). Response of bacterial communities to variation in water quality and physicochemical conditions in a river-reservoir system. Global Ecol. Conserv. 27, e01541. doi: 10.1016/j.gecco.2021.e01541
Wang Y., Zhang Y., Hu Y., Liu L., Liu S.-J., Zhang T. (2023). Genome-centric metagenomics reveals the host-driven dynamics and ecological role of CPR bacteria in an activated sludge system. Microbiome 11, 56. doi: 10.1186/s40168-023-01494-1
Weinbauer M. G. (2004). Ecology of prokaryotic viruses. FEMS Microbiol. Rev. 28, 127–181. doi: 10.1016/j.femsre.2003.08.001
Weinbauer M. G., Rassoulzadegan F. (2004). Are viruses driving microbial diversification and diversity? Environ. Microbiol. 6, 1–11. doi: 10.1046/j.1462-2920.2003.00539.x
Wells J. R., Goldman A. E., Chu R. K., Danczak R. E., Garayburu-Caruso V. A., Graham E. B., et al. (2019). WHONDRS 48 hour diel cycling study at the Erpe river, Germany. doi: 10.15485/1577260
Xie Y., Liu X., Wei H., Chen X., Gong N., Ahmad S., et al. (2022). Insight into impact of sewage discharge on microbial dynamics and pathogenicity in river ecosystem. Sci. Rep. 12, 6894. doi: 10.1038/s41598-022-09579-x
Keywords: phage, time-series, auxiliary metabolic genes, hyporheic zone, genome, biogeochemistry, stability, biogeography
Citation: Rodríguez-Ramos J, Oliverio A, Borton MA, Danczak R, Mueller BM, Schulz H, Ellenbogen J, Flynn RM, Daly RA, Schopflin L, Shaffer M, Goldman A, Lewandowski J, Stegen JC and Wrighton KC (2023) Spatial and temporal metagenomics of river compartments reveals viral community dynamics in an urban impacted stream. Front. Microbiomes 2:1199766. doi: 10.3389/frmbi.2023.1199766
Received: 04 April 2023; Accepted: 14 July 2023;
Published: 09 August 2023.
Edited by:
Jun Zhao, Nanjing Normal University, ChinaReviewed by:
Neslihan Taş, Berkeley Lab (DOE), United StatesMinglei Ren, Chinese Academy of Sciences (CAS), China
Copyright © 2023 Rodríguez-Ramos, Oliverio, Borton, Danczak, Mueller, Schulz, Ellenbogen, Flynn, Daly, Schopflin, Shaffer, Goldman, Lewandowski, Stegen and Wrighton. This is an open-access article distributed under the terms of the Creative Commons Attribution License (CC BY). The use, distribution or reproduction in other forums is permitted, provided the original author(s) and the copyright owner(s) are credited and that the original publication in this journal is cited, in accordance with accepted academic practice. No use, distribution or reproduction is permitted which does not comply with these terms.
*Correspondence: Kelly C. Wrighton, kelly.wrighton@colostate.edu