Identifying spatial movements and residency of pelagic thresher sharks (Alopias pelagicus) using satellite and passive acoustic telemetry to inform local conservation in central Indonesia
 Rafid A. Shidqi1,2,3*
  Mark V. Erdmann4
  Edy Setyawan5
  Nerea Lezama-Ochoa6
  Dewi R. Sari2
  Abraham B. Sianipar7
  Joshua D. Stewart8
  Donald A. Croll1,9
- 1Coastal Science and Policy Program, University of California, Santa Cruz, Santa Cruz, CA, United States
- 2Thresher Shark Indonesia, Kalabahi, East Nusa Tenggara, Indonesia
- 3Nicholas School of the Environment, Duke University, Durham, NC, United States
- 4Conservation International Aotearoa, The University of Auckland, Auckland, New Zealand
- 5Institute of Marine Science, The University of Auckland, Auckland, New Zealand
- 6Institute of Marine Sciences, University of California, Santa Cruz, Santa Cruz, CA, United States
- 7School of Veterinary and Life Sciences, Murdoch University, Perth, WA, Australia
- 8Ocean Ecology Lab, Marine Mammal Institute, Department of Fisheries, Wildlife and Conservation Sciences, Hatfield Marine Science Center, Oregon State University, Newport, OR, United States
- 9Department of Ecology and Evolutionary Biology, University of California, Santa Cruz, Santa Cruz, CA, United States
The pelagic thresher shark (Alopias pelagicus) is globally endangered, threatened by bycatch, and targeted in industrial and artisanal fisheries in Indonesia. However, a lack of information about their ecology, particularly movement and habitat use, hinders the development of science-based conservation measures to protect the species. Here, we report our research, which is the first to use a combination of satellite and passive acoustic telemetry to investigate the movement and residency of the pelagic thresher shark within Indonesia's waters, especially in areas impacted by local fisheries. A total of 24 sharks were tagged with archival satellite tags (n = 9), internal acoustic tags (n = 10), and both tags (n = 5) in Selat Pantar Marine Protected Area (MPA). The tagged sharks, dominated by females (71%) ranged in size from 125–180 cm FL (mean ± SD: 161 ± 13). Seven of the fifteen acoustically tagged sharks were detected by the receivers, while twelve of the fourteen satellite tags reported data. The satellite tags stayed attached for 81–181 days, and the acoustic tag detection periods ranged from 44–175 days. Horizontally, we found the satellite-tagged sharks moved broadly, mainly offshore, approximately 90 km from tagging locations. They moved to areas between Banda, Flores, and Savu Sea regions, where unregulated and unreported longline and gillnet fisheries are known to operate. Meanwhile, the acoustically tagged sharks showed distinct diel patterns around the Selat Pantar MPA's coastal waters, indicating potential philopatric behavior. Vertically, the sharks spent significantly (p < 0.001) more time in deeper water during the day and moved to shallower water at night. The deepest dive recorded was 1,889.5 m, which is the deepest ever recorded from the species. Our results suggest that area-based protection can be an effective nearshore conservation tool as individuals appear to remain in relatively restricted areas within Selat Pantar MPA for extended periods. However, fisheries regulation aimed at restricting illegal longline and gillnet fishing is also necessary to protect sharks when they move offshore. Our findings have been communicated to the relevant governments, resulting in increased political will and new legislation to protect them within the Selat Pantar MPA and connected waters of East Nusa Tenggara.
1 Introduction
Indonesia is one of the largest shark fishing nations globally, with more than 100,000 tons of sharks landed over the past 20 years (1). Sharks are high-value fisheries targets, making them an essential source of income and protein for many coastal communities across the archipelago (2, 3). In addition, the high value of shark fins in international markets is a significant driver of Indonesian shark fishing activities (4, 5), resulting in high fishing pressures and significant declines in many shark populations in Indonesia (6, 7). Unfortunately, the conservation and management of sharks in this region remain challenging due to unregulated small-scale fisheries, illegal fishing activities, and insufficient control and monitoring (8, 9).
Conservation remains challenging for wide-ranging migratory shark species, such as pelagic threshers, as they are exposed to various impacts throughout their life stages (10). Effective conservation and management action depends on adequate knowledge of a species' habitat use, distribution, and movement patterns (11, 12). Most data on pelagic threshers' life history is based primarily upon specimens from capture fisheries, with limited studies on age and growth, reproductive characteristics, demographic analyses, and large- and small-scale movement patterns (13–16). These knowledge gaps and information on spatial overlap with key threats hinder science-based management and conservation of the species.
The pelagic thresher shark (herein “pelagic threshers”) (Alopias pelagicus) is listed globally as Endangered by the International Union for Conservation of Nature (IUCN), with a decreasing population trend within the Indian Ocean (17). The species is epipelagic and wide-ranging, predominantly found offshore over deep water in the tropical and subtropical waters of the Indo-Pacific (16). In Indonesia, observations of this species have been recorded in the Indian Ocean, from West Sumatera to the south in Nusa Tenggara, the South China Sea, Pacific Ocean, Makassar Strait, Sulawesi Sea, Banda Sea, and the Arafura Sea (18) where they are targeted for their meat and valuable fins (19).
The pelagic threshers population in Indonesia is subject to target capture by nearshore small-scale fisheries and bycatch in offshore large-scale tuna and swordfish longline, gill net, and purse seine fisheries (16, 20). As a result, populations are estimated to have declined by more than 83% over the past two decades, evidenced by decreasing catch and reduced sizes of captured individuals (15, 21). To address offshore capture, the Indian Ocean Tuna Commission (IOTC) prohibited the retention on board, transshipping, landing, storing, and selling of pelagic threshers through IOTC Resolution 12/09 (5).
Nearshore, pelagic threshers have been documented as targets for small-scale fishing communities from the Alor archipelago in East Nusa Tenggara, Indonesia, in a traditional fishery that has operated for over 50 years (22) (Figure 1). A recent study documented that 80% of the catches in this fishery consist of pregnant females, indicating this region may serve as a potential pupping ground (22). While the area has been declared a Marine Protected Area (Selat Pantar MPA) (Ministerial Decree No. 35/2015), its primary purpose is to protect shallow coral reef habitats and regulate local fisheries and tourism activities. Its potential importance in conserving threatened and charismatic species, such as pelagic threshers, was not considered in the designation of the MPA boundaries and zoning system. Consequently, the efficacy of MPAs in protecting mobile and vulnerable species such as pelagic threshers may be limited (23, 24).
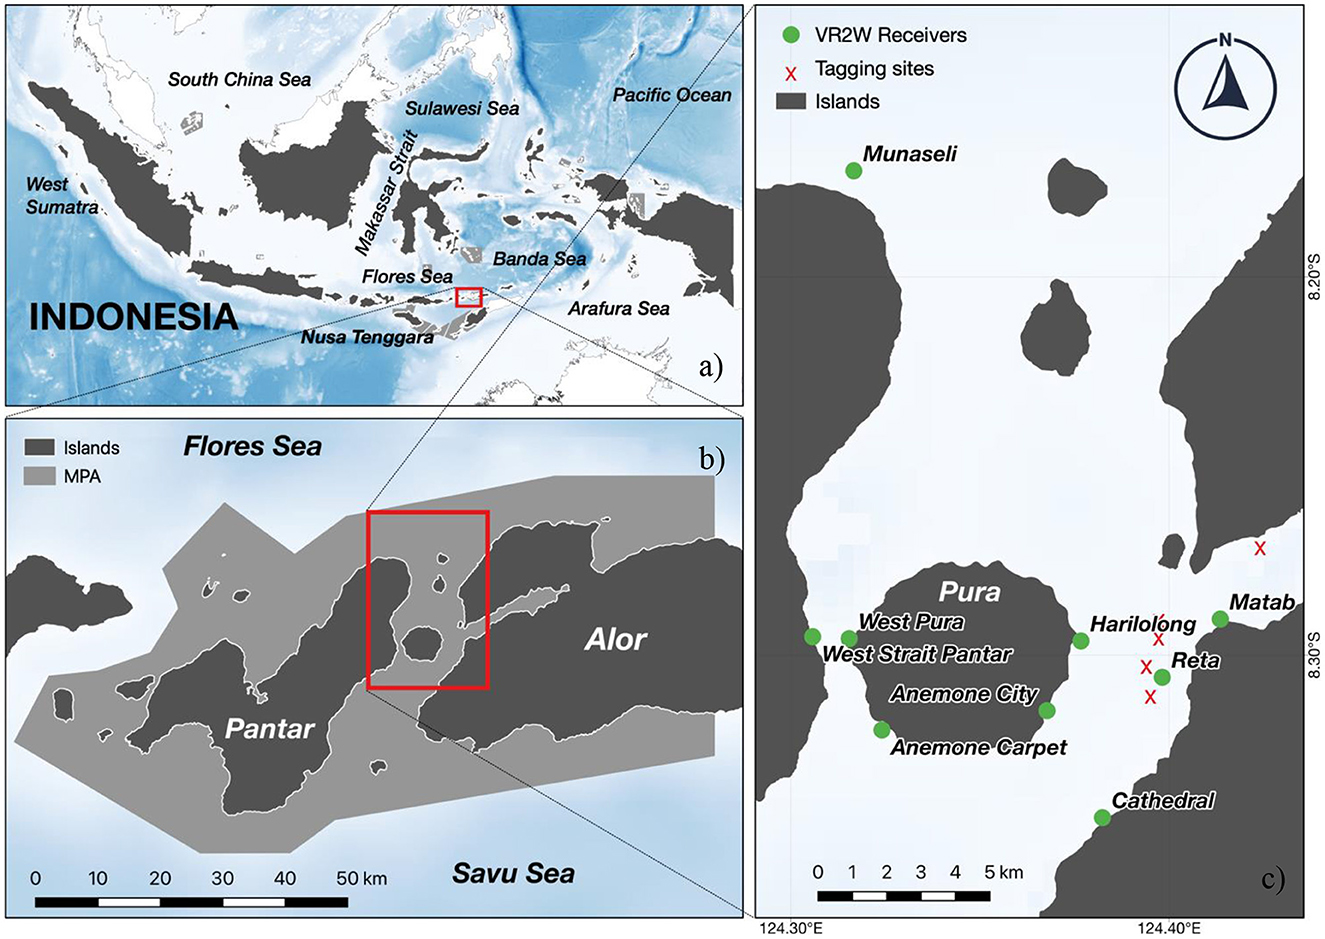
Figure 1. The study area is in Alor Island of Central Indonesia (A), more specifically, the Selat Pantar MPA area (B). The inset map highlights the boundaries of the Selat Pantar MPA (B, light gray area) and its location in the Alor Regency. Red dots represent VR2W acoustic receiver locations, while yellow dots represent the tagging locations of A. pelagicus for acoustic and satellite tags (C).
This study aims to advance our understanding of the movements and behaviors of pelagic threshers in the Alor region (East Nusa Tenggara, central Indonesia) and identify potential conservation opportunities for this region and Indonesia more broadly. We combined satellite and passive acoustic telemetry data to fill several knowledge gaps in the spatial movement ecology of pelagic threshers, including (1) large-scale spatial movement patterns, (2) fine-scale temporal and spatial movement patterns, and (3) pelagic threshers' potential conservation opportunities. Understanding spatial use patterns can inform management actions by evaluating the importance of specific sites or locations to a species' life history and ecology (25). Our research in Alor region is an essential first step to informing conservation measures and evaluating the potential for established MPAs like Selat Pantar MPA to reduce fishing pressures on the populations of pelagic threshers in Indonesia.
2 Materials and methods
2.1 Study area
Field research activities were conducted within the Selat Pantar MPA, located in the Alor Regency, East Nusa Tenggara Province, Indonesia (Figure 1). The Alor Regency is an archipelagic region comprising 15 islands with nine inhabited islands. The largest human population is located on the Alor Island. The regency's marine ecosystem hosts over 31 hard coral genera and reefs with relatively high coral cover (26). The site is also oceanographically distinctive, with regular upwelling (June–August) during the southeast monsoon (27). Cold, nutrient-rich water from the upwelling drives high chlorophyll-a concentrations, making the area highly productive (28). Alor Regency sits between the Savu Sea to the South and the Banda Sea to the North. The waters were declared protected under the Selat Pantar MPA, one of the MPA networks within the East Nusa Tenggara Province that encompasses more than 277,000 ha of protected waters (29–31).
2.2 Data collection
2.2.1 Shark capture and handling
Each pelagic thresher was captured with the assistance of Alor shark fishers using traditional deep-fishing techniques. The high pelagic threshers catch rate by local fishers in Alor allowed us to handle the sharks and deploy tags. The fishing areas were in the Selat Pantar MPA between Pura Island and Kalabahi Bay (Figure 1) (8.3042 °S, 124.3854 °E). Fishers captured pelagic threshers using custom fishing gear consisting of 5–6 hooks decorated with sparkling strings and chicken feathers on lines 200–300 m deep anchored with rocks wrapped in dried coconut leaves (22). Thresher sharks hunt using their elongated caudal fin to stun prey (32), a behavior that has been well known to local shark fishers in Alor to result in foul-hooking of a pelagic thresher's caudal fin when it attempts to stun the hooks baited with traditional visual lures. Once sharks were captured, fishers removed the hooks from the tail, and a team of free divers transported the shark to the side of the research vessel, keeping the shark submerged. Sharks were immobilized alongside the vessel using two belts around the back of the pectoral and caudal fins and positioned upside down to induce tonic immobility (33). Immobilized sharks were measured for fork length (FL) using a meter tape, and sex was visually determined (e.g., presence or absence of claspers) (34). Following the measurements, each shark was tagged using a satellite tag, acoustic transmitter, or both while still in the tonic position. Animal tagging was conducted under UC Santa Cruz Institutional Animal Care and Use Committee Protocol Crold2006_r1.
2.2.2 Satellite tag and acoustic transmitter deployments
Satellite tagging was initially conducted in September 2018 and May 2019 (Table 1). Subsequently, we conducted satellite and acoustic tagging in September-November 2020 and March 2021. These months were chosen to provide tracking data during and after the Alor shark fishing season, generally from February through September, with peaks in March and April (22).
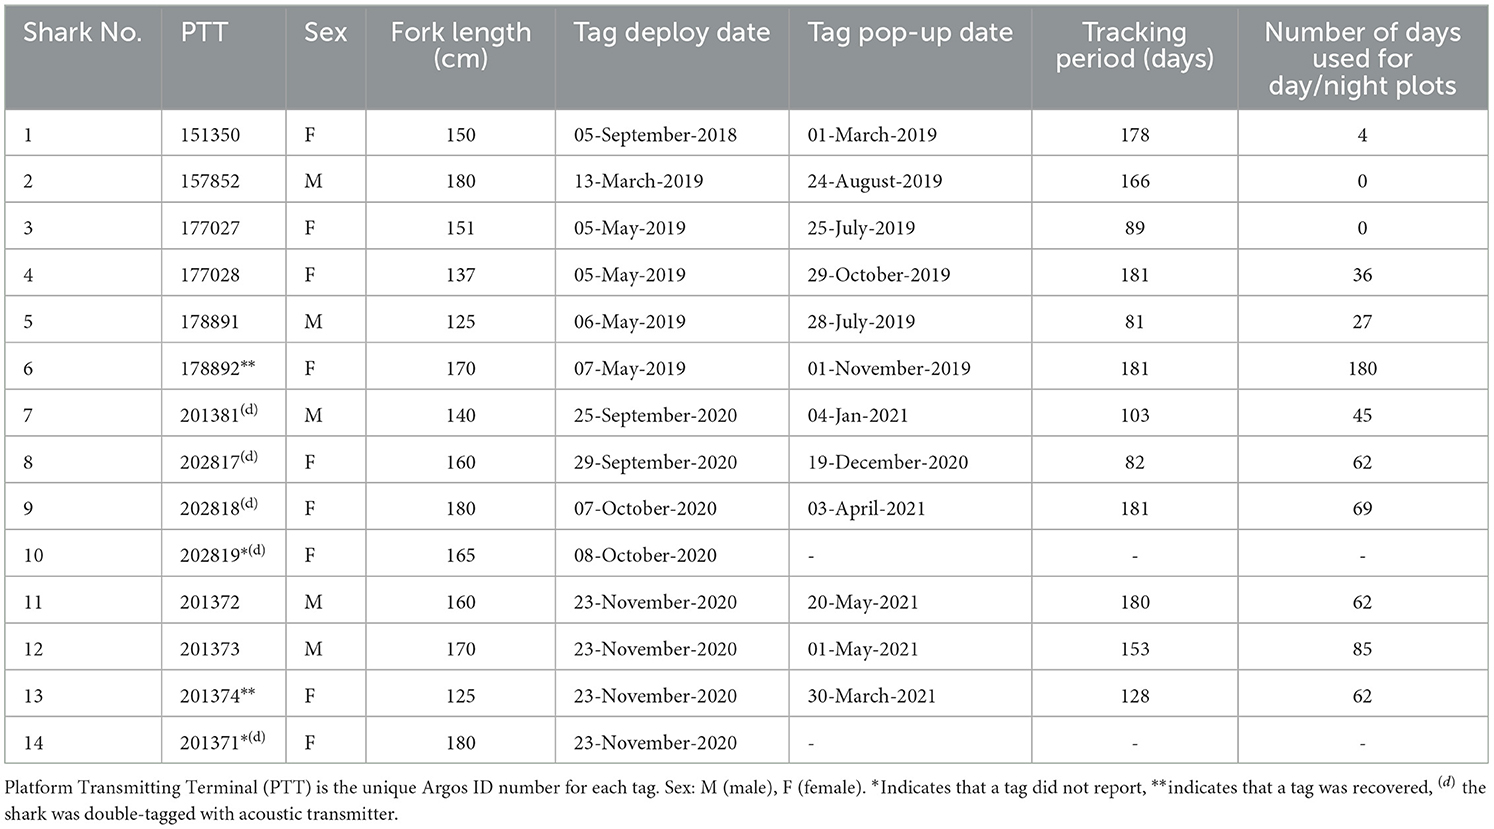
Table 1. Summary of A. pelagicus tracked with MiniPAT satellite tags.
We used pop-up satellite archival MiniPAT tags (Wildlife Computers, Inc.) to track pelagic threshers' vertical and horizontal movements. Each tag was attached to a titanium dart via a 12-cm long stainless-steel tether designed by the manufacturer specifically for tag attachment to sharks. Each tag was deployed using a spear pole, and the titanium dart was penetrated laterally on the left or right side of the dorsal fin. Depth data were binned into 0–2 m, 3–5 m, 6–10 m, 11–20 m, 21–50 m, 51–100 m, 101–200 m, 201–300 m, 301–400 m, 401–600 m, and 601–2,000 m depths. The tags were programmed to stay on the sharks for 180 days to collect and archive data, including ambient temperature, depth, and light level geolocations, before automatically detaching (or prematurely releasing), floating to the surface, and transmitting summarized data via satellite.
To monitor the residency and visitations of thresher sharks to shallow coral reefs, we used V16–6H coded acoustic transmitters (Innovasea, Halifax, Canada), operating at 69 kHz frequency and transmitting pings randomly every 60–120 s. Before deployments, the transmitters were sterilized using alcohol 70%. The sterilized transmitters were then inserted into the peritoneal cavity by making a 2–3 cm incision from the midline of the abdominal wall, which was subsequently closed with 2–3 stitches using dissolvable sutures (Ethicon PDS II Violet 2–0) and surgical needle 50mm circle cutting, Spring Eye (SE-MH 50). After the internal tagging surgery, five sharks were double tagged with external MiniPAT satellite tags. In other cases, sharks were only outfitted with a satellite tag (and no acoustic tag) due to the limited number of available tags.
After tagging, sharks were given 10–30 s of recovery swimming in the water, assisted by one of our research team members, and released. The time from transporting, securing, and releasing the shark on the boat ranged from 10 to 15 min.
2.2.3 Acoustic receiver deployments
We deployed eight acoustic receivers (VR2W 69 kHz, Innovasea, Halifax, Canada) across the Selat Pantar MPA (Figure 1) to monitor the acoustically tagged pelagic threshers. The sites where the acoustic receivers were deployed were selected based on pelagic thresher shark sightings reported by local dive centers. We deployed five acoustic receivers from September–October 2020 (Anemone City, Anemone Carpet, Reta, West Strait, Munaseli), and three additional acoustic receivers (Matab, Harilolong, and Cathedral) were deployed in November 2020 (Table 2). All receivers were covered with electrical insulation tape to prevent biofouling and attached to 15–20 mm diameter ropes with cable ties. Depths of the receiver locations ranged from 30 to 41 m, and receivers were anchored to large coral colonies and floated ~2 m from the substrate. The data from the receivers were downloaded for 4–6 months until the end of March 2021.
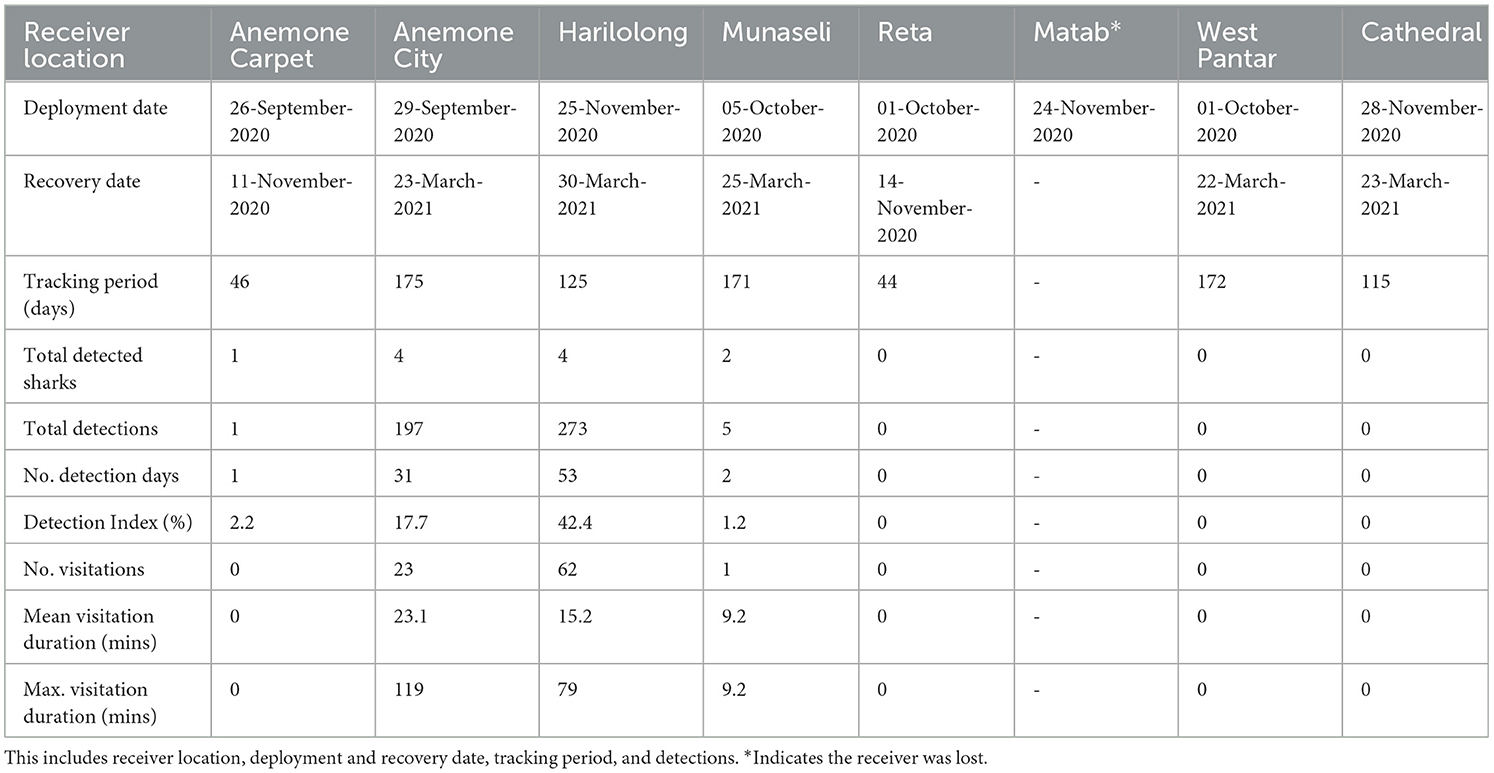
Table 2. Summary of acoustic receiver deployments in Selat Pantar MPA.
2.3 Data analyses
2.3.1 MiniPAT data analysis
We generated movement tracks from light-based geolocation data using the Wildlife Computers GPE3 program (35). GPE3 combines light-level data, satellite-based sea surface temperature measurements, tag-recorded sea surface temperature, bathymetry, tag-recorded maximum depth, and a movement speed constraint into a hidden Markov model to generate location probabilities at 12-h intervals (36). User inputs include the known tagging location at the start of the track (the first satellite communication after the tag detaches is considered the end of the track), any known locations during the tag deployment, such as acoustic detections of double-tagged sharks at acoustic receiver stations, and a movement speed, defined as the standard deviation of a normal distribution of possible diffusion rates to constrain distances between subsequent locations (35). We tested three different movement speeds for each tag: 1.5 m/s, 2 m/s, and 3 m/s. GPE3 outputs include a model score, with a higher score indicating a better model fit to the light-level, SST, and depth observations recorded by the tag (35). We analyzed each tag with the three-movement speeds and selected the 2 m/s speed as our top score model for each tag for data analysis.
GPE3 outputs include maximum likelihood positions, and probability surfaces that incorporate the complete position uncertainty from the hidden Markov model. We combined the probability surfaces for each tag, following the method described in Stewart et al. (36) to calculate residency distributions for each shark across the tag deployment period. We averaged the probability surfaces, estimated them at 12-h intervals, and scaled them so that the total probability of the combined surface was summed to one. We then used this combined probability surface to calculate 50%, 75%, and 95% credible intervals, which should be interpreted as the smallest area within which a shark would be found with 95%, 75%, or 50% probability during the tag deployment period. Finally, we combined the probability surfaces from all tags using the same approach to generate a population-level residency distribution.
We generated day/night depth plots using the “RchivalTag” package in R (37, 38) to account for the percentage of vertical shark distribution during the day and night hours for each tag. Note that depth plots were made by including the “min.perc = 99” argument to restrict the histogram data to datasets with sufficient data coverage. This is particularly important for summary data calculated from transmitted time series data since the latter can contain many transmission gaps, depending on the deployment duration and the number and resolution of data sets selected for transmission. Therefore, even if the tracking periods were longer, depth plots were made only from periods with at least 99% data coverage.
We used the Shapiro-Wilk normality test to study the normality of the data. In all cases, data followed a non-normal distribution. A Welch Two Sample t-test was used to test significant differences between depths for each tag during day and night times. In addition, the range (min and max), mean, and standard deviation (SD) of depth were calculated for each tag nighttime and daytime period (day vs. night). Furthermore, linear models were also used to test significant differences between daytime periods (day vs. night) for depth and SST.
Finally, we calculated the percentage of area occupied by shark positions inside of the designed MPAs following two different approaches: (1) calculating the percentage of overlapping area with MPAs, based on daily maximum likelihood areas, and (2) calculating the proportion of the total merged likelihood surface that falls within MPAs. This analysis yielded a metric of the efficacy of MPAs to protect the main areas of distribution for thresher sharks based on the percentage of area occupied by sharks.
2.3.2 Acoustic data analysis
The acoustic data, consisting of the date and time stamps of acoustic detections and transmitter ID, were analyzed to characterize the visitation pattern of the pelagic threshers around the receivers by calculating the duration of visitations at each receiver. A visitation involving a minimum of two acoustic detections started when a receiver detected the transmitter and ended when the receiver did not detect the transmitter for 1 h or when the transmitter was detected by another receiver (39). The analysis was undertaken using the “VTrack” R package (40). Moreover, the hourly total number of acoustic detections recorded by each receiver was calculated to investigate the diel visitation pattern at each receiver. The hourly number of detections were grouped into daytime (06:00–18:00 local time) and nighttime (18:00–06:00) detections. The hourly number of detections from each transmitter at each receiver was plotted using the “ggplot2” R package (41) to visualize the detection and residency patterns over the study period.
We used Residency Index (RI) to examine the detection level of each tagged pelagic thresher by all acoustic receivers. We also used Detection Index (DI) to explore the extent to which each receiver records acoustic detections. These two metrics were calculated using formulas adopted from Setyawan et al. (42). We calculated the RI for each pelagic thresher using the following formula:
Furthermore, we calculated the DI for each acoustic receiver site using the following formula:
3 Results
3.1 Archival satellite tag horizontal movements
We tagged 14 pelagic threshers with MiniPATs (nine females and five males), five of which were double tagged with internal acoustic tags (four females and one male). Full deployment details of satellite tags are reported in Table 1. The lengths of tagged sharks ranged from 125 to 180 cm FL (mean ± SD: 158 ± 16 cm), and tagging durations ranged from 81 to 181 days. Eleven out of 14 MiniPATs successfully transmitted archival data to the Argos system, and two tags from Shark #6 and #10, were successfully recovered, providing access to the full archived time series of depth and temperature data.
Reconstructed tracks from archival tags showed that the tagged sharks generally remained within ~90 km of the tagging location (Figure 2). Generally, the tagged sharks accessed three seas: Savu Sea, Banda Sea, and Flores Sea (Figure 3). All but one tagged shark (shark #2) spent a large portion of the tag deployment between the Savu Sea and the Timor Sea, indicated by the extent of their 50% probability distributions, which has the highest probability of occupancy (see Figure 2). Similarly, all but one tagged shark #4 had a very high probability of occurrence in the Savu Sea. Meanwhile, sharks #3, #6, and #13 moved further north than other tagged individuals into the Banda Sea before returning south toward Alor and the original tagging location.
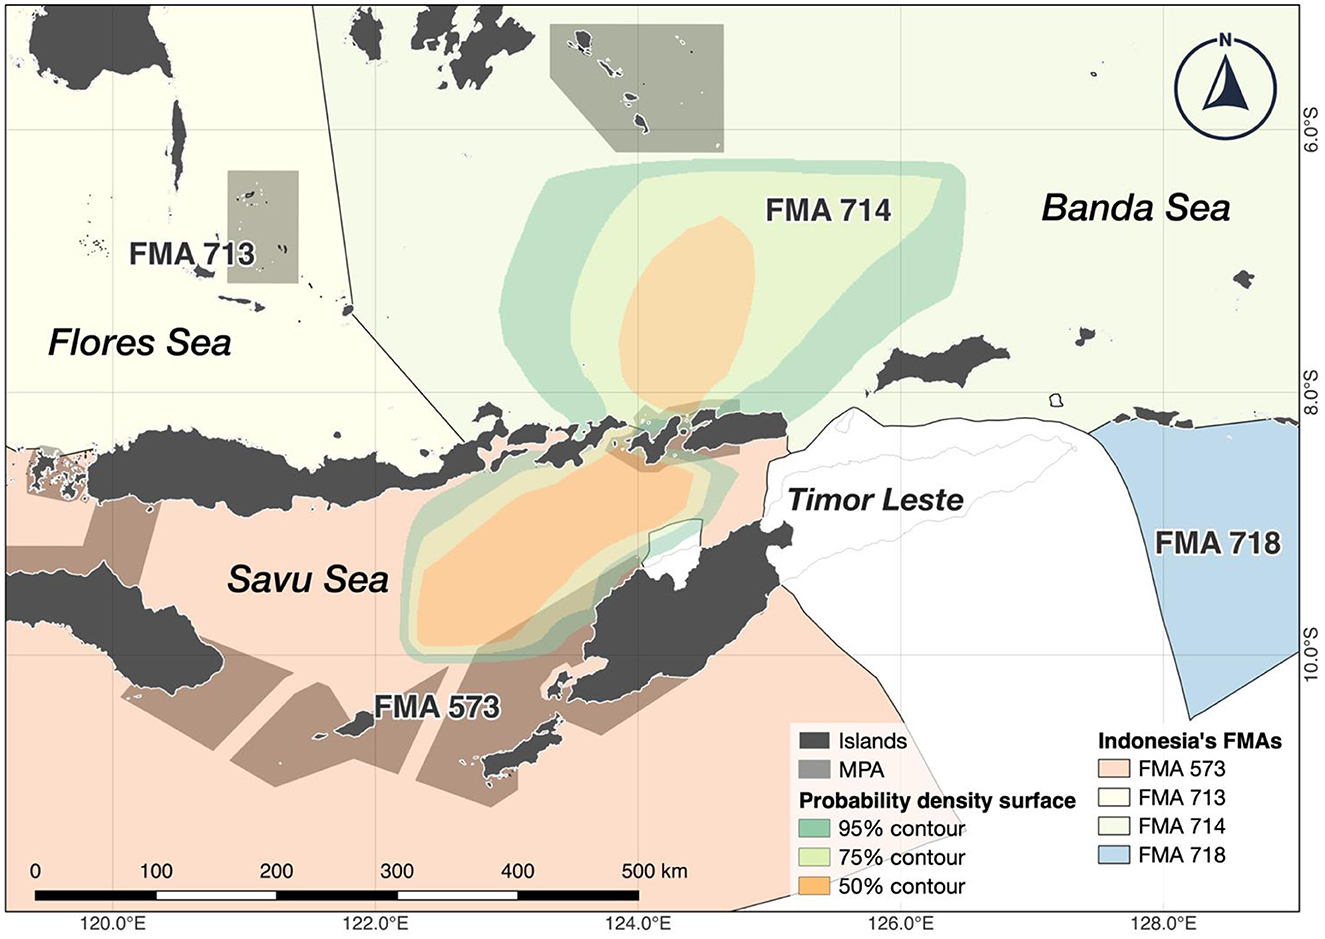
Figure 2. All surface tracks from A. pelagicus tagged with miniPAT tags were combined to visualize the potential key aggregation sites across eastern Indonesia's waters, encompassing the Banda, Flores, and Savu seas and their respective Fisheries Management Area (FMA). Tagged sharks also showed a particular movement around the Timor Sea, which belongs to the national waters of Timor Leste. Polygons represent probability density surfaces for all tags from a given deployment location. Light to dark shades represent 95%, 75%, and 50% probability contours. The 95% contour represents the smallest area where tagged animals were expected to spend 95% of their time.
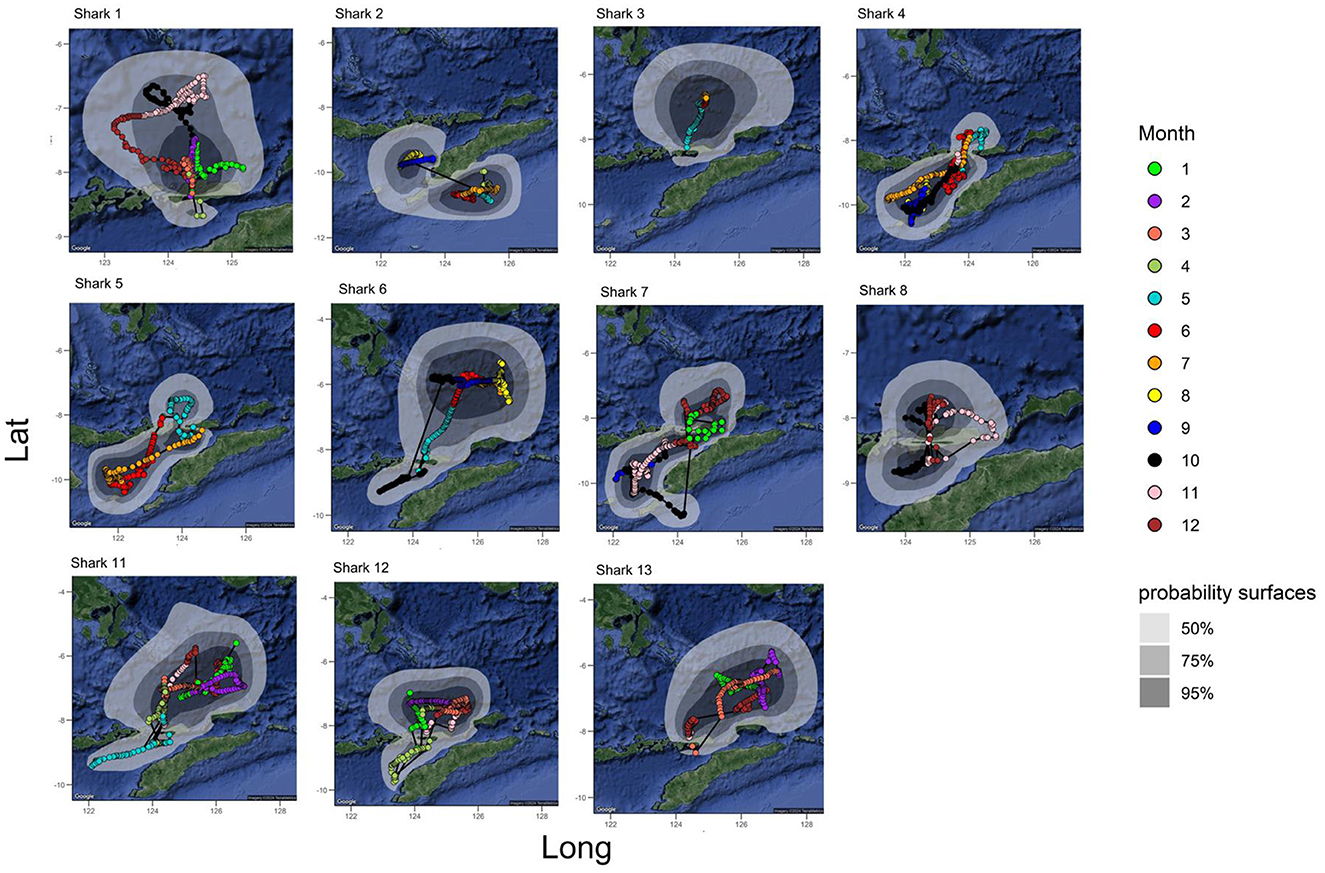
Figure 3. All tracks from the A. pelagicus tagged with MiniPAT tags. Colors indicate the monthly track trajectory–probability of surface at 50, 75, and 95% level represented by gray shade contour. Polygons represent probability density surfaces for each tag from a given deployment location. Light to dark shades represent 95%, 75%, and 50% probability contours. The 95% contour represents the smallest area where tagged animals were expected to spend 95% of their time. Sharks #9 and #10 were omitted due to insufficient geolocation data. Maps and probability density surfaces were created using R.
A range of 5 to 20% of the thresher shark's surface probability overlapped with the designated MPA areas (Supplementary Table S1, Surface Probability 3).
3.2 Vertical movements
The depths at which tags detached from the sharks ranged from 8 m to 1,688 m. The vertical movement data from transmitted depth histograms, compressed depth time series, and the uncompressed depth time series from recovered tags collectively show that tagged pelagic threshers spent significantly more time (p < 0.001) in deeper waters during daytime hours and moved into shallower depths at night (Table 3). Tagged pelagic thresher sharks spent much of their time between 20 and400 m depth, rarely coming into shallow near-surface waters (Figure 4, Supplementary Figure S1). Shark #7 moved to the deepest depth of 1,889.5 m during the night on January 6, 2021, and the tag was released from 1,688 ± 8 m on the same date due to exceeded depth limit.
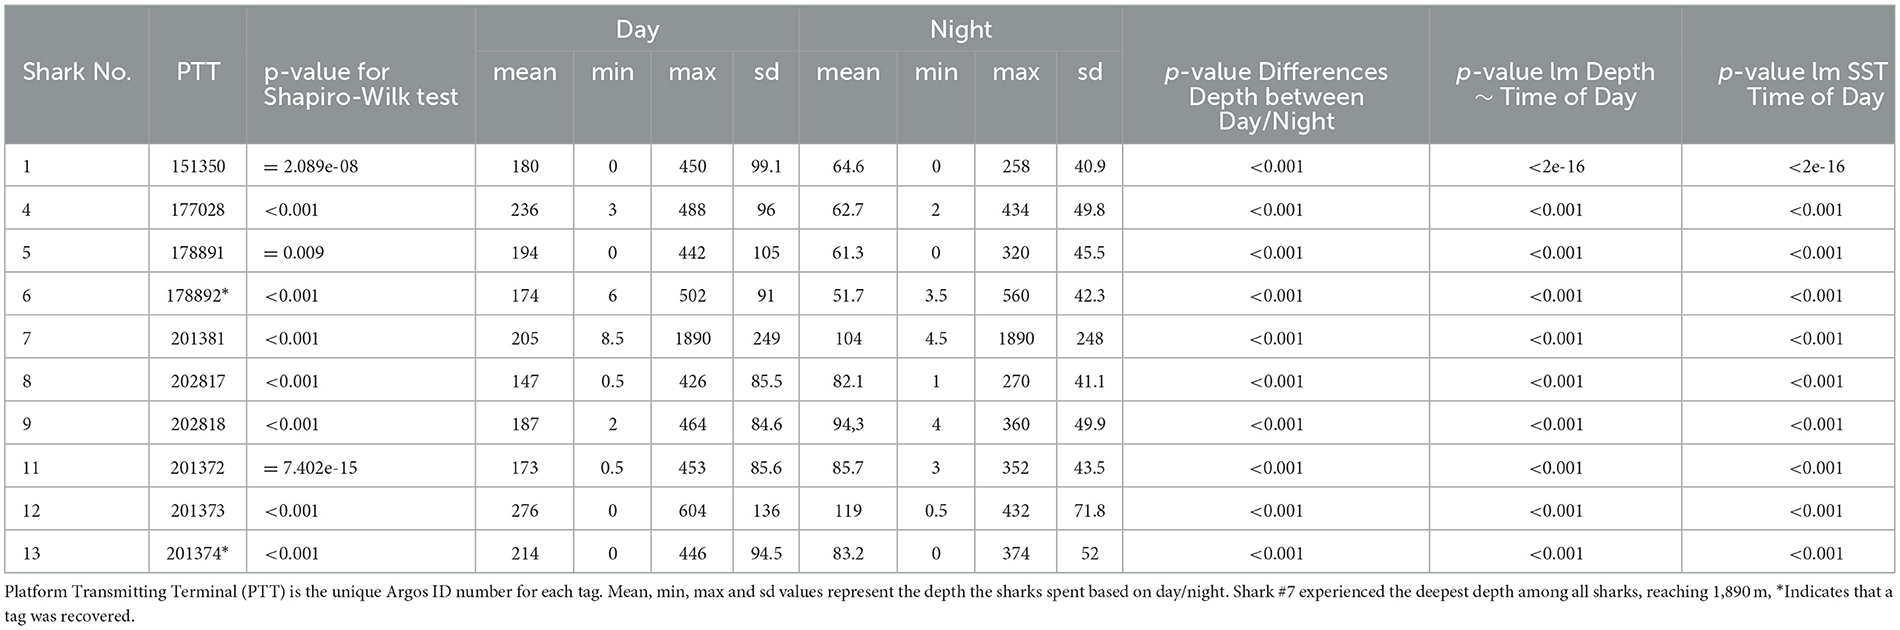
Table 3. All statistical differences in depth and temp by day/night period are significant based on individual A. pelagicus.
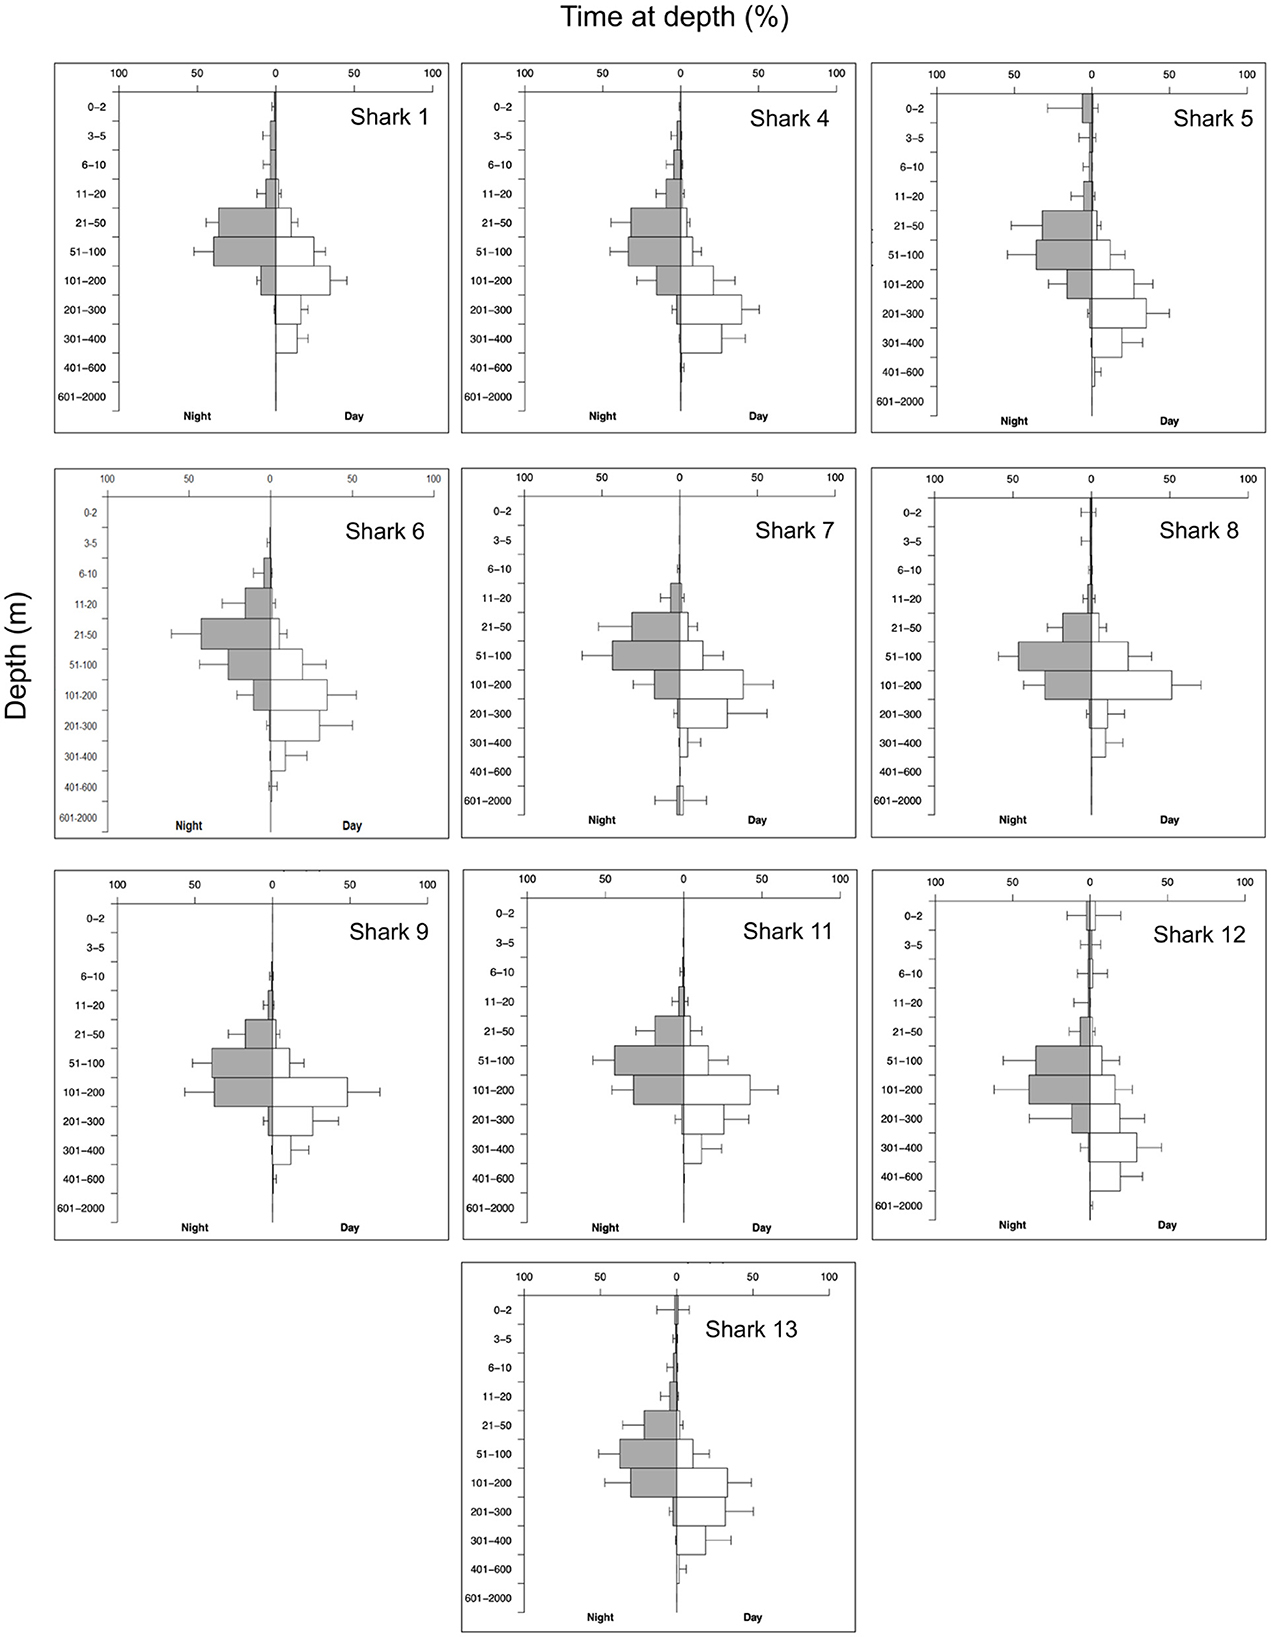
Figure 4. Percentage of time at depth for nine A. pelagicus tagged MiniPAT tags. Histogram depth bins are reported on the Y axis, and the X axis is split into time spent at depth during the night (left, gray bars) and day (right, white bars). Horizontal bars indicate the mean percentage time at depth for each tag across all transmitted histograms, and error bars indicate the standard deviation of means. Sharks #2, #3, #10, and #14 were omitted due to insufficient data for processing.
Two tags were recovered, providing access to the complete, uncompressed depth and temperature data time series at three-second intervals. Data from two recovered tags revealed both sharks exhibited diel vertical migrations, accessing mesopelagic zones during the day and epipelagic zones at night. Full tracking periods showed that both sharks made continuous oscillatory dives from 50 m to 300–400 m depth during the day. Shark #6 made a single rapid deep dive to 560.5 m for one night but still spent most of its time in shallower water ≤ 100 m during the night (mean ± SD: 51.7 ± 42.3).
The mean temperature experienced by tagged pelagic thresher sharks during nighttime was significantly warmer (p < 0.001) than during the daytime (Table 3), likely related to their diel vertical migration patterns. The sharks spent 81% of the time in the warmer water at night >21°C, and 54% in the colder water <20°C during the day. The lowest temperature was 3.4°C (mean ± SD: 21 ± 5.9), recorded during the deepest dive at 1,889.5 m (mean ± SD: 155.62 ± 253.5).
3.3 Acoustic detection pattern and residency
A total of 15 pelagic threshers were tracked using passive acoustic telemetry to examine residency in Selat Pantar MPA between September 2020 and March 2021 (Table 4). The sharks ranged in size between 140 and180 cm FL (mean ± SD: 161 ± 13) and were dominated by females (80%). The acoustic array detected only seven of 15 tagged sharks (Table 2). Those seven sharks had detection periods of 44–175 days (mean ± SD: 121 ± 57). Four out of eight receivers recorded a total of 476 acoustic detections, while four receivers recorded zero detections (Table 2).
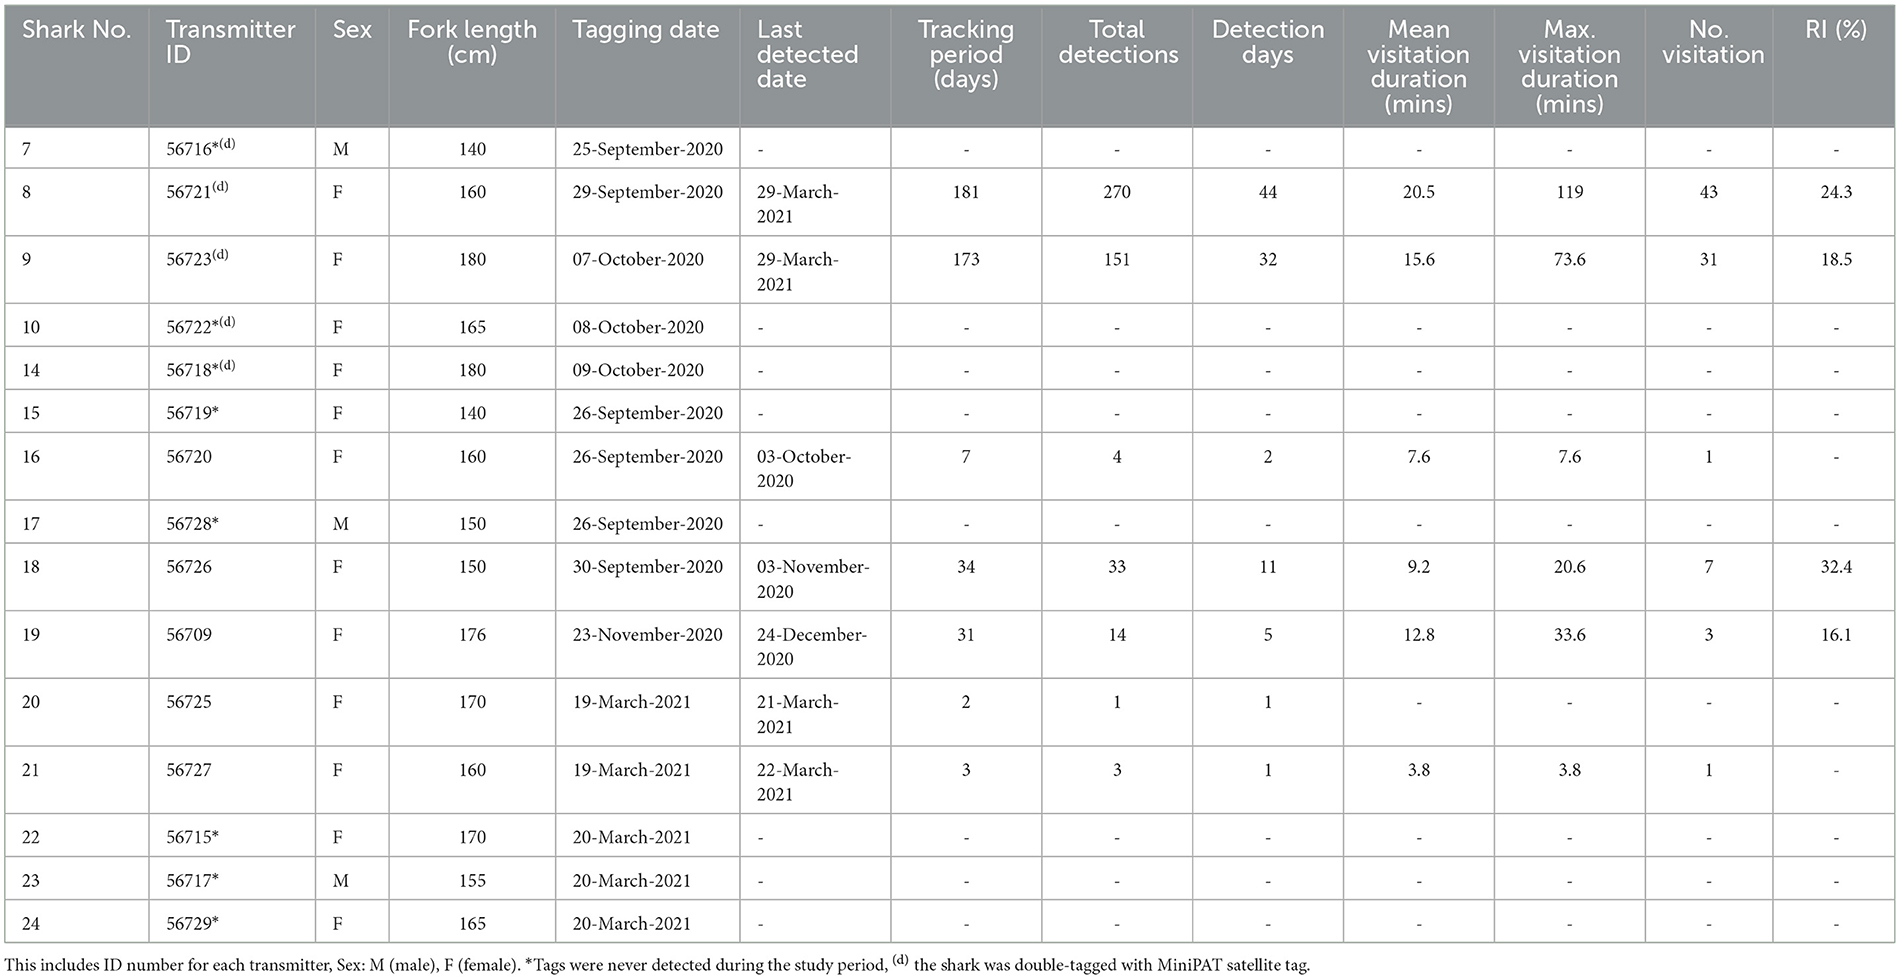
Table 4. Summary of A. pelagicus tracked using passive acoustic telemetry in Selat Pantar MPA.
There was a high degree of individual variability in acoustic detections and residency of tagged sharks (Table 3, Figure 5). Of the seven detected sharks, three had <5 detections, therefore we excluded them and only calculated RIs for four sharks with sufficient number of detections. The RIs ranged from 16.1% to 32.4% (mean ± SD: 22.8 ± 7.3). The RI of sharks tracked for more than 4 months (n = 2) were 18.5% and 24.3% registered by females sized 180 cm (Shark #9) and 160 cm FL (Shark #8), respectively. On average, the sharks spent between 4 and 20 min within range of an acoustic receiver during a visitation, while the maximum length of visitations for each shark ranged from 4 to 119 min (mean ± SD: 43 ± 45) (Table 4). The longest visitation of 119 mins was recorded by shark #8 at Anemone City (Figure 5).
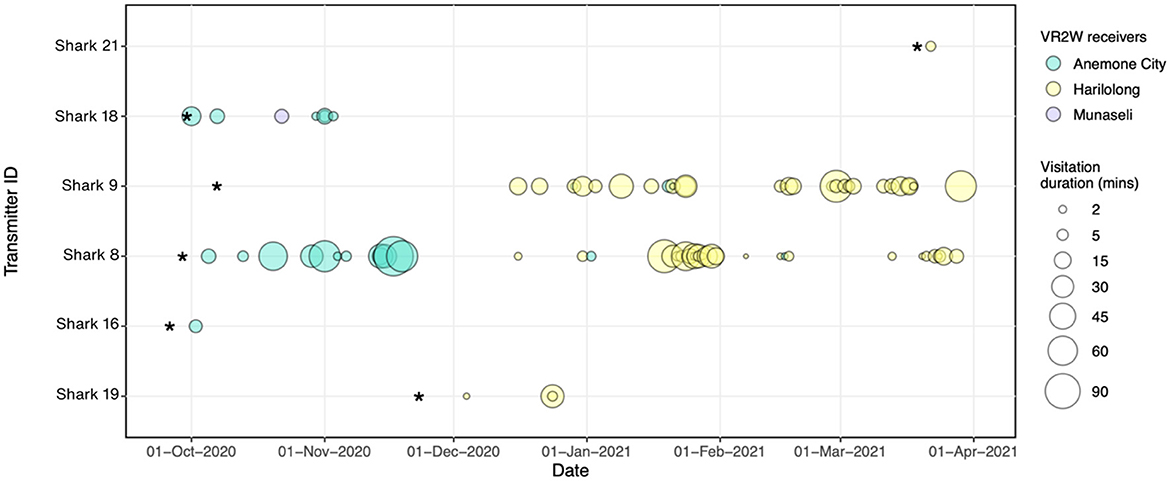
Figure 5. Acoustic detections were recorded over time for each tagged A. pelagicus at each receiver deployed in Selat Pantar MPA between September 2020–March 2021. The size of the bubbles denotes the duration of each visitation for each shark (Y axis) at each receiver station (bubble colors) *Denotes the date when the transmitters and receivers were deployed respectively, while vertical black lines represent the dates when each receiver was recovered.
Most of the detections were recorded by the receivers at Anemone City (n = 197; 41%) and Harilolong (n = 273; 57%) (Table 2). These two receivers detected four tagged sharks, while Munaseli detected only two. The receivers at Anemone City and Harilolong also recorded the highest DI of all sites, with 18 and 42%, respectively. Additionally, Anemone City recorded 23 visits, just slightly over a third of the number of visits recorded by Harilolong. Despite this, the mean and maximum duration of visitations at Anemone City (mean, max: 23 and 119 min) was higher than at Harilolong (mean, max: 15 and 79 min) (Table 2). The receiver at Anemone Carpet did not record any visitations as there was only one detection recorded at this site throughout the study period.
3.4 Seasonality and diel pattern
The visitation patterns varied temporally during the study period among Anemone City and Harilolong. Anemone City recorded most visitations from Shark #8 and #18 in October–November 2020 and occasionally recorded visitations for the rest of the study period. In comparison, the receiver at Harilolong recorded visitations almost continuously between December 2020 and March 2021 from four tagged sharks (#19, #9,# 8, #21) (Figure 5), although we note that it was not deployed until the end of November 2020.
Sharks #8 and #9 showed slightly different patterns of visitation. Although the acoustic array recorded no visitation at the beginning of tagging, Shark #9 was primarily detected by the receiver at Harilolong from mid-December 2020 to the end of March 2021. Meanwhile, Shark #8 registered several visitations in October–December 2020 at Anemone City before being detected almost entirely by the receiver at Harilolong for the rest of the study period (Figure 5). Sharks #16 and #18 also registered some visitations at Anemone City in October 2020.
The number of detections during the day (247 detections) was slightly higher than that at night (229 detections) (Figure 6). Despite the limited number of detections recorded by the acoustic array, the receivers at Anemone City and Harilolong showed a distinct diel pattern of detections (Figure 6). Most detections at Anemone City occurred during the day between 10:00 and 14:00, peaking at 13:00. In contrast, the detections at Harilolong were recorded between 19:00 and 03:00, peaking at 21:00–23:00, with only a handful of detections recorded during the day at 12:00–16:00.
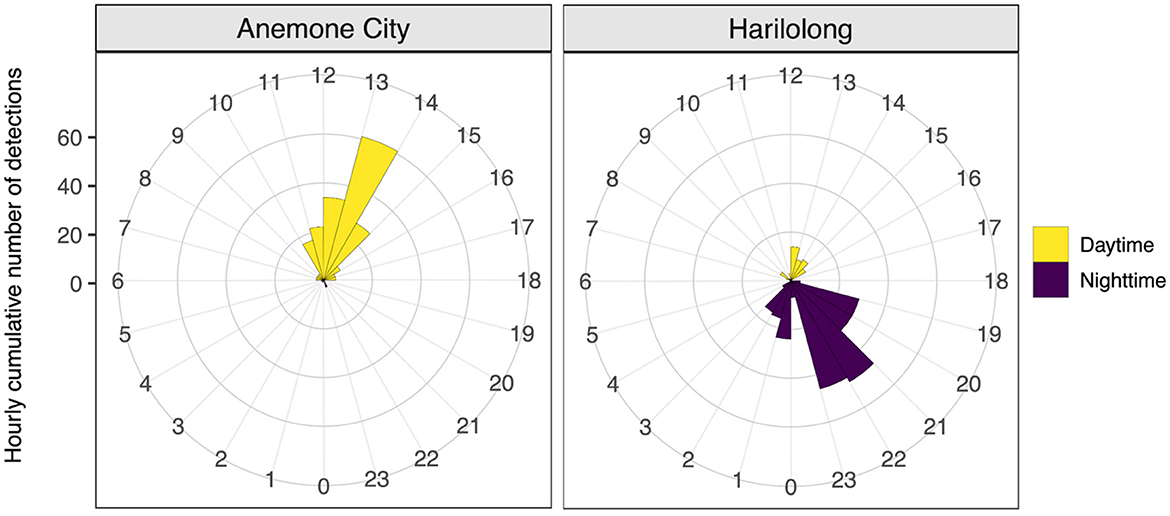
Figure 6. Hourly total number of acoustic detections from tagged A. pelagicus for 24 h (0–23) recorded by receivers deployed at Anemone City and Harilolong, Selat Pantar MPA during the study period (September 2020 to March 2021). Detections from receivers deployed at other sites were not plotted due to a small number of detections recorded.
4 Discussion
Tagging studies offer an opportunity to provide essential information about the habitat use, movement, and residency of marine migratory species (42–44). Previous studies using telemetry approaches to evaluate the movements of elasmobranch species in Indonesia have focused only on whale sharks (Rhincodon typus) and manta rays (Mobula spp.) (45–47). Our study is the first to provide information on pelagic thresher sharks' movements and residency behavior in Indonesia. Despite low acoustic detection rates at our array in the Selat Pantar MPA, a small proportion (~20%) of satellite tag-based locations were within the MPA boundaries. Furthermore, the tagged sharks also exhibit a high degree of residency in the Savu Sea and the neighboring Flores Sea, with occasional long-distance movement to the Banda Sea. The results suggest that strengthening the regional area-based management approach in these connected waters could effectively conserve pelagic thresher sharks.
4.1 Horizontal and vertical movements
Banda, Flores, and the Savu seas are administered under Indonesia's Fisheries Management Areas (FMA) 714, 713, and 573, respectively. The FMA is regulated within Indonesia's Exclusive Economic Zones (EEZ) to support capture fisheries and aquaculture and maintain stocks' sustainability, including high-value stocks, CITES-listed, endemic, and highly threatened species (48). The FMA 713 and 714 notably have the largest dedicated marine conservation areas, spanning 63 sites and 6.4 million ha to protect critical marine habitats and megafaunas such as cetaceans, sea turtles, and elasmobranchs (49).
Our study highlighted areas used by the pelagic threshers, centered around the Savu Sea in the Indian Ocean. The Savu Sea is characterized by complex bathymetry, internal tides, vertical mixing, and seasonal upwelling from deep waters, resulting in abundant food sources for marine organisms (50). The region is a vital hotspot because marine megafauna, such as cetaceans and mobulids, also forage there seasonally (51–53). Pelagic threshers spent a substantial amount of time within the Savu Sea, particularly during the tagging period in July–August. These months are considered the Southeast (SE) monsoon when upwelling occurs throughout the southeastern part of Bali and East Nusa Tenggara with high concentrations of chlorophyll-a reaching up to 200 km from the coast (28, 54).
Meanwhile, the observed vertical behaviors of the pelagic threshers moving from deeper water (100–400) in the daytime to shallower depth during nighttime are consistent with previous studies on the same species in the Red Sea (55), as well as its sister taxa, common thresher sharks (A. vulpinus) and bigeye thresher sharks (A. superciliosus) in the Pacific Ocean (56–58). The use of deeper water during the daytime corresponds to previous studies on juvenile pelagic thresher sharks that spent their time predominantly in depths > 200 m (55). Similar vertical movement patterns were observed in bigeye thresher sharks that spent most of their time 200–300 m deep during daytime and moved to 50–90 m during nighttime (57, 59).
The tagged sharks performed occasional nighttime rapid dives followed by rapid ascents, with the deepest dive recorded for the species being 1,889.5 m; notably the deepest dive ever reported for the species and the third-deepest dive ever recorded for an elasmobranch (following the whale shark at 1,926 m, and devil rays at 1,896 m) (60–62). In contrast, other studies observed daytime rapid dives and ascents of pelagic thresher sharks, with the deepest dive recorded at 632 m and 955 m for bigeye thresher sharks (55, 57). These movements between deeper and shallower waters lead to pelagic thresher sharks experiencing a wide range of temperatures, in this study, from 3.4 to −22°C. Both pelagic and bigeye thresher sharks have a rete mirabilia system (vascular structures supporting counter-current heat exchange) that enable them to maintain their body temperature above ambient levels. This may be essential in facilitating these rapid temperature and depth changes (63, 64).
Movement preferences of thresher sharks may be driven by the distribution of their prey, predation risk, and physical habitat characteristics (56, 65). For bigeye thresher sharks, nighttime feeding behavior in shallower depths may provide an advantage in prey capture because their large eyes extend onto the dorsal surface of the head, allowing them to move and hunt under low-light conditions (59, 66, 67). Meanwhile, pelagic thresher sharks are known to feed on prey that is distributed in mesopelagic habitats (100–200 m) such as Lestidium spp., Polymetme sp., and Dosidicus sp. (68, 69), which may explain why they spent ~70–90% of daytime hours in the mesopelagic zone. Despite this, daytime (09:00–16:00) and nearshore predation behavior (10–25 m) by pelagic thresher sharks was also witnessed in the Philippines, where continuous availability of prey such as sardines may facilitate opportunistic daytime, coastal predation behaviors (70).
Diel vertical movements of the sharks potentially pose threats to the pelagic thresher sharks, especially when interacting with industrial and artisanal longline fisheries. For example, tuna longline fleets operating within FMAs 713, 714, and 573 usually deployed daytime deep-set systems at around 200–300 m (71), overlapping with the daytime distribution of pelagic thresher sharks and therefore making them susceptible to bycatch (72, 73). In Alor, pelagic thresher sharks were targeted by small fishing communities using traditional deep handlines (200–300 m) (22).
4.2 Small-scale movement and habitat use
Although our archival tag results revealed that pelagic thresher sharks ranged widely offshore and into deep waters, the complimentary acoustic tagging provided insights into the species' fine-scale movements around the coastal waters of Selat Pantar MPA. Similar movement behavior was observed in the Philippines, where the sharks continuously visited a coastal seamount to interact with cleaner wrasse to remove parasites and dead tissues (74). The dependence on the coastal seamounts made them regularly venture from oceanic habitats into shallow coastal waters, demonstrating the role that specific habitat types play in their life-history strategies (25).
We also identified high detections at two sites, where the tagged sharks exhibited diel peaks. The distinct diel visitation periods may indicate differences in species occurrence and how they use these specific habitats (75). For example, greater visitation to cleaning stations in the coastal seamount of the Philippines is known to occur in early daylight hours because cleaner fish feed at higher rates in the early morning, increasing the probability of pelagic thresher sharks to visit the stations earlier in the day (74, 76). Diel visitation and habitat use can also be sex-specific, such as for nursery or birthing (77–79). In our case, where most targeted thresher sharks in the fisheries are pregnant females (22), the sharks may visit Kalabahi Bay for birthing and pass through either Harilolong or Anemone City for cleaning or feeding where both sites are located adjacent to the mouth of the bay (Figure 1). Interpreting the results should be with caution as the noise associated with the reef activity could have impacted the detection range, and therefore the number of detections recorded by the receivers deployed on/near reef environments.
The most active receivers were located close (~2 km) to the main fishing grounds of the Alor shark fishers. This potential critical habitat makes the local population vulnerable to mortality due to continuous exposure from the ongoing fisheries, although both areas are located within the MPA. For example, shark #8 was recaptured by a fisher in May 2021. Additionally, although no receivers detected Shark #17, it was also recaptured in March 2021. Both individuals were tagged in September 2020 and later recaptured at almost the same locations, ~3 km from the Anemone City receiver. These findings may provide a fundamental insight that the sharks are highly likely to be recaptured even in small tagging samples. It also suggests that some individuals may be resident or exhibit seasonal philopatry (80), returning to the same areas during certain times of the year. A longer study period to identify longer-term residency or philopatry would be essential in the future, because continuous fishing pressures may deplete the local pelagic thresher shark population, impacting the local biodiversity and the livelihoods of the communities that rely on the species as economic and food sources.
4.3 Implications for conservation and management
Highly mobile species can be impacted by many stressors during different life stages and migratory periods, making them especially challenging to manage effectively (10, 81). The pelagic thresher shark population throughout the Indo-Pacific is estimated to have declined by about 50%−79% over the last three generations (55.5 years), and the species was recently assessed as globally endangered (EN) (17). Conservation interventions for pelagic thresher sharks, including any action for a recovery or area-based management plan, are still lacking. In addition, its occurrence in protected areas is currently unknown (17, 82).
Our study suggests that the pelagic thresher shark movements overlapped with high-intensity fisheries in the Indian Ocean, where unregulated and under-reported gillnet and longline fisheries mostly occur (83, 84). Reported catches of pelagic thresher sharks are also high in major fishing ports like Tanjung Luar, Benoa, and Merauke (73, 85, 86). Pelagic thresher sharks contributed about 18.6% of the bycatch of tuna longline and 3.74% of targeted shark longline fisheries operating in these regions (85). Our study showed potential residency within the existing Selat Pantar MPA, also threatened by local fisheries (22). The results are crucial for future revisions of the conservation zones in Selat Pantar MPA to ensure the prevention of any mortality due to fisheries pressures. For instance, it will be necessary to establish a dedicated “No Take Zone” to prohibit any fisheries activities within the identified critical habitats of the pelagic thresher sharks.
The Indonesian government has already established two policies to manage the bycatch of pelagic thresher sharks through Ministerial Decrees No. 12, 2012, and No. 58, 2020, corresponding to the IOTC resolution 12/09. The policies were set to prohibit the retention of any part of a thresher shark on board and promote the live release of thresher sharks from the fisheries (87). However, it is still legal to catch thresher sharks within Indonesia's waters due to its value to local economies. Therefore, implementing conservation measures (i.e., a blanket capture and retention ban) would potentially lead to reduced incomes, loss of livelihoods, and reduced food security in the absence of proposing incentives or alternative income opportunities (8, 88).
In recent years, the non-extractive use of sharks and rays (i.e., ecotourism) has increased and has shown the possibility of providing long-term economic benefits to conservation, development, and local economies, particularly as alternative incomes to local communities (89–92). For example, in Malapascua, the Philippines, pelagic thresher shark-focused tourism could generate an annual economic benefit of more than USD11 million for the island, which also contributes to more extensive community development and resilience such as post-disaster economic recovery (25, 93). These shark-focused tourism initiatives need to be supported by a clear understanding of how sharks use their habitat, which will determine their seasonal presence and help target and sustain local tourism activities (94, 95).
5 Conclusions
Despite the relatively small sample size, our study has provided initial information on pelagic thresher shark movements and residency behaviors in and around the area within Selat Pantar MPA. The area showed a promising opportunity as a focal site for longer-term studies on their ecological movements and behaviors. This information will be important in stimulating ideas around future alternative incomes, such as pelagic thresher shark-focused tourism that could shift local shark fishers' dependency away from direct capture of the species. We have communicated the findings to the district and provincial governments, resulting in a proposal to include ~20% of the identified habitat of pelagic thresher sharks as a new conservation zone to limit fisheries activities. Furthermore, the local government has increased its political will to push legislation to completely protect pelagic thresher sharks through the Governor's Instruction Dis.Pkl.188.48/B1.57/VIII/2022 throughout the East Nusa Tenggara province. This new legislation has created the opportunity to improve localized conservation efforts to incentivize new alternative livelihoods for shark fishers and mitigate ongoing population decline, especially toward pregnant females that make up most catches in the local fisheries.
Data availability statement
The raw data supporting the conclusions of this article will be made available by the authors, without undue reservation.
Ethics statement
The animal study was approved by the UC Santa Cruz Institutional Animal Care and Use Committee Protocol Crold2006_r1. The study was conducted in accordance with the local legislation and institutional requirements.
Author contributions
RS: Conceptualization, Data curation, Formal analysis, Investigation, Methodology, Project administration, Resources, Validation, Writing – original draft, Writing – review & editing. ME: Conceptualization, Funding acquisition, Investigation, Methodology, Resources, Supervision, Validation, Writing – original draft, Writing – review & editing, Data curation, Project administration. ES: Data curation, Formal analysis, Methodology, Visualization, Writing – original draft, Writing – review & editing, Software, Supervision, Validation. NL-O: Data curation, Formal analysis, Methodology, Visualization, Writing – original draft, Writing – review & editing, Software. DS: Investigation, Project administration, Writing – review & editing. AS: Data curation, Methodology, Project administration, Resources, Software, Writing – review & editing, Writing – original draft, Conceptualization, Formal analysis, Visualization. JS: Data curation, Formal analysis, Methodology, Validation, Writing – review & editing, Visualization. DC: Conceptualization, Project administration, Supervision, Validation, Writing – review & editing.
Funding
The author(s) declare that financial support was received for the research, authorship, and/or publication of this article. The following donors provided funding for this work: MAC3 Impact Philanthropies, Ocean Blue Tree, Audrey and Shannon Wong and Save the Blue Foundation, Conservation Leadership Programme, Coastal Science and Policy Program at UC Santa Cruz, Shark Conservation Fund, UC Santa Cruz SEA Coast Junior Scholar, and Thrive Conservation.
Acknowledgments
We thank the Government of Indonesia, particularly the Ministry of Marine Affairs and Fisheries, the Department of Marine and Fisheries, and the East Nusa Tenggara Province. We also express our appreciation to the District Government of Alor, the Coastal Science and Policy Graduate Program Faculties at UC Santa Cruz, Samambaia Liveaboard, Air Dive Alor, Samata Liveaboard, Indopacific Films, and the Ocean Tracking Network at Dalhousie University. Additionally, we would like to acknowledge the invaluable contributions of several individuals: Anne R. Kapuscinski, Sarah Eminhizer, Kelly R. Zilliachus, Dharmadi (Alm.), Stefani Boro, Saleh Goro, Rahmad Zainudin, Primiaty Natalia, Vivekananda Gitandjali TD, Jeheskiel Alopen, Ahmad Hilmy Mubarak, Yodhikson M. Bang, Arifin Hiu, Maulana Nurhadi, Irwan Hermawan, Sarah Lewis, Nesha Ichida, Luca Vaime, Mike Veitch, Alex Lindbloom, Montse Amores, Ramon Estrada, Norberto Rodriguez Sanchez, Eduardo Espinel, I Made Jaya Ratha, Clara Kerstan, Deborah Lilienfeld, Sahlul Muring, Ahmad Muring, Jeremiah Mamola, and Willy Irawan.
Conflict of interest
The authors declare that the research was conducted in the absence of any commercial or financial relationships that could be construed as a potential conflict of interest.
Publisher's note
All claims expressed in this article are solely those of the authors and do not necessarily represent those of their affiliated organizations, or those of the publisher, the editors and the reviewers. Any product that may be evaluated in this article, or claim that may be made by its manufacturer, is not guaranteed or endorsed by the publisher.
Supplementary material
The Supplementary Material for this article can be found online at: https://www.frontiersin.org/articles/10.3389/frish.2024.1391062/full#supplementary-material
References
1. Jaiteh VF, Loneragan NR, Warren C. The end of shark finning? Impacts of declining catches and fin demand on coastal community livelihoods. Marine Policy. (2017) 82:224–33. doi: 10.1016/j.marpol.2017.03.027
2. Jaiteh VF, Hordyk AR, Braccini M, Warren C, Loneragan NR. Shark finning in eastern Indonesia: assessing the sustainability of a data-poor fishery. ICES J Marine Sci. (2017) 74:242–53. doi: 10.1093/icesjms/fsw170
3. Eriksson B, Johansson F, Blicharska M. Socio-economic impacts of marine conservation efforts in three Indonesian fishing communities. Marine Policy. (2019) 103:59–67. doi: 10.1016/j.marpol.2019.02.007
4. Dulvy NK, Simpfendorfer CA, Davidson LNK, Fordham SV, Bräutigam A, Sant G, et al. Challenges and priorities in shark and ray conservation. Curr Biol. (2017) 27:R565–72. doi: 10.1016/j.cub.2017.04.038
5. Cardeñosa D, Fields AT, Shea SKH, Feldheim KA, Chapman DD. Relative contribution to the shark fin trade of Indo-Pacific and Eastern Pacific pelagic thresher sharks. Anim Conserv. (2021) 24:367–72. doi: 10.1111/acv.12644
6. Fahmi and Dharmadi. Pelagic shark fisheries of Indonesia's Eastern Indian Ocean Fisheries Management Region. Afr J Marine Sci. (2015) 37:259–65. doi: 10.2989/1814232X.2015.1044908
7. Chodrijah U, Lestari P. Growth estimates of pelagic thresher shark (Alopias pelagicus Nakamura, 1935) in the Indian Ocean Southern Java waters. IOP Conf Ser Earth Environ Sci. (2021) 674:012009. doi: 10.1088/1755-1315/674/1/012009
8. Booth H, Squires D, Milner-Gulland EJ. The neglected complexities of shark fisheries, and priorities for holistic risk-based management. Ocean Coastal Manage. (2019) 104994. doi: 10.1016/j.ocecoaman.2019.104994
9. Prasetyo AP, McDevitt AD, Murray JM, Barry J, Agung F, Muttaqin E, et al. Shark and ray trade in and out of Indonesia: addressing knowledge gaps on the path to sustainability. Marine Policy. (2021) 133:104714. doi: 10.1016/j.marpol.2021.104714
10. Kinney MJ, Simpfendorfer CA. Reassessing the value of nursery areas to shark conservation and management. Conserv Lett. (2009) 2:53–60. doi: 10.1111/j.1755-263X.2008.00046.x
11. Apostolaki P, Milner-Gulland EJ, McAllister MK, Kirkwood GP. Modelling the effects of establishing a marine reserve for mobile fish species. Can J Fish Aquat Sci. (2002) 59:405–15. doi: 10.1139/f02-018
12. Chapman DD, Pikitch EK, Babcock E, Shivji MS. Marine reserve design and evaluation using automated acoustic telemetry: a case-study involving coral reef-associated sharks in the Mesoamerican Caribbean. Mar Technol Soc J. (2005) 39:42–55. doi: 10.4031/002533205787521640
13. Liu KM, Chen CT, Liao TH, Joung SJ. Age, growth, and reproduction of the pelagic thresher shark, Alopias pelagicus in the Northwestern Pacific. Copeia. (1999) 1999:68. doi: 10.2307/1447386
14. White WT. Biological observations on lamnoid sharks (Lamniformes) caught by fisheries in eastern Indonesia. J Mar Biol Ass. (2007) 87:781–8. doi: 10.1017/S0025315407056391
15. Dharmadi F, Satria F. Fisheries management and conservation of sharks in Indonesia. Afr J Mar Sci. (2015) 37:249–58. doi: 10.2989/1814232X.2015.1045431
16. Drew M, White WT. Dharmadi, Harry AV, Huveneers C. Age, growth and maturity of the pelagic thresher i and the scalloped hammerhead Sphyrna lewini. J Fish Biol. (2015) 86:333–54. doi: 10.1111/jfb.12586
17. Pacoureau N, Sherley R, Liu KM, Sul RB, Georgia Aquarium A, Fernando D, et al. IUCN Red List of Threatened Species: Alopias pelagicus. IUCN Red List of Threatened Species. (2018) Available online at: https://www.iucnredlist.org/en (accessed August 15, 2021).
18. Dermawan A, Sadili D, Suharsono Kasasiah A. A Review of the Status of Shark Fisheries and Shark Conservation in Indonesia. Jakarta: Directorate of Marine and Aquatic Resources Conservation Directorate General of Marine, Coasts and Small Islands Ministry of Marine Affairs and Fisheries (2013).
19. Clarke SC, Magnussen JE, Abercrombie DL, Mcallister MK, Shivji MS. Identification of shark species composition and proportion in the hong kong shark fin market based on molecular genetics and trade records. Conserv Biol. (2006) 20:201–11. doi: 10.1111/j.1523-1739.2005.00247.x
20. Murua H, Santiago J, Coelho R, Zudaire I, Neves C, Rosa D, et al. Updated Ecological Risk Assessment (ERA) for Shark Species Caught in Fisheries Managed by the Indian Ocean Tuna Commission (IOTC). Seychelles: Indian Ocean Tuna Commission, Mahé, Seychelles (2018).
21. Kementerian Kelautan dan Perikanan Indonesia. Analisa Posisi Indonesia dalam Proposal Jenis Hiu Tikus dan Pari Setan di COP CITES. Jakarta: Kementerian Kelautan dan Perikanan Indonesia (2016).
22. Shidqi R, Sari DR, Capriati A, Kurniasih EM. Population Risk and Alternative Fisheries Management of Thresher Sharks in Indonesia. Technical Report (2019). doi: 10.13140/RG.2.2.24744.39689/1
23. Hilborn R, Micheli F, De Leo GA. Integrating marine protected areas with catch regulation. Can J Fish Aquat Sci. (2006) 63:642–9. doi: 10.1139/f05-243
24. Le Quesne WJF, Codling EA. Managing mobile species with MPAs: the effects of mobility, larval dispersal, and fishing mortality on closure size. ICES J Marine Sci. (2009) 66:122–31. doi: 10.1093/icesjms/fsn202
25. Oliver SP, Grothues TM, Williams AL, Cerna V, Silvosa M, Cases G, et al. Risk and resilience: high stakes for sharks making transjurisdictional movements to use a conservation area. Biol Conserv. (2019) 230:58–66. doi: 10.1016/j.biocon.2018.11.013
26. Wabang IL. Kondisi terumbu karang di kawasan suaka alam perairan selat pantar dan laut sekitarnya di kabupaten alor. Albacore J Penelitian Perikanan Laut. (2018) 2:369–76. doi: 10.29244/core.2.3.369-376
27. Wirasatriya A, Susanto RD, Kunarso K, Jalil AR, Ramdani F, Puryajati AD. Northwest monsoon upwelling within the Indonesian seas. Int J Remote Sens. (2021) 42:5433–54. doi: 10.1080/01431161.2021.1918790
28. Ningsih NS, Rakhmaputeri N, Harto AB. Upwelling variability along the southern coast of Bali and in Nusa Tenggara waters. Ocean Sci J. (2013) 48:49–57. doi: 10.1007/s12601-013-0004-3
29. Government of Alor. Regency Regulation No. 2/2013 on Regency Spatial Planning, Alor, East Nusa Tenggara, Indonesia (2013).
30. Jompa J, Nessa N, Lukman M. Pengelolaan Kawasan Konservasi Laut (Bunga Rampai). Technical Report. Universitas Hasanuddin (2015).
31. Dinas Kelautan dan Perikanan Provinsi Nusa Tenggara Timur. Draft: Dokumen Rencana Pengelolaan Kawasan Konservasi di Perairan di Wilayah Kepulayan Alor Provinsi Nusa Tenggara Timur Tahun 2023–2043 (2023).
32. Compagno LJV. Sharks of the World: An Annotated and Illustrated Catalogue of Shark Species Known to Date. Rome: Food and Agriculture Org. (2001).
33. Watsky MA, Gruber SH. Induction and duration of tonic immobility in the lemon shark, Negaprion brevirostris. Fish Physiol Biochem. (1990) 8:207–10. doi: 10.1007/BF00004459
34. Natanson LJ, Gervelis BJ. The reproductive biology of the common thresher shark in the Western North Atlantic Ocean. Trans Am Fish Soc. (2013) 142:1546–62. doi: 10.1080/00028487.2013.811099
35. Wildlife Computer. Location Processing (GPE3 and Fastloc GPS) in the Wildlife Computers Data Portal User Guide. (2019) Available online at: https://static.wildlifecomputers.com/Location-Processing-UserGuide.pdf (accessed January 6, 2022).
36. Stewart JD, Beale CS, Fernando D, Sianipar AB, Burton RS, Semmens BX, et al. Spatial ecology and conservation of Manta birostris in the Indo-Pacific. Biol Conserv. (2016) 200:178–83. doi: 10.1016/j.biocon.2016.05.016
37. Bauer R. RchivalTag: Analyzing Archival Tagging Data. (2021) Available online at: https://CRAN.R-project.org/package=RchivalTag (accessed November 2, 2021).
38. Bauer RK. Marine Biologging and Data Science | Blog: RchivalTag Tutorial | Part 8 - Spatial Analyses. (2021) Available online at: http://oceantags.com/posts/RchivalTag_Tutorials_Part8_Spatial_Analayses/ (accessed November 2, 2021).
39. Setyawan E, Sianipar AB, Erdmann MV, Fischer AM, Haddy JA, Beale CS, et al. Site fidelity and movement patterns of reef manta rays (Mobula alfredi: Mobulidae) using passive acoustic telemetry in northern Raja Ampat, Indonesia. Nat Conserv Res. (2018) 3:43. doi: 10.24189/ncr.2018.043
40. Campbell HA, Watts ME, Dwyer RG, Franklin CE. V-Track: software for analysing and visualising animal movement from acoustic telemetry detections. Marine Freshwater Res. (2012) 63:815–20. doi: 10.1071/MF12194
42. Setyawan E, Erdmann MV, Mambrasar R, Hasan AW, Sianipar AB, Constantine R, et al. Residency and use of an important nursery habitat, Raja Ampat's Wayag lagoon, by juvenile reef manta rays (Mobula alfredi). Front Mar Sci. (2022) 9:815094. doi: 10.3389/fmars.2022.815094
43. Kohler NE, Turner PA, Hoey JJ, Natanson LJ, Briggs R. Tag and recapture data for three pelagic shark species: blue shark (Prionace glauca), shortfin mako (Isurus oxyrinchus), and porbeagle (Lamna nasus) in the North Atlantic Ocean. Col Vol Sci Pap ICCAT. (2002) 54:1231–60.
44. Braun CD, Skomal GB, Thorrold SR, Berumen ML. Movements of the reef manta ray (Manta alfredi) in the Red Sea using satellite and acoustic telemetry. Mar Biol. (2015) 162:2351–62. doi: 10.1007/s00227-015-2760-3
45. Dewar H, Mous P, Domeier M, Muljadi A, Pet J, Whitty J. Movements and site fidelity of the giant manta ray, Manta birostris, in the Komodo Marine Park, Indonesia. Mar Biol. (2008) 155:121–33. doi: 10.1007/s00227-008-0988-x
46. Meyers MM, Francis MP, Erdmann M, Constantine R, Sianipar A, Meyers MM, et al. Movement patterns of whale sharks in Cenderawasih Bay, Indonesia, revealed through long-term satellite tagging. Pac Conserv Biol. (2020) 26:353–64. doi: 10.1071/PC19035
47. Setyawan E, Erdmann MV, Mambrasar R, Ambafen O, Hasan AW, Izuan M, et al. Spatial connectivity of reef manta rays across the Raja Ampat archipelago, Indonesia. R Soc Open Sci. (2024) 11:230895. doi: 10.1098/rsos.230895
48. Kementerian Kelautan dan Perikanan Republik Indonesia. Penyusunan Rencana Pengelolaan Perikanan dan Lembaga Pengelola Perikanan di Wilayah Pengelolaan Perikanan Negara Republik Indonesia. (2021) Available online at: https://peraturan.bpk.go.id/Details/190267/permen-kkp-no-22-tahun-2021 (accessed December 31, 2021).
49. Rusandi A, Hakim A, Wiryawan B, Sarmintohadi I, Yulianto. Development of marine conservation areas to support fisheries management. Mar Fish. (2021) 12:139.
50. Putra MIH, Mustika PLK. Incorporating in situ prey distribution into foraging habitat modelling for marine megafauna in the Solor waters of the Savu Sea, Indonesia. Aquatic Conserv Marine Freshwater Ecosyst. (2020) 30:2384–401. doi: 10.1002/aqc.3379
51. Lewis SA, Setiasih N. Fahmi, Dharmadi D, O'Malley MP, Campbell SJ, Yusuf M, Sianipar AB. Assessing Indonesian manta and devil ray populations through historical landings and fishing community interviews. PeerJ PrePrints. (2015) 6:e1334v1. doi: 10.7287/peerj.preprints.1334v1
52. Putra MIH, Lewis SA, Kurniasih EM, Prabuning D, Faiqoh E. Plankton biomass models based on GIS and remote sensing technique for predicting marine megafauna hotspots in the solor waters. IOP Conf Ser Earth Environ Sci. (2016) 47:012015. doi: 10.1088/1755-1315/47/1/012015
53. Kahn B. Blue Whales of the Savu Sea, Indonesia. In: Proceedings of the 17th Biennial Conference on the Biology of Marine Mammals, Cape Town, South Africa (2007). p. 89.
54. Muskananfola MR, Jumsar, Wirasatriya A. Spatio-temporal distribution of chlorophyll-a concentration, sea surface temperature and wind speed using aqua-modis satellite imagery over the Savu Sea, Indonesia. Remote Sens Appl Soc Environ. (2021) 22:100483. doi: 10.1016/j.rsase.2021.100483
55. Arostegui M, Gaube P, Berumen M, DiGiulian A, Jones B, Røstad A, et al. Vertical movements of a pelagic thresher shark (Alopias pelagicus): insights into the species' physiological limitations and trophic ecology in the Red Sea. Endang Species Res. (2020) 43:387–94. doi: 10.3354/esr01079
56. Cartamil D, Wegner NC, Aalbers S, Sepulveda CA, Baquero A, Graham JB. Diel movement patterns and habitat preferences of the common thresher shark (Alopias vulpinus) in the Southern California Bight. Mar Freshwater Res. (2010) 61:596. doi: 10.1071/MF09153
57. Coelho R, Fernandez-Carvalho J, Santos MN. Habitat use and diel vertical migration of bigeye thresher shark: Overlap with pelagic longline fishing gear. Mar Environ Res. (2015) 112:91–9. doi: 10.1016/j.marenvres.2015.10.009
58. Aalbers SA, Wang M, Villafana C, Sepulveda CA. Bigeye thresher shark Alopias superciliosus movements and post-release survivorship following capture on linked buoy gear. Fish Res. (2021) 236:105857. doi: 10.1016/j.fishres.2020.105857
59. Nakano H, Matsunaga H, Okamoto H, Okazaki M. Acoustic tracking of bigeye thresher shark Alopias superciliosus in the eastern Pacific Ocean. Mar Ecol Prog Ser. (2003) 265:255–61. doi: 10.3354/meps265255
60. Hueter RE, Tyminski JP, de la Parra R. Horizontal movements, migration patterns, and population structure of whale sharks in the Gulf of Mexico and northwestern Caribbean Sea. PLoS ONE. (2013) 8:e71883. doi: 10.1371/journal.pone.0071883
61. Thorrold SR, Afonso P, Fontes J, Braun CD, Santos RS, Skomal GB, et al. Extreme diving behaviour in devil rays links surface waters and the deep ocean. Nat Commun. (2014) 5:4274. doi: 10.1038/ncomms5274
62. Andrzejaczek S, Lucas TCD, Goodman MC, Hussey NE, Armstrong AJ, Carlisle A, et al. Diving into the vertical dimension of elasmobranch movement ecology. Science Adv. (2022) 8:eabo1754. doi: 10.1126/sciadv.abo1754
63. Block BA, Carey FG. Warm brain and eye temperatures in sharks. J Comp Physiol B. (1985) 156:229–36. doi: 10.1007/BF00695777
64. Sepulveda CA, Wegner NC, Bernal D, Graham JB. The red muscle morphology of the thresher sharks (family Alopiidae). J Exp Biol. (2005) 208:4255–61. doi: 10.1242/jeb.01898
65. Sepulveda CA, Wang M, Aalbers SA. Post-release survivorship and movements of bigeye thresher sharks, Alopias superciliosus, following capture on deep-set buoy gear. Fish Res. (2019) 219:105312. doi: 10.1016/j.fishres.2019.105312
66. Brill RW, Bigelow KA, Musyl MK, Fritsches KA, Warrant EJ. Bigeye tuna (Thunnus obesus) behavior and physiology and their relevance to stock assessments and fishery biology. Col Vol Sci Pap ICCAT. (2005) 57:142–61.
67. Preti A, Kohin S, Dewar H, Ramon D. Feeding habits of the bigeye thresher shark (Alopias superciliosus) sampled from the California-based drift gillnet fishery. CalCOFI Rep. (2008) 49:202–11.
68. Moteki M, Arai M, Tsuchiya K, Okamoto H. Composition of piscine prey in the diet of large pelagic fish in the eastern tropical Pacific Ocean. Fisheries Sci. (2001) 67:1063–74. doi: 10.1046/j.1444-2906.2001.00362.x
69. Polo-Silva C, Newsome SD, Galván-Magaña F, Grijalba-Bendeck M, Sanjuan-Muñoz A. Trophic shift in the diet of the pelagic thresher shark based on stomach contents and stable isotope analyses. Marine Biol Res. (2013) 9:958–71. doi: 10.1080/17451000.2013.793802
70. Oliver SP, Turner JR, Gann K, Silvosa M, Jackson TD. Thresher sharks use tail-slaps as a hunting strategy. PLoS ONE. (2013) 8:e67380. doi: 10.1371/journal.pone.0067380
71. Sadiyah L, Dowling N, Prisantoso BI. Changes in fishing pattern from surface to deep longline fishing by the indonesian vessels operating in the Indian ocean. Indones Fish Res J. (2017) 17:87. doi: 10.15578/ifrj.17.2.2011.87-99
72. Chapman L. Bycatch in the Tuna longline fishery. In: 2nd SPC Heads of Fisheries Meeting, Noumea (2001). Available online at: http://www.spc.int/DigitalLibrary/Doc/FAME/Meetings/HOF/2/WP5.pdf
73. Zainudin IM, Patria MP, Rahardjo P, Yasman Y, Gautama DA, Prawira WT. Bycatch of sharks, marine mammals and seabirds in Indonesian Tuna Longline Fishery. Biodiversitas. (2017) 18:1179–89. doi: 10.13057/biodiv/d180341
74. Oliver SP, Hussey NE, Turner JR, Beckett AJ. Oceanic Sharks Clean at Coastal Seamount. PLoS ONE. (2011) 6:e14755. doi: 10.1371/journal.pone.0014755
75. Couturier LIE, Newman P, Jaine FRA, Bennett MB, Venables WN, Cagua EF, et al. Variation in occupancy and habitat use of Mobula alfredi at a major aggregation site. Mar Ecol Prog Ser. (2018) 599:125–45. doi: 10.3354/meps12610
77. Bangley CW, Paramore L, Shiffman DS, Rulifson RA. Increased abundance and nursery habitat use of the bull shark (Carcharhinus leucas) in response to a changing environment in a warm-temperate estuary. Sci Rep. (2018) 8:6018. doi: 10.1038/s41598-018-24510-z
78. Feitosa LM, Dressler V, Lessa RP. Habitat use patterns and identification of essential habitat for an endangered coastal shark with vertebrae microchemistry: the case study of Carcharhinus porosus. Front Mar Sci. (2020) 7:125. doi: 10.3389/fmars.2020.00125
79. Pillans RD, Rochester W, Babcock RC, Thomson DP, Haywood MDE, Vanderklift MA. Long-term acoustic monitoring reveals site fidelity, reproductive migrations, and sex specific differences in habitat use and migratory timing in a large coastal shark (Negaprion acutidens). Front Mar Sci. (2021) 8:616633. doi: 10.3389/fmars.2021.616633
80. Hueter RE, Heupel MR, Heist EJ, Keeney DB. Evidence of philopatry in sharks and implications for the management of shark fisheries. J Northw Atl Fish Sci. (2004) 35:239–47. doi: 10.2960/J.v35.m493
81. Hammerschlag N, Gallagher AJ, Lazarre DM. A review of shark satellite tagging studies. J Exp Mar Bio Ecol. (2011) 398:1–8. doi: 10.1016/j.jembe.2010.12.012
82. Reardon M, Márquez F, Trejo T, Clarke SC. Alopias pelagicus. The IUCN Red List of Threatened Species 2009 (2009).
83. Nugroho D, Satria F, Nugraha B. National Report Indonesia Southern Bluefin Tuna Fishery (2010), p. 13.
84. Dharmadi F, Wiadnyana NN. Biological aspects and catch fluctuation of Pelagic Thresher Shark, Alopias pelagicus from Indian Ocean. In: Paper presented in International workshop. Proceedings. The Design Symposium on Conservation of Ecosystem (SEASTAR2000). Kyoto University Design School (2013). p. 77–85.
85. Blaber SJM, Dichmont CM, White W, Buckworth R, Sadiyah L, Iskandar B, et al. Elasmobranchs in southern Indonesian fisheries: the fisheries, the status of the stocks and management options. Rev Fish Biol Fisheries. (2009) 19:367–91. doi: 10.1007/s11160-009-9110-9
86. Simeon BM, Fahmi IM, Muttaqin E, Oktaviyani S, Mardhiah U, et al. Catch abundance and fishing season from vulnerable and endangered Elasmobranch species in Tanjung Luar Fishery. IOP Conf Ser: Earth Environ Sci. (2019) 278:012071. doi: 10.1088/1755-1315/278/1/012071
87. IOTCS. Draft Resource Stock Status Summary: Pelagic Thresher Shark. (2020) Available online at: https://www.iotc.org/documents/pelagic-thresher-shark (accessed January 6, 2022).
88. Castellanos-Galindo GA, Herrón P, Navia AF, Booth H. Shark conservation and blanket bans in the eastern Pacific Ocean. Conserv Sci Prac. (2021) 3:e428. doi: 10.1111/csp2.428
89. Brunnschweiler JM. The Shark Reef Marine Reserve: a marine tourism project in Fiji involving local communities. J Sust Tour. (2010) 18:29–42. doi: 10.1080/09669580903071987
90. Gallagher AJ, Hammerschlag N. Global shark currency: the distribution, frequency, and economic value of shark ecotourism. Curr Issues Tour. (2011) 14:797–812. doi: 10.1080/13683500.2011.585227
91. Collins C, Bech Letessier T, Broderick A, Wijesundara I, Nuno A. Using perceptions to examine human responses to blanket bans: the case of the thresher shark landing-ban in Sri Lanka. Marine Policy. (2020) 104198. doi: 10.1016/j.marpol.2020.104198
92. Mustika PLK, Ichsan M, Booth H. The economic value of shark and ray tourism in Indonesia and its role in delivering conservation outcomes. Front Mar Sci. (2020) 7:261. doi: 10.3389/fmars.2020.00261
93. Cruz C. The Economic Value of Pelagic Thresher Sharks (Alopias pelagicus), to the Malpascuan Tourism Trade. London: University of Chester. (2016).
94. Cisneros-Montemayor AM, Becerril-García EE, Berdeja-Zavala O, Ayala-Bocos A. Shark ecotourism in Mexico: scientific research, conservation, and contribution to a Blue Economy. Adv Mar Biol. (2020) 22:71–92. doi: 10.1016/bs.amb.2019.08.003
Keywords: endangered species, Lesser Sunda Islands, telemetry studies, Sunda Banda Seascape, habitat use, Alor Island, pelagic thresher shark, shark conservation
Citation: Shidqi RA, Erdmann MV, Setyawan E, Lezama-Ochoa N, Sari DR, Sianipar AB, Stewart JD and Croll DA (2024) Identifying spatial movements and residency of pelagic thresher sharks (Alopias pelagicus) using satellite and passive acoustic telemetry to inform local conservation in central Indonesia. Front. Fish Sci. 2:1391062. doi: 10.3389/frish.2024.1391062
Received: 24 February 2024; Accepted: 30 April 2024;
Published: 22 May 2024.
Edited by:
Matthew Ajemian, Florida Atlantic University, United StatesReviewed by:
Taryn Murray, South African Institute for Aquatic Biodiversity, South AfricaThomas Jean Farrugia, Alaska Ocean Observing System, United States
Copyright © 2024 Shidqi, Erdmann, Setyawan, Lezama-Ochoa, Sari, Sianipar, Stewart and Croll. This is an open-access article distributed under the terms of the Creative Commons Attribution License (CC BY). The use, distribution or reproduction in other forums is permitted, provided the original author(s) and the copyright owner(s) are credited and that the original publication in this journal is cited, in accordance with accepted academic practice. No use, distribution or reproduction is permitted which does not comply with these terms.
*Correspondence: Rafid A. Shidqi, rafid.shidqi@duke.edu