Determination of quality kinetics, microbiology, and sensory properties of shelf-stable chicken-wing sauce
 Anuj Purohit1
  Shubhajit Sarkhel
 Anand Mohan
- 1Department of Food Science and Technology, College of Agricultural and Environmental Science, University of Georgia, Athens, GA, United States
- 2Laboratory of Applied Food Chemistry, Microbiology, and Process Engineering, Department of Chemical Engineering, Birla Institute of Technology Mesra, Ranchi, Jharkhand, India
Introduction: The development of shelf-stable foods is necessary to reduce dependence on refrigeration during their storage and distribution. Current trends in shelf-stable foods have seen a continuous rise in consumer demand that triggers research studies in the formulation, shelf stability, processing, and manufacturing of sauces frequently used by the food service industry. This study evaluated the shelf-life stability of chicken wing sauce with different flavors (hot, lemon pepper, sweet chili, teriyaki, and mild).
Methods: All sauce formulations were developed and thermally processed to pasteurize using the hot-fill-and-hold (87.75°C for 5 min) method in a portable container which was then kept at ambient temperature (18.35°C ± 2) for 12 months. The samples were drawn periodically and analyzed for color, rheology, sensory, and microbial load.
Results: The study’s findings revealed that sauces with different flavors (hot, lemon pepper, sweet chili, teriyaki, and mild) significantly declined in color and appearance, including viscosity, after ten months of storage. A very similar trend was noticed in textural changes. With the advancement of storage time, textural changes became prominent in lemon pepper and sweet chili sauce compared to hot teriyaki and mild sauces. Microbial analyses indicated the absence of pathogenic organisms, and no microbial activity was observed throughout the storage for up to 12 months. Among all sauces studied in this research project, lemon pepper exhibited a drastic decline in flavor, including some rancidity development after seven months of storage.
Discussion: Extension of the shelf life and overall quality of the most commonly used sauces in the food service industry is of paramount importance. A better understanding of the changes in the physicochemical properties of sauces during storage can help food processors understand the expected changes.
1 Introduction
In recent years, the percentage of food consumers seeking new international flavors and food experiences has steadily risen. A multinational survey found that 42% of the surveyed consumers prefer to seek novel flavors and food experiences. Growth in the shelf-stable sauce has dominated grocery stores with an approximate increase of $5.4 billion over the previous year (Nielson, 2019). The condiment category encompasses hot sauces, table sauces, dressings, and other condiments catering to this consumer demand. Increasing consumer willingness to experience foods with heat, pungency spices, and exotic flavors provides new food product developers numerous opportunities. In this regard, the revenue from the global sauce market was estimated to be $2.3 billion in 2018 and is projected to touch $3.7 billion in 2026 (Fortune business insights, 2019).
Food product quality in the broad sense is its ability to satisfy consumer expectations. This is usually delivered per expectations that arise from sensory cues such as appearance, aroma, taste, texture, and mouthfeel associated with the type of food. Quality indicators could change according to the chemical and physical changes occurring in food throughout its storage (Van Boekel, 2008). Some chemical reactions occurring in food are the breakdown of- or oxidation of-macromolecules such as fats, protein, etc., that could likely alter the physical properties of food products. Additionally, the growth of spoilage and/or pathogenic microorganisms is problematic for processing because the product is exposed to dynamic conditions during storage, transportation, and distribution (Chen et al., 2019). Therefore, the understanding of the chemical, physical, and microbiological properties of food is critical to food product quality and safety. As the food industry evolves continuously, time is of the essence for processors to establish or maintain a competitive edge. In this regard, new food product developers seek the information necessary to determine the shelf life of products in a relatively short time (Mizrahi, 2000).
The shelf-life studies help food processors, and handlers determine quality changes during storage and transportation. The shelf-life determination of sauces is limited since most studies have been done on oriental sauces (Lee et al., 2015; Taşkaya et al., 2016; Kim et al., 2018; Kim et al., 2019). The objective of this study was to determine the physical, chemical, sensory, and microbiological changes in the quality characteristics of five developed American-style chicken wing sauces during real-time ambient shelf storage. Furthermore, the products were assessed from a microbiological and sensory perspective to determine the extent of shelf life to which the product stays acceptable and safe for human consumption.
2 Materials and methods
2.1 Sauce formulation
The shelf-stable chicken wing sauce was developed using a base formulation along with different ingredients to obtain distinct flavors (hot, lemon pepper, sweet chili, teriyaki, and mild). A preliminary trial was conducted using four different types of gelling agents and evaluated for the physicochemical properties of the finished product. The modified starch was found to be suitable in terms of thermal stability during cooking, gel structure, syneresis, and capacity to remain viable during ambient storage for obtaining more extended shelf-life stability. After that, all ingredient mixes (modified starch [10 kg], seasonings and spices [5 kg], and emulsion stabilizing gum [2 kg]) were added to boiling chicken stock (100 L). The gelling agent was dispersed and blended with the ingredients with a high-speed homogenizer (3,500 rpm) and evaluated for the best consistency and product gel characteristics. Visual and instrumental color (CIE L*, a*, and b*, Hue, and Chroma) observations were performed to determine each sauce’s color, overall appearance, and consistency attributes. All preparation stages, including blending and dispersion, were completed in a food-grade stainless-steel steam jacketed kettle fitted with a steam source to quickly heat churn and stir the sauces to smooth consistency (Cleveland MKDT-12-T 12 Gallon Tilting 2/3 Steam Jacketed Direct Steam Tabletop Mixer Kettle). All experiments were repeated a minimum of three times and collected data were averaged for statistical analysis.
2.2 Thermal processing of sauce
Hot-fill-and-hold thermal processing was used to ensure all parts of the sauce ingredients were sufficiently pasteurized to reduce the microbial load to a safe level for human consumption. Additionally, hot-fill thermal processing (heating time and temperature combinations) was optimized to inactivate enzymes that could cause deterioration in food quality. Thermal processing was achieved in a batch-type stainless-steel steam jacketed kettle fitted with a steam source with a continuous capacity stir for informed heating and consistency. To successfully inactivate undesirable microorganisms during batch thermal processing, a combination of time and temperature treatments were employed, such as a high temperature of over 96.11°C with 60 s of holding time, a temperature of 90.55°C with 45 s of holding time, etc. Microbiological lethality of 5-log CFU reduction was achieved at a temperature of 90.55°C with 45 s of holding time. After thermal processing, a stainless-steel steam jacketed kettle was tilted to fill a five-gallon high-density polyethylene (HDPE) container (suitable for the high-temperature hot-fill-hold methods) and immediately capped.
After filling, the HDPE container (Dimension: 27.95 cm L × 25.40 cm W × 35.56 H; White color) was cooled to ambient temperature and stored for further characterization. Microbial and other quality analyzes were performed to evaluate the effectiveness of the thermal process using the hot-fill method. A minimum of six independent batches were processed using the hot-fill method, and the collected data were averaged for statistical analysis. Each batch was prepared in a commercial setting with a minimum of 40-gallon batches to simulate commercial food production and manufacturing; each set was independently replicated at six different times. Processing steps (thermal processing criteria: time and temperature) were modified to meet the optimum final product quality and food safety criteria for pasteurized foods and stored for 12 months in dark.
2.3 Product analysis
Product analysis for overall yield, pH, textural attributes, and color characteristics was studied to understand the structure-function relationship of flavored gel ingredient components and their interaction. More specifically, these analyses were performed to optimize the textural and visual properties of the flavored gel. Both quantitative and qualitative measurements were performed, and the collected data was analyzed to find the finished product.
2.3.1 Measurement of product yield
In this analysis, the slurry was mixed in a tared heat-transferring bowl and filled into pre-weighed pouches. The product yield was measured using Eq. 1:
where w0 is the initial weight (g) of the slurry before heating, w2 is the weight (g) of the finished product in the pouch, and w1 is the weight (g) of the empty container.
2.3.2 Sauce pH measurement
The pH analysis was performed using a Benchtop Meter (ThermoFisher Scientific, Waltham, MA, United States) that was standardized using pH 4 and 7 buffers before sampling. The pH measurements of sauce samples recorded for each sauce sample measurement were replicated a minimum of three times on different occasions and averaged for statistical analysis.
2.3.3 Characterization of sauce viscosity
Approximately 200 ml of the sauces were portioned into glass beakers. A Brookfield digital viscometer (Brookfield DV-E, model: DV1MRVTJO, MA, United States) with a cylindrical probe (LV# 1) was used to measure the dynamic viscosity profile by varying the shear rate. The probe was immersed into the sauce samples up to the fill line, and the shear rate was gradually increased in steps starting from 0 to 3 rpm (0–0.05 revolutions per s). Apparent viscosity was measured when a steady value was obtained for each shear rate tested. The values for shear rate and increment steps varied for each sauce due to the different viscosities of their ingredients. One scan from 0 to the maximum shear rate value specific to sauces was considered one replicate. The sauce samples’ viscosity measurements were replicated a minimum of three times on different occasions and averaged for statistical analysis.
2.3.4 Characterization of viscosity parameters
The equations to characterize non-Newtonian fluids are the power law (Eq. 2) and the Herschel-Bulkley model (Eq. (3)).
Eq. (2) can be represented as follows:
Where τ is the shear stress (Pa), τ0 is the yield stress (Pa), γ is shear r (s-1), µ is the apparent viscosity (Pa.s), n is the flow behavior index (dimensionless), and K is the consistency index. For each sauce, the average values of apparent viscosity observed with variation in shear rate were plotted using Eq. (4).
2.3.5 Instrumental color Measurements using CIE L*, a*, and b*
Sauce color characteristics were measured using a HunterLab MiniScan™ EZ Plus Spectrophotometer (Hunter Associates Laboratory, Inc., Reston, VA). The colorimeter was standardized using black and white tiles, creating a range of 0 (black) to 100 (white) for L*. Approximately 2 ml of sauce was transferred into a transparent plastic dish used for water activity measurement, CIE color indices of L*, a*, and b* were measured where L* represents lightness ranging from black to white, a* represents colors ranging from red to green and b* represents color ranging from yellow to blue. The instrument was standardized before each measurement using the same dish over its aperture and the manufacturer’s standards (black and white tiles). All measurements were recorded in a dark room with no direct light entry to prevent any interference in the photometric reading. All measurements were recorded in triplicate and then averaged for statistical analysis.
Change in instrumental color was calculated by Eq. 5 using the CIE color index as follows:
The hue and chroma values were determined using the following formulae:
2.4 Microbiological analysis
For microbiological analyses, methods were followed to the extent applicable and wherever possible briefly modified to meet sampling requirements for this study. Accordingly, for each sauce formulation, appropriate amount of sauce samples was aseptically withdrawn into a sterile sample cup. Samples were then submitted to the following tests: aerobic plate count (AOAC, 1999), yeast and mold count (AOAC, 1997), coliform and generic Escherichia coli (AOAC, 1995), lactic acid bacteria count (Wang et al., 2002), Listeria monocytogenes (AOAC, 2013), and Salmonella (AOAC, 1992). For each microorganism sampling, methods were briefly modified to meet the sampling requirements of this study.
Briefly, for each microorganism sampling, at each sampling time, approximately, 9.0 ml of sauce sample was mixed with 0.1 g/100 g peptone water (BD Chemicals, Franklin Lakes, NJ) was pipetted into a sample cup. A neutralizing broth was used to neutralize the samples acidic pH before plating. The sample cup containing 9 g of sauce were then thoroughly mixed with a sterile L-shaped spreader. Appropriate serial dilutions were prepared from the mixture in peptone water. Approximately, 1.5 ml of each desired dilution was pipetted into spiral plate cups. The selected dilutions were plated using a Neutec Eddy Jet 2 spiral plater (IUL Micro, Barcelona, Spain). The plates were incubated at 37°C before enumerating the bacteria as colony-forming units (CFU). Each sauce type was platted in triplicate and bacterial population counts were averaged for statistical analysis. Each experiment was repeated for a minimum of three times at three independent occasions.
2.5 Sensory analysis
A panel (n = 10) of assessors (students and semiprofessional; ages 22–65) was trained during multiple 1-h sessions to become acquainted with the four attributes (preference tests) of the sauce (odor, color, texture, and taste) (Russell et al., 2006; Destefanis et al., 2008; Abdullah et al., 2022). The participants’ recruitment procedures were reviewed and approved by the University of Georgia Institutional Review Board (UGA-IRB). Each panelist evaluated the standards for all three sensory attributes. During training and orientation, panelists were provided five different sauce samples from the marketplace. During the four training/orientation sessions, each panelist presented the samples and the reference standards and rated the product’s four attributes on a 5-point scale. Sensory evaluation was performed in triplicate in individual booths. During all assessments, references for each point were provided, and each panelist was asked to rate the sauce 5-point scale (Cavenaghi-Altemio et al., 2022). Water and unsalted crackers were provided as palate cleansers. The order of presentation consisted of randomized samples coded with 3-digit random numbers, with each panelist undertaking three sittings during each session with a break of 10 min between each sitting. Blind evaluations were carried out on three consecutive days of testing. The values were categorized from 1 being average/change to 4 being pronounced changes. A value greater than 2.5 were considered a significant change in food attributes.
3 Statistical analysis
The data distribution was found to be expected and unimodal. The conditions were appropriate for parametric analysis. The color parameters (L*, a*, b*, hue, and chroma), rheological attributes (K, n), pH, and sensory attributes were independent variables, whereas storage days were explanatory variables. To determine the significant effect of storage on sauces, two-way ANOVA was deployed with Tukey HSD as a post hoc test. For sensory, mixed model analysis was used where participants were treated as random, while sauce and storage time were fixed effects. The significance was tested at a 95% confidence level. All statistical analyses were performed using JMP®, Version 16 Pro (SAS Institute Inc., Cary, NC).
4 Results and discussion
This research study evaluated five different flavored sauces’ shelf stability and physicochemical properties. Results of this study revealed that batch thermal processing at a temperature of ≥71.7°C for a minimum of 15 s was sufficient to render a shelf-stable product potentially by reducing or eliminating hazardous microorganisms of human health significance. Acidified sauces (pH below 4.6) are prone to certain microorganisms (E. coli O157:H7, L. monocytogenes, Yeast, and Mold) of public health significance. Proper acidification (pH below 4.6) is necessary to prevent the growth of Clostridium botulinum spores under ambient storage and distribution conditions. Appropriate thermal processing criteria must be developed based on the type of product processed for preventing the growth of spoilage microorganisms. While pH 4.6 or lower is adequate to prevent growth and toxin production by C. botulinum, it may not be adequate to prevent growth of other microbial pathogens. Thus, acidified foods must be thermally processed to an extent that is sufficient to destroy the vegetative cells of microbes of public health significance and those of non-health significance that can grow in the product under the conditions in which it is stored, distributed, and held by the consumer.
4.1 Thermal processing
Thermal processing criteria were developed to ensure finished product shelf stability, emulsion stability, and product sensory and visual attributes that may be appealing to consumers. High-temperature thermal processing (above 96.11°C) with a 60-s hold-time resulted in the breaking down of the emulsifying agent and some color deterioration. A lower processing temperature (90.55°C) with a 45-s hold time resulted in a stable product with suitable emulsification and color attributes. The thermal processing criteria were established based on the conventional hot-fill-hold method generally used for processing canned sauces, which is known to stabilize product quality and extend shelf life. A combination of time and temperature during batch thermal processing has been used effectively to inactivate undesirable microorganisms in liquid foods (Kathiravan et al., 2014). Amit et el (Amit et al., 2017)., developed a mathematical model to determine the requirements for batch thermal process with specific time and temperature to maximize thermal inactivation of microorganisms of public health significance and prevention of loss of product quality.
4.2 Color characteristics
The sauces were analyzed for L*, a*, and b* values. The overall lightness values for all sauces differed significantly from each other (Table 1). Lemon pepper had a higher lightness value throughout the storage, followed by hot, mild, sweet chili, and teriyaki (Figure 1). Hot, mild, and sweet chili sauces had a predominately orange-reddish hue, whereas teriyaki sauce was brown in color with a slightly reddish hue. Lemon pepper sauce was bright yellow in color. It was observed that all sauces except hot sauce experienced a significant decline in L* value during storage. Hot lemon pepper and sweet chili did not undergo a significant color change. However, a significant decrease in chroma values indicated that the sauces became less bright/darkened by the end of the storage (Table 1).
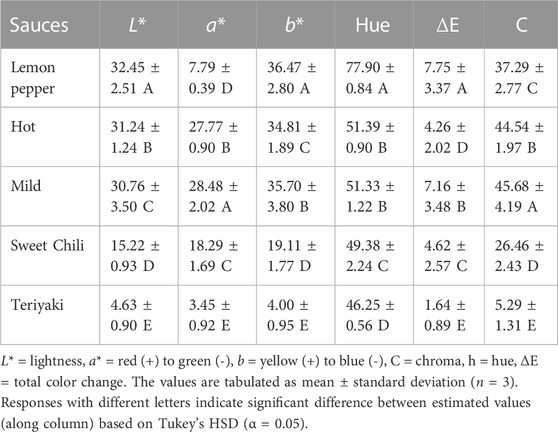
TABLE 1. Summary of overall least square means of instrumental color for different sauces.
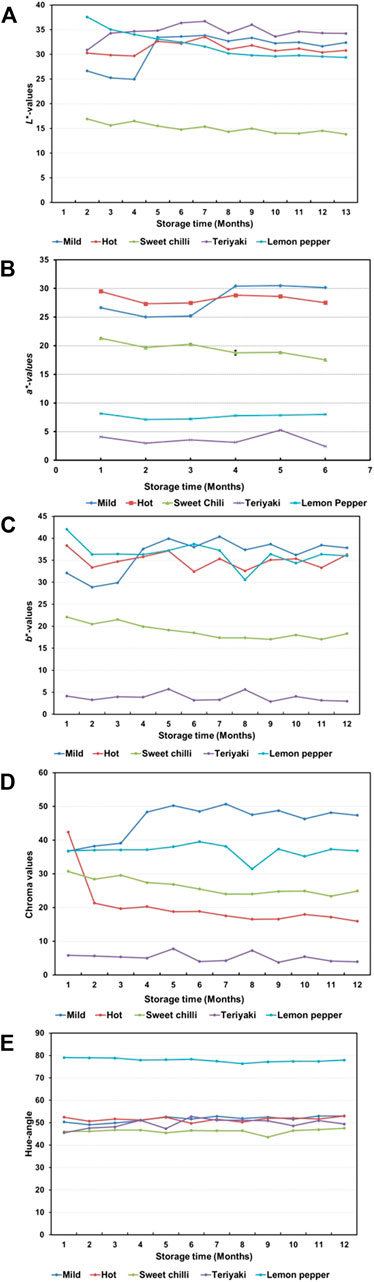
FIGURE 1. Changes in lightness, a*, b*, chroma, and hue values of different sauces during storage at ambient conditions. (A) represents L*; (B) represents a*; (C) represents b*; (D) represents Chroma; and (E) represents Hue Angle.
Instrumental analysis revealed that the mild sauce became significantly brighter orange as the storage proceeded. The extensive summary of color and data analysis can be found in Table 1. The instrumental hue value significantly increased for teriyaki sauce during storage, hinting that the redness reduced and the sauce became slightly browner. However, the ΔE values throughout the storage never crossed the threshold value of 3.30, indicating that the change was not visually perceptible. A value higher than 3.30 indicate the color change is visually perceptible by humans (Destefanis et al., 2008). Similar studies demonstrated that the mild brown color of the teriyaki sauce did not alter significantly after storage. Moon et al. studied color properties of beef slices marinated in teriyaki and natural compounds blended sauce (Moon et al., 2017). After 7 days of storage, no visually perceptible color change was observed in marinated beef color. Park et al., also showed that the prepared teriyaki sauce remained its original glossy-brown appearance after 2 weeks of storage (Park et al., 2006). The unchanged physicochemical properties during storage are the cause of this color stability. Figure 2 illustrates the trend of overall change in color (ΔE) in sauces during storage. The instrumental data are corroboration by sensory analysis. The panelists reported slight color change and darkening in all sauces. The extent of color darkening was greatest for lemon pepper sauce, followed by hot sauce and mild sauce. The color change perception for sweet chili and teriyaki was the least (Table 3). Ascorbic acid is heat sensitive (Kehrer et al., 2010), so lemon juice is susceptible to thermal abuse during processing and is especially prone to browning (Jideani and Jideani, 2012). Therefore, some variability in color parameters for this product is to be expected.
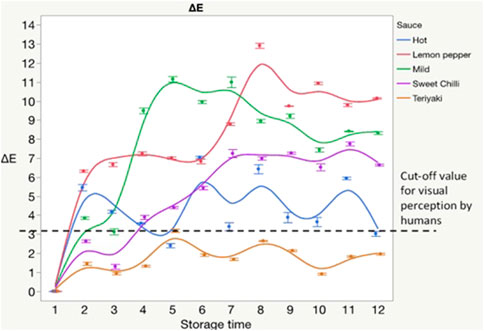
FIGURE 2. Illustration depicting a change in ΔE with storage time. The dotted line served as a cut-off value where the human eye begins to perceive color visual difference.
4.3 Product yield
As shown in the table, the product yield calculation revealed that the percent yield increased with the increase in batch size. Product yield and thermal process was designed based on briefly modified version of some previous studies (Breidt et al., 2014; Tola and Ramaswamy, 2018). The highest yield (97.02%) and the lowest yield (82.91%). The percent loss was expected due to the thermal treatment step, and water evaporation did not occur when the batches were held at a temperature of 76.67°C or higher (Bekezhanova and Goncharova, 2018). Repeat experimental replications demonstrated that all three batches exhibited an excellent yield. The transformation of raw food ingredients into a finished product involves complex processing steps. Mass losses during the processing must be avoided to minimize to increase the yield efficiency. Unit operations during food production must be designed to distinguish wanted and unwanted material losses. In this study, the percent yield of the flavored gel increased with the increase in batch size, and a significant loss in the product yield was observed during thermal processing. Product yield efficiency is considered a critical element of food business success, growth, and success (Azanedo et al., 2020). Raw material costs wanted, and unwanted losses during processing and production are the key to maximizing the economic value of food products in the marketplace. Factors such as seasonal and local ingredients, food safety, and quality must be included in any formalized new food product development method (Azanedo et al., 2020).
4.4 pH measurement
All sauces were acidic in nature with overall lowest to highest pH in the following order: lemon pepper (2.53), mild (2.87), hot (2.94), sweet chili (3.01), and teriyaki (3.29). The pH change was minimal during storage for most of the sauces; the range of change in pH for all sauces was around 0.21 except for teriyaki. The teriyaki sauce underwent a significant decrease in pH (from 3.50 to 3.21) by the end of the storage (Figure 3). This decrement in pH may be attributed to the presence of free fatty acids and oils which have been induced by hydrolytic cleavage of triglycerides due to unwanted moisture migration during storage period (Modi et al., 2006). A research by Yun et al. demonstrated that bacteria living and expanding in the food might create organic acids or lead to the hydrolytic breakdown of lipids, which can result in the production of fatty acids and a drop in pH (Yun et al., 2007). Additionally, according to the Kristott et al. the pH drop might be due to the oxidative deterioration of the oil components originate in chicken wing sauce during the storage (Kilcast and Subramaniam, 2000; Kristott et al., 2000). Since the other sauces showed minor pH changes during storage, a pH of 2.5–3 would be recommended for suppress the growth of microbes. Therefore, a pH range of 2.5–3 would be optimal for the safe storage and shelf life extension (12 months) of chicken wings sauces (Björkroth, 2005). Several studies showed that low pH promotes the microorganism deterioration by acid stress which results in shelf life extension of the product. Giatrakou et al. studied the shelf life extension of ready to cook chicken products by lowering the pH of the matrix (Giatrakou et al., 2010). It was observed that the low pH hurdles the growth of microorganisms (2–3 log CFU reduction) and the shelf life extended upto 4–6 days. In another study, Karam et al. prepared an acidic based marinade paste (pH < 4.4) for shelf life extension of chicken (Karam et al., 2019). Results showed microbial deactivation (2.9–3.1 log CFU/g) and shelf-life increment from 15 to 21 days.
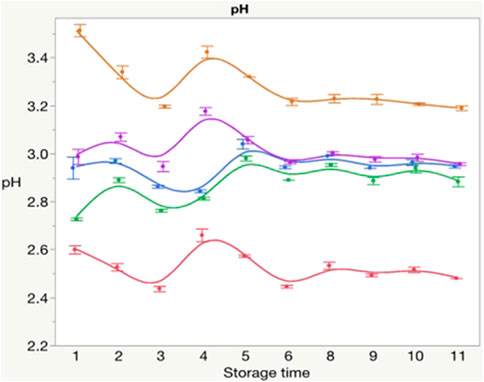
FIGURE 3. Changes in consistency index (K), flow behavior index (n) and pH values of different sauces during storage at ambient conditions.
The detailed change in pH values has been tabulated in Table 2. Table shows the pH of each batch; there is no correlation between batch size and pH. A range of less than 0.5 is an acceptable variation. As mentioned, lemon juice pH lies between 2 and 3. Adding low-acid ingredients with alkaline pH may have raised the final pH higher than pure lemon juice. This product has sufficient acidity, which may be a hurdle in controlling microbial growth in food products (Sofos, 2014).
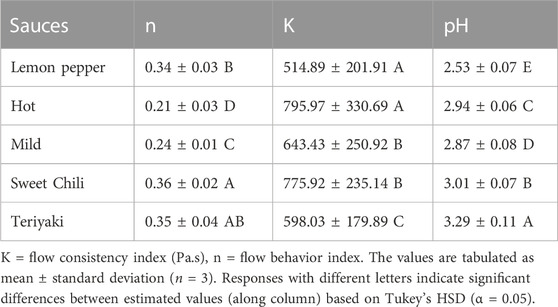
TABLE 2. Summary of overall least square means of rheological properties and pH for different sauces.
4.5 Rheology
The consistency index (K) and flow behavior index (n) were experimentally determined to quantify the flow behavior in different sauces. The K and n dropped significantly during storage, and the time of viscosity drop varied with the sauce. The K values of hot lemon, pepper, and mild sauces slightly increased up to the 9-month of storage, whereas it remained pretty much unchanged for sweet chili and teriyaki (Figure 4). However, the changes in these flow behavior attributes were not statistically significant (p < 0.05). The changes in K for hot lemon, pepper, and mild sauces agreed with the increase in flow behavior index (n); n slightly rose by the 9th month of storage, indicating that the flow behavior of the said sauces was less non-Newtonian. The rest of the sauces did not experience a significant change in n (Figure 4). All sauces started experiencing a significant decrease in K at and odor changes around the 10th month of storage; the hot lemon, pepper, and mild sauces saw a reduction in viscosity at the 10th month of storage, whereas sweet chili and teriyaki saw a decline in viscosity at 11th month. The sensory analysis revealed perceptible changes in the viscosity of lemon, pepper, and sweet chili sauce after the 10th month of storage (Table 3).
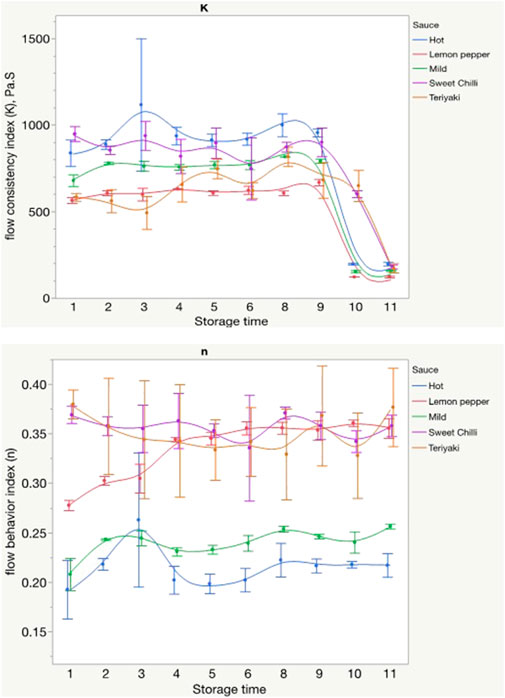
FIGURE 4. Changes in pH values of different sauces during storage at ambient temperature conditions.

TABLE 3. Average scores for sensory attributes including color, odor, taste and texture for all sauces stored under ambient conditions for 12 months.
4.6 Microbiological analysis
The overall microbial load was low in stored sauces (Table 4). The aerobic plate count (APC), yeast, mold, lactic acid bacteria, and coliforms stayed less than 10 CFU/g through the storage period in all sauces. The presence of pathogenic bacteria was nonexistent during storage in all sauces, as determined by microbiological analysis. During storage, the sauces did not exhibit growth Staphylococcus aureus, E. coli, L. monocytogenes, and Salmonella.
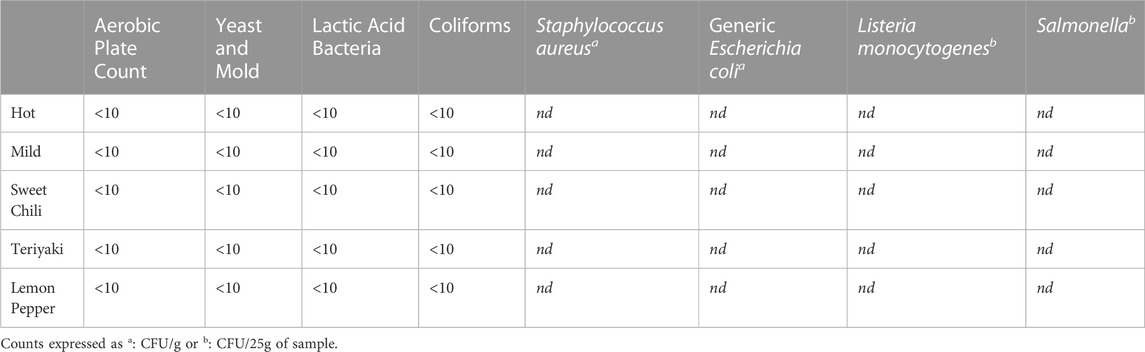
TABLE 4. Microbiological analysis of 5 sauce products over 12-month of shelf storage for non-specific total counts and foodborne pathogens.
4.7 Sensory analysis
The changes in sensory quality, including color, flavor, and odor, were minimal during the first 6 months of storage (Table 3). Of all sauces, lemon pepper experienced significant color and flavor, whereas teriyaki sauce experienced minimum quality changes. The panelists indicated the development of slight rancidity flavor in lemon pepper sauce beginning the 7th month of storage. Small sensory attribute changes (color, odor, and taste) were observed in the other four sauces. Lemon pepper and sweet chili sauces exhibited significant differences in texture. More specifically, towards the 10th through 12th month of storage, lemon, pepper, and sweet chili sauces started showing prominent separation of ingredients, including precipitation of emulsifiers. These sauces underwent thinning and lowering of viscosity after the 10th month of storage. The changes in texture were minimal on the rest of the sauce.
5 Conclusion
This research determined a thermal process criterion and evaluated the physicochemical characteristics of five different flavored shelf-stable sauces. This study assessed the microbiological and sensory attributes of other flavoring ingredients that can be used for developing shelf-stable sauces for market-ready products. Our findings show that the thermal process is adequate to render the finished product free of pathogenic microorganisms and will provide an economic opportunity for the food service industry to transform the shelf-stable food product into a value-added product. The study evaluated the stability of the emulsification agent as an effective thickening agent like the most effective formulation for this product. The findings of this study showed that all different flavored sauce was thermally shelf-stable, safe, and of high quality. The next step in this research would be to quantify water-binding further and apply the processing methods and analysis of this work to other value-added ingredients so that the food service industry can transform shelf-stable products into valuable commodities. The combination of microbiological results and sensory evaluations indicated that all five sauces remained consumable throughout the storage period.
Data availability statement
The original contributions presented in the study are included in the article/supplementary material, further inquiries can be directed to the corresponding author.
Author contributions
AP: Conceptualization, Methodology, Validation, Investigation, Writing-Original draft. MJ: Methodology, Validation, Investigation, Writing-Original draft. SS: Methodology, Validation, Investigation, Writing-Original draft. AR: Methodology, Validation, Writing-Original draft, review and editing, AM: Conceptualization, Methodology, Validation, Writing-Original draft, review and editing, Visualization, Project supervision and administration, and Funding acquisition. All authors contributed to the article and approved the submitted version.
Conflict of interest
The authors declare that the research was conducted in the absence of any commercial or financial relationships that could be construed as a potential conflict of interest.
The authors AM declared that they were an editorial board member of Frontiers, at the time of submission. This had no impact on the peer review process and the final decision.
Publisher’s note
All claims expressed in this article are solely those of the authors and do not necessarily represent those of their affiliated organizations, or those of the publisher, the editors and the reviewers. Any product that may be evaluated in this article, or claim that may be made by its manufacturer, is not guaranteed or endorsed by the publisher.
References
Abdullah, F. A. A., Dordevic, D., Kabourkova, E., Zemancová, J., and Dordevic, S. (2022). Antioxidant and sensorial properties: Meat analogues versus conventional meat products. Processes 10 (9), 1864. doi:10.3390/pr10091864
Amit, S. K., Uddin, M., Rahman, R., Islam, S., and Khan, M. S. (2017). A review on mechanisms and commercial aspects of food preservation and processing. Agric. Food Secur. 6 (1), 51–22. doi:10.1186/s40066-017-0130-8
Aoac, A. (2013). “Official method 2013.11 for Listeria monocytogenes in a variety of foods,” in Official methods of analysis. 18 (Washington, DC: Association of Official Analytical Chemists).
Aoac, A. (1995). “Official method 991.14 for coliform and Escherichia coli counts in foods,” in Official methods of analysis. 14 (Washington, DC: Association of Official Analytical Chemists).
Aoac, A. (1992). “Official method 992.11 motile and non-motile Salmonella in foods,” in Official methods of analysis. 12 (Washington, DC: Association of Official Analytical Chemists).
Aoac, A. (1997). “Official Method 997.02 for yeast and mold count in foods,” in Official methods of analysis. 14 (Washington, DC: Association of Official Analytical Chemists).
Aoac, A. (1999). “Official Method 999.08 Aerobic plate count in foods,” in Official methods of analysis. 14 (Washington, DC: Association of Official Analytical Chemists).
Azanedo, L., Garcia-Garcia, G., Stone, J., and Rahimifard, S. (2020). An overview of current challenges in new food product development. Sustainability 12 (8), 3364. doi:10.3390/su12083364
Bekezhanova, V., and Goncharova, O. (2018). Problems of evaporative convection (review). Fluid Dyn. 53 (1), S69–S102. doi:10.1134/s001546281804016x
Björkroth, J. (2005). Microbiological ecology of marinated meat products. Meat Sci. 70 (3), 477–480. doi:10.1016/j.meatsci.2004.07.018
Breidt, F., Kay, K., Osborne, J., Ingham, B., and Arritt, F. (2014). Thermal processing of acidified foods with pH 4. Des Moines, Iowa: International Association for Food Protection. 1 to pH 4.6.
Cavenaghi-Altemio, Â. D., Bazzo, B. D., Zambaldi, C. F., Vieira, B. M., and Graciano Fonseca, G. (2022). Development and evaluation of fish-based sauce prepared with mechanically separated meat of hybrid sorubim. J. Culin. Sci. Technol., 1–15. doi:10.1080/15428052.2022.2099332
Chen, X., Zhang, Y., Yang, X., Hopkins, D. L., Zhu, L., Dong, P., et al. (2019). Shelf-life and microbial community dynamics of super-chilled beef imported from Australia to China. Food Res. Int. 120, 784–792. doi:10.1016/j.foodres.2018.11.039
Destefanis, G., Brugiapaglia, A., Barge, M. T., and Dal Molin, E. (2008). Relationship between beef consumer tenderness perception and Warner–Bratzler shear force. Meat Sci. 78 (3), 153–156. doi:10.1016/j.meatsci.2007.05.031
Fortune business insights (2019). “Hot sauce market size, share and industry analysis by type (tabasco sauce, habanera sauce, jalapeño sauce, sweet and spicy sauce), by distribution channel (mass merchandisers, specialist retailers, convenience stores, online retail), and regional forecast 2019 - 2026,”. Report No: FBI100495 (Pune, Maharashtra: Fortune business insights). Available at: https://www.fortunebusinessinsights.com/industry-reports/hot-sauce-market-100495.
Giatrakou, V., Ntzimani, A., and Savvaidis, I. (2010). Effect of chitosan and thyme oil on a ready to cook chicken product. Food Microbiol. 27 (1), 132–136. doi:10.1016/j.fm.2009.09.005
Jideani, V. A., and Jideani, I. (2012). Lemon and lime. Tropical and subtropical fruits: Postharvest physiology, processing and packaging.
Karam, L., Roustom, R., Abiad, M. G., El-Obeid, T., and Savvaidis, I. N. (2019). Combined effects of thymol, carvacrol and packaging on the shelf-life of marinated chicken. Int. J. food Microbiol. 291, 42–47. doi:10.1016/j.ijfoodmicro.2018.11.008
Kathiravan, T., Nadanasabapathi, S., and Kumar, R. (2014). Standardization of process condition in batch thermal pasteurization and its effect on antioxidant, pigment and microbial inactivation of Ready to Drink (RTD) beetroot (Beta vulgaris L) juice. Int. Food Res. J. 21 (4).
Kehrer, J., Robertson, J., and Smith, C. (2010). Free radicals and reactive oxygen species. Bethesda, Maryland: National cancer institute.
Kilcast, D., and Subramaniam, P. (2000). The stability and shelf-life of food Woodhead Food Series. Cambridge: Woodhead Publishing Limited.
Kim, Y. A., Van Ba, H., Dashdorj, D., and Hwang, I. (2018). Effect of high-pressure processing on the quality characteristics and shelf-life stability of Hanwoo beef marinated with various sauces. Korean J. food Sci. animal Resour. 38 (4), 679–692. doi:10.5851/kosfa.2018.e4
Kim, Y. A., Van Ba, H., and Hwang, I. (2019). Effects of traditional sauce type and storage time on quality characteristics, shelf-life and flavor compounds of marinated pork cooked by sous vide method. Food Sci. animal Resour. 39 (3), 355–370. doi:10.5851/kosfa.2019.e27
Kristott, J. (2000). “The stability and shelf life of food,” in Fats and oils. Editors D. Kilcast, and P. Subramaniam (Boca Raton, Florida: CRS).
Lee, E-S., Park, S. Y., Jeong, Y-G., Jo, B-C., Kim, M., and Ha, S-D. (2015). Quality evaluation and estimation of shelf life of retort-pouched tomato-based and Korean traditional fermented food-based sauces. J. Korean Soc. Appl. Biol. Chem. 58 (2), 229–236. doi:10.1007/s13765-015-0035-9
Mizrahi, S. (2000). Accelerated shelf-life tests. Ital. J. Food Saf. 7 (4), 107–125. doi:10.4081/ijfs.2018.6919
Modi, V., Gowda, G. S., Sakhare, P., Mahendrakar, N., and Rao, D. N. (2006). Pre-processed spice mix formulation and changes in its quality during storage. LWT-Food Sci. Technol. 39 (6), 613–620. doi:10.1016/j.lwt.2005.05.004
Moon, H., Kim, N. H., Kim, S. H., Kim, Y., Ryu, J. H., and Rhee, M. S. (2017). Teriyaki sauce with carvacrol or thymol effectively controls Escherichia coli O157: H7, Listeria monocytogenes, Salmonella typhimurium, and indigenous flora in marinated beef and marinade. Meat Sci. 129, 147–152. doi:10.1016/j.meatsci.2017.03.001
Park, H-N., Kang, O-K., and Moon, W-S. (2006). Ingredient preservation in the practical manufacture of teriyaki sauce. Korean J. food Cook. Sci. 22 (2), 111–121.
Russell, T., Drake, M., and Gerard, P. (2006). Sensory properties of whey and soy proteins. J. Food Sci. 71 (6), S447–S455. doi:10.1111/j.1750-3841.2006.00055.x
Taşkaya, L., Alparslan, Y., Yapici, H. H., Metin, C., and Baygar, T. (2016). Determination of shelf life of Gibel Carp (Carassius gibelio, Bloch 1782) marinades in different sauces stored at 4 °C. Ege J. Fish. Aquatic Sci. 33 (1), 55–61. doi:10.12714/egejfas.2016.33.1.11
Tola, Y. B., and Ramaswamy, H. S. (2018). Novel processing methods: Updates on acidified vegetables thermal processing. Curr. Opin. Food Sci. 23, 64–69. doi:10.1016/j.cofs.2018.06.003
Van Boekel, M. A. (2008). Kinetic modeling of food quality: A critical review. Compr. Rev. Food Sci. Food Saf. 7 (1), 144–158. doi:10.1111/j.1541-4337.2007.00036.x
Wang, Y-C., Yu, R-C., and Chou, C-C. (2002). Growth and survival of bifidobacteria and lactic acid bacteria during the fermentation and storage of cultured soymilk drinks. Food Microbiol. 19 (5), 501–508. doi:10.1006/fmic.2002.0506
Keywords: shelf-life, thermal process, hot-fill-hold, rheology, sensory
Citation: Purohit A, Jain M, Sarkhel S, Roy A and Mohan A (2023) Determination of quality kinetics, microbiology, and sensory properties of shelf-stable chicken-wing sauce. Front. Food. Sci. Technol. 3:1204804. doi: 10.3389/frfst.2023.1204804
Received: 12 April 2023; Accepted: 05 July 2023;
Published: 19 September 2023.
Edited by:
Filipa Vinagre Marques Silva, University of Lisbon, PortugalReviewed by:
Aubrey Francis Mendonca, Iowa State University, United StatesCristina Saraiva, University of Trás-os-Montes and Alto Douro, Portugal
Elham Alami Milani, New Zealand Forest Research Institute Limited (Scion), New Zealand
Copyright © 2023 Purohit, Jain, Sarkhel, Roy and Mohan. This is an open-access article distributed under the terms of the Creative Commons Attribution License (CC BY). The use, distribution or reproduction in other forums is permitted, provided the original author(s) and the copyright owner(s) are credited and that the original publication in this journal is cited, in accordance with accepted academic practice. No use, distribution or reproduction is permitted which does not comply with these terms.
*Correspondence: Anand Mohan, anandmohan@uga.edu