Autistic individuals show less grouping-induced bias in numerosity judgments
 Antonella Pomè
 Themis Karaminis
 David C. Burr3
- 1Wahrnehmungspsychologie, Institute for Experimental Psychology, Heinrich Heine University Düsseldorf, Düsseldorf, Germany
- 2Department of Psychology, Edge Hill University, Ormskirk, United Kingdom
- 3Department of Neuroscience, Psychology, Pharmacology and Child Health, University of Florence, Firenze, Italy
Introduction: When items are connected together, they tend to be perceived as an integrated whole rather than as individual dots, causing a strong underestimation of the numerosity of the ensemble. Previous evidence on grouping-induced biases of numerosity has shown a dependency on autistic-like personality traits in neurotypical adults, with a weaker tendency for grouping into meaningful segmented objects in individuals with strong autistic traits. Here we asked whether this result would generalize to the autistic population.
Methods: Twenty-two adults with a diagnosis of Autism Spectrum Disorder (ASD) and 22 matched neurotypical controls judged the numerosity of clouds of dot-pairs connected by thin lines.
Results: Results showed no significant group difference in discrimination precision, suggesting that both groups were equally capable performing the task. However, while connecting pairs of dots at moderate numerosities caused large changes in apparent numerosity in the neurotypical controls, particularly those with low autistic-like traits, it had little effect in the group of autistic participants, suggesting significant differences in numerosity estimation between autistic and neurotypical perception. Consistent with earlier studies, the magnitude of the effect covaried strongly with AQ-defined autistic traits in the neurotypical range, reinforcing the idea that autistic traits predict the strength of grouping.
Discussion: These results provide strong support for the theories of autistic perception that highlight dissimilarities in global vs. local processing, and open the door to study grouping mechanisms indirectly, by asking participants to report on the apparent numerosity rather than on the grouping organization per se.
Introduction
There has been much interest over the past years in using visual illusions to explore atypicalities in sensory processing across multiple domains. Visual illusions exploit unique arrangements of stimulus features that create erroneous perception, which can help clarify the processes by which the brain combines stimulus properties to form a coherent visual percept, often termed a gestalt. A particularly valuable visual illusion, used to specify perceptual mechanisms associated with quantity estimation, is the connectedness illusion. Items, such as circles or squares, grouped together by thin lines appear to be less numerous (1–5). The illusion has been demonstrated to be effective when connecting the pairs with illusory rather than physical lines (6, 7).
This suggests that numerosity operates on segmented objects defined by global grouping properties, rather than on individual local elements. The effect of grouping is significantly reduced when the items are densely packed (3), suggesting that the effect is restricted to the numerosity range of segregable items. It also affects fMRI responses to numbers (8), adaptation to numbers (9), pupillometry (10), and the dependencies on attentional processes (4). The illusion has been widely explored in neurotypical adults, with both psychophysical and neurophysiological techniques, and recently has been demonstrated that the susceptibility to the illusion extends to non-human animal species (11).
The connectedness illusion has the advantage of tapping grouping mechanisms indirectly, without requiring participants to be aware of and report directly the perceptual organization. This is of critical importance, especially for children and clinical populations, where an indirect measurement may help bypass various cognitive biases or ambiguities in instructions. Judgement of numerosity, on the other hand, is very intuitive and spontaneous (12), making them ideal for clinical testing. Furthermore, there is much evidence that numerosity perception is spontaneous, triggering express saccades (13) and eliciting spontaneous pupillary responses (10).
We have recently demonstrated that the magnitude of the connectedness effect varies with the perceptual style of participants: those scoring high on the self-reported Autism Spectrum Quotient questionnaire (AQ) showed a reduced illusory effect compared with participants with lower autistic traits. This is in line with theories that have linked autism to increased propensity to focus on local object features over global context (5).
Encouraged by our previous finding, we test here the hypothesis that individuals on the Autism Spectrum, as well as neurotypical adults with higher autistic symptom severity, will be less prone to automatically group the connected dots into a single item to reduce overall numerosity. This result is predicted by several theories of visual processing in ASD, including theories that highlight a preference for local stimulus features (14, 15), weakened processing of central coherence (16, 17), or reduced weight of prior experiences to the processing of incoming sensory data (“hypo-priors”) (18).
After replicating our previous results (5) on a large group of neurotypical adults with various degrees of autistic traits as measure with the Autism Spectrum Quotient questionnaire (experiment 1), we measured numerosity discrimination in response to the connectedness illusion for two groups of adults: one group of autistic people and one of neurotypical participants matched by age and IQ (experiment 2). The results show that the group with autism (like the neurotypical adults with high autistic traits) had less susceptibility to the illusion, resulting in a less underestimation of numerosity. Our observation supports the hypothesis of weaker propensity for active grouping strategies into meaningful segmented objects in autism.
Methods
Participants
In Experiment 1, 43 neurotypical adults [39 females; age (mean ± SD): 19.12 ± 2.29], who reported that they did not have a diagnosis of any neurodevelopmental condition, took part. These participants were first-year undergraduate psychology students, who completed the study for credit.
These participants were assessed on their autistic symptomatology based on the Autism Spectrum Quotient (19), a self-report questionnaire consisting of 50 questions which prompt participants to read a statement and selected the degree to which the statement best described them: “strongly agree,” “slightly agree,” “slightly disagree,” and “strongly disagree”. We used the standard dichotomous scoring algorithm, which adds 1 point to a Total score when a participant's response is suggestive of an autism trait (slightly or strongly agree/disagree depending on positive or negative framing) and 0 points otherwise. Total scores ranged between 6 and 48, with higher scores indicating higher degrees of autistic traits. Almost all participants scored below 32, the threshold above which a clinical assessment is recommended (20). Three were above this threshold, but they did not report an autism diagnosis. AQ scores had a median of 18 (with lower and upper quartiles of 14 and 22.5). The median was used to divide participants into a low- and a high- AQ score group. The demographic characteristics of the two groups are shown in Table 1.
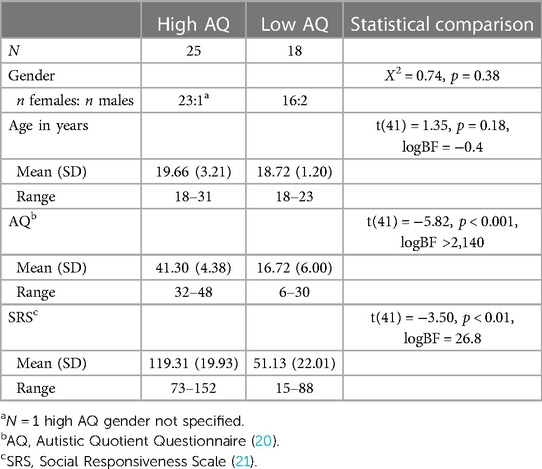
Table 1. Mean (standard deviations) in each group of participants; the last column gives the comparison between the two groups of neurotypical adults with various degrees of autistic traits.
For experiment 2, we recruited twenty-two autistics from an autism charity research support network (Autistica Discover Network). These were matched on age and gender and cognitive ability (p > 0.4) with a group of 22 neurotypical adults recruited from community contacts and selected from an initial larger pool of 27 neurotypical participants. The demographic characteristics of the two groups are shown in Table 2.
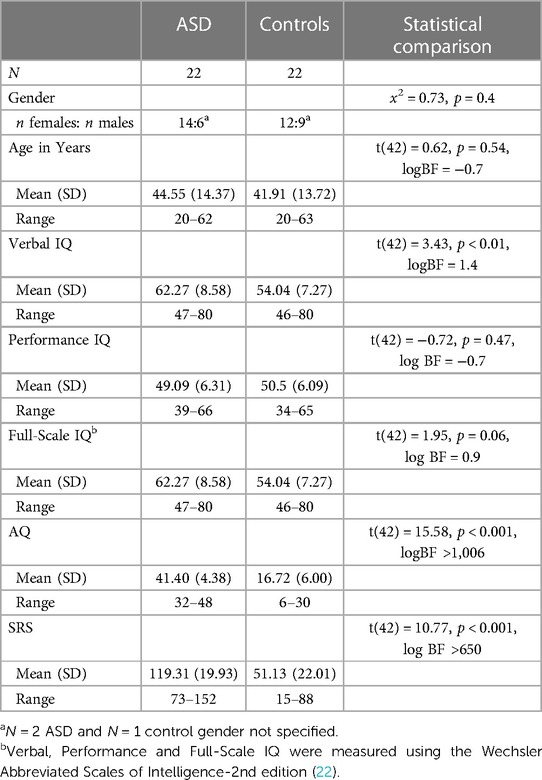
Table 2. Mean (standard deviations) in each group of participants; the last column gives the comparison between the autistic and non-autistic group of participants.
All autistic and neurotypical participants in Experiment 2 completed the AQ, as well as Social Responsiveness Scale—Second Edition (21) as a second measure of autistic symptomatology. The SRS-2 asks participants to rate 65 statements relative to their behavior over the past 6 months by ranking the items from 1 “not true” to 4 “almost always true.” The raw scores were calculated and converted to T-scores.
All autistic participants scored above the threshold above which a clinical assessment is recommended in both the AQ and the SRS-2 (three participants were excluded from the study for this reason), while all neurotypical participants scored below those thresholds. As expected, in Experiment 2, the autistic group obtained significantly higher AQ (mean (SD) = 41.40 (4.38)) and SRS-2 scores (mean (SD) = 119.31 (19.93)) compared to the non-autistic group (AQ: mean (SD) = 16.72 (6.00), SRS-2: mean (SD) = 51.13 (22.01)), p < 0.001.
For participants in experiment 2, cognitive ability was also measured using the Wechsler Abbreviated Scale of Intelligence—Second edition (WASI-II; 22). We obtained a full-scale IQ (FSIQ- 2) measure, based on the Vocabulary task (yielding a verbal comprehension index, VCI), and the Matrix reasoning task (perceptual reasoning index, PRI) raw scores were converted to T-scores. An independent-samples t-test revealed no significant group differences for FSIQ-2 and PRI, although autistic participants reported a significantly higher performance in VCI compared to controls.
Participants were instructed to complete the session online from a computer in a quiet, distraction-free environment. All participants completed informed consent forms prior to any testing and the experimental procedure was approved by the Science Research Ethics Committee of Edge Hill University (SREC ETH2021–0210). After completion of the informed consent form and the demographic questionnaire, participants were directed to complete the numerosity discrimination tasks through the Pavlovia repository and launch platform (www.pavlovia.org). Instructions were presented in full-screen mode to minimize distractions. Task instructions were delivered to participants as on-screen text. After the experiment was finished, participants were provided with a link to a Qualtrics data collection pipeline that administered the AQ, and the SRS, and at the end they received feedback and compensation (£12 Amazon/John Lewis gift voucher). The WASI-II was administered to participants of experiment 2 separately by the experimenter.
Stimuli and procedure
The task was designed in PsychoPy and administered online via Pavlovia.com. Grouping-induced changes to apparent numerosity were measured by two alternative forced choice (2AFC) numerosity discrimination. Participants were presented with 2 clouds of dots asked to report by mouse press just after stimulus disappearance which of the two stimuli appeared to be more numerous, guessing when uncertain (see Figures 1A,D). Stimuli were presented simultaneously at 8° eccentricity left and right of a fixation cross for 500 ms, too fast for single elements to be serially countable. Stimuli were clouds of small disks of 2.5 mm diameter (subtending 0.25° at 57 cm), half-white, half-black (so luminance did not vary with number, eliminating a potential cue). One of the two dot clouds was the reference (randomly left or right), which had fixed numerosity throughout the experimental session; the other was the probe, which varied in numerosity, guided by a staircase procedure in which the numerosity of the probe was reduced or increased according to the participant's performance. The reference numerosity could show either moderate (N15) or large (N100) numerosities, depending on the session.
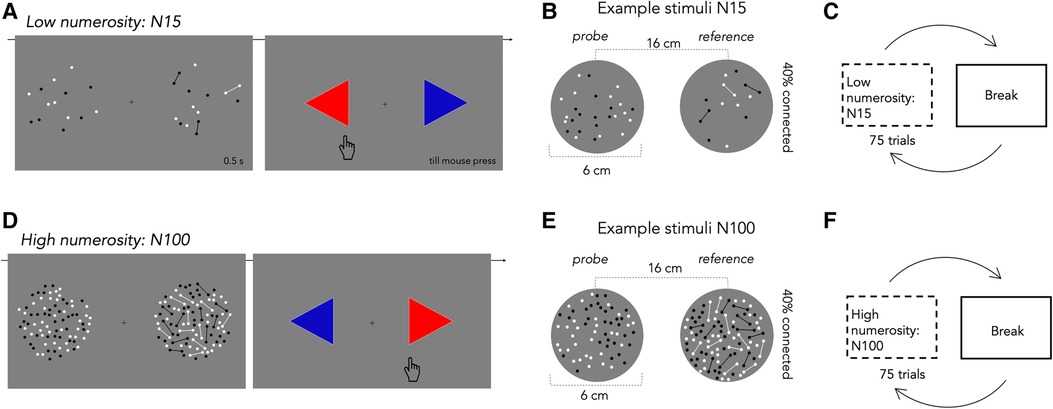
Figure 1. Paradigm and example stimuli used. (A) Schematic illustration of one trial in the low numerosity session (N15): two dot clouds were displayed together for 500 ms. After stimulus disappearance, participants indicated which seemed more numerous, pressing the appropriate arrow on the screen. The next trial with the same characteristics then started, after mouse press. (B) Example stimuli showing the fixed numerosity reference, with 40% dots connected by thin lines, and the probe varying in numerosity. Each cloud was presented in the periphery at 8 deg of eccentricity from the central fixation cross. (C) Participants completed 2 sessions of 75 trials, separated by breaks. (D–F) Same as in (A–C) but for high numerosity (N100). The two clouds of dots to be discriminated comprised either isolated dots (probe, varying in numerosity) and a fixed-numerosity reference of 100 elements. As before, in total 150 trials were tested.
To study grouping mechanisms, 40% of dots in the reference cloud were connected to neighboring dots to create dumbbell-like shapes (reference cloud, see Figures 1B,E). For patches containing isolated dots (probe cloud, Figures 1B,E), dot positions were generated on-line to respect the sole condition that two items could not be closer than 2.5 mm (0.25°), preventing dot overlap. For the connected patterns, dot position was calculated in two stages: first couples of dots (40% of the total dots of the reference stimulus) were cast and connected via a line of the same color, with the constraints that line length was between 10 and 15 mm, with no lines crossing; in the second stage, the remaining 60% of dots were cast with the constraint of not overlapping either the other dots or the connecting lines. The connector line width was 0.5 mm.
Participants completed 2 blocks of 75 trials (see Figures 1C,F) in each session (moderate numerosity N15 and large numerosity N100). The 2 sessions were separated by 4 breaks (2 in each session). The experiment could be resumed by button press. On average, the experiment took 40 min.
Data analysis
Data were analyzed separately for each participant. For each reference numerosity (N15 and N100), the responses were plotted as function of the probe numerosity and fit with a cumulative Gaussian distribution, whose median defines the PSE and the difference in numerosity between 50% and 75% correct responses defines the JND, a measure of precision. The JND divided by the perceived numerosity yields the Weber fraction (WF), a dimensionless index of imprecision that allows comparison of performance across numerosities. The PSE of each participant was used to compute the percent bias for each numerosity:
Our main analyses compared data across groups of participants: standard t-tests and correlation analyses were complemented with Bayes factor estimation.
Bayes Factors (23) quantify the evidence for or against the null hypothesis as the ratio of the likelihoods for the experimental and the null hypothesis. We express it as the ratio, where negative numbers indicate that the null hypothesis is likely to be true, positive that it is more likely false. By convention, absolute Bayes factors >3 are considered substantial evidence for either the alternate or null hypothesis, >10 strong evidence, and >100 decisive.
Results
Experiment 1: grouping strategies in neurotypical adults
We asked participants to discriminate which of two simultaneously presented dot patterns — reference and probe — appeared to be more numerous. The variable probe was always a pattern of isolated dots, while the constant reference comprised dots connected by thin lines, which produces a strong numerosity illusion. Figure 2A shows example psychometric functions for moderate numerosity (N15), for two participants with low (light blue) and high (dark blue) AQ. The functions plot the proportion of trials where the probe appeared more numerous than the reference (N15) as a function of probe numerosity tested. As expected, connecting 40% of dots led to a robust underestimation of the probe numerosity, but only for the low AQ group, around 27% less than the physical numerosity, agreeing with previous literature (1, 2, 6, 3). However, the point of subjective equality (PSE, median at 50%) in the high AQ example participant was very near the physical numerosity of the reference (N15), showing less underestimation of the numerosity tested.
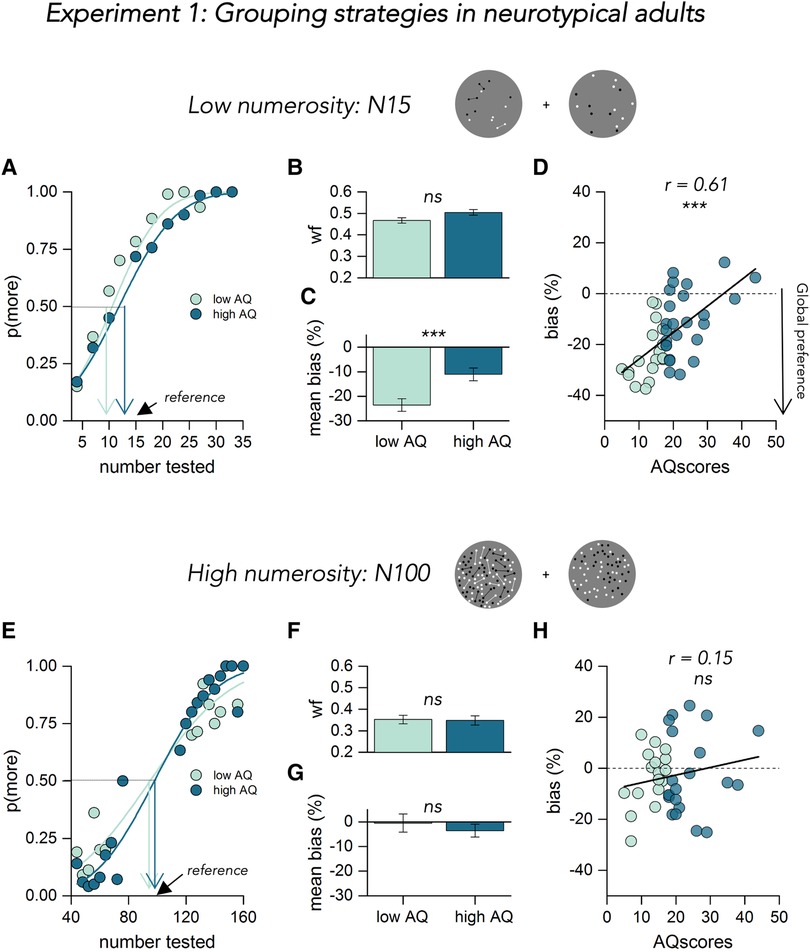
Figure 2. Results of experiment 1. (A) Psychometric functions for 2 example participants with low (light blue) and high (dark blue) autistic traits at low numerosity (N15). The functions plot the proportion of trials where the probe appeared more numerous than the reference, as function of probe numerosity (shown in the abscissa). The vertical colored lines show the estimates of the PSE, given by the median of the fitted cumulative Gaussian functions. (B) Mean Weber fraction for discriminating numerosity for low (light blue) and high (dark blue) AQ. Error bars = ±1 SEM. Significance values refer to two-sample T-test (ns p > 0.5). (C) Mean response bias (expressed as percentage difference from the reference number) color coded as in (B) significance values refer to two-sample T-test (***p < 0.001). (D) bias, in percentage, at low numerosity plotted against AQ for all participants, color coded according to the median split of their scores. Text insets report Pearson's r and associated p-value. Thick black lines show the linear fit through the data. (E) Psychometric functions for two example participants with low (light blue) and high (dark blue) autistic traits at high numerosity (N100). Same convention as in (A) (F–H) same convention as in (B–D) but for data of the high numerosity session tested.
From the psychometric functions of each participant, the PSE (bias) and the JND (precision) was extracted. We first made sure that all participants were able to complete the task by checking their precision measures. We found no statistically significant differences in the Weber fraction (JND/perceived numerosity) between our sample of low (light blue) and high (dark blue) autistic traits [t(41) = –1.46, p = 0.08, BF10 = 0.4, Figure 2B]. Moreover, very similar results were obtained when we measured precision as Coefficient of Variation (JND/physical numerosity) [t(41) = –1.85, p = 0.07, BF10 = 1.18, not shown as a figure].
We then analyzed the susceptibility to the illusion (expressed as a bias index, eqn1) as a function of autistic traits. The underestimation bias decreased with increasing autistic traits, resulting in a strong correlation between biases and AQ (Figure 2D, r = 0.61, p < 0.001, BF10 = 1,394.8). This result was also confirmed by the statistical significant difference between the two groups identified via the median split [t(41) = –3.40, p < 0.001, BF10 = 21, Figure 2C].
The lower panel of Figure 2 shows the results for high numerosity (N100) stimuli. Here, as previously demonstrated (Anobile et al., 2017), the connectedness effect is much reduced. For 100-dot displays the perceived numerosity was for both groups very close to the physical numerosity. Again, both groups had similar precision thresholds (Weber fractions: p = 0.45, BF10 = 0.2, Coefficient of Variation: p = 0.28, BF10 = 0.2, Figure 2F). Here there was no correlation between the magnitude of bias and AQ (Figure 2H, r = 0.15, p = 0.365, BF10 = 0.19), and no significant difference between the average bias of the two groups [Figure 2G, t(41) = –0.62, p = 0.27, BF10 = 0.2].
This pattern of results essentially replicates previous findings (3, 5), showing that grouping objects with thin lines lead to an underestimation of perceived numerosity at moderate but not high densities. Grouping occurs when the objects are sparse enough to permit segregation (N15), but not when the objects are too crowded to permit segmentation of the scene into single units. Moreover, the observed effects are linked to autistic symptomatology in individual participants: the grouping process is weaker in individuals with strong autistic traits, suggesting that there might be a major difference between autistic and typical numerosity perception.
Experiment 2: grouping strategies in adults with and without autism
A group of 22 autistic participants and 22 age- and IQ-matched controls took part in experiment 2. The conditions tested were the same as experiment 1: discrimination of a moderate numerosity (N15) and a high numerosity (N00). We hypothesized that the autistic group would be less prone to the numerosity illusion, resulting in a reduced awareness of the global aspects of stimuli.
The procedure was identical to that described for the neurotypical participants of experiment 1. Figure 3A shows psychophysical functions for three example participants: one with autistic diagnosis and two matched-control participants, with low and high autistic traits. For the matched-control participants at moderate numerosity (N15), the PSE changed from 15 to 9, about 40%, for the participant scoring low for autistic traits and from 15 to 11, about 27%, for the participant scoring high. For the example autistic participant, the PSE changed less, from 15 to 14, about 7%. Figure 3C shows the results averaged over all participants. The average bias in the connected patterns at moderate density was about −5% for the autistic group and increased to −12% for high AQ matched controls, and to −21% for low AQ. We found a main effect of group on the underestimation bias [Figure 3C, F(41, 2) = 3.5, p = 0.03, BF10 = 1.9]. Participants with low autistic symptoms showed a stronger bias compared to the patients (post-hoc comparison: t = –2.61, p = 0.03, BF10 = 3.16). The comparison between ASD patients and all the neurotypical participants was also significant [t(42) = –2.31, p < 0.05, BF10 = 1.99].
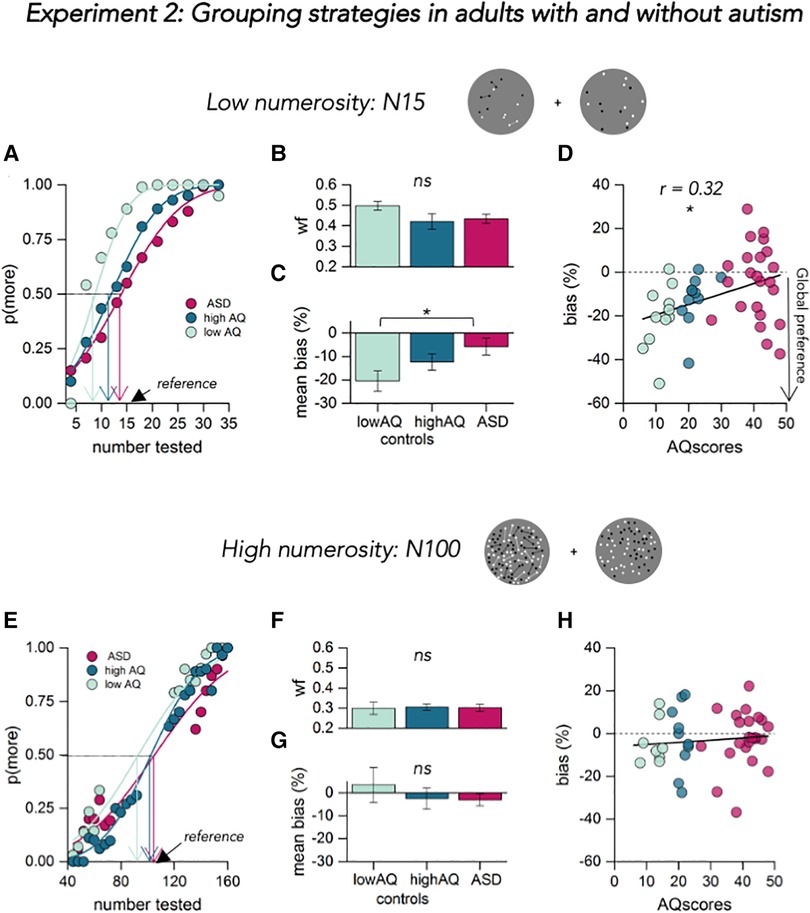
Figure 3. Results of experiment 2. (A) Psychometric functions for 3 example participants (one autistic participant in dark pink and one neurotypical with low autistic traits in light blue and one with high autistic traits in dark blue) at low numerosity (N15). The functions plot the proportion of trials where the probe appeared more numerous than the reference, as function of probe numerosity (shown in the abscissa). The vertical colored lines show the estimates of the PSE, given by the median of the fitted cumulative Gaussian functions. (B) Mean Weber fraction for discriminating numerosity for ASD (dark pink) and controls (light blue and dark blue respectively for low and high AQ). Error bars = ±1 SEM. Significance values refer to two-sample T-test (ns p > 0.5). (C) Mean response bias (expressed as percentage difference from the reference number) color coded as in (B) significance values refer to post hoc T-test (*p < 0.05). (D) Bias, in percentage, at low numerosity plotted against AQ for all participants, color coded as before. Text insets report Pearson's r values and associated p-value. Thick black lines show the linear fit through the data. (E) Psychometric functions for three example participants (color coded as in A) at high numerosity (N100). Same convention as in A. (F–H) Same convention as in (B–D) but for data of the high numerosity session tested.
As with experiment 1, the magnitude of the underestimation bias varied with the autistic quotient of all participants, resulting in a positive relationship between the underestimation effects and AQ (Figure 3D, r = 0.32, p < 0.05, BF10 = 3.17).
The Weber fraction of the participants, given by the SD of the best-fitting Gaussians to the psychometric functions, normalized by the average perceived quantity, is plotted in Figure 3B. The data show similar discrimination precision between the three groups, with no differences between autistics and controls independently of the autism severity [F(41, 2) = 1.44, p = 0.27, BF10 = 2.29], confirming that difference in connectedness effects does not reflect inattention or some other more generic difficulties with judging numerical quantities. This was the same for precision measures expressed as JND/physical numerosity [Coefficient of Variation: F(41, 2) = 1.05, p = 0.35, BF10 = 2.95].
Finally, we probed grouping of the dense (N100) dot-patterns (Figure 3 lower panel). Figure 3E shows the performance in this condition for one autistic and one matched control with various degrees of autistic traits. As before, connecting dots with lines at high numerosities lead to weak underestimation of the connected patch: perceived numerosity of the example participants was very close to the physical numerosity of the stimulus (see arrows, Figure 3E). As with experiment 1, we found no differences in mean precision (Figure 3F, WF: F(41, 2) = 0.014, p = 0.98, BF10 = 5.75, Coefficient of Variation: F(41,2) = 0.3, p = 0.74, BF10 = 4.67) nor in mean underestimation bias [Figure 3G, F(41, 2) = 0.06, p = 0.93, BF10 = 5.12] between autistics and controls. Moreover, participant biases at this numerosity did not change as a function of autistic traits measured by the Autism-Spectrum Quotient, as shown in Figure 3H (r = –0.04, p = 0.823, BF10 = 0.12).
As hypothesized, autistic participants (as well as neurotypical adults with high autistic symptomatology) were less susceptible to the connected numerosity illusion, suggesting that they are less susceptible to grouping effects. This is consistent with their having a more detail-oriented perceptual style (24). Furthermore, all participants showed little grouping at high numerosities, where other perceptual strategies presumably come into play. Indeed, there is considerable evidence that at these higher densities numerosity judgements behave more like texture density discrimination, due to effects similar to visual crowding (25–27).
Discussion
Uniform connectedness has been suggested as a fundamental principle of grouping (28), based on principles such as proximity, similarity, and common fate, first outlined by Gestalt psychologists (29). Specifically, when a region of uniform visual properties is connected, it becomes organized into a single perceptual unit. As here, several studies have shown that connecting dots with lines facilitates grouping, as well as working memory (30). Moreover, spatial regularities and symmetry seem to improve numerosity estimation accuracy (31–33), as well as common color, common faith, and common motion (34, 35).
This study investigated perceptual grouping in autism, using apparent numerosity as an objective measure. The benefit of this technique is to ask participants to report on apparent numerosity of patterns with pairs of adjacent dots connected, rather than on the perceptual organization per se, hence tapping grouping mechanisms indirectly.
We first confirmed our previous results by showing that at low-to-moderate numerosities, connecting pairs of dots caused significant alterations in apparent numerosity for neuro-typical individuals with low but not high AQ. However, at higher densities (N100), where the dots are presumably too “crowded” to be efficiently segregated, so other processes come into play, the connected effect was much reduced (3). This reinforces evidence that at higher numerosities, perceptual judgements behave more like texture density discrimination, due to effects similar to visual crowding (25–27).
The second experiment showed that autistic individuals show weak or non-existent connectedness effects, suggesting a major difference in the role of grouping in autistic and neurotypical numerosity perception, supporting theories of weaker grouping mechanisms in ASD. The magnitude of the grouping effects was predicted by autistic symptomatology, in both the neurotypical participants of experiment 1 and the autistic participants of experiment 2. However, all participants in both experiment 1 and 2 showed no connectedness effect when the items in the scene were too many to permit perceptual grouping. This result, together with the fact that we found no differences in discrimination precision (as expressed by the Weber Fractions) in any of the two experiments, is evidence that connected-dot patterns activate different perceptual strategies in autistics and controls that are very unluckily to reflect a general impairment in numerosity judgments or some sort of inattention.
Our results are in line with theories of autistic perception that highlight differences in local rather than global processing (i.e. 36, 37). In accordance with this view, autistic perception systems would be less prone to spontaneously group the connected dots into a single item, reducing overall numerosity. Two possible, not mutually exclusive, explanations could account for weaker susceptibility to this illusion: an emphasis to individual dots, hence ignoring the lines that connect these objects, or a weaker propensity for active grouping strategies into meaningful segmented objects. In a broader sense, our results are also consistent with a less reliance on contextual information by ASD: contextual information contributes to create a percept, including grouping cues which benefit the segmentation of the scene into objects.
Our conclusions, however, seem to be inconsistent with other recent evidence suggesting intact grouping abilities in shape formation in ASD (38, 39). It is not obvious why the two sets of experiments give seemingly conflicting results, especially as both sets of studies tested grouping indirectly. Perhaps the differences are related to the perceptual tasks used to measure the effect: whereas the above studies measured apparent distance, and used a visual search task, our study relied on measurements of perceived numerosity, which seems to be a basic visual attribute that arises spontaneously (40, 12, 13, 10). This may make it more sensitive, and less prone to compensational strategies, to probe implicit grouping mechanisms. Nevertheless, more research is clearly required to unravel fully the different conclusions of these studies.
The current study shows that numerosity judgments are a good method to investigate grouping mechanisms indirectly by asking participants to report the apparent numerosity of a cloud of dots without relying on subjective measures of whether about grouping or perceptual organization. Subjective reports suffer from many problems, such as the difficulty for participants to understand what exactly is required of them, and the difficulty in comparing results between individuals who may use quite different criteria. The concept of numerosity, on the other hand, is one that participants readily understand and spontaneously respond to (12, 13, 10). All groups of participants, both high- and low-AQ neurotypicals as well as those with ASD, performed the task with similar precision, as shown by the Weber fractions. However, there were clear differences in perceived reduction in numerosity for patterns with connected dot-pairs, implicating strong differences in perceptual style measurable with an online numerosity task, particularly in the activation of grouping mechanisms.
To conclude, the current study provides evidence that autism is associated with clear differences in perceptual styles. The reported differences are consistent with the idea that autistic perception is more local than global, in a sense more “veridical”, taking contextual information less into account, as predicted by recent Bayesian accounts (18).
Data availability statement
The raw data supporting the conclusions of this article will be made available by the authors, without undue reservation.
Ethics statement
The studies involving humans were approved by Science Research Ethics Committee of Edge Hill University (SREC ETH2021-0210). The studies were conducted in accordance with the local legislation and institutional requirements. The participants provided their written informed consent to participate in this study.
Author contributions
All authors contributed to the study concept and to the design. Stimuli were designed by AP. Testing and data collection were performed by TK. AP performed the data analysis. All authors contributed to the interpretation of the results. AP drafted the manuscript and DB provided critical revisions. All authors contributed to the article and approved the submitted version.
Acknowledgments
This research has received funding from the European Union's Horizon 2020 research and innovation program under the Marie Skłodowska-Curie (grant agreement number 101029574– APPROVE “Autistic Perception and the predictive role of visual experience”) to A.P.; and from the European Research Council (ERC) under the European Union's Horizon 2020 research and innovation program, Grant No 832813 (GenPercept) to D.B. We would like to thank the participants for their time to complete this study, Siobhan Hagan and Lucy Wilkinson for their help in data collection, and the Autistica Discover network for their support with recruitment.
Conflict of interest
The authors AP and TK declared that they were editorial board members of Frontiers at the time of submission. This had no impact on the peer review process and the final decision.
The remaining author declares that the research was conducted in the absence of any commercial or financial relationships that could be construed as a potential conflict of interest.
Publisher's note
All claims expressed in this article are solely those of the authors and do not necessarily represent those of their affiliated organizations, or those of the publisher, the editors and the reviewers. Any product that may be evaluated in this article, or claim that may be made by its manufacturer, is not guaranteed or endorsed by the publisher.
References
1. Franconeri SL, Bemis DK, Alvarez GA. Number estimation relies on a set of segmented objects. Cognition. (2009) 113(1):1–13. doi: 10.1016/j.cognition.2009.07.002
2. He L, Zhang J, Zhou T, Chen L. Connectedness affects dot numerosity judgment: implications for configural processing. Psychon Bull Rev. (2009) 16(3):509–17. doi: 10.3758/PBR.16.3.509
3. Anobile G, Cicchini GM, Pomè A, Burr DC. Connecting visual objects reduces perceived numerosity and density for sparse but not dense patterns. J Numer Cogn. (2017) 3(2):133–46. doi: 10.5964/jnc.v3i2.38
4. Pomè A, Caponi C, Burr DC. The grouping-induced numerosity illusion is attention-dependent. Front Hum Neurosci. (2021) 15. doi: 10.3389/fnhum.2021.745188
5. Pomè A, Caponi C, Burr DC. Grouping-Induced numerosity biases vary with autistic-like personality traits. J Autism Dev Disord. (2022) 52(3):1326–33. doi: 10.1007/s10803-021-05029-1
6. Kirjakovski A, Matsumoto E. Numerosity underestimation in sets with illusory contours. Vision Res. (2016) 122:34–42. doi: 10.1016/j.visres.2016.03.005
7. Adriano A, Rinaldi L, Girelli L. Visual illusions as a tool to hijack numerical perception: disentangling nonsymbolic number from its continuous visual properties. J Exp Psychol Hum Percept Perform. (2021) 47:423–41. doi: 10.1037/xhp0000844
8. He L, Zhou K, Zhou T, He S, Chen L. Topology-defined units in numerosity perception. Proc Natl Acad Sci USA. (2015) 112(41):E5647–5655. doi: 10.1073/pnas.1512408112
9. Fornaciai M, Cicchini GM, Burr DC. Adaptation to number operates on perceived rather than physical numerosity. Cognition. (2016) 151:63–7. doi: 10.1016/j.cognition.2016.03.006
10. Castaldi E, Pomè A, Cicchini GM, Burr D, Binda P. The pupil responds spontaneously to perceived numerosity. Nat Commun. (2021) 12(1):5944. doi: 10.1038/s41467-021-26261-4
11. Lõoke M, Marinelli L, Agrillo C, Guérineau C, Mongillo P. Dogs (canis familiaris) underestimate the quantity of connected items: first demonstration of susceptibility to the connectedness illusion in non-human animals. Sci Rep. (2021) 11(1):23291. doi: 10.1038/s41598-021-02791-1
12. Cicchini GM, Anobile G, Burr DC. Spontaneous perception of numerosity in humans. Nat Commun. (2016) 7(1):12536. doi: 10.1038/ncomms12536
13. Castaldi E, Burr D, Turi M, Binda P. Fast saccadic eye-movements in humans suggest that numerosity perception is automatic and direct. Proc R Soci B Biol Sci. (2020) 287(1935):20201884. doi: 10.1098/rspb.2020.1884
14. Bertone A, Mottron L, Jelenic P, Faubert J. Enhanced and diminished visuo-spatial information processing in autism depends on stimulus complexity. Brain. (2005) 128(10):2430–41. doi: 10.1093/brain/awh561
15. Mottron L, Dawson M, Soulières I, Hubert B, Burack J. Enhanced perceptual functioning in autism: an update, and eight principles of autistic perception. J Autism Dev Disord. (2006) 36:27–43. doi: 10.1007/s10803-005-0040-7
16. Frith U, Happé F. Autism: beyond “theory of mind”. Cognition. (1994) 50(1-3):115–32. doi: 10.1016/0010-0277(94)90024-8
17. Happé FG, Booth RD. The power of the positive: revisiting weak coherence in autism spectrum disorders. Q J Exp Psychol. (2008) 61(1):50–63. doi: 10.1080/17470210701508731
18. Pellicano E, Burr D. When the world becomes “too real”: a Bayesian explanation of autistic perception. Trends Cogn Sci (Regul Ed). (2012) 16(10):504–10. doi: 10.1016/j.tics.2012.08.009
19. Ruzich E, Allison C, Smith P, Watson P, Auyeung B, Ring H, et al. Measuring autistic traits in the general population: a systematic review of the autism-Spectrum quotient (AQ) in a nonclinical population sample of 6,900 typical adult males and females. Mol Autism. (2015) 6(1):2. doi: 10.1186/2040-2392-6-2
20. Baron-Cohen S, Wheelwright S, Skinner R, Martin J, Clubley E. The autism-Spectrum quotient (AQ): evidence from asperger syndrome/high-functioning autism, males and females, scientists and mathematicians. J Autism Dev Disord. (2001) 31(1):5–17. doi: 10.1023/A:1005653411471
21. Constantino J, Gruber C. Social responsive scale manual (SRS-2). Los Angeles, CA: Western Psychological Services (2012).
23. Rouder JN, Speckman PL, Sun D, Morey RD, Iverson G. Bayesian T tests for accepting and rejecting the null hypothesis. Psychon Bull Rev. (2009) 16(2):225–37. doi: 10.3758/PBR.16.2.225
24. Happé F, Frith U. The weak coherence account: detail-focused cognitive style in autism spectrum disorders. J Autism Dev Disord. (2006) 36(1):5–25. doi: 10.1007/s10803-005-0039-0
25. Anobile G, Turi M, Cicchini GM, Burr DC. Mechanisms for perception of numerosity or texture-density are governed by crowding-like effects. J Vis. (2015) 15(5):4–4. doi: 10.1167/15.5.4
26. Anobile G, Cicchini GM, Burr DC. Number as a primary perceptual attribute: a review. Perception. (2016) 45(1-2):5–31. doi: 10.1177/0301006615602599
27. Burr DC, Anobile G, Arrighi R. Psychophysical evidence for the number sense. Philos Trans R Soc, B. (2018) 373(1740):20170045. doi: 10.1098/rstb.2017.0045
28. Palmer S, Rock I. Rethinking perceptual organization: the role of uniform connectedness. Psychon Bull Rev. (1994) 1(1):29–55. doi: 10.3758/BF03200760
29. Wertheimer M. “Laws of organization in perceptual forms,” in A source book of gestalt psychology. London, England: Kegan Paul, Trench, Trubner & Company (1938). 71–88.
30. Peterson DJ, Berryhill ME. The gestalt principle of similarity benefits visual working memory. Psychon Bull Rev. (2013) 20(6):1282–9. doi: 10.3758/s13423-013-0460-x
31. Ginsburg N. Effect of item arrangement on perceived numerosity: randomness vs regularity. Percept Mot Skills. (1976) 42(43):663–8. doi: 10.2466/pms.1976.43.2.663
32. Im HY, Zhong SH, Halberda J. Grouping by proximity and the visual impression of approximate number in random dot arrays. Vision Res. (2016) 126:291–307. doi: 10.1016/j.visres.2015.08.013
33. Zhao J, Yu RQ. Statistical regularities reduce perceived numerosity. Cognition. (2016) 146:217–22. doi: 10.1016/j.cognition.2015.09.018
34. Poom L, Lindskog M, Winman A, van den Berg R. Grouping effects in numerosity perception under prolonged viewing conditions. PLoS One. (2019) 14(2):e0207502. doi: 10.1371/journal.pone.0207502
35. Pan Y, Yang H, Li M, Zhang J, Cui L. Grouping strategies in numerosity perception between intrinsic and extrinsic grouping cues. Sci Rep. (2021) 11(1):17605. doi: 10.1038/s41598-021-96944-x
36. Simmons DR, Todorova GK. Local versus global processing in autism: special section editorial. J Autism Dev Disord. (2018) 48(4):1338–40. doi: 10.1007/s10803-017-3452-2
37. Turi M, Burr DC, Binda P. Pupillometry reveals perceptual differences that are tightly linked to autistic traits in typical adults. eLife. (2018) 7:e32399. doi: 10.7554/eLife.32399
38. Avraam R, Binur N, Hadad BS. Typical perceptual organization in autism: perceptual grouping and spatial distortion. Autism Res. (2019) 12(11):1623–35. doi: 10.1002/aur.2153
39. Hadad BS, Russo N, Kimchi R, Babineau V, Burack JA. Typical utilization of gestalt grouping cues in shape perception by persons with autism Spectrum disorder. Perception. (2019) 48(12):1175–96. doi: 10.1177/0301006619874681
Keywords: grouping, connectedness, ASD, numerosity, AQ
Citation: Pomè A, Karaminis T and Burr DC (2023) Autistic individuals show less grouping-induced bias in numerosity judgments. Front. Child Adolesc. Psychiatry 2:1202032. doi: 10.3389/frcha.2023.1202032
Received: 7 April 2023; Accepted: 16 August 2023;
Published: 30 August 2023.
Edited by:
David Coghill, The University of Melbourne, AustraliaReviewed by:
Antonio Narzisi, Stella Maris Foundation (IRCCS), ItalyLeo Poom, Uppsala University, Sweden
Bat-Sheva Hadad, University of Haifa, Israel
© 2023 Pomè, Karaminis and Burr. This is an open-access article distributed under the terms of the Creative Commons Attribution License (CC BY). The use, distribution or reproduction in other forums is permitted, provided the original author(s) and the copyright owner(s) are credited and that the original publication in this journal is cited, in accordance with accepted academic practice. No use, distribution or reproduction is permitted which does not comply with these terms.
*Correspondence: Antonella Pomè pome@uni-duesseldorf.de