Applying imaging mass spectrometry to define the N-glycan profiles of co-localized virus and immune cell infiltrates in post-COVID-19 infected lung autopsy tissues
 E. Ellen Jones1†
  Richard R. Drake2†
  James W. Dressman2
  Vaunita Parihar3 Rachel Stubler2
  Elysia Masters1
  Kelly E. Mercer1*
- 1National Center for Toxicological Research (FDA), Jefferson, AR, United States
- 2Medical University of South Carolina, Charleston, United States
- 3Cancer Tissue and Pathology Shared Resource Core, Winship Cancer Institute of Emory University, Atlanta, GA, United States
The current COVID-19 pandemic is characterized by a broad range of disease severity in patients. This diversity in clinical manifestations has complicated our understanding of the SARS-CoV-2 pathogenesis and highlights the significance of an individual’s ability to mount an effective viral immune response. Glycosylation is a common post-translational modification occurring in complex organisms and is imperative for immune cell function. In this study, a combination approach with immunohistochemistry (IHC) and matrix-assisted laser desorption/ionization imaging mass spectrometry (MALDI-IMS) was utilized to determine the spatial distribution of N-glycans and immune cell populations in COVID-19 lung tissues. Tissues from seven SARS-CoV-2, PCR + donors were analyzed. Tissues represented a spectrum of time spent on ventilators which was reflected in their respective viral infection status and lung pathologies. N-glycan distributions in the MALDI-IMS images were then correlated with H&E staining and IHC of SARS-CoV-2 spike protein, CD4, CD8, CD163 and CD11b. Distinct and shared N-glycan signatures were identified in association with specific immune cell types, and their co-localization with the viral spike protein. Additionally, we observed unique patterns of α2,3-linked and α2,6-linked sialic acid glycans that associated with both immune cell populations and fibrotic regions within the tissue architecture. N-glycan MALDI-IMS is an effective tool to further understand tissue-localized immune cell populations in response to emerging viral pathogens such as SARS-CoV-2.
1 Introduction
SARS-CoV-2 infection and its subsequent disease, COVID-19, has resulted in a global pandemic, which has led to more than 566 million confirmed cases and over 6.3 million deaths, as of 18 July 2022 (Ronis et al., 2020). Unlike previous coronavirus outbreaks, i.e., SARS-CoV-1 (2002-2003) and MERS-CoV (2012), the current pandemic is characterized by a range of disease severity in patients. Disease may present as a mild respiratory infection, or progress to pneumonia and acute respiratory distress syndrome (ARDS) (Sun et al., 2020; Wu et al., 2020). Studies show that viral entry is mediated by the binding of the viral spike glycoprotein to the host angiotensin-converting enzyme-2 (ACE-2) receptors. ACE-2 receptors is widely expressed on lung cells and many other vital organs including the heart, liver, kidney, brain, gastrointestinal tract, and reproductive tissues. Consequently, COVID-19 lung infection can progress into a systemic illness known as multiple organ dysfunction syndrome (MODS) (Gupta et al., 2020; Robba et al., 2020), which is associated with a prolonged systemic inflammatory response, called a cytokine storm or cytokine release syndrome (CRS). It is hypothesized that the local, tissue immune response mounted against SARS-CoV-2 infected tissues contributes to CRS, further promoting organ injury and quickly advancing ARDS and MODS, with a fatal outcome in some patients (Kuba et al., 2006; Alexandre et al., 2020). Although studies assessing CRS and its impact on COVID-19 disease progression are numerous, most research is focused on the identification of serum leukocytes, monocytes, and antibodies as biomarkers indicative of disease infection or progression. While serum biomarker studies are needed, they fail to address the impact of CRS on the tissue microenvironment and primary organs of infection leaving key immune cell subsets and/or phenotypes involved in disease progression uncharacterized. Thus, additional studies are required to determine the role of these immune cell populations in COVID-19 infection. (Gupta et al., 2020; Robba et al., 2020; Wang et al., 2020).
Glycosylation is a post translational modification which produces glycosidic linkages of sugars to other saccharides, lipids, or proteins. Carbohydrates can be covalently attached to proteins, usually linked via an amino group on asparagine (N-linked glycosylation) or hydroxyl groups of serine or threonine (O-linked glycosylation). Most eukaryotic cell surface proteins are modified by N-linked glycans, which are key mediators in immune functions including pathogen recognition, cell-trafficking, cell differentiation, and inflammation (Afroun et al., 1988; Pereira et al., 2018; Hinneburg et al., 2020). Moreover, changes in surface glycosylation patterns of immune cells, including leukocytes and monocytes, have been linked to aberrant activation (Baum and Cobb, 2017; Li et al., 2018; De Bousser et al., 2020; Radovani and Gudelj, 2022). Notably, the SARS-CoV-2 spike (S) protein is heavily glycosylated with N-linked glycan moieties, similar to other pathogenic enveloped viruses, which mediate viral pathogenesis (Watanabe et al., 2019). Recent work has revealed that loss of N-linked glycosylation sites in the S protein via mutation reduces its ability to bind to the ACE2 receptor, thus reducing viral entry into cells (Casalino et al., 2020). Additionally, the presence or absence of N-linked sialic acids on the cell surface, linked as either α2,3 or α2,6 isomers, may alter SARS-CoV-2 accessibility to hACE2 receptor and entry into the host cell (Wielgat et al., 2020). While glycosylation is known to be involved in modulating the immune response post infection in COVID-19 tissues, these specific cell subsets and their N-linked glycan signatures have never been identified in relation to virus infected tissues.
Matrix assisted laser desorption ionization imaging mass spectrometry or MALDI-IMS is an innovative approach utilized to gain spatial information at tissue resolution on a variety of analytes (Spraggins et al., 2019; Scupakova et al., 2020). N-linked glycan IMS has evolved in the past 10 years as a new approach in glycobiology for linking specific tissue features with N-glycan structural classes (McDowell et al., 2021a; Blaschke et al., 2021). This method utilizes application of a molecular coating of peptide-N-glycosidase to tissues, to cleave asparagine (N)-linked glycans from their protein carrier. The released N-linked glycans can then be analyzed by MALDI-IMS directly on tissue. Generally, 40 or more individual glycan structures are routinely detected, and when combined with histopathology and immunohistochemistry (IHC), region-specific glycans can be correlated with specific tissue features (Clift et al., 2021; Rujchanarong et al., 2021).
In this study, N-glycan MALDI-IMS was applied to human lung autopsy tissues collected from SARS-CoV2 positive and negative patients to examine the qualitative abundance and spatial distribution of N-linked surface glycans in SAR-CoV-2 infected cells and various immune cell populations, Serial FFPE-tissue sections from donors were prepared from the peripheral lung and used for N-glycan IMS analysis. The lung tissues from donors who died after SARS-CoV2 infection represented a spectrum of time spent on ventilators which was reflected in their respective viral infection status and lung pathologies. N-glycan distributions in the MALDI IMS images were then correlated with H&E staining and tissue IHC of SARS-CoV2 spike protein, CD4, CD8, CD163 and CD11b. Distinct and shared N-glycan signatures were identified in association with specific immune cell types and their co-localization with viral spike protein.
2 Materials and methods
2.1 COVID-19 autopsy tissue sample collection
Formalin-fixed lung autopsy tissues, collected from RT-PCR confirmed SARS-CoV-2 positive (N = 7) and SARS-CoV-2 negative patients (N = 6) from April through October 2020, were obtained from Emory Research University Hospital (Atlanta, GA). Lung sections were formalin fixed and paraffin embedded according to standard protocols; 1 mm thin lung sections were placed into tissue cassettes and left to fixe in formaldehyde for 24 h followed by tissue processing and embedding. The slides utilized for the project were White Charged/Plus+, 90°Corners purchased from PathSupply (Catalog #10200WH). Plus, slides are made by a process that places a permanent positive charge on the slide. Tissue sections and cytological preparations adhere better to Plus glass slides without the need for labor intensive special adhesive or protein coatings. SARS-CoV-2 positive patient demographics are presented in Table 1.
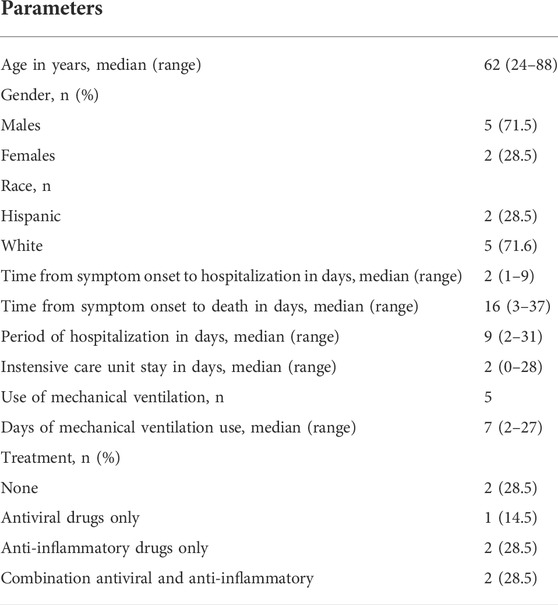
TABLE 1. Summary of demographic and clinical characteristics of COVID-19 autopsy cases.
2.2 Tissue sectioning and immunohistochemistry
Tissue sectioning and antibody staining was conducted by the Cancer Tissue and Pathology share resource of Winship Cancer Institute of Emory University. Formalin-fixed, paraffin-embedded lung tissues sections were cut to a 5-μm thickness and air-dried. Unstained sections were processed as follows; sections 1, 2 were assigned for MALDI-IMS, sections 3, 4 were assigned for IHC using anti-SARS-CoV-2 spike antibody (clone 1A9, GeneTex, 1:250), section 5 for human anti-Cd11b staining (Abcam, 1:4,000), section 6 for human anti-CD163 (Abcam, 1:500) staining, section 7 human anti-CD4 (Abcam, 1:500) staining, and section 8 human anti-CD8 (Abcam, 1:250). Chromogenic IHC was performed using Ventana DISCOVERY Ultra automated immunohistochemistry stainer (Ventana Medical Systems, Tuscon, AZ). Slides were deparaffinized with EZ-Prep (catalog# 05279771001,Ventana) and then were antigen retrieved for 40 min with CC1 reagent (catalog#950-500, Ventana). Rabbit or mouse antibodies were applied and incubated for 40 min. DISCOVERY OmniMap anti-Rb HRP or DISCOVERY OmniMap anti-Ms HRP was applied and incubated for 12 min and the detection was completed in combination with DISCOVERY ChromoMap DAB kit, as per manufacturer recommendations. Slides were counterstained with hematoxylin for 12 min. Slides were then dehydrated, cover-slipped, and evaluated by light microscopy. Stained sections were scanned, and digital images obtained with the Aperio Scanscope System (Lecia Biosystems, Vista, CA). Initially, CD11b+, CD163+, CD8+ and CD4+ cells were evaluated using the whole tissue automatic analysis and the positive pixel algorithm (Aperio Scanscope System) for COVID-19 positive and COVID-19 negative lung tissues. A secondary analysis was also conducted for Spike-positive cells and immune cells positive for CD11b, CD163, CD8 or CD4 using regional automatic analysis of defined regions of interest (ROI) and using the positive pixel algorithm. Input parameters for the positive pixel count algorithm are the following: View Width, 1,000; View Height, 1,000; Overlap Size, 0; Image Zoom, one; Mark-up Compression Type, same as processed image; Compression quality, 30; Classifier Neighborhood, 0; Classifier, None; Class List, none; Hue Value, 0.1; Hue Width, 0.5; Color Saturation Threshold, 0.242; Iwp (High), 220; Iwp (Low) = Ip (High); 175, Ip (Low) = Isp (High), 100; Isp (Low), 0; Inp (High), -1. The aforementioned values were used for analysis for Spike protein and immune cell staining; with the exception of CD11b, which had the following input parameter changed, Color Saturation Threshold: 0.04 . For each marker, total cell counts are expressed as strong positive pixel counts normalized to tissue area (mm2) for both the whole tissue and regional ROI automatic analysis presented.
2.3 Tissue preparation for MALDI-IMS
A standardized protocol was used for tissue preparation, enzymatic digestion, and matrix application by a solvent sprayer (Powers et al., 2014; Drake et al., 2018). Tissue slides were dewaxed in using heat and a series of xylene washes, and then rehydrated in a gradation of EtOH and water washes before antigen retrieval with citraconic anhydride buffer (25-μl citraconic anhydride, 2-μl 12 M HCl, 50-ml HPLC-grade water, pH 3.0 ± 0.5) for 30 min in a decloaking chamber at 95°C. Fifteen passes of PNGase F PRIME™ (N-Zyme Scientifics, Doylestown, PA) at 0.1 μg/μl was then sprayed onto the slides at a rate of 25 μl/min with a 3-mm offset and a velocity of 1,200 at 45°C and 10 psi using an M5 TM Sprayer (HTX Technologies LLC, Durham,NC). Tissue slides were then incubated at 37°C for 2 h in prewarmed humidity chambers followed by desiccation before matrix application. 10 passes of 7 mg/ml CHCA matrix in 50% acetonitrile/0.1% TFA was applied to the desiccated slides at 0.1 ml/min with a 2.5-mm offset and a velocity of 1,300 at 80°C and 10 psi using the TM Sprayer. After matrix application slides were desiccated until analysis by MALDI quadrupole time-of-flight mass spectrometry (MALDI–QTOF MS) (Bruker, Billerica, MA) on a Bruker timsTOF fleX instrument with a 10-kHz Smartbeam 3D laser in positive ion mode in the mass range m/z 500-4,000. A spot size of 20 μm was used to detect released N-glycans with spatial resolution fo 40 μm raster. As per McDowell et al. (McDowell et al., 2021b), 300 laser shots per pixel were collected with a pre-TOF ion-transfer time of 125 μs, a prepulse storage time of 25 μs, a collision radio frequency of 4,000 Vpp, a multipole radio frequency of 500 Vpp and a collision cell energy of 15 eV. Post analysis, whole-tissue slides were H&E-stained and annotated for histological classification by a pathologist. For data processing, average under the peak intensity values and images of N-glycan distributions in each tissue overlayed with IHC images was done using SCiLS Lab software (version 2022b, Bruker, Billerica, MA). Co-registration of MALDI images with histopathology was done using SCiLS. N-glycan spectra were normalized to total ion count (ICR Noise Reduction Threshold = 0.95) and matched within ±5 ppm against a database of known N-glycans (McDowell et al., 2021b). Structure cartoons and compositions were generated using GlycoWorkbench and GlycoMod for annotation (Damerell et al., 2015). Reported N-glycan structures are compositionally accurate as determined by accurate mass and prior structural characterizations by MALDI-TOF-MS/MS (McDowell et al., 2021b).
2.4 Sialic acid stabilization
A subset of tissues was treated with a modified deamidation-amidation reaction to stabilize sialic acid containing N-glycans prior to N-glycan imaging (Holst et al., 2016). This treatment introduces a dimethylamine group to sialic acids linked in α2,6 configurations, resulting in a mass shift of 27 Da. The original method was modified by using propargylamine as a second amidation reactant, which introduces a mass shift of 37 Da into sialic acids linked in α2,3 configurations.
2.5 Statistical analysis
All the statistical analyses presented were performed on log2-transformed data using GraphPad Prism version 8.3.1. Total immune cell count comparisons between COVID-19 positive and COVID-19 negative tissues were conducted using an unpaired, two-tailed, Student’s t-test. Total Spike+ and immune cell count comparisons within regional ROI were conducted using a One-way ANOVA followed by Student-Newman-Keuls post hoc analysis.
3 Results
3.1 Digital quantification of immune cell staining in whole tissue images
Immunohistochemistry was carried out on COVID-19 positive and negative lung tissues to characterize the immune cell profiles within each tissue and to identify infected SARS-CoV-2 cells positive for spike glycoprotein staining. CD8+, CD4+, CD11b+ and CD163+ cells were present in both COVID-19 positive and negative lung tissues. When each immune cell marker was digitally quantified for all lung tissues, total positive pixel cell counts for each marker did not significantly differ between COVID-19 positive and negative lung tissues (Table 2). Within the COVID-19 positive cohort, we identified several lung tissues with noticeable, defined regions of immune cell populations not readily observed in the COVID-19 negative tissues (Supplemental Figure S1). Thus, to determine whether specific N-linked glycans correlate to these unique immune cell populations MALDI-IMS analysis was performed on lung tissues from COVID-19 + autopsy donors.
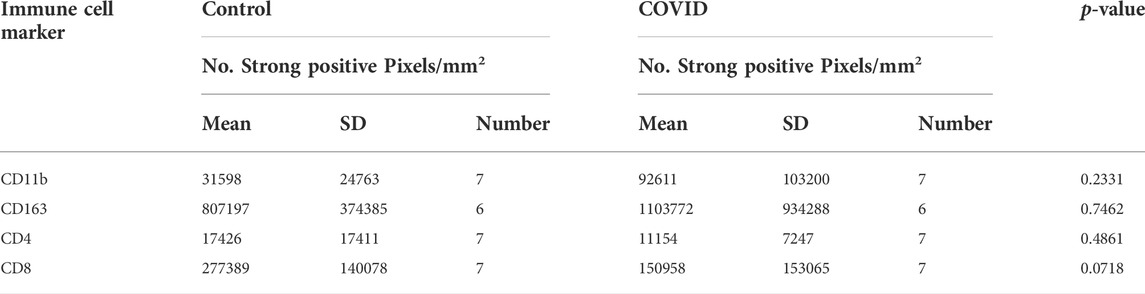
TABLE 2. Summary of immune cell staining in COVID-19 positive and negative autopsy lungs.
Three representative tissues are highlighted: one that had positive staining for spike glycoprotein (17A12) and was treated with remdesivir; one from a donor that was treated with remdesivir and dexamethasone and was on a ventilator for an extended time (66A7); and one with distinct CD11b+ and CD8+ populations that was only in the hospital and on a ventilator for 2 days prior to passing and did not receive either therapeutic intervention (18A9). A list of all glycans identified in specific tissue regions and immune cell populations within these tissues is included in Supplemental Tables S1, 2.
3.2 Complex, fucosylated glycan species associate with CD163+ staining in lung 17A12
Of all the available COVID-19 lung tissues of sufficient quality for analyzing via this approach, only one 17A12, stained positive for spike protein (Supplemental Figure S2). Selected regions of interest (ROI) s positive for spike revealed an intense overlap with CD163. (Figure 1A). When quantified, the positive pixel count of CD163 was10-fold higher than that of Spike staining p < 0.001 (Supplemental Figure S2B). Other immune cells were present in the ROIs. However, differences in positive pixel counts between CD8+ and CD11b+ cells and Spike + cells were insignificant, and the total CD4+ immune cell counts were significantly lower in comparison to Spike + cells. MALDI-IMS analysis revealed several core-fucosylated glycan species which mapped to these regions of CD163-positive and Spike-positive staining. The whole tissue distribution of m/z 2539.902 and m/z 2905.031 is shown in Figure 1B. Interestingly, we observed overlap with the distributions of these two glycans, and other similar tetra-antennary glycans characterized by larger, sialylated and poly-N-acetyllactosamine (LacNAc) extensions with CD163+ staining in 18A9 and 66A7 lung specimens (Supplemental Table S1). However, in 66A7 lung tissue overlap of the two glycans with tetra-antennary glycans in areas of CD163+ staining was less specific (Supplemental Figure S3). Potential causes for this difference may be morphological changes associated with ventilator use (27 days) or therapeutic treatments (e.g., dexamethasone) administered to 66A7. In contrast, 18A9 ventilator use was only 2 days and did not receive therapeutic intervention, and 17A12 only received remdesivir and was never on a ventilator.
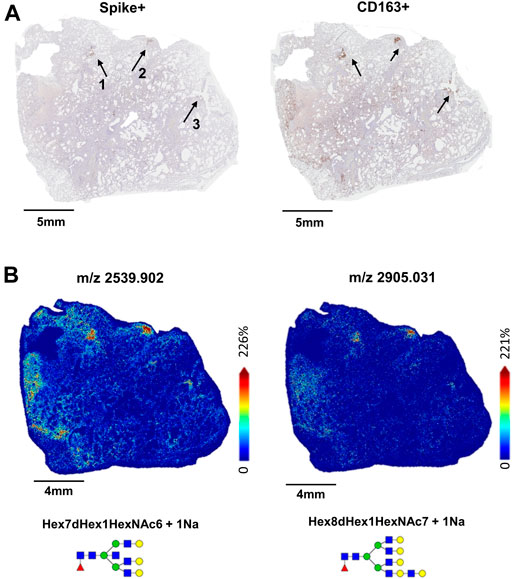
FIGURE 1. Whole tissue Spike+ and CD163+ stained images of 17A12 highlighting ROIs (A) which overlap with MALDI-IMS images depicting the distribution of core-fucosylated, complex glycans m/z 2539.902 and m/z 2905.031 (B). Tissue collected from SARS-CoV-2 positive patient, length of stay 16 days, no ventilator, treatment remdesivir.
3.3 Distribution of N-linked glycans within unique immune cell populations and tissue architecture in lung 17A12
In 17A12, MALDI-IMS revealed other regions marked by unique glycan distributions (Figures 2A,B). As described previously, m/z 2539.906 in blue is associated with the CD163+ regions (Figures 2B,C), while m/z 917.321 in green associated with CD8+ and CD11b+ cells (Figure 2C) indicative of immune cell infiltration. In red, m/z 1850.665 is found in areas of fibrosis (Figure 2D). In addition to m/z 1850.665, other biantennary N-glycans co-localized with fibrosis in 17A12 (Figure 3). Glycans m/z 1,647.582 and 1850.665 distributions also correlated with fibrotic regions within 18A9 and 66A7 (Supplemental Figure S4). Recently, these glycans were identified to associate with fibrotic regions within human non-alcoholic steatohepatitis liver samples (Ochoa-Rios et al., 2022).
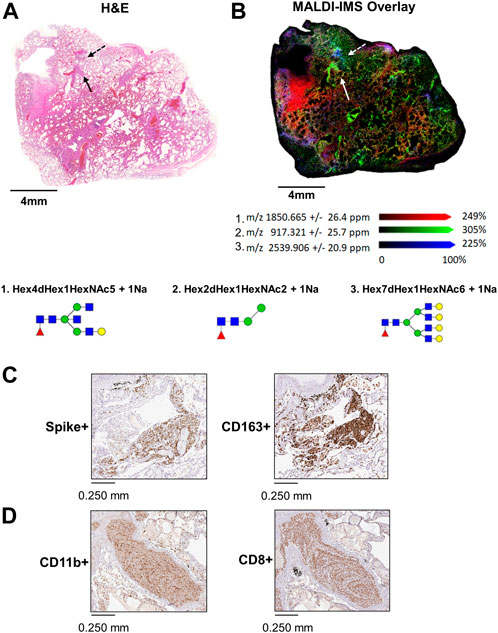
FIGURE 2. Whole tissue H&E image of 17A12 marking a specific region of CD163+/Spike + staining and CD8+ and CD11b+ co-mixtures of immune cells (A). Overlay analysis of three glycans that spatially overlap distinct regions in the lung tissue (B) High magnification images of Spike + staining and CD163+ staining in area designated by the dotted arrow (C), and high magnification images of CD11b+ and CD8+ stained cells in co-mixtures designated by the solid arrow (D). Tissue collected from SARS-CoV-2 positive patient, length of stay 16 days, no ventilator, treatment remdesivir.
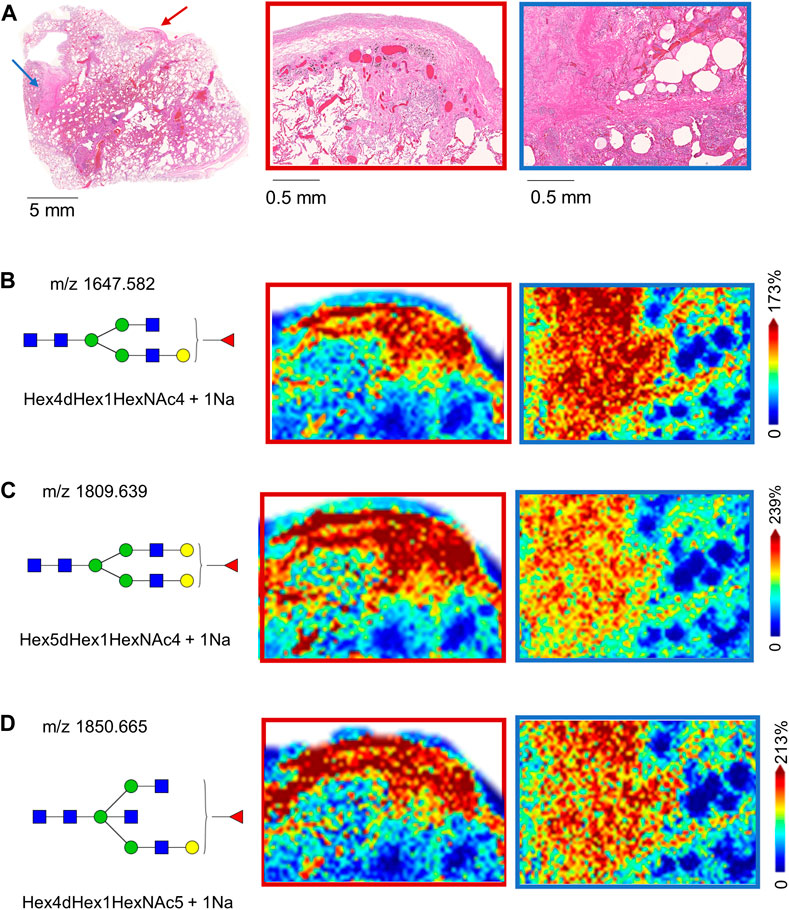
FIGURE 3. H&E-stained image of 17A12 and higher magnification of two fibrotic regions within the tissue marked by arrows (A). MALDI-IMS ion distributions of N-linked glycans across the two fibrotic regions N-linked glycan m/z 1647.586 (B) m/z 1809.639 (C) and m/z 1850.665 (D). Tissue collected from SARS-CoV-2 positive patient, length of stay 16 days, no ventilator, treatment remdesivir.
3.4 Oligomannose glycan species distribute with co-mixtures of CD11b+ and CD8+ infiltrating immune cells in lung 17A12
Within the ROIs specific to immune cell infiltration, quantification of immune cell counts show CD8+ and CD11b+ positive pixel counts were significantly higher in comparison to CD163+ and CD4+ cell counts (Figures 4A,B). Although the CD163+ pixel count was higher than the CD4+ cells, p < 0.05, CD163+ cells did not make up a significant proportion of the total immune cell count (5.5% versus 67% and 27% for CD8+ and CD11b+ cells, respectively). Still, in contrast to the glycan m/z 917.321 (Figure 4C) which localized specifically to these co-mixtures, many other glycans show distribution patterns that overlapped with the CD163+ regions (Supplemental Table S1). Interestingly, oligomannose species, including Man 5, m/z 1,257.423, Man 6, m/z 1,419.477, and Man 7, m/z 1,581.533, which are represented in Figures 4D–F associated with both regions.
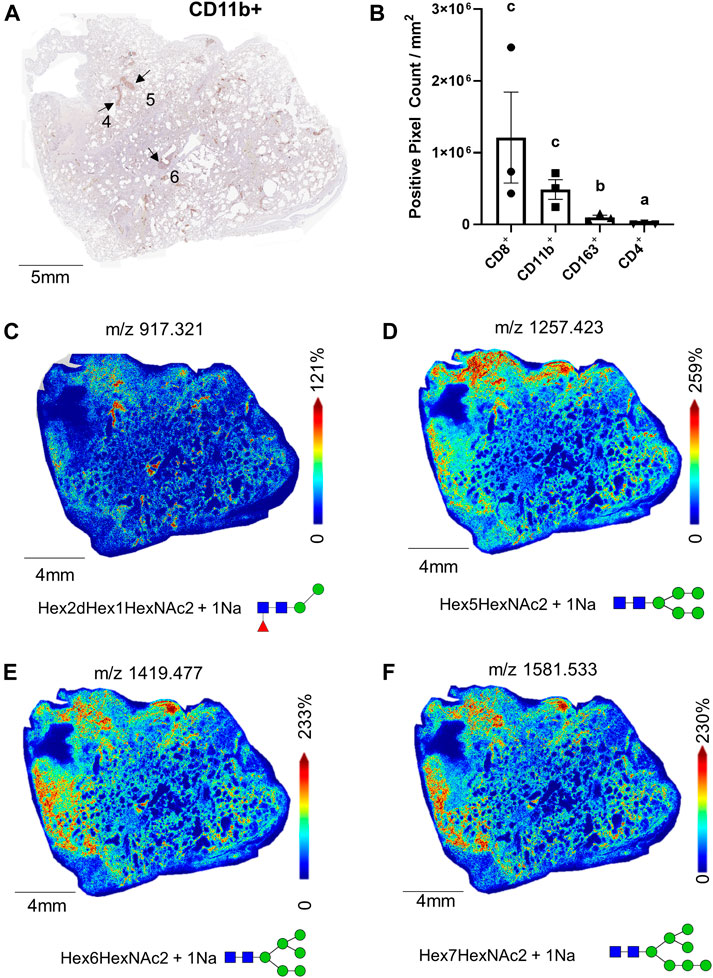
FIGURE 4. Whole tissue CD11b+ stained image of 17A12 marking ROI of immune cell co-mixtures (A); total pixel counts of CD8+, CD11b+, CD163+ CD4+, stained cells from ROI (B), total whole tissue MALDI images showing the spatial relationship of M/Z 917.325 (C), and oligomannose glycans Man 5, m/z 1,257.423 (D), Man 6, m/z 1,491.477 (E), and Man 7, m/z 1,581.533 (F). Data presented as means ± SEM. Significance was determined by One-way ANOVA, p < 0.05, a<b < c. Tissue collected from SARS-CoV-2 positive patient, length of stay 16 days, no ventilator, treatment remdesivir.
3.5 N-linked glycan distributions within co-mixtures of CD11b+ and CD8+ in lung 66A7
Within the 66A7 lung tissue, we observed similar ROIs with co-mixtures of CD11b+ and CD8+ cells (Figures 5A,B). As previously discussed, CD163+ staining was widespread within this tissue (Supplemental Figure S3A), and not surprisingly, CD163+ staining was strong in the co-mixture ROIs. To account for the widespread staining, in Figure 5C, ROI staining intensity was normalized to the whole tissue staining intensity for each immune cell marker presented. Following tissue normalization, the ratio for CD163+ ROI staining, is 1, thus showing no enrichment in the ROIs relative to the whole tissue. Interestingly, we did observe a 3-fold enrichment of CD8+ cells in the ROIs versus the whole tissue. In contrast, CD4+ cells were enriched in the whole tissue versus the ROIs, p < 0.05. MALDI-IMS revealed in this tissue that oligomannose glycan distributions colocalized with ROIs of CD8+ and CD11b+ staining, not CD163+ expression (Figures 5D,E, Supplemental Table S1).
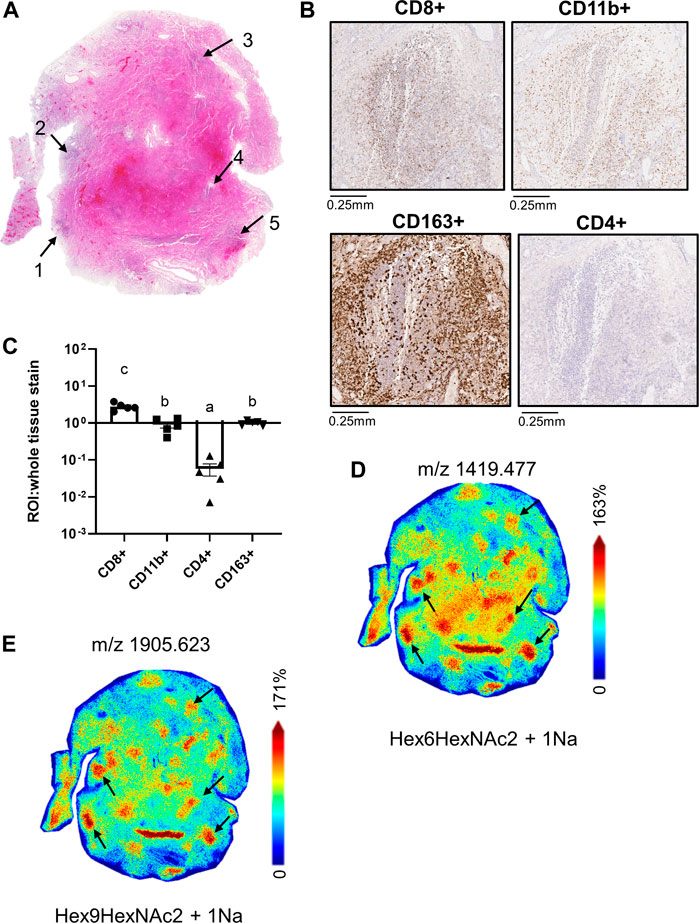
FIGURE 5. Whole tissue H&E image of 66A7 highlighting CD8+ and CD11b+ co-mixture regions (A); high magnification images of CD8+ and CD11b+ staining in Region 4 (B), relative pixel counts of CD4+, CD8+ and CD11b+ stained cells from regions 1-5 (C), whole tissue MALDI images showing the spatial relationship of Man 6, m/z 1419.477 (D) and Man 9, m/z 1905.623 (E). Data presented as means ± SEM. Significance was determined by One-way ANOVA, p < 0.05, a<b<c. Tissue collected from SARS-CoV-2 positive patient, length of hospital-stay 31 days, ventilator 27 days, treatment remdesivir and dexamethasone.
3.6 Distinct co-localized N-glycans in CD8+ and CD11b+ tissue regions of 18A9 lung
In contrast to lungs 17A12 and 66A7, IHC staining revealed distinct regions of CD8+ and CD11b+ cell populations in the 18A9 lung tissue (Figure 6A). Correlation with MALDI-IMS analysis found specific glycans also map to these regions. In Figure 6B two representative glycans, m/z 917.321 and m/z 3052.093 were selected to show the distinct distribution patterns of several glycans with CD11b+ staining (Supplemental Table S1). Structurally, the N-glycans in the CD11b+ region is represented by large branched, sialylated and poly-LacNAc glycans, with the same distinct distribution as those shown in Figure 6B. Similarly, Figure 6C reveals the presence of other glycans, m/z 2304.815 and m/z 2669.953, that have distributions that associate with CD8+ specific regions. The notable structural feature of the N-glycans specific to these CD8+ regions was the presence of a bisecting N-acetylglucosamine (GlcNAc). Those listed in Supplemental Tables S1, 2 had the same distinct distribution as the two N-glycans shown in Figure 6C.
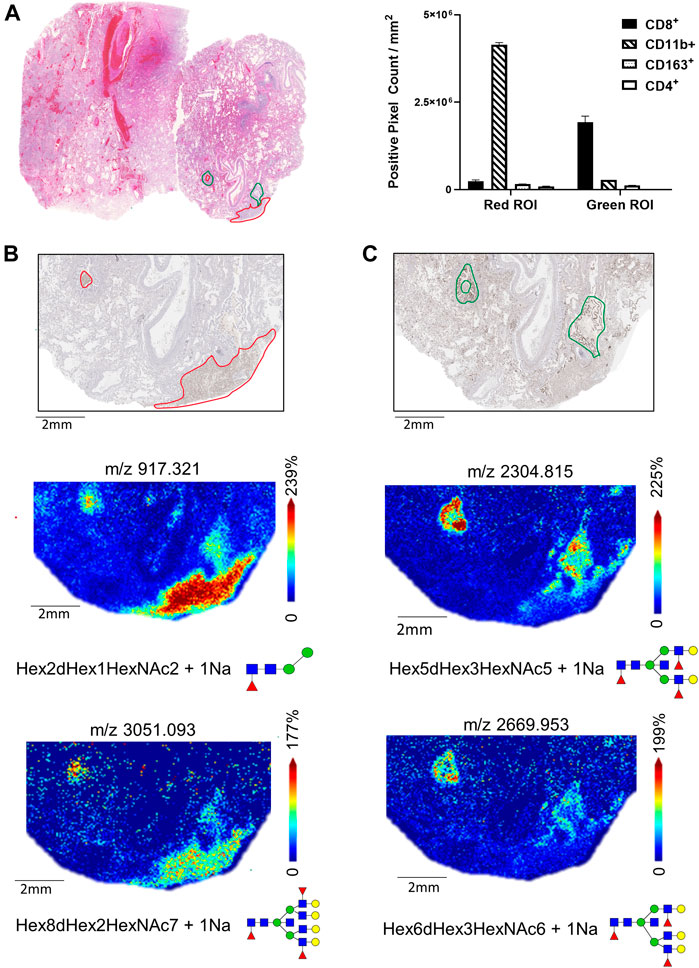
FIGURE 6. H&E-stained section of Lung 18A9 and positive pixel counts for CD11b+, CD8+, CD4+ and CD163+ cells in regions marked in red or green (A). MALDI-IMS distribution of N-linked glycan within the CD11b+ regions (m/z 917.325, m/z 3051.093) (B), and with CD8+ regions (m/z 2669.953, m/z 2304.829) (C)Tissue collected from SARS-CoV-2 PCR postive patient, length of hospital stay 2 days, ventilator 2 days, treatment none.
3.7 Bi-antennary sialylated N-glycans are abundant throughout 18A9 lung tissue
It was observed that much of the normal and fibrotic tissue regions of the autopsy lungs contained an abundance of sialylated biantennary N-glycans. Shown in Figure 7 is an example of this observation in lung tissue 18A9, wherein dimethylamine and propargylamine adducts were chemically introduced to stabilize α2,3 and α2,6 anomeric configurations of sialylated N-glycans. Three sialylated biantennary N-glycan distributions are shown individually (Figures 7A–C) and as a three-color overlay of each species (Figure 7D). The most abundant and widely distributed glycan is a Hex5HexNAc4-α2,6 SA species (Figure 7A). The two single fucosylated versions of this glycan were more localized, with the Hex5HexNAc4Fuc1-α2,3 SA glycan localized to the bronchiolar vessel membranes (Figure 7B), and the Hex5HexNAc4Fuc1-α2,6 SA species adjacent to it (Figure 7C). Each of the three sialylated glycan distributions were overlayed and shown in Figure 7D. Further, the same region highlighted in Figure 6 was visualized for representative N-glycans localized to the CD8+ and CD11b+ regions. Two sialylated species shown in Figures 7B–D were used as background (Figure 7E) to highlight an α2,6 disialylated bisecting GlcNAC N-glycan specific to CD8+ regions (Figure 7F), and a complex α2,6 sialylated glycan in the CD11b+ region. The sialylated N-glycans highlighted in the CD8+ and CD11b+ regions of tissue 18A9 (Supplemental Tables S1, S2) were predominantly detected in α2,6 configurations.
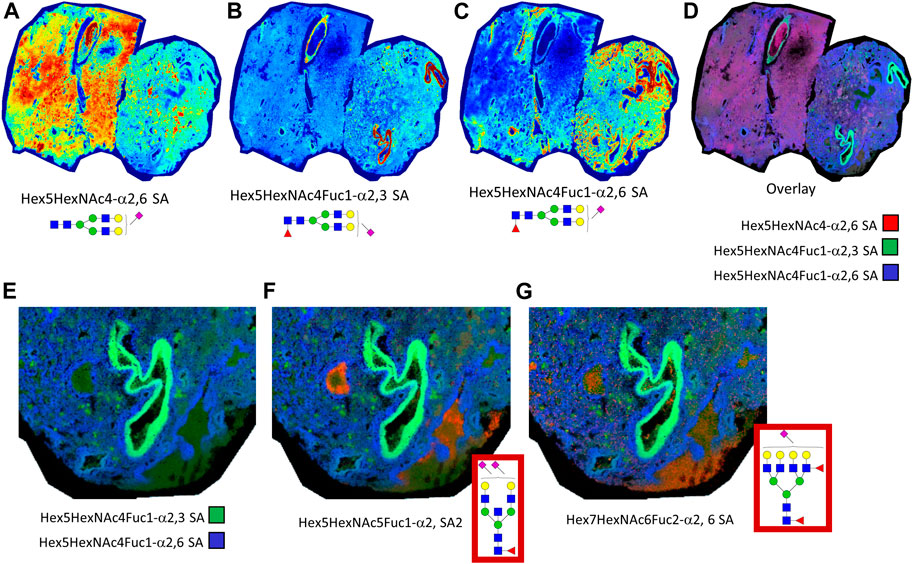
FIGURE 7. Lung tissue 18A9 was treated with dimethylamine and propargylamine to stabilize the anomeric configurations of sialylated N-glycans prior to N-glycan imaging MS. Spatial distribution of sialylated biantennary N-glycans shown are depicted, Hex5HexNAc4-α2,6 SA (A), Hex5HexNAc4Fuc1-α2,3 SA (B), and Hex5HexNAc4Fuc1-α2,6 SA (C); these are followed by a composite overlay image showing spatial overlap between the three glycans (D). A highlighted region is shown for the overlay of the two sialylated glycans in panels B. and C. (E). Additional composite images of sialyated glycans in panel E with α2,6 disialylated bisecting GlcNAc N-glycans, m/z = 2650.0293, specific to CD8+ regions (F), and a complex α2,6 sialylated N-glycan, m/z = 3005.1284, in the CD11b+ region (G). In the Supplementary Tables, these two latter glycans correspond to underivatized glycans of m/z = 2638.9531 and m/z = 2999.0464, respectively.
4 Discussion
In the midst of the ongoing COVID-19 global pandemic, there remains a great interest and imminent need to determine the role of individual immune cell responses post infection as they relate to disease onset, progression, and mortality. Research suggests N-linked glycosylation is highly involved in regulating most aspects of immune cell functions (Afroun et al., 1988; Pereira et al., 2018; Hinneburg et al., 2020). Yet, specific roles N-glycan species in immune cell regulation are not as well characterized (Radovani and Gudelj, 2022). Currently, there are ongoing COVID-19 studies assessing immune cell N-glycan profiles in blood and fluids, yet few have attempted to ascertain these profiles within the infected tissue. By combining traditional histology and IHC methodology with N-glycan MALDI-IMS, distinct and shared N-glycan profiles were characterized that associated with specific immune cell populations identified by IHC using a panel of antibodies. These included anti-CD11b as a pan-leukocyte marker, anti-CD163 for M2 anti-inflammatory macrophage phenotype, anti-CD8 for cytotoxic T cells, anti-CD4 for helper T cells, and anti-spike protein antibody for SARS-CoV-2. Remarkably, spike staining of all COVID-19 positive tissues only resulted in one positive tissue, 17A12, and within this tissue, Spike+ and CD163 staining overlapped significantly, suggesting that M2 macrophages co-localize with viral infected regions, and/or potentially represent macrophage engulfed virus. Correlating with the CD163+ staining in 17A12, 18A9 and 66A7 were several core-fucosylated, tetra-antennary glycans, such as Hex7dHex1HexNc6 at m/z 2539.902, Hex8dHex1HexNAc7 at m/z 2905.031 and others with poly-LacNAc extensions. Literature cites macrophages as being heavily decorated with terminal and core fucoses via a family of fucosyltransferase (FUT) genes, wherein terminal fucosylation plays a key role in M1 macrophage activation which has been widely researched in a variety of inflammatory diseases (Li et al., 2018; Radovani and Gudelj, 2022). Moreover, Li et al. has reported that inhibiting terminal fucosylation by using a FUT inhibitor in vitro cultures altered macrophage plasticity and skewed macrophage differentiation to the anti-inflammatory M2 phenotype (Li et al., 2014). Consistent with these findings is the co-localization of these core-fucosylated N-glycans with areas of CD163+ staining across the three COVID-19 lung tissues. We speculate ratios of terminal-versus core-fucosylated N-glycans may be used to ascertain between macrophage phenotypes in biological fluids and tissues.
Within 17A12 we noticed a second area of immune cell staining, specifically co-mixtures of infiltrating CD11b+ and CD8+ cells within the alveolar space. These co-mixtures were also present in 66A7, which was surprising given the use of the ventilator for 27 days in contrast to no ventilator use in 17A12. In contrast, we observed distinct populations of CD8+ cells and CD11b+ cells. Comparison of the N-glycan distributions between these homogeneous areas versus the heterogenous co-mixtures provided several observations. First, one of the N-glycans unique to CD11b+ cells is a paucimannose glycan, Hex2dHex1NAc2. Interestingly, these types of paucimannosidic glycans are associated with neutrophil degranulation at sites of inflammation (Ugonotti et al., 2021; Radovani and Gudelj, 2022), suggesting the CD11b+ areas within 18A9 may be neutrophils. In immune cells, CD11b is a pan-leukocyte marker present on monocytes/macrophages, neutrophils, and natural killer cells. A recent study also identified the paucimannose glycans as associated with neutrophils and cell surface immunopeptides of SARS-CoV-2 infected dendritic cells (Parker et al., 2021). Second, oligomannose glycans, i.e., Man4—Man9, are present within both homogenous and heterogenous CD8+ and CD11b+ mixtures. With respect to CD8+ T cells, the presence of oligomannose N-glycans potentially underscores a switch in metabolic reprogramming from oxidative phosphorylation to glycolysis. Literature cites hyper-glycolysis accelerates terminal differentiation to effector cells, and in contrast restoring oxidative phosphorylation will promote the establishment of immunological memory (Demotte et al., 2008; Sukumar et al., 2013; Buck et al., 2015). Interestingly, oligomannose N-glycans are also associated with activated neutrophils (Radovani and Gudelj, 2022) and it is difficult to determine which immune cell phenotype these glycans are describing in this study. Still, we speculate that metabolic reprogramming may be a generic mechanism by which pro-inflammatory immune cells use to regulate maturation.
Sialic acids have been well studied for their role in regulation of the immune response to viral infections such as the influenza virus (Wielgat et al., 2020). Additionally, the specific linkages of sialic acids have been associated with the virulence and transmission of different strains. MALDI-IMS offers a unique way to visualize the distribution and anomeric configuration of these sialylated N-linked glycans by derivatization within the complex pathologies of these SARS-CoV-2 infected lung tissues (Holst et al., 2016). The most abundant and widely distributed glycan across tissue 18A9 was a biantennary α2,6 sialylated glycan, while fucosylated versions were more specifically localized to bronchiolar vessel regions. The sialylated glycans identified in the specific CD8+ and CD11b+ immune cell clusters were predominantly in α2,6 configurations. Although sialic acid distributions across the whole COVID-19 infected autopsy tissues was the focus of our study, there have been other interesting findings across other research groups specific to the spike protein. For example, there are ongoing studies assessing the site-specific glycosylation of recombinant human spike proteins from HEK and CHO cells to better understand the impact of the production host in more of a vaccine application (Wang et al., 2021), and NMR based studies seeking to determine whether the spike protein binds exogenous sialic acids (Unione et al., 2022). Specific emphasis on evaluating the role of sialylated N-glycans and other species using the combined N-glycan IMS and IHC approach is ongoing in murine lung tissues from K18-hACE2 transgenic mice infected with different SARS-CoV-2 variants of concern (Radvak et al., 2021).
In conclusion, unique glycans that co-localized with infiltrating immune cell populations were identified with IHC and MALDI-IMS. This approach is the first demonstration that tissue localized immune cell clusters can be evaluated for N-glycan composition and differentiation based on the type of immune cell present. Linking the detection and presence of specific N-linked glycan species in relation to immune cell localization and their metabolic activity is an ongoing research effort. For a more comprehensive multimodal analysis strategy, additional platforms such as MIBI-TOF antibody panels and/or spatial transcriptomic approaches may be included with the IHC and MALDI IMS workflow to provide more in-depth characterization of the immune cell phenotypes present within disease tissues.
Data availability statement
The original contributions presented in the study are included in the article/Supplementary Material, further inquiries can be directed to the corresponding author.
Ethics statement
Postmortem lung autopsy tissues were collected under Emory Research University Hospital’s autopsy authorization and IRB approval.
Author contributions
EJ, KM conceived and designed the study. VP conducted H&E and IHC staining. EM performed the quantitative analysis of immunohistochemical staining. KM and EM performed the statistical analyses. RD, RS, JD conducted the MALDI-IMS imaging analysis. RD curated and annotated imaged data. EJ drafted the manuscript. KM, EJ, RD modified the manuscript. All authors reviewed the manuscript.
Funding
This work was supported by FDA/CDER intramural SARS-CoV-2 pandemic fund, FDA COVID-19 supplemental 3 funds, and in part by NIH R33 CA267226 and NIH UO1 CA242096 (R.R.D). Research reported in this publication was supported in part by the Cancer Tissue and Pathology shared resource of Winship Cancer Institute of Emory University and NIH/NCI under award number P30CA138292.
Acknowledgments
The authors would like to thank Jessica Hawes (FDA/NCTR) and Dr. John Petros, M.D. (Emory University) who helped in the procurement of the SARS-CoV-2 positive and SARS-CoV-2 negative lung samples for this study, and both Richard Beger and Laura Schnackenberg (FDA/NCTR) for their administrative support. This manuscript reflects the views of the authors and does not necessarily reflect those of the U.S. Food and Drug Administration and the National Institutes of Health. Any mention of commercial products is for clarification only and is not intended as approval, endorsement, or recommendation.
Conflict of interest
The authors declare that the research was conducted in the absence of any commercial or financial relationships that could be construed as a potential conflict of interest.
Publisher’s note
All claims expressed in this article are solely those of the authors and do not necessarily represent those of their affiliated organizations, or those of the publisher, the editors and the reviewers. Any product that may be evaluated in this article, or claim that may be made by its manufacturer, is not guaranteed or endorsed by the publisher.
Supplementary material
The Supplementary Material for this article can be found online at: https://www.frontiersin.org/articles/10.3389/frans.2022.1021008/full#supplementary-material
References
Afroun, S., Tenu, J. P., and Lemaire, G. (1988). Modifications of glycosylation patterns in macrophages upon activation. Biochim. Biophys. Acta 971 (2), 137–147. doi:10.1016/0167-4889(88)90185-1
Alexandre, J., Cracowski, J. L., Richard, V., and Bouhanick, B. (2020). Renin-angiotensin-aldosterone system and COVID-19 infection. Ann. Endocrinol. 81 (2-3), 63–67. doi:10.1016/j.ando.2020.04.005
Baum, L. G., and Cobb, B. A. (2017). The direct and indirect effects of glycans on immune function. Glycobiology 27 (7), 619–624. doi:10.1093/glycob/cwx036
Blaschke, C. R. K., McDowell, C. T., Black, A. P., Mehta, A. S., Angel, P. M., and Drake, R. R. (2021). Glycan imaging mass spectrometry: Progress in developing clinical diagnostic assays for tissues, biofluids, and cells. Clin. Lab. Med. 41 (2), 247–266. doi:10.1016/j.cll.2021.03.005
Buck, M. D., O'Sullivan, D., and Pearce, E. L. (2015). T cell metabolism drives immunity. J. Exp. Med. 212 (9), 1345–1360. doi:10.1084/jem.20151159
Casalino, L., Casalino, L., Gaieb, Z., Goldsmith, J. A., Hjorth, C. K., Dommer, A. C., et al. (2020). Beyond Shielding: The Roles of Glycans in SARS-CoV-2 Spike Protein. ACS Cent. Sci. 6 (10), 1722–1734. doi:10.1101/2020.06.11.146522
Clift, C. L., Drake, R. R., Mehta, A., and Angel, P. M. (2021). Multiplexed imaging mass spectrometry of the extracellular matrix using serial enzyme digests from formalin-fixed paraffin-embedded tissue sections. Anal. Bioanal. Chem. 413 (10), 2709–2719. doi:10.1007/s00216-020-03047-z
Damerell, D., Ceroni, A., Maass, K., Ranzinger, R., Dell, A., and Haslam, S. M. (2015). Annotation of glycomics MS and MS/MS spectra using the GlycoWorkbench software tool. Methods Mol. Biol. 1273, 3–15. doi:10.1007/978-1-4939-2343-4_1
De Bousser, E., Meuris, L., Callewaert, N., and Festjens, N. (2020). Human T cell glycosylation and implications on immune therapy for cancer. Hum. Vaccin. Immunother. 16 (10), 2374–2388. doi:10.1080/21645515.2020.1730658
Demotte, N., Stroobant, V., Courtoy, P. J., Van Der Smissen, P., Colau, D., Luescher, I. F., et al. (2008). Restoring the association of the T cell receptor with CD8 reverses anergy in human tumor-infiltrating lymphocytes. Immunity 28 (3), 414–424. doi:10.1016/j.immuni.2008.01.011
Drake, R. R., Powers, T. W., Norris-Caneda, K., Mehta, A. S., and Angel, P. M. (2018). In situ imaging of N-glycans by MALDI imaging mass spectrometry of fresh or formalin-fixed paraffin-embedded tissue. Curr. Protoc. Protein Sci. 94 (1), e68. doi:10.1002/cpps.68
Gupta, A., Madhavan, M. V., Sehgal, K., Nair, N., Mahajan, S., Sehrawat, T. S., et al. (2020). Extrapulmonary manifestations of COVID-19. Nat. Med. 26 (7), 1017–1032. doi:10.1038/s41591-020-0968-3
Hinneburg, H., Pedersen, J. L., Bokil, N. J., Pralow, A., Schirmeister, F., Kawahara, R., et al. (2020). High-resolution longitudinal N- and O-glycoprofiling of human monocyte-to- macrophage transition. Glycobiology 30, 679–694. doi:10.1093/glycob/cwaa020
Holst, S., Heijs, B., de Haan, N., van Zeijl, R. J. M., Briaire-de Bruijn, I. H., van Pelt, G. W., et al. (2016). Linkage-specific in situ sialic acid derivatization for N-glycan mass spectrometry imaging of formalin-fixed paraffin-embedded tissues. Anal. Chem. 88 (11), 5904–5913. doi:10.1021/acs.analchem.6b00819
Kuba, K., Imai, Y., and Penninger, J. M. (2006). Angiotensin-converting enzyme 2 in lung diseases. Curr. Opin. Pharmacol. 6 (3), 271–276. doi:10.1016/j.coph.2006.03.001
Li, J., Hsu, H. C., Ding, Y., Li, H., Wu, Q., Yang, P., et al. (2014). Inhibition of fucosylation reshapes inflammatory macrophages and suppresses type II collagen-induced arthritis. Arthritis Rheumatol. 66 (9), 2368–2379. doi:10.1002/art.38711
Li, J., Hsu, H. C., Mountz, J. D., and Allen, J. G. (2018). Unmasking fucosylation: From cell adhesion to immune system regulation and diseases. Cell Chem. Biol. 25 (5), 499–512. doi:10.1016/j.chembiol.2018.02.005
McDowell, C. T., Klamer, Z., Hall, J., West, C. A., Wisniewski, L., Powers, T. W., et al. (2021). Imaging mass spectrometry and lectin analysis of N-linked glycans in carbohydrate antigen-defined pancreatic cancer tissues. Mol. Cell. Proteomics. 20, 100012. doi:10.1074/mcp.RA120.002256
McDowell, C. T., Lu, X., Mehta, A. S., Angel, P. M., and Drake, R. R. (2021). Applications and continued evolution of glycan imaging mass spectrometry. Mass Spectrom. Rev. 15 doi:10.1002/mas.21725
Ochoa-Rios, S., O'Connor, I. P., Kent, L. N., Clouse, J. M., Hadjiyannis, Y., Koivisto, C., et al. (2022). Imaging mass spectrometry reveals alterations in N-linked glycosylation that are associated with histopathological changes in nonalcoholic steatohepatitis in mouse and human. Mol. Cell. Proteomics. 21 (5), 100225. doi:10.1016/j.mcpro.2022.100225
Parker, R., Partridge, T., Wormald, C., Kawahara, R., Stalls, V., Aggelakopoulou, M., et al. (2021). Mapping the SARS-CoV-2 spike glycoprotein-derived peptidome presented by HLA class II on dendritic cells. Cell Rep. 35 (8), 109179. doi:10.1016/j.celrep.2021.109179
Pereira, M. S., Alves, I., Vicente, M., Campar, A., Silva, M. C., Padrao, N. A., et al. (2018). Glycans as key checkpoints of T cell activity and function. Front. Immunol. 9, 2754. doi:10.3389/fimmu.2018.02754
Powers, T. W., Neely, B. A., Shao, Y., Tang, H., Troyer, D. A., Mehta, A. S., et al. (2014). MALDI imaging mass spectrometry profiling of N-glycans in formalin-fixed paraffin embedded clinical tissue blocks and tissue microarrays. PLoS One 9 (9), e106255. doi:10.1371/journal.pone.0106255
Radovani, B., and Gudelj, I. (2022). N-glycosylation and inflammation; the not-so-sweet relation. Front. Immunol. 13, 893365. doi:10.3389/fimmu.2022.893365
Radvak, P., Kwon, H. J., Kosikova, M., Ortega-Rodriguez, U., Xiang, R., Phue, J. N., et al. (2021). SARS-CoV-2 B.1.1.7 (alpha) and B.1.351 (beta) variants induce pathogenic patterns in K18-hACE2 transgenic mice distinct from early strains. Nat. Commun. 12 (1), 6559. doi:10.1038/s41467-021-26803-w
Robba, C., Battaglini, D., Pelosi, P., and Rocco, P. R. M. (2020). Multiple organ dysfunction in SARS-CoV-2: MODS-CoV-2. Expert Rev. Respir. Med. 14 (9), 865–868. doi:10.1080/17476348.2020.1778470
Ronis, M. J., Mercer, K. E., Shankar, K., Pulliam, C., Pedersen, K., Ingelman-Sundberg, M., et al. (2020). Potential role of gut microbiota, the proto-oncogene PIKE (Agap2) and cytochrome P450 CYP2W1 in promotion of liver cancer by alcoholic and nonalcoholic fatty liver disease and protection by dietary soy protein. Chem. Biol. Interact. 325, 109131. doi:10.1016/j.cbi.2020.109131
Rujchanarong, D., Lefler, J., Saunders, J. E., Pippin, S., Spruill, L., Bethard, J. R., et al. (2021). Defining the tumor microenvironment by integration of immunohistochemistry and extracellular matrix targeted imaging mass spectrometry. Cancers (Basel) 13 (17), 4419. doi:10.3390/cancers13174419
Scupakova, K., Balluff, B., Tressler, C., Adelaja, T., Heeren, R. M. A., Glunde, K., et al. (2020). Cellular resolution in clinical MALDI mass spectrometry imaging: The latest advancements and current challenges. Clin. Chem. Lab. Med. 58 (6), 914–929. doi:10.1515/cclm-2019-0858
Spraggins, J. M., Djambazova, K. V., Rivera, E. S., Migas, L. G., Neumann, E. K., Fuetterer, A., et al. (2019). High-performance molecular imaging with MALDI trapped ion-mobility time-of-flight (timsTOF) mass spectrometry. Anal. Chem. 91 (22), 14552–14560. doi:10.1021/acs.analchem.9b03612
Sukumar, M., Liu, J., Ji, Y., Subramanian, M., Crompton, J. G., Yu, Z., et al. (2013). Inhibiting glycolytic metabolism enhances CD8+ T cell memory and antitumor function. J. Clin. Invest. 123 (10), 4479–4488. doi:10.1172/JCI69589
Sun, P., Qie, S., Liu, Z., Ren, J., Li, K., and Xi, J. (2020). Clinical characteristics of hospitalized patients with SARS-CoV-2 infection: A single arm meta-analysis. J. Med. Virol. 92 (6), 612–617. doi:10.1002/jmv.25735
Ugonotti, J., Chatterjee, S., and Thaysen-Andersen, M. (2021). Structural and functional diversity of neutrophil glycosylation in innate immunity and related disorders. Mol. Asp. Med. 79, 100882. doi:10.1016/j.mam.2020.100882
Unione, L., Moure, M. J., Lenza, M. P., Oyenarte, I., Ereno-Orbea, J., Arda, A., et al. (2022). The SARS-CoV-2 spike glycoprotein directly binds exogeneous sialic acids: A NMR view. Angew. Chem. Int. Ed. Engl. 61 (18), e202201432. doi:10.1002/anie.202201432
Wang, J., Jiang, M., Chen, X., and Montaner, L. J. (2020). Cytokine storm and leukocyte changes in mild versus severe SARS-CoV-2 infection: Review of 3939 COVID-19 patients in China and emerging pathogenesis and therapy concepts. J. Leukoc. Biol. 108 (1), 17–41. doi:10.1002/JLB.3COVR0520-272R
Wang, Q., Wang, Y., Yang, S., Lin, C., Aliyu, L., Chen, Y., et al. (2021). A linkage-specific sialic acid labeling strategy reveals different site-specific glycosylation patterns in SARS-CoV-2 spike protein produced in CHO and HEK cell substrates. Front. Chem. 9, 735558. doi:10.3389/fchem.2021.735558
Watanabe, Y., Bowden, T. A., Wilson, I. A., and Crispin, M. (2019). Exploitation of glycosylation in enveloped virus pathobiology. Biochim. Biophys. Acta. Gen. Subj. 1863 (10), 1480–1497. doi:10.1016/j.bbagen.2019.05.012
Wielgat, P., Rogowski, K., Godlewska, K., and Car, H. (2020). Coronaviruses: Is sialic acid a gate to the eye of cytokine storm? From the entry to the effects. Cells 9 (9), E1963. doi:10.3390/cells9091963
Keywords: COVID-19, immune cell, N-linked glycosylation, MALDI imaging mass spectrometry, tissue imaging
Citation: Jones EE, Drake RR, Dressman JW, Parihar V, Stubler R, Masters E and Mercer KE (2022) Applying imaging mass spectrometry to define the N-glycan profiles of co-localized virus and immune cell infiltrates in post-COVID-19 infected lung autopsy tissues. Front. Anal. Sci. 2:1021008. doi: 10.3389/frans.2022.1021008
Received: 16 August 2022; Accepted: 26 September 2022;
Published: 26 October 2022.
Edited by:
Bram Heijs, Leiden University Medical Center (LUMC), NetherlandsReviewed by:
Celso A. Reis, University of Porto, PortugalMatthew Briggs, University of South Australia, Australia
Morten Thaysen-Andersen, Macquarie University, Australia
Copyright © 2022 Jones, Drake, Dressman, Parihar, Stubler, Masters and Mercer. This is an open-access article distributed under the terms of the Creative Commons Attribution License (CC BY). The use, distribution or reproduction in other forums is permitted, provided the original author(s) and the copyright owner(s) are credited and that the original publication in this journal is cited, in accordance with accepted academic practice. No use, distribution or reproduction is permitted which does not comply with these terms.
*Correspondence: Kelly E. Mercer, Kelly.Mercer@fda.hhs.gov
†These authors have contributed equally to this work and share first authorship