Application note: TDbasedUFE and TDbasedUFEadv: bioconductor packages to perform tensor decomposition based unsupervised feature extraction
 Y-h. Taguchi
 Turki Turki
- 1Department of Physics, Chuo University, Tokyo, Japan
- 2Department of Computer Sciences, King Abdulaziz University, Jeddah, Saudi Arabia
Motivation: Tensor decomposition (TD)-based unsupervised feature extraction (FE) has proven effective for a wide range of bioinformatics applications ranging from biomarker identification to the identification of disease-causing genes and drug repositioning. However, TD-based unsupervised FE failed to gain widespread acceptance due to the lack of user-friendly tools for non-experts.
Results: We developed two bioconductor packages—TDbasedUFE and TDbasedUFEadv—that enable researchers unfamiliar with TD to utilize TD-based unsupervised FE. The packages facilitate the identification of differentially expressed genes and multiomics analysis. TDbasedUFE was found to outperform two state-of-the-art methods, such as DESeq2 and DIABLO.
Availability and implementation: TDbasedUFE and TDbasedUFEadv are freely available as R/Bioconductor packages, which can be accessed at https://bioconductor.org/packages/TDbasedUFE and https://bioconductor.org/packages/TDbasedUFEadv, respectively.
1. Introduction
Tensor decomposition (TD)-based unsupervised feature extraction (FE) has been successfully applied to a wide range of problems (Taguchi, 2020) since it was introduced several years ago (Taguchi, 2017). Despite its success, the method failed to gain widespread acceptance, possibly due to the lack of practical tools to perform TD. To address this end, we have developed two bioconductor packages, TDbasedUFE and TDbasedUFEadv, which allow researchers to perform TD-based unsupervised FE easily without the need of detailed knowledge of TD. The purpose of this manuscript is not to demonstrate the superiority over the other methods, since the superiority over the other methods has already been demonstrated in numerous studies cited below. The purpose of this manuscript is to simply inform about the implementation of the established method into easy-to-use environment.
2. Methods
TD-based unsupervised FE (Taguchi, 2017) was derived from principal component analysis (PCA)-based unsupervised FE (Taguchi and Murakami, 2013), which was introduced 10 years ago. As datasets grew in complexity and began to include multiple measurement conditions, such as comparisons of multiple tissues from human subjects rather than just those from human patients restricted to a single tissue, tensors were employed instead of matrices. Tensors, which can have multiple indices, each of which can have multiple comparison criteria, better accomodate complex data structures. For example, a three mode tensor xijk can naturally store the expression of ith gene at kth tissue of jth human subjects. In contrast, matrices with only two indices corresponding to rows and columns require combining the tissue index and the human index into a single column, rendering data interpretation challenging.
TDbasedUFE and TDbasedUFEadv are user-friendly packages that allow individuals who are unfamiliar with tensors to perform unsupervised feature extraction. Since a matrix can be considered as a two-mode tensor, these packages can also be used to apply PCA-based unsupervised FE to the dataset. TDbasedUFE focuses on two popular functions developed for TD-based unsupervised FE, including the identification of differentially expressed genes (DEGs) and multiomics analyses. For the DEG identification, the basic algorithm is based on a recent study (Taguchi and Turki, 2022b) that established a new standard deviation (SD) optimization approach. For multiomics analysis, the basic algorithm is based on the same study (Taguchi and Turki, 2022c). However, TDbasedUFE also incorporates SD optimization, which was not available when the study was published. Although the algorithm is not specifically designed for DNA methylation profiles, we found that the approach described in the study (Taguchi and Turki, 2022b) is also applicable to DNA methylation profiles (Taguchi and Turki, 2023). In this regard, any type of differential analysis on single omics data can be performed by functions implemented in TDbasedUFE. In fact, we have shown (Turki et al., 2023) that histone modification profiles can be analyzed using the algorithm described in the study (Taguchi and Turki, 2022b).
TDbasedUFE and TDbasedUFEadv accept a multiple omics profile dataset formatted as a tensor. TD is applied on this dataset using Tucker decomposition based on higher order singular value decomposition (HOSVD) (Taguchi, 2020) algorithm. For instance, if represents the gene expression of ith gene of jth human subject's kth tissue (Figure 1 left), TD is applied to xijk, and the following equation is obtained:
where G ∈ ℝN×M×K is a core tensor that represents the weight of the product uℓ1iuℓ2juℓ3k to xijk, and , , and are singular value matrices and orthogonal matrices. Initially, singular value vectors attributed to samples, uℓ2j and uℓ3k, are investigated to identify those of interest. For instance, uℓ2j represents the distinction between healthy controls and patients, and uℓ3k represents tissue specificity (e.g., expressed only in the heart). Then, the singular value vectors attributed to genes (i.e., features) uℓ1i that share G of the largest absolute value with the identified uℓ2j and uℓ3k are selected. Features (is) with larger absolute values of uℓ1i are identified based on P-values computed by assuming that uℓ1i obeys a Gaussian distribution (null hypothesis) as follows:
where is the cumulative χ2 distribution where the argument is larger than x, and σℓ1 is the optimized standard deviation such that uℓ1i obeys Gaussian distribution as much as possible (see Taguchi and Turki, 2022b for more details about how to optimize σℓ1). Then Pis are, then, adjusted using the Benjamini–Hochberg criterion to consider multiple comparison correction. Finally, is with adjusted Pi less than threshold value (typically, 0.01) are selected.
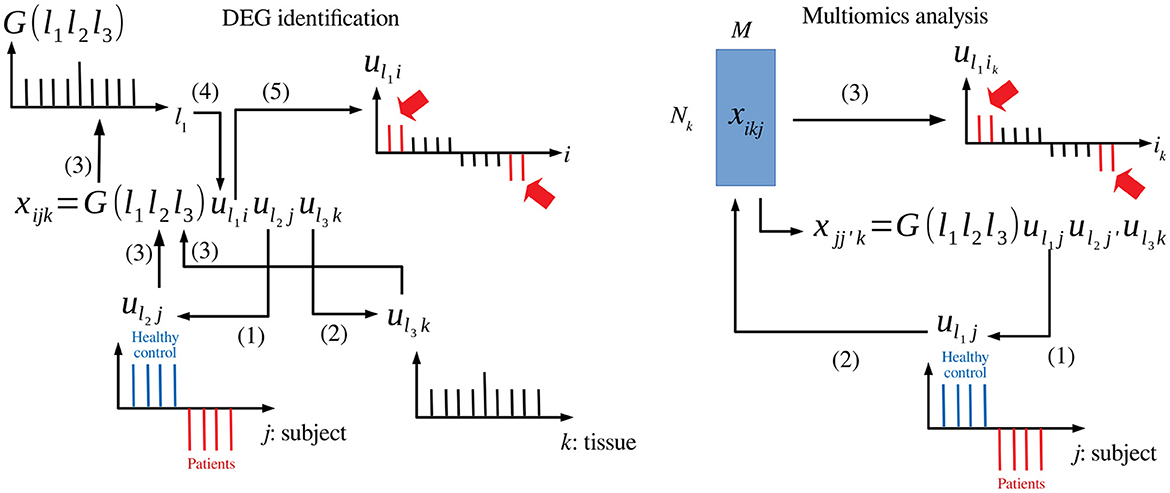
Figure 1. Schematic diagram that explains TD-based unsupervised FE. Left: DEG identification, (1) uℓ2j associated with the distinction between patients and healthy controls is selected. (2) uℓ3k associated with tissue specificity is selected. (3) G(ℓ1ℓ2ℓ3) is investigated with fixed ℓ2 and ℓ3. (4) uℓ1i with G of the largest absolute value is selected. (5) is (indicated in red) whose absolute values are significantly larger than expected are selected. Right: Multiomics analysis, (1) uℓ1j associated with the distinction between patients and healthy controls is selected. (2) uℓ1i is computed from uℓ1j. (3) is (indicated in red) whose absolute values are significantly larger than expected are selected.
When TDbasedUFE is applied to multiomics datasets (Figure 1 right), the multiomics profiles are formatted as (i.e., kth omics datasets are associated with as many as Nk features). The xikjs are multiplied with each other to obtain the following equation:
HOSVD is, then, applied to as follows:
After identifying uℓ2j coincident with labels (e.g., patients and healthy control), singular value vectors attributed to individual features associated with kth omics are computed as follows:
Moreover, Pik is, then, computed as follows:
and iks associated with adjusted Pik less than 0.01 are selected.
In contrast to TDbasedUFE, which can perform only two tasks, TDbasedUFEadv can perform more complicated tasks. For example, TDbasedUFEadv can perform (Ng and Taguchi, 2020) integrated analysis of two omics profiles that share samples and reduce the memory required by summing up the sample index. TDbasedUFEadv can also perform integrated analysis of two omics profiles that share features (Taguchi and Turki, 2019). TDbasedUFEadv can also perform integrated analysis of multiple (more than two) omics profiles that shared features (Taguchi and Turki, 2022a) or samples (Taguchi and Turki, 2021).
3. Results
The full list of identified features, as well as the results of the enrichment analysis in this section, is presented in Supplementary material. For further details, please also refer to the Supplementary Document.
Numerous applications of TD-based FE were proposed since the publication of our book (Taguchi, 2020). Here, we present a few examples to demonstrate the usefulness of TDbasedUFE based on the ACC.rnaseq data from RTCGA.rneseq (Kosinski, 2023) package in Bioconductor. The labels used to select singular value vectors attributed to samples were patient.stage_event.pathologic_stage composed of four classes (“stage i” to “stage iv”). A tensor represents the expression of ith gene of jth replicates of kth stage. HOSVD was applied to xijk, and we obtained TD, as shown in Equation (1) (please refer to the Supplementary Document for the R code to perform DEG identification using TDbasedUFE). Since uℓ2j is attributed to replicates, uℓ2j is expected to have constant values, regardless of how j and ℓ2 = 1 turned out to satisfy this requirement (Supplementary Figure S1 left). On the other hand, uℓ3k is expected to have monotonic dependence on k (Supplementary Figure S1 right); and we found that ℓ3 = 3 was most coincident with monotonic dependence on k. Once ℓ2 and ℓ3 are selected by the user with the interactive interface, TDbasedUFE automatically selects uℓ1i with which is are selected. As a result, 1,692 genes were selected with the threshold-adjusted P-value of 0.01.
To evaluate the ability of TDbasedUFE to select genes, we applied DESeq2 (Love et al., 2014), a state-of-the-art method, on xijk. DESeq2 is not applied to xijk but to the unfolded matrix where j and k are merged into a column index (see the Supplementary Document for the R code to perform DEG identification using DESeq2). We identified as few as 138 genes associated with adjusted P-values less than 0.01 using DESeq2. Thus, from the perspective of the number of identified DEGs, TDbasedUFE is clearly superior to DESeq2.
However, identifying a higher number of DEGs does not necessarily mean that all of the identified DEGs are biologically relevant. To evaluate the biological relevance of the DEGs selected by TDbasedUFE, we used the enrichR (Jawaid, 2023) package in CRAN, as demonstrated in the vignette “Enrichment” in the TDbasedUFEadv package considering the “KEGG 2021 HUMAN,” “GO Molecular Function 2015,” “GO Cellular Component 2015,” and “GO Biological Process 2015” categories. When 1,692 genes selected by TDbasedUFE are considered, 129, 151, 143, and 923 terms were found to be associated with adjusted P-values less than 0.05 for the “KEGG 2021 HUMAN,” “GO Molecular Function 2015,” “GO Cellular Component 2015,” and “GO Biological Process 2015” categories, respectively. On the other hand, when 138 genes selected by DESeq2 are considered, 0, 0, 3, and 12 terms are associated with adjusted P < 0.05 for the same categories. Thus, in terms of the number of biologically relevant terms identified, TDbasedUFE outperforms DESeq2.
To demonstrate the capabilities of TDbasedUFE on a multiomics dataset, we used the curatedTCGA (Ramos et al., 2020) package to retrieve profiles other than the gene expression of the ACC dataset in TCGA (please refer to the Supplementary Document for the R code to perform DEG identification using TDbasedUFE). We have collected miRNA (), gene expression (), and methylation data() from curatedTCGA and applied TDbasedUFE on these data. After applying HOSVD to the generated tensor , we found that u7j (Supplementary Figure S2 upper) is associated with the distinction between four stages, and u1k (Supplementary Figure S2 lower) is constant regardless of k (i.e., omics). Pik is attributed to ik by Equation (6) using u7ik generated from u7j by Equation (5). After correcting Pik, we found that 23 out of 1,046 miRNAs, 1,016 out of 20,501 mRNAs, and 7,295 out of 485,577 methylation probes are associated with adjusted Pik less than 0.01 (these features are expected to be distinct between the four stages as well).
To compare the performence of TDbasedUFE with those of SOTA methods, we employed DIABLO, which is implemented in the mixomics package (Rohart et al., 2017) in Bioconductor (please refer to the Supplementary Document for the R code to perform mulitiomics analysis using DIABLO). Even we used the minimum setup (folds=2, nrepeat=1), DIABLO failed to converge to a solution within 3 h. When the recommended setup in the vignette (folds=10, nrepeat=10) was employed, DIABLO did not converge to the solution with few enough errors up to 10 components (ncomp=10) and showed no tendency for errors to decrease as the number of components increased (Supplementary Figure S3). As a result, we were unable to select features using DIABLO and had to conclude that TDbasedUFE outperformed DIABLO for this multiomics dataset.
To evaluate the biological relevance of miRNAs, mRNAs, and methylation probes identified by TDbasedUFE, we have uploaded these to various databases. First, we uploaded the identified miRNAs to DIANA-mirpath v3.0 (Vlachos et al., 2015) and found that many cancer-related KEGG pathways are enriched (please refer to the Supplementary Document for URL to DIANA-mirpath using these miRNAs). Next, we uploaded the identified mRNAs to Enrichr (Xie et al., 2021) and found many cancer-related pathways in the “KEGG 2021 Human” categories and various cancer cell lines. Finally, we uploaded 2,668 unique gene symbols associated with the identified 7,295 probes to Enrichr and found several cancer-related pathways in “KEGG 2021 Human” and various cancer cell lines. In conclusion, the miRNAs, mRNAs, and methylation probes identified by TDbasedUFE are biologically relevant.
4. Discussion
Here, we have introduced TDbasedUFE and TDbasedUFEadv, two packages that can perform TD-based unsupervised FE without requiring extensive knowledge of tensor decompositions. Our results demonstrated that these packages outperform two SOTA methods, DESeq2 and DIABLO, when applied for DEG identification and multiomics analysis, respectively. With TDbasedUFE and TDbasedUFEadv, users can perform TD-based unsupervised FE easily and effectively.
In this implementation, TDbasedUFE/TDbasedUFEadv can accept variety of datasets generated from high throughput sequencing and/or old-fashioned microarray seamlessly. TDbasedUFE/TDbasedUFEadv can also accept the various combinations of these profiles as inputs (multiomics analysis). TDbasedUFE/TDbasedUFEadv can output the list of features associated with (adjusted) P-values. The possible output features are dependent on the input features. When genes are input, the output features are also genes. When genomic regions are input, the output features are also genomic regions. The list of features can be analyzed with enrichment analysis to understand biological meanings within the downstream analyses.
Current implementation does not have specific limitation since the implemented methods have already been tested over various topics in the numerous previous publications cited in this study. There are no future directions since it is a report to inform the implementation of established method.
As for other unsupervised gene selection methods, readers might check the review article Ang et al. (2016), although it listed as small as fifteen studies ranging from 2006 to 2012, which is relatively small compared with the number of our publications cited in this paper.
Data availability statement
Publicly available datasets were analyzed in this study. This data can be found here: https://doi.org/10.18129/B9.bioc.TDbasedUFE; https://doi.org/10.18129/B9.bioc.TDbasedUFEadv.
Author contributions
Y-hT and TT wrote an original manuscript, reviewed the manuscript, and validated the results. Y-hT has developed the package and performed analysis. All authors contributed to the article and approved the submitted version.
Funding
This study was supported in part by funds from the Chuo University (TOKUTEI KADAI KENKYU).
Conflict of interest
The authors declare that the research was conducted in the absence of any commercial or financial relationships that could be construed as a potential conflict of interest.
Publisher's note
All claims expressed in this article are solely those of the authors and do not necessarily represent those of their affiliated organizations, or those of the publisher, the editors and the reviewers. Any product that may be evaluated in this article, or claim that may be made by its manufacturer, is not guaranteed or endorsed by the publisher.
Supplementary material
The Supplementary Material for this article can be found online at: https://www.frontiersin.org/articles/10.3389/frai.2023.1237542/full#supplementary-material
References
Ang, J. C., Mirzal, A., Haron, H., and Hamed, H. N. A. (2016). Supervised, unsupervised, and semi-supervised feature selection: a review on gene selection. IEEE/ACM Trans. Comput. Biol. Bioinform. 13, 971–989. doi: 10.1109/TCBB.2015.2478454
Jawid, W. (2023). enrichR: Provides an R Interface to ‘Enrichr’, in R Package Version 3.2. Available online at: https://cran.r-project.org/web/packages/enrichR/
Kosinski, M. (2023). RTCGA.rnaseq: RNA-seq datasets from the cancer genome atlas project, in R Package Version 20151101.30.30. doi: 10.18129/B9.bioc.RTCGA.rnaseq
Love, M. I., Huber, W., and Anders, S. (2014). Moderated estimation of fold change and dispersion for RNA-seq data with DESeq2. Genome Biol. 15, 550. doi: 10.1186/s13059-014-0550-8
Ng, K.-L., and Taguchi, Y. H. (2020). Identification of miRNA signatures for kidney renal clear cell carcinoma using the tensor-decomposition method. Sci. Rep. 10, 15149. doi: 10.1038/s41598-020-71997-6
Ramos, M., Geistlinger, L., Oh, S., Schiffer, L., Azhar, R., Kodali, H., et al. (2020). Multiomic integration of public oncology databases in bioconductor. JCO Clin. Cancer Inform. 4, 958–971. doi: 10.1200/CCI.19.00119
Rohart, F., Gautier, B., Singh, A., and LêCao, K.-A. (2017). mixOmics: an R package for ómics feature selection and multiple data integration. PLoS Comput. Biol. 13, 1–19. doi: 10.1371/journal.pcbi.1005752
Taguchi, Y.-H. (2017). Tensor decomposition-based unsupervised feature extraction applied to matrix products for multi-view data processing. PLoS ONE 12, 1–36. doi: 10.1371/journal.pone.0183933
Taguchi, Y.-H. (2020). Unsupervised Feature Extraction Applied to Bioinformatics. Cham: Springer International Publishing.
Taguchi, Y.-H., and Murakami, Y. (2013). Principal component analysis based feature extraction approach to identify circulating microRNA biomarkers. PLoS ONE 8, 1–12. doi: 10.1371/journal.pone.0066714
Taguchi, Y.-H., and Turki, T. (2019). Tensor decomposition-based unsupervised feature extraction applied to single-cell gene expression analysis. Front. Genet. 10. doi: 10.3389/fgene.2019.00864
Taguchi, Y.-H., and Turki, T. (2021). Tensor-decomposition-based unsupervised feature extraction in single-cell multiomics data analysis. Genes 12, 9. doi: 10.3390/genes12091442
Taguchi, Y.-H., and Turki, T. (2022a). A tensor decomposition-based integrated analysis applicable to multiple gene expression profiles without sample matching. Sci. Rep. 12, 21242. doi: 10.1038/s41598-022-25524-4
Taguchi, Y.-H., and Turki, T. (2022b). Adapted tensor decomposition and PCA based unsupervised feature extraction select more biologically reasonable differentially expressed genes than conventional methods. Sci. Rep. 12, 17438. doi: 10.1038/s41598-022-21474-z
Taguchi, Y.-H., and Turki, T. (2022c). Novel feature selection method via kernel tensor decomposition for improved multi-omics data analysis. BMC Med. Genomics 15, 37. doi: 10.1186/s12920-022-01181-4
Taguchi, Y.-H., and Turki, T. (2023). Principal component analysis- and tensor decomposition-based unsupervised feature extraction to select more suitable differentially methylated cytosines: optimization of standard deviation versus state-of-the-art methods. Genomics 115, 110577. doi: 10.1016/j.ygeno.2023.110577
Turki, T., Roy, S. S., and Taguchi, Y.-H. (2023). Optimized Tensor Decomposition and PCA Outperforming State-of-the-Art Methods When Analyzing Histone Modification ChIP-seq Profiles. Algorithm. 16, 401. doi: 10.3390/a16090401
Vlachos, I. S., Zagganas, K., Paraskevopoulou, M. D., Georgakilas, G., Karagkouni, D., Vergoulis, T., et al. (2015). DIANA-miRPath v3.0: deciphering microRNA function with experimental support. Nucleic Acids Res. 43, W460–W466. doi: 10.1093/nar/gkv403
Keywords: tensor decomposition, feature selection, unsupervised learning, gene expression, multiomics
Citation: Taguchi Y-h and Turki T (2023) Application note: TDbasedUFE and TDbasedUFEadv: bioconductor packages to perform tensor decomposition based unsupervised feature extraction. Front. Artif. Intell. 6:1237542. doi: 10.3389/frai.2023.1237542
Received: 22 June 2023; Accepted: 07 August 2023;
Published: 01 September 2023.
Edited by:
Enrico Capobianco, Jackson Laboratory, United StatesReviewed by:
Varij Nayan, Central Institute for Research on Buffaloes (ICAR), IndiaShigao Huang, Fourth Military Medical University, China
Copyright © 2023 Taguchi and Turki. This is an open-access article distributed under the terms of the Creative Commons Attribution License (CC BY). The use, distribution or reproduction in other forums is permitted, provided the original author(s) and the copyright owner(s) are credited and that the original publication in this journal is cited, in accordance with accepted academic practice. No use, distribution or reproduction is permitted which does not comply with these terms.
*Correspondence: Y-h. Taguchi, tag@granular.com