Using knowledge graphs to infer gene expression in plants
 Anne E. Thessen1*
  Laurel Cooper2†
  Tyson L. Swetnam3† Harshad Hegde4†
  Justin Reese4† Justin Elser2†
  Pankaj Jaiswal2†
- 1Department of Biomedical Informatics, University of Colorado Anschutz Medical Campus, Aurora, CO, United States
- 2Department of Botany and Plant Pathology, Oregon State University, Corvallis, OR, United States
- 3BIO5 Institute, University of Arizona, Tucson, AZ, United States
- 4Environmental Genomics and Systems Biology Division, Berkeley Lab (DOE), Berkeley, CA, United States
Introduction: Climate change is already affecting ecosystems around the world and forcing us to adapt to meet societal needs. The speed with which climate change is progressing necessitates a massive scaling up of the number of species with understood genotype-environment-phenotype (G×E×P) dynamics in order to increase ecosystem and agriculture resilience. An important part of predicting phenotype is understanding the complex gene regulatory networks present in organisms. Previous work has demonstrated that knowledge about one species can be applied to another using ontologically-supported knowledge bases that exploit homologous structures and homologous genes. These types of structures that can apply knowledge about one species to another have the potential to enable the massive scaling up that is needed through in silico experimentation.
Methods: We developed one such structure, a knowledge graph (KG) using information from Planteome and the EMBL-EBI Expression Atlas that connects gene expression, molecular interactions, functions, and pathways to homology-based gene annotations. Our preliminary analysis uses data from gene expression studies in Arabidopsis thaliana and Populus trichocarpa plants exposed to drought conditions.
Results: A graph query identified 16 pairs of homologous genes in these two taxa, some of which show opposite patterns of gene expression in response to drought. As expected, analysis of the upstream cis-regulatory region of these genes revealed that homologs with similar expression behavior had conserved cis-regulatory regions and potential interaction with similar trans-elements, unlike homologs that changed their expression in opposite ways.
Discussion: This suggests that even though the homologous pairs share common ancestry and functional roles, predicting expression and phenotype through homology inference needs careful consideration of integrating cis and trans-regulatory components in the curated and inferred knowledge graph.
Introduction
Climate change is already affecting ecosystems around the world and forcing us to explore ways to adapt to meet societal needs. This is particularly true in crop science where researchers are working to identify and predict genes and their resulting phenotypes under different environmental conditions in order to secure food production under a new climate regime (Thudi et al., 2021; Tian et al., 2021). Understanding gene/phenotype/environment relationships requires a large data set which can be difficult to collect, so most researchers focus on a small number of heavily studied species. The speed with which climate change is progressing necessitates a massive scaling up of the number of species with understood G/P/E dynamics. The research and the knowledge gained in this area will also help human exploration in space, where plants will play an important role (Barker et al., 2023). Previous study has demonstrated that knowledge about one species can be applied to another using ontologically supported knowledgebases that exploit homologous structures and orthologous genes (Naithani et al., 2020). These types of knowledge structures that can apply knowledge about one species to another have the potential to enable the massive scaling up that is needed.
An important part of predicting phenotype is understanding the complex gene regulatory networks present in plants. This study will focus on the promoter region, the 5′ cis-regulatory regions of the homologs. This region is a portion of the DNA strand that is “upstream” from the 5′ end of the gene's coding start site and provides selective binding sites for trans-acting factors such as transcription factors, repressors, and activators that regulate the expression of the gene (Liu et al., 1999). These regions are just one element of the gene expression process. Studying the expression of trans-acting factors is important for understanding the spatiotemporal dynamics of molecular interactions that help adapt or overcome stress. Resources such as the Gene Ontology (The GO Consortium, 2021), Planteome (Cooper et al., 2018), Plant Reactome (Naithani et al., 2020), and KnetMiner (Hassani-Pak et al., 2021) contain much of what we know about gene function, gene regulatory networks, and phenotypes in the form of Gene X regulates Gene Y and Gene Y impacts phenotype Z, but the contextual effect of environmental conditions under which these interactions happen is almost always not included in the annotations. Not all plants and their genes are characterized in detail, but if it is included, the environmental context is usually detailed only in the metadata. Investigations that use protein domain identification and gene homology-based methods to infer the functional role a gene carries out in a given species may be overlooking the spatial and temporal dynamics of mRNA expression that determines whether a gene product (protein) will be present at the desired time and place to serve a molecular function. The interactive nature of genes, environments, and phenotypes requires a data structure that can represent qualitative relationships (e.g., “has phenotype” or “regulates”) and integrate heterogeneous data types in a single, queryable framework. One of these data structures is a knowledge graph (KG) (Sheth et al., 2019).
A graph is made up of objects (nodes) and the relationships (edges) between those objects and, in this context, represents what we know about how biological and environmental entities (objects) interact. Rather than store data in a table or database, a knowledge graph stores the synthesized knowledge we gain from the data, e.g., Gene X has phenotype Y. As more knowledge is added to the graph, more complex queries, network analyses, and inferences can be made. Important examples include the use of knowledge graphs in rare disease diagnosis in humans (Zemojtel et al., 2014), drug repurposing (Reese et al., 2021), improving cancer treatment (Gogleva et al., 2022), and meta-analyses (Tiddi et al., 2020). KGs used for translational science rarely contain environmental exposures even though we know environmental conditions are an important part of gene expression dynamics. The exact way to model exposures in a KG is still under development (Chan et al., 2023). A KG containing information about plant genomics and phenomics under different environmental conditions can be used to generate hypotheses in silico for targeting, thereby reducing the number of in vivo experiments that need to be conducted, saving time and resources.
This study examines gene expression patterns in response to drought conditions in four plant species, such as Arabidopsis thaliana, Zea mays, Sorghum bicolor, and Populus trichocarpa. The central motivation of this study is to assess the feasibility of using homologs to make predictions about gene expression in multiple species.
Materials and methods
Data description
Planteome
The Planteome (https://planteome.org/) is a centralized web portal with a suite of interrelated ontologies for plants and a database of plant genomics data, annotated to the ontology terms (Cooper et al., 2018). In the October 2020 release (version 4.0), the Planteome database included approximately 60,000 ontology terms and more than 3 million data objects, which are connected to ontology terms through approximately 20 million associations. The Planteome database has plant genomic information covering 125 plant taxa. The data available in the Planteome and annotated with ontology terms, include plant gene expression data, traits, phenotypes, genomes, and germplasm sources.
The ontologies developed in-house by the Planteome project include the Plant Ontology (PO; Cooper et al., 2018; Walls et al., 2019), which describes plant anatomical structures and developmental stages, the Plant Trait Ontology (TO) for traits and phenotypes, and the Plant Experimental Conditions Ontology (PECO), which describes experimental conditions and plant exposures. In addition to these, the Planteome hosts the collaborator reference ontologies—the Gene Ontology (GO; The GO Consortium, 2021), Phenotype and Trait Ontology (PATO; Gkoutos et al., 2018), and also a number of species-specific trait dictionaries developed by the Crop Ontology (CO; Shrestha et al., 2010; Arnaud et al., 2020). In the current release, the Planetome includes 11 of the CO trait dictionaries, mapped to the TO.
GO annotations were computationally generated for new species using InParanoid and InterProScan (Shulaev et al., 2011; Myburg et al., 2014). InParanoid was used to predict gene orthology based on the Arabidopsis thaliana associations generated by TAIR (Reiser et al., 2022). InterProScan was used to add GO annotations to genes via inference by analyzing protein families and domain mappings (Paysan-Lafosse et al., 2023).
EMBL-EBI expression atlas
The EMBL-EBI Expression Atlas (GXA) can be accessed online and is part of the European Bioinformatics Institute (Papatheodorou et al., 2020). It contains manually curated and analyzed data from over 900 plant experiments that have been re-analyzed using the latest versions of the reference plant genome assembly and annotations and by deploying a standardized analysis workflow. Every experiment is fully documented with metadata and provenance.
Gene expression data were downloaded as a table from GXA after searching for desired species and environmental conditions. Data were filtered to include only genes that had statistically different gene expressions (p <0.05) compared with a baseline that was <-1 or >1. Genes with positive differential expression were annotated as having increased expression. Genes with negative differential expression were annotated as having decreased expression. The tabulated data were annotated with additional ontology terms where appropriate and made available in GitHub for graph construction.
Creating the graph
The graph was created by combining data from Planteome, the GXA, PO, TO, GO, and PECO using the tools available at KG-Hub (Caufield et al., 2023). First, the data and mapping files were downloaded from their respective data repositories. GO-Basic and NCBI Tax-Slim were downloaded from the OBO Foundry in javascript object notation (JSON) format. PO and TO were downloaded from the OBO Foundry in owl format and transformed to JSON using ROBOT (Jackson et al., 2019). Data files containing information about Sorghum bicolor, Zea mays, Oryza sativa, Populus trichocarpa, and Arabidopsis thaliana were downloaded from Planteome servers in GAF format. Data files containing differential gene expression data involving Sorghum bicolor, Zea mays, Oryza sativa, Populus trichocarpa, and Arabidopsis thaliana in drought and saline environments were downloaded from the GXA. Several mapping files were used to normalize gene and trait identifiers. Rice gene identifiers were mapped to Oryza sativa v7.0 using the ID converter file from the Rice Annotation Project Database (Ouyang et al., 2007; Sakai et al., 2013). Maize gene identifiers were mapped to Zm-B73-REFERENCE-NAM-5.0 assembly using a mapping file that includes all B73 assembly versions and includes the DAGchainer analysis which was obtained from MaizeGDB (Portwood et al., 2019; EMBL-EBI). Poplar gene identifiers were mapped to the reference genome using a mapping file from Gramene (Tello-Ruiz et al., 2018). Sorghum gene names were normalized to Sorghum bicolor v3.1.1 (McCormick et al., 2018). Plant traits and phenotypes were annotated with TO terms using a look-up dictionary file. Second, each of the data files was transformed into standardized nodes and edges in a tsv file using custom scripts. These scripts normalized gene and trait identifiers using ontologies and the provided mapping files and annotated every entity with a Biolink semantic type (Table 1), and relationships between entities were described using Biolink predicates (Table 2). The graph was assembled according to the Biolink model, which provides standard semantic types and relationships for biological entities (Unni et al., 2022).
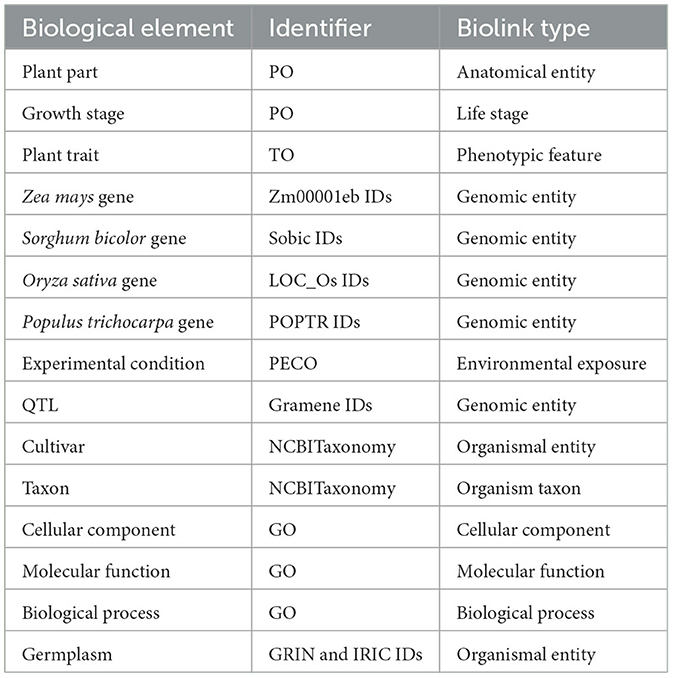
Table 1. Identifiers and Biolink semantic types assigned to elements of the graph.
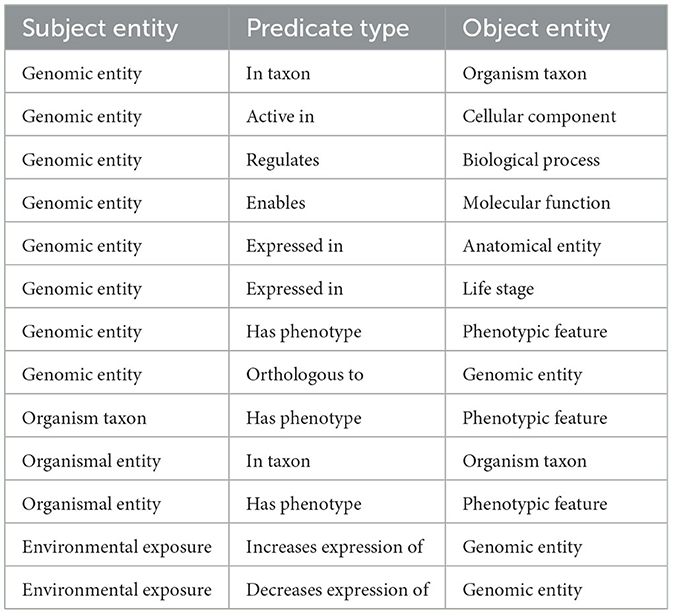
Table 2. Edges and their Biolink predicates.
There was not enough overlapping expression data to include O. sativa or saline environments in this analysis, but they were included in the graph.
The third and final step merged the transformed tsv files into a deduplicated list of nodes and edges in KGX format. The final graph consisted of over 400,000 nodes and over 5,000,000 edges and contained additional data from EOLTraitbank that was not used in this study (Figure 1). Specific information about quantitative and qualitative plant phenotypes was represented as an edge property (Figure 2).
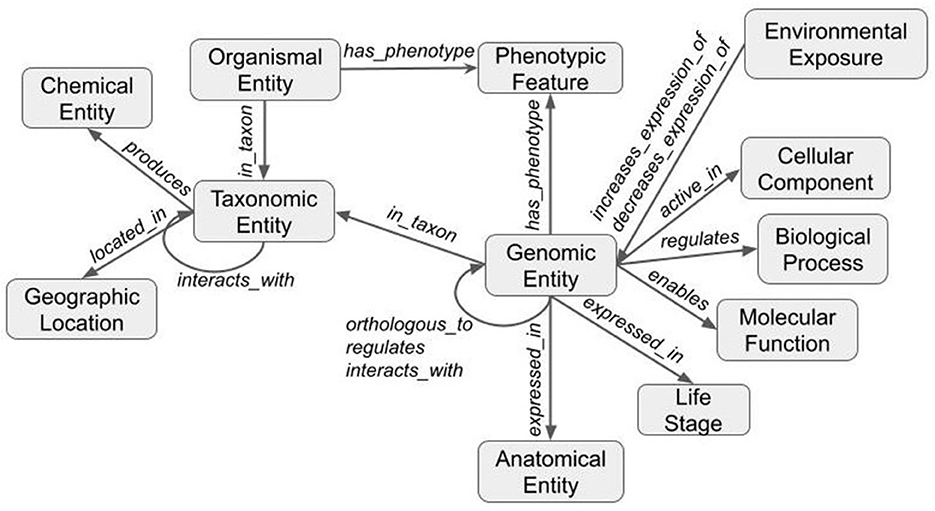
Figure 1. Structure of the knowledge graph. Data are transformed using ontologies and the Biolink model to form a graph. Nodes (gray boxes) are labeled with Biolink semantic type and edges (gray arrows) are labeled with Biolink predicate. Arrows indicate directionality.
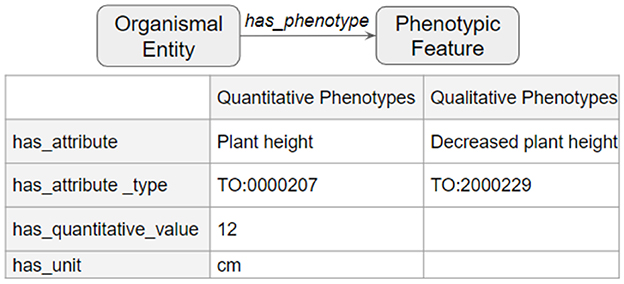
Figure 2. Phenotype data in edge properties. Detailed phenotype information was represented as a collection of edge properties that can accommodate quantitative and qualitative phenotypes.
Querying the graph
The merged node file and edge file were uploaded into Neo4j for exploration and query. A Cipher query (Box 1) was used to find all of the homologous genes that had been documented to have differential gene expression in either a drought or a saline environment (Supplementary material 1, 2). The saline environment did not return overlapping data.
Box 1. Cipher query.
MATCH (e {id:'PECO:0007404′})-[r]->(g),(g)-[q:‘biolink: orthologous_to‘]-(h), (e {id:'PECO:0007404′})-[s]->(h) RETURN *
Genes returned from the query for the drought environment were compared based on GO annotations (Supplementary material 3), but this also did not give enough data to make conclusions using PANTHER (Supplementary material 4).
Comparing promoter regions
We collected 5′-regulatory regions of the identified genes (700–900 bp) using BioMart in the Gramene database (Spooner et al., 2012) and searched for potential transcription factor-binding sites using PlantPAN (Chow et al., 2016). Using these data (Supplementary material 5), we created a matrix comparing the occurrence of each transcription factor in the binding site of each gene pair and made note of which were or were not held in common. We used ClustVis (Metsalu and Vilo, 2015) to examine the similarity between the transcription factor-binding sites for each of the Populus and Arabidopsis gene pairs using PCA. A total of 12 transcription factor-binding sites (AT-Hook, bHLH, C2H2, Dehydrin, Dof, GATA, Homeodomain, Myb/SANT, NF-YB, TBP, Trihelix, and ZF-HD) were present in the promoter regions of all the genes studied and thus were removed from clustering analysis. The same data were fed into Morpheus (Müller et al., 2008) for hierarchical clustering performed with default parameters using One minus Pearson's correlation and complete linkage methods on the TF-binding site annotations. Additional similarity matrices were created using Pearson's correlation metric to separately examine the TF-binding site annotations for genes with similar and contrasting expression profiles. The correlation heatmap colors were adjusted for visualization purposes.
Data availability
The merged KG data are hosted on the CyVerse DataCommons (https://datacommons.cyverse.org/browse/iplant/home/shared/genophenoenvo). The KG data are available for direct download or remote visualization via CyVerse WebDav service (https://data.cyverse.org/dav-anon/iplant/commons/community_released/genophenoenvo/kg/) using visualization software such as Neo4J. The Python code used to create the graphs is publicly hosted on GitHub (https://github.com/genophenoenvo/knowledge-graph). The final merged KG includes two tab-separated value (tsv) files which include the edges and nodes.
Results
The graph query returned 62 pairs of homologous genes from Sorghum bicolor, Zea mays, Arabidopsis thaliana, and Populus trichocarpa (Supplementary material 6), but only 16 pairs between A. thaliana and P. trichocarpa had documented similar (8) and differential (8) expressions in drought conditions (Table 3). All of the genes with similarly expressed pairs had decreased expression. Expression data for the 16 homologous pairs of A. thaliana and P. trichocarpa came from two studies in GXA (de Simone et al., 2017; Filichkin et al., 2018).
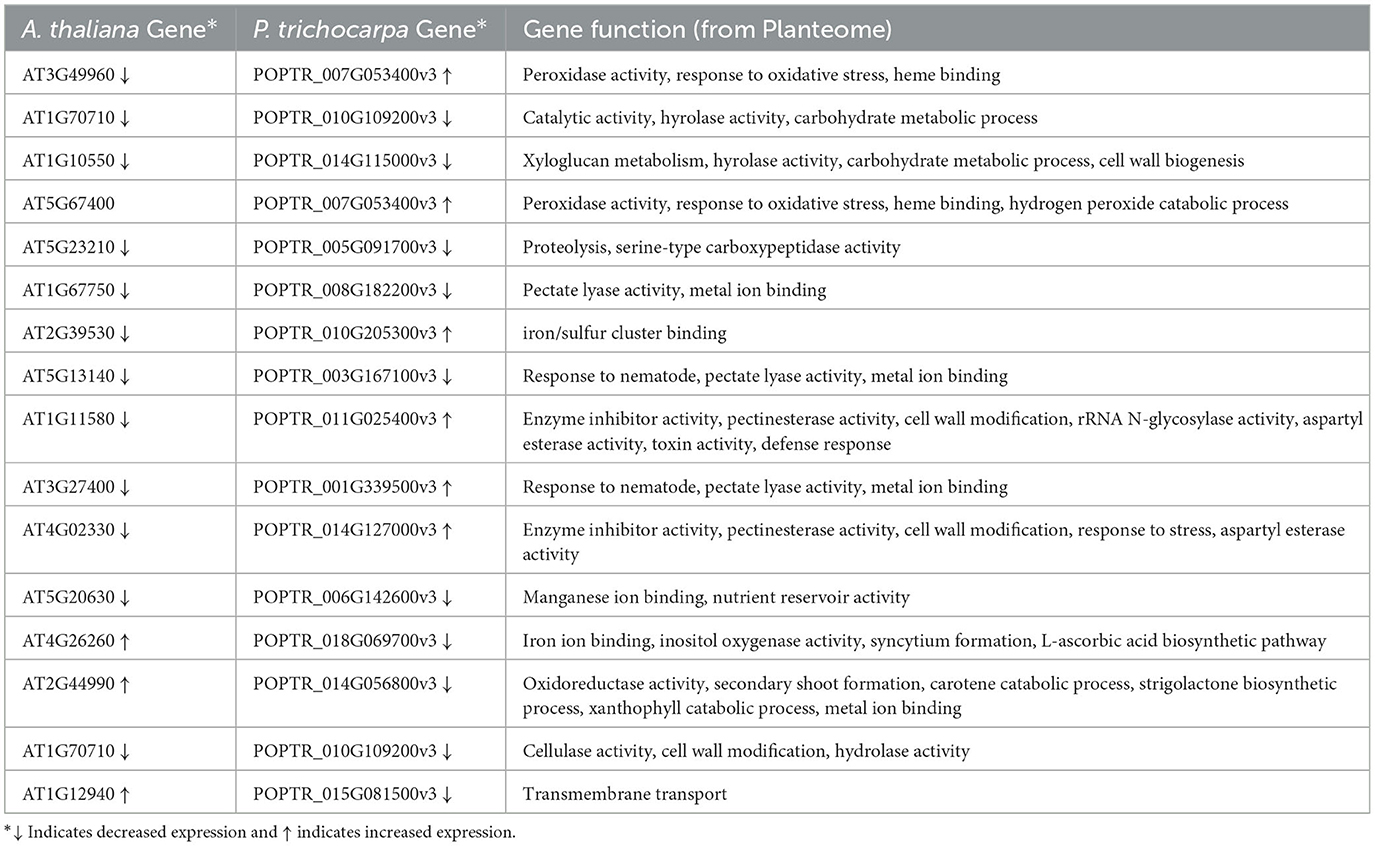
Table 3. Gene expression in A. thaliana and P. trichocarpa homologous genes under drought conditions.
Based on the predicted transcription factor-binding sites in the promoter regions, the Populus genes in the differentially expressed homolog pairs cluster separately from the other Populus and Arabidopsis genes (Figure 3). This difference is driven by a group of 11 transcription factor-binding sites that are absent in the promoter regions of the subset of divergent Populus genes (RAV, MIKC, NAM, G2-like, CPP, ARR-B, tify, TALE, NF-YC, ERF, and NF-YA). The separation of these genes cannot be explained by the taxon or the study providing the data (which overlaps the taxon).
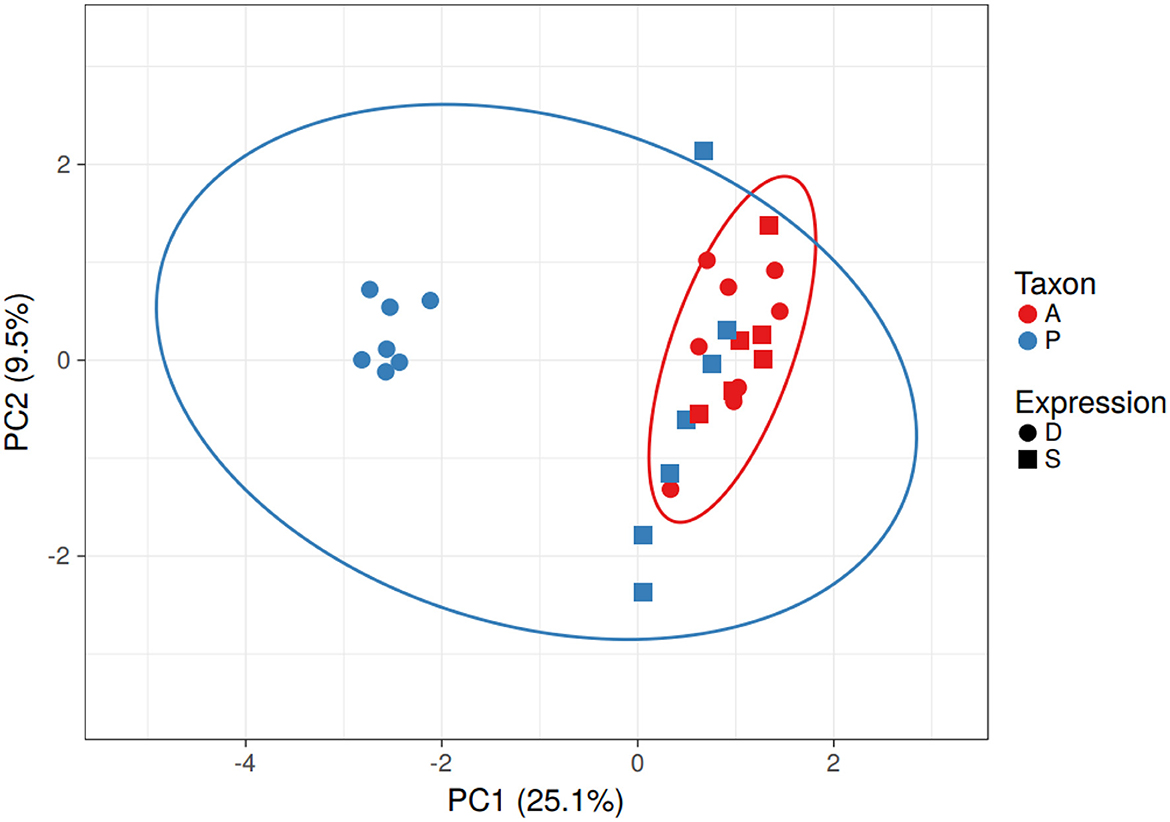
Figure 3. Clustering of Populus and Arabidopsis genes based on similarity of the transcription factor-binding sites in the promoter region - PCA. The Populus genes from the differentially expressed homolog pairs (blue circles) clustered away from the other Populus (blue) and Arabidopsis (red) genes. Differentially expressed genes are represented as circles and similarly expressed genes are represented as squares. Note that taxonomic differences (blue and red ovals) do not explain the differences in gene expression. No scaling is applied to rows; SVD with imputation is used to calculate principal components. X and Y axes show principal component 1 and principal component 2 that explain 25.1 and 9.5% of the total variance, respectively. N = 29 data points.
There were seven Populus genes that clustered away from the others. All but one (POPTR_014G056800v3 involved in strigolactone biosynthesis) were hypothetical proteins (According to Gramene). GO annotations for these genes clustered around transporter activity, catabolic activity, response to stress, binding, and catalytic activity. The 11 transcription factors absent in the binding sites of the Populus genes include proteins involved in plant stress response in Arabidopsis (According to UniProt).
A comparison of the promoter regions between homolog pairs showed that homologs that were expressed similarly had more similar promoter regions than pairs that were expressed differentially (Figure 4).
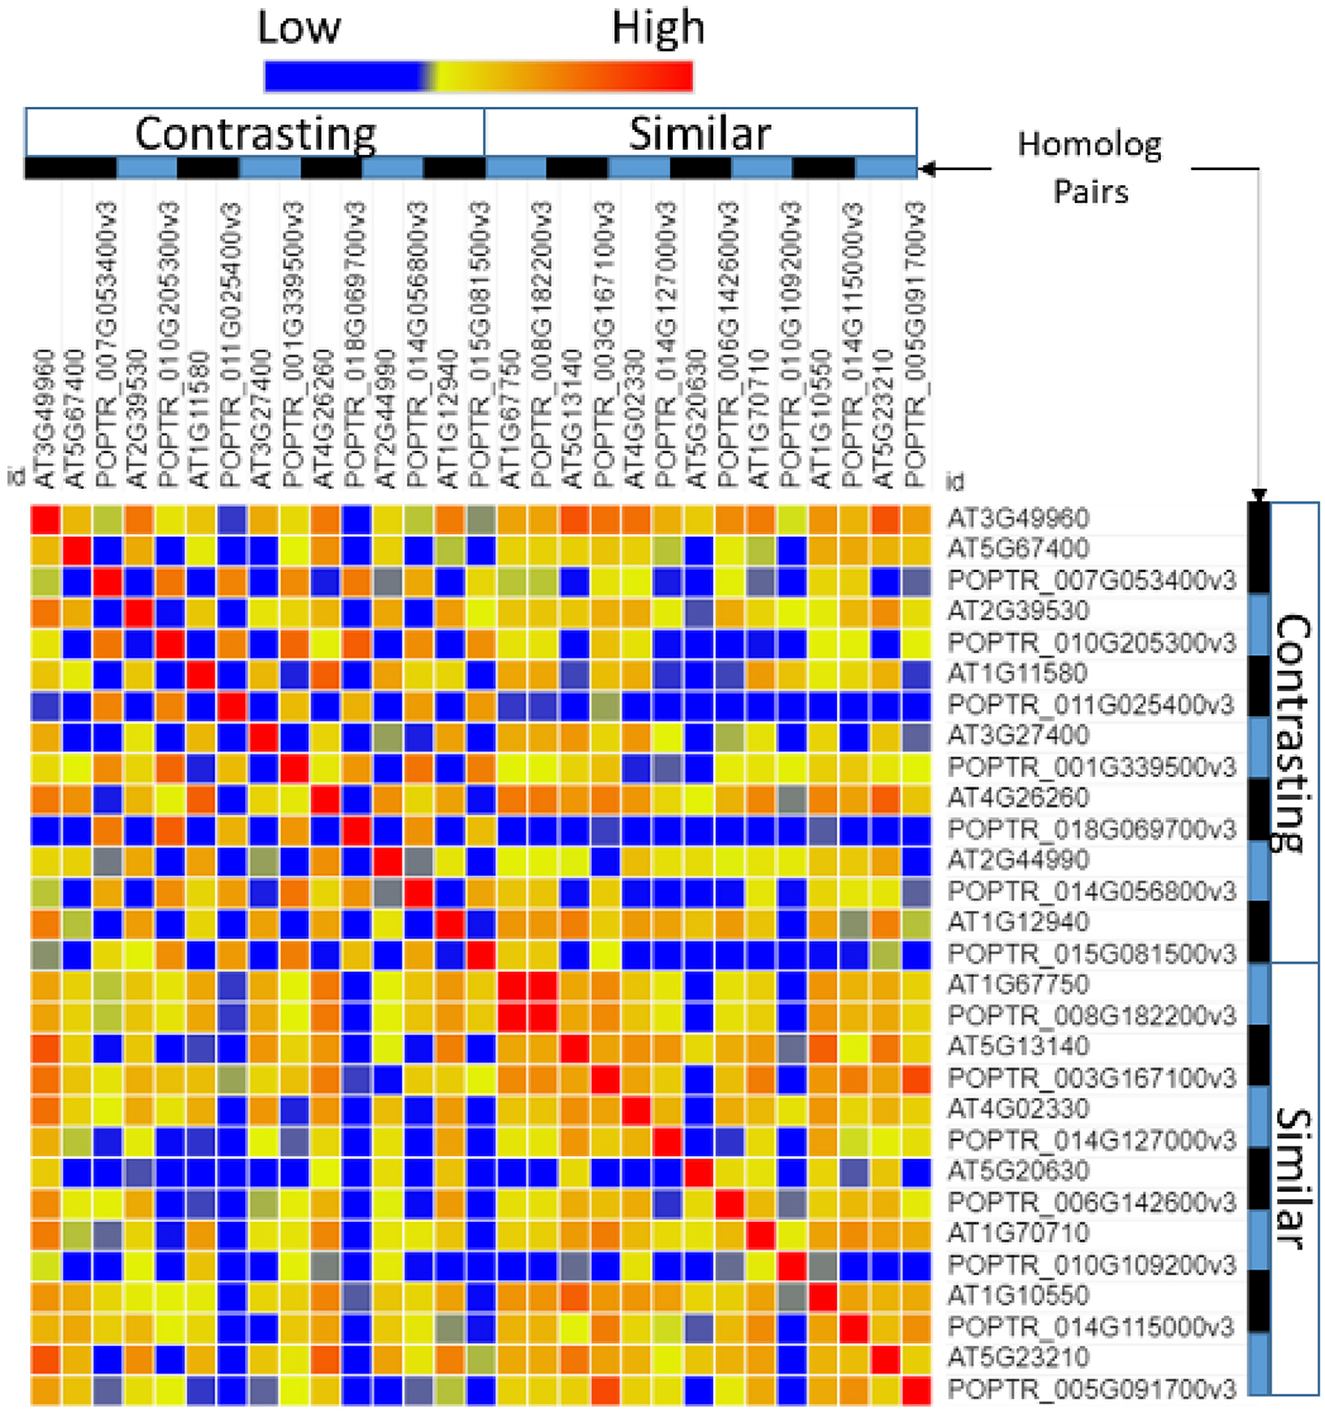
Figure 4. Similarity of the transcription factor-binding sites in the promoter region of Populus and Arabidopsis homologous gene pairs. Poplar (POPTR) and Arabidopsis (AT) genes were grouped into their homolog pairs and whether they had similar or contrasting gene expression when exposed to drought. This figure shows that the promoter regions of pairs with contrasting expressions were less similar (blue) and the promoter regions of pairs with similar expressions were more similar (red).
Separate comparisons of the promoter regions from gene pairs with contrasting expression profiles also show that gene pairs with similar expression had more similar promoter regions (Figure 5A) and gene pairs with contrasting expression had less similar promoter regions (Figure 5B).
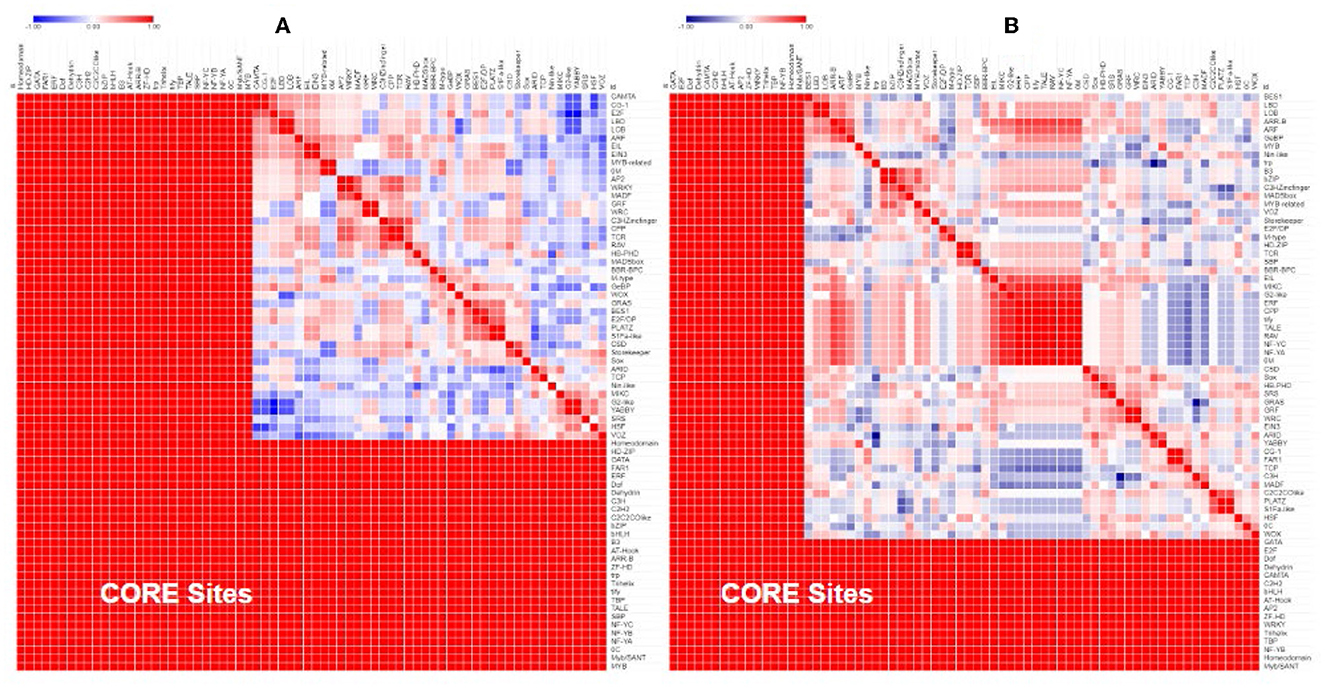
Figure 5. Similarity of the transcription factor-binding sites in the promoter region of Populus and Arabidopsis genes grouped by their expression profile. Genes that were similarly expressed in a drought treatment (A) had more similar promoter regions (red) than genes that were differentially expressed (B).
Discussion
This study shows that one can use in silico experiments to predict gene expression in drought conditions using homologous gene families in some species pairs but not all. This study supports previous findings that in some cases, promoter regions evolve separately from the coding region of the genes they regulate (Tirosh et al., 2008). Thus, we can translate knowledge about gene expression in one species to another, but we need to include these dynamics in the data infrastructures we use to make this translation, in this case, KGs. Many data structures link a gene to a phenotype, trait, or disease without specific expression information. The current representation of differential gene expression links exposure to a chemical or a drug to the increased or decreased expression of a specific gene in the context of toxicology and drug development (Fecho et al., 2022; Unni et al., 2022). Gene regulatory networks are represented as mini-networks of genes that influence other genes (The GO Consortium, 2021), but many of these networks are still unknown in plants. In the short term, in silico KG experiments involving gene expression can be improved by including empirically validated gene expression patterns of homologs.
Gene regulatory networks in plants have been developed using a combination of experimental and computational approaches (Kulkarni and Vandepoele, 2020). Methods combining high-throughput DNA sequencing (ChIP-seq) and expression data have successfully revealed the detailed regulatory networks controlling flowering (Chen et al., 2018) but are difficult to scale. Methods such as ATAC-seq and DAP-seq are more scalable but only reveal a partial picture of the regulatory network (O'Malley et al., 2016; Maher et al., 2018). KGs can be used to infer regulatory networks at scale, but the quality is highly dependent on the data used to build the KG. The advantage of applying a KG is the ability to integrate incredibly heterogeneous data in a single graph, thus modeling regulatory networks in their larger biological context. An example of this application is the relatively new field of “network medicine” that uses KGs to examine the progression of disease (Silverman et al., 2020). The main disadvantage of KGs in this application is that large amounts of computable data and domain-specific knowledge models are needed to create a graph of this type. Many disciplines do not have these resources available. While KGs can infer gene regulatory networks, these networks should always be confirmed using established experimental and computational approaches.
These opposing gene expression patterns are not a concern for researchers who are only interested in finding a list of genes that are potentially important in a specific context. It is not until one needs to generate hypotheses about the impact of the environment on the biological function that more complex graph representations become needed. If we are to incorporate the effect of the environment, we need to know more than that Gene X has phenotype Y. We need to know if the environmental effect increases or decreases the expression of the gene and the biological consequences of that change in expression. In some cases, we may only know that an environment is linked to a specific phenotype without knowing the underlying mechanism. This information can still add useful knowledge to the graph. In some cases, the graph itself can be used to generate hypotheses about the interplay between genes, biological processes, molecular functions, cellular components, and an observed phenotype.
Despite having the graph available to quickly explore the data and locate genes of interest, the workflow for comparing the promoter regions required substantial manual intervention. In this instance, we only had 16 gene pairs to explore, but scaling up these types of analyses will require the ability to traverse data annotated with gene identifiers and gene coordinates. Future studies should include extending the graph model to include these data types.
The semantic representation of the effect of environmental exposure on gene expression is more straightforward for the effects of a chemical or a substance, such as phenol or rubber cement. Data can be collected in the laboratory using model organisms, and the results added to the graph for analysis and translational research. Everyday environmental exposures are rarely this simple and frequently involve exposure to many types of substances in different contexts, such as climate or socioeconomic status. Future studies may need to develop ontologies and semantic representations for these more complex exposures.
Our observations support our hypothesis and justify the extension of our KG to include TF-binding site annotations and the actual TF genes, which are either known empirically or are supported by co-expression network analysis. In future, an investigation of conservation vs. non-conservation of cis- and trans-regulatory regions of genes may improve the understanding of interspecies and intraspecies responses to stress and adaptation.
Data availability statement
The merged KG data are hosted on the CyVerse DataCommons (https://datacommons.cyverse.org/browse/iplant/home/shared/genophenoenvo). The KG data are available for direct download or for remote visualization via CyVerse WebDav service (https://data.cyverse.org/dav-anon/iplant/commons/community_released/genophenoenvo/kg/) using visualization software such as Neo4J. The python code used to create the graphs are publicly hosted on GitHub (https://github.com/genophenoenvo/knowledge-graph). The final merged KG includes two tab-separated value (tsv) files which include the edges and nodes.
Author contributions
AT developed and framed research question(s), analyzed data, contributed to data analysis, developed software, contributed to writing and revising the paper, and project administration and management. HH contributed to data analysis. TS contributed to data analysis and contributed to writing and revising the paper. JR developed software, validated results or software, developed and framed research question(s), and contributed to writing and revising the paper. LC contributed to data analysis, project administration and management, and contributed to writing and revising the paper. PJ developed and framed research question(s), analyzed data, contributed to data analysis, and contributed to writing and revising the paper. JE contributed to data analysis, developed software, validated results or software, and contributed to writing and revising the paper. All authors contributed to the article and approved the submitted version.
Funding
This study was supported by the National Science Foundation grant awards #1940330, #1939945, #1940059, and #1940062. CyVerse is based upon work supported by the National Science Foundation grant awards #0735191, #1265383, and #1743442.
Acknowledgments
The authors would like to thank Sierra Moxon and Harry Caufield for their technical assistance and helpful conversation. The preprint for this paper can be found at https://doi.org/10.5281/zenodo.7764762.
Conflict of interest
The authors declare that the research was conducted in the absence of any commercial or financial relationships that could be construed as a potential conflict of interest.
Publisher's note
All claims expressed in this article are solely those of the authors and do not necessarily represent those of their affiliated organizations, or those of the publisher, the editors and the reviewers. Any product that may be evaluated in this article, or claim that may be made by its manufacturer, is not guaranteed or endorsed by the publisher.
References
Arnaud, E., Hazekamp, T., Laporte, M. A., and Antezana, E. (2020). Crop Ontology Governance and Stewardship Framework. Available online at: https://cgspace.cgiar.org/handle/10568/118001 (accessed May 31, 2023).
Barker, R., Kruse, C. P. S., Johnson, C., Saravia-Butler, A., Fogle, H., and Chang, H-S., et al. (2023). Meta-analysis of the space flight and microgravity response of the arabidopsis plant transcriptome. NPJ Microgr. 9, 21. doi: 10.1038/s41526-023-00247-6
Caufield, J. H., Putman, T., Schaper, K., Unni, D. R., Hegde, H., Callahan, T. J., et al. (2023). KG-Hub – building and exchanging biological knowledge graphs. arXiv. Available online at: http://arxiv.org/abs/2302.10800
Chan, L. E., Thessen, A. E., Duncan, W. D., Matentzoglu, N., Schmitt, C., Grondin, C. J., et al. (2023). The Environmental Conditions, Treatments, and Exposures Ontology (ECTO): Connecting Toxicology and Exposure to Human Health and beyond. J. Biomed. Semantics. 14, 3. doi: 10.1186/s13326-023-00283-x
Chen, D., Yan, W., Fu, L. Y., and Kaufmann, K. (2018). Architecture of gene regulatory networks controlling flower development in Arabidopsis thaliana. Nat. Commun. 9, 4534. doi: 10.1038/s41467-018-06772-3
Chow, C. N., Zheng, H. Q., Wu, N. Y., Chien, C. H., Huang, H. D., Lee, T. Y., et al. (2016). PlantPAN 2.0: an update of plant promoter analysis navigator for reconstructing transcriptional regulatory networks in plants. Nucleic Acids Res. 44, D1154–D1160. doi: 10.1093/nar/gkv1035
Cooper, L., Meier, A., Laporte, M-A., Elser, J. L., and Mungall, C., Sinn, B. T., et al. (2018). The planteome database: an integrated resource for reference ontologies, plant genomics and phenomics. Nucleic Acids Res. 46, D1168–D1180. doi: 10.1093/nar/gkx1152
de Simone, A., Hubbard, R., Torre, N. V., Velappan, Y., Wilson, M., Considine, M. J., et al. (2017). Redox changes during the cell cycle in the embryonic root meristem of Arabidopsis Thaliana. Antioxid Redox Signal. 27, 1505–1519. doi: 10.1089/ars.2016.6959
EMBL-EBI. n.d. ENA Browser. Available online at: https://www.ebi.ac.uk/ena/browser/view/GCA_902167145.1 (accessed March 10, 2023).
Fecho, K., Thessen, A. E., Baranzini, S. E., Bizon, C., Hadlock, J. J., Huang, S., et al. (2022). Progress toward a Universal Biomedical Data Translator. Clin. Transl. Sci. 15, 1838–1847. doi: 10.1111/cts.13301
Filichkin, S. A., Hamilton, M., Dharmawardhana, P. D., Singh, S. K., Sullivan, C., Ben-Hur, A., et al. (2018). Abiotic stresses modulate landscape of poplar transcriptome via alternative splicing, differential intron retention, and isoform ratio switching. Front. Plant Sci. 9, 5. doi: 10.3389/fpls.2018.00005
Gkoutos, G. V., Schofield, P. N., and Hoehndorf, R. (2018). The anatomy of phenotype ontologies: Principles, properties and applications. Brief. Bioinform. 19, 1008–1021. doi: 10.1093/bib/bbx035
Gogleva, A., Polychronopoulos, D., Pfeifer, M., Poroshin, V., Ughetto, M., Martin, M. J., et al. (2022). Knowledge graph-based recommendation framework identifies drivers of resistance in EGFR mutant non-small cell lung cancer. Nat. Commun. 13, 1667. doi: 10.1038/s41467-022-29292-7
Hassani-Pak, K., Singh, A., Brandizi, M., Hearnshaw, J., Parsons, J. D., Amberkar, S., et al. (2021). KnetMiner: A comprehensive approach for supporting evidence-based gene discovery and complex trait analysis across species. Plant Biotechnol. J. 19, 1670–1678. doi: 10.1111/pbi.13583
Jackson, R. C., Balhoff, J. P., Douglass, E., Harris, N. L., Mungall, C. J., Overton, J. A. R. O. B. O. T., et al. (2019). A tool for automating ontology workflows. BMC Bioinformatics. 20, 407. doi: 10.1186/s12859-019-3002-3
Kulkarni, S. R., and Vandepoele, K. (2020). Inference of plant gene regulatory networks using data driven methods: A practical overview. Gene Regul. Mecha. 1863, 194447. doi: 10.1016/j.bbagrm.2019.194447
Liu, L., White, M. J., and MacRae, T. H. (1999). Transcription factors and their genes in higher plants functional domains, evolution and regulation. Eur. J. Biochem. 262, 247–257. doi: 10.1046/j.1432-1327.1999.00349.x
Maher, K. A., Bajic, M., Kajala, K., Reynoso, M., Pauluzzi, G., West, D. A., et al. (2018). Profiling of accessible chromatic regions across multiple plant species and cell types reveals common gene regulatory principles and new control modules. Plant Cell. 30, 15–36. doi: 10.1105/tpc.17.00581
McCormick, R. F., Truong, S. K., Sreedasyam, A., Jenkins, J., Shu, S., Sims, D., et al. (2018). The sorghum bicolor reference genome: improved assembly, gene annotations, a transcriptome atlas, and signatures of genome organization. The Plant J. 93, 338–354. doi: 10.1111/tpj.13781
Metsalu, T., and Vilo, J. (2015). ClustVis: a web tool for visualizing clustering of multivariate data using principal component analysis and heatmap. Nucleic Acids Res. 43, W566–W570. doi: 10.1093/nar/gkv468
Müller, E., Assent, I., Krieger, R., Jansen, T., and Seidl, T. (2008). “Morpheus,” in Proceedings of the 14th ACM SIGKDD International Conference on Knowledge Discovery and Data Mining (New York, NY, USA: ACM). doi: 10.1145/1401890.1402026
Myburg, A. A., Grattapaglia, D., Tuskan, G. A., Hellsten, U., Hayes, R. D., Grimwood, J., et al. (2014). The genome of eucalyptus grandis. Nature. 510, 356–362. doi: 10.1038/nature13308
Naithani, S., Gupta, P., Preece, J., D'Eustachio, P., Elser, J. L., Garg, P., et al. (2020). Plant reactome: a knowledgebase and resource for comparative pathway analysis. Nucleic Acids Res. 48, D1093–1103. doi: 10.1093/nar/gkz996
O'Malley, R. C., Huang, S. C., Song, L., Lewsey, M. G., Bartlett, A., Nery, J. R., et al. (2016). Cistrome and epicistrome features shape the regulatory DNA landscape. Cell. 166, 1598. doi: 10.1016/j.cell.2016.08.063
Ouyang, S., Zhu, W., Hamilton, J., Lin, H., Campbell, M., Childs, K., et al. (2007). The TIGR rice genome annotation resource: improvements and new features. Nucleic Acids Res. 35, D883–D887. doi: 10.1093/nar/gkl976
Papatheodorou, I., Moreno, P., Manning, J., Muñoz-Pomer Fuentes, A., George, N., Fexova, S., et al. (2020). Expression atlas update: from tissues to single cells. Nucleic Acids Res. 48, D77–83. doi: 10.1093/nar/gkz947
Paysan-Lafosse, T., Blum, M., Chuguransky, S., Grego, T., Pinto, B. L., Salazar, G. A., et al. (2023). InterPro in 2022. Nucleic Acids Res. 51, D418–D427. doi: 10.1093/nar/gkac993
Portwood, J. L., Woodhouse, M. R., Cannon, E. K., Gardiner, J. M., Harper, L. C., Schaeffer, M. L., et al. (2019). MaizeGDB 2018: the maize multi-genome genetics and genomics database. Nucleic Acids Res. 47, D1146–D1154. doi: 10.1093/nar/gky1046
Reese, J. T., Unni, D., Callahan, T. J., Cappelletti, L., Ravanmehr, V., Carbon, S., et al. (2021). KG-COVID-19: A framework to produce customized knowledge graphs for COVID-19 response. Patterns. 2, 100155. doi: 10.1016/j.patter.2020.100155
Reiser, L., Subramaniam, S., Li, D., and Huala, E. (2022). Using the Arabidopsis Information Resource (TAIR) to find information about arabidopsis genes. Current Protocols. 2, e574. doi: 10.1002/cpz1.574
Sakai, H., Lee, S. S., Tanaka, T., Numa, H., Kim, J., Kawahara, Y., et al. (2013). Rice annotation project database (rap-db): an integrative and interactive database for rice genomics. Plant Cell Physiol. 54, e6. doi: 10.1093/pcp/pcs183
Sheth, A., Padhee, S., and Gyrard, A. (2019). Knowledge graphs and knowledge networks: the story in brief. IEEE Internet Comput. 23, 67–75. doi: 10.1109/MIC.2019.2928449
Shrestha, R., Arnaud, E., Mauleon, R., Senger, M., Davenport, G. F., and Hancock, D. (2010). Multifunctional crop trait ontology for breeders' data: Field book, annotation, data discovery and semantic enrichment of the literature. AoB Plants. 2010, lq008. doi: 10.1093/aobpla/plq008
Shulaev, V., Sargent, D. J., Crowhurst, R. N., Mockler, T. C., Folkerts, O., Delcher, A. L., et al. (2011). The genome of woodland strawberry (Fragaria Vesca). Nat. Genet. 43, 109–116. doi: 10.1038/ng.740
Silverman, E. K., Schmidt, H. H. H. W., Anastasiadou, E., Altucci, L., Angelini, M., Badimon, L., et al. (2020). Molecular networks in Network Medicine: Development and applications. Syst. Biol. Med. 12, e1489. doi: 10.1002/wsbm.1489
Spooner, W., Youens-Clark, K., Staines, D., and Ware, D. (2012). GrameneMart: The BioMart data portal for the gramene project. Datab. 2012, bar056. doi: 10.1093/database/bar056
Tello-Ruiz, M. K., Naithani, S., Stein, J. C., Gupta, P., Campbell, M., Olson, A., et al. (2018). Gramene 2018: unifying comparative genomics and pathway resources for plant research. Nucleic Acids Res. 46, D1181–D1189. doi: 10.1093/nar/gkx1111
The GO Consortium (2021). The gene ontology resource: enriching a GOld mine. Nucleic Acids Res. 49, D325–D334. doi: 10.1093/nar/gkaa1113
Thudi, M., Palakurthi, R., Schnable, J. C., Chitikineni, A., Dreisigacker, S., Mace, E., et al. (2021). Genomic resources in plant breeding for sustainable agriculture. J. Plant Physiol. 257, 153351. doi: 10.1016/j.jplph.2020.153351
Tian, Z., Wang, J. W. L. i. J, and Han, B. (2021). Designing future crops: challenges and strategies for sustainable agriculture. Plant J. 105, 1165–1178. doi: 10.1111/tpj.15107
Tiddi, I., and Balliet, D., and ten Teije, A. (2020). “Fostering scientific meta-analysis with knowledge graphs: A case study,” in The Semantic Web ESWC 2020. Lecture Notes in Computer Science (Cham: Springer) 287–303. doi: 10.1007/978-3-030-49461-2_17
Tirosh, I., Weinberger, A., Bezalel, D., Kaganovich, M., and Barkai, N. (2008). On the relation between promoter divergence and gene expression evolution. Mol. Syst. Biol. 4, 159. doi: 10.1038/msb4100198
Unni, D. R., Moxon, S. A. T., Bada, M., Brush, M., Bruskiewich, R., Caufield, J. H., et al. (2022). Biolink model: a universal schema for knowledge graphs in clinical, biomedical, and translational science. Clin. Transl. Sci. 15, 1848–1888. doi: 10.1111/cts.13302
Walls, R. L., Cooper, L., Elser, J., Gandolfo, M. A., Mungall, C. J., Smith, B., et al. (2019). The plant ontology facilitates comparisons of plant development stages across species. Front. Plant Sci. 10, 631. doi: 10.3389/fpls.2019.00631
Zemojtel, T., Köhler, S., Mackenroth, L., Jäger, M., Hecht, J., Krawitz, P., et al. (2014). Effective diagnosis of genetic disease by computational phenotype analysis of the disease-associated genome. Sci. Transl. Med. 6, 252ra123. doi: 10.1126/scitranslmed.3009262
Appendix
All supplementary files can be accessed in GitHub under a CC-0 license (https://github.com/diatomsRcool/supplementary_material/tree/main/promoter_region).
1. drought_expression.tsv
2. drought_genes.tsv
3. GO_annotations.tsv
4. panther_results folder
5. promoter_region_clustvis_data0.tsv
6. orthologous_genes.tsv
Clustvis analysis is at https://biit.cs.ut.ee/clustvis/?s=IWJNurmUtGWZoMt.
Keywords: knowledge graph (KG), plant genome, gene expression, ontology, phenotype
Citation: Thessen AE, Cooper L, Swetnam TL, Hegde H, Reese J, Elser J and Jaiswal P (2023) Using knowledge graphs to infer gene expression in plants. Front. Artif. Intell. 6:1201002. doi: 10.3389/frai.2023.1201002
Received: 05 April 2023; Accepted: 23 May 2023;
Published: 13 June 2023.
Edited by:
Marie-Angélique Laporte, Bioversity International, FranceReviewed by:
Ashni Sedani, Accenture, United KingdomAngela Kranz, Helmholtz Association of German Research Centres (HZ), Germany
Copyright © 2023 Thessen, Cooper, Swetnam, Hegde, Reese, Elser and Jaiswal. This is an open-access article distributed under the terms of the Creative Commons Attribution License (CC BY). The use, distribution or reproduction in other forums is permitted, provided the original author(s) and the copyright owner(s) are credited and that the original publication in this journal is cited, in accordance with accepted academic practice. No use, distribution or reproduction is permitted which does not comply with these terms.
*Correspondence: Anne E. Thessen, annethessen@gmail.com
†ORCID: Laurel Cooper orcid.org/0000-0002-6379-8932
Tyson L. Swetnam orcid.org/0000-0002-6639-7181
Harshad Hegde orcid.org/0000-0002-2411-565X
Justin Reese orcid.org/0000-0002-2170-2250
Justin Elser orcid.org/0000-0003-0921-1982
Pankaj Jaiswal orcid.org/0000-0002-1005-8383