 Qin Liao
 Zhenglei Li2
 Yong Li
 Xuan Dai
- 1Key Laboratory of Western China's Environmental Systems (Ministry of Education), College of Earth and Environmental Sciences, Lanzhou University, Lanzhou, China
- 2Northwest Institute of Eco-Environment and Resources, Chinese Academy of Sciences, Lanzhou, China
- 3Key Laboratory of Environmental Pollution Monitoring and Disease Control, Ministry of Education, Guizhou Medical University, Guiyang, China
Background: Frequent air pollution events in Northwest China pose a serious threat to human health. However, there is a lack of specific differences assessment in PM2.5-related disease burden. Therefore, we aimed to estimate the PM2.5-related premature deaths and health economic losses in this typical northwest region, taking into account disease-specific, age-specific, and region-specific factors.
Methods: We utilized the WRF-Chem model to simulate and analyze the characteristics and exposure levels of PM2.5 pollution in Gansu Province, a typical region of Northwest China. Subsequently, we estimated the premature mortality and health economic losses associated with PM2.5 by combining the Global Exposure Mortality Model (GEMM) and the Value of a Statistical Life (VSL).
Results: The results suggested that the PM2.5 concentrations in Gansu Province in 2019 varied spatially, with a decrease from north to south. The number of non-accidental deaths attributable to PM2.5 pollution was estimated to be 14,224 (95% CI: 11,716–16,689), accounting for 8.6% of the total number of deaths. The PM2.5-related health economic loss amounted to 28.66 (95% CI: 23.61–33.63) billion yuan, equivalent to 3.3% of the regional gross domestic product (GDP) in 2019. Ischemic heart disease (IHD) and stroke were the leading causes of PM2.5-attributed deaths, contributing to 50.6% of the total. Older adult individuals aged 60 and above accounted for over 80% of all age-related disease deaths. Lanzhou had a higher number of attributable deaths and health economic losses compared to other regions. Although the number of PM2.5-attributed deaths was lower in the Hexi Corridor region, the per capita health economic loss was higher.
Conclusion: Gansu Province exhibits distinct regional characteristics in terms of PM2.5 pollution as well as disease- and age-specific health burdens. This highlights the significance of implementing tailored measures that are specific to local conditions to mitigate the health risks and economic ramifications associated with PM2.5 pollution.
1 Introduction
Air pollution, particularly fine particulate matter (PM2.5), is the fourth leading determinant of mortality worldwide (1). Epidemiological studies have shown that long-term exposure to ambient PM2.5 can lead to adverse health outcomes, including increased risks of death from disease such as ischemic heart disease (IHD), stroke, chronic obstructive pulmonary disease (COPD), lower respiratory infections (LRI), and lung cancer (LC) (2–5). In the last decade, PM2.5 has become the predominant air pollutant in China. Although there has been a significant reduction in PM2.5 levels (6, 7), the majority (81%) of the population is still exposed to annual average PM2.5 concentration that exceed the World Health Organization's (WHO) Air Quality Interim Target of 35 μg·m−3 (8). According to estimates from the Global Burden of Disease Study (GBD), PM2.5 pollution resulted in ~4.14 million premature deaths worldwide in 2019, with over 1/4 of these deaths occurring in China, a notably higher number than in other countries (1). The health impacts of PM2.5 also result in significant economic losses to society (9, 10). Guan et al. (10) estimated that the economic losses from ambient PM2.5 pollution were 3.20–3.34 trillion yuan across China during 2015–2017. Therefore, a diligent and accurate evaluation of the disease burden caused by PM2.5 pollution remains essential for effective policy formulation.
Many studies have utilized ground monitoring data to assess the premature mortality attributable to PM2.5 (11–13). However, accurately understanding the characteristics of PM2.5 pollution poses challenges due to the limited spatial coverage and uneven distribution of the PM2.5 monitoring network (14). Methods of PM2.5 exposure based on air quality model simulations with broader spatial coverage are considered more effective (15). For example, Wu et al. (16) and Li et al. (17) estimated PM2.5-related premature mortality in China using PM2.5 concentration data simulated by air quality models. Furthermore, the exposure-response function is crucial for accurately assessing premature mortality. Recent studies have recognized a non-linear relationship in the relative risk of PM2.5 health effects (3, 4). As a result, a progression of exposure-response models have been developed, ranging from basic linear models to more advanced log-linear models (LL), integrated exposure-response model (IER), and the most recent global exposure mortality model (GEMM) (5).
Several studies have examined the national-level impact of PM2.5 exposure on disease burden using varying PM2.5 concentration data and exposure-response functions (6, 7, 18–20). However, there has been less focus on the disease burden of PM2.5 in specific regions, and it is mainly done in developed regions such as the Beijing-Tianjin-Hebei region (21), the Yangtze River Delta (22), and the Pearl River Delta (23), while researches in the northwestern region of China are lacking. PM2.5-related mortality varies significantly across regions due to disparities in air pollution levels and socio-economic status (24). Additionally, age structure plays a significant role in PM2.5-related mortality, as different diseases and age groups contribute variably to these deaths. Xie et al. (25) found that overlooking age structure could result in an overestimation of premature deaths by 14%. Reports on the variations in PM2.5-related mortality across different age groups are limited (7, 26). Hence, it is imperative to comprehensively estimate the specific impact of PM2.5-related mortality on different diseases and age groups within specific regions.
Gansu Province, located in the northwest of China, is a typical underdeveloped area. It is situated at the convergence of the Loess Plateau, Qinghai-Tibet Plateau, and Inner Mongolia Plateau, making it prone to sand and dust storms (27) (Figure 1). The region is affected by both human activities and natural sources of particulate pollution. However, the extent of the disease burden caused by PM2.5 pollution in Gansu Province is not clear. To address this knowledge gap, this study aims to assess PM2.5-related mortality and its associated health economic losses in Gansu Province in 2019 using the WRF-Chem air quality model in combination with the optimized GEMM model. Additionally, the study quantifies the specific differences in premature deaths across different diseases, ages, and regions. The ultimate goal is to provide a scientific basis for the development of effective measures to reduce the health impacts of air pollution.
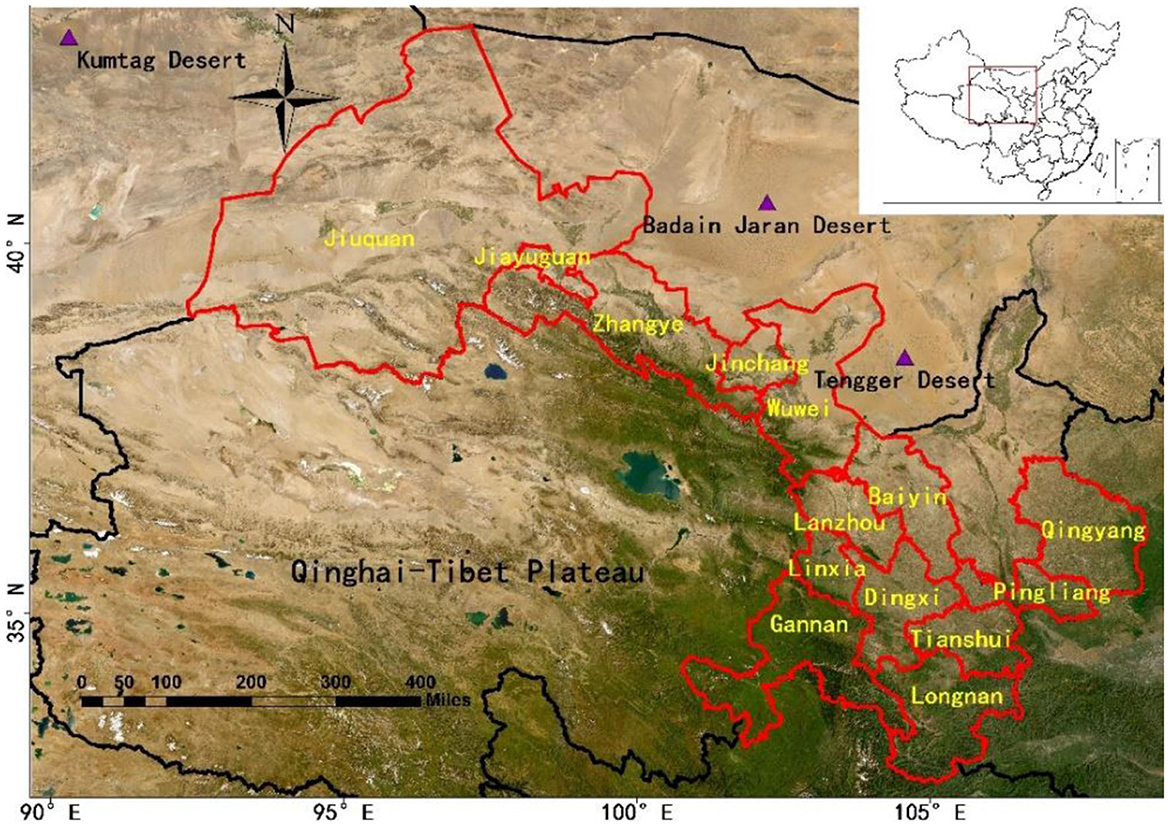
Figure 1. Geographical location of the study area.
2 Methodology
2.1 Simulations of PM2.5 concentration
The WRF-Chem air quality model was employed to estimate PM2.5 concentrations in Gansu Province for the year 2019. The simulation domain covered the entire Gansu Province and its surrounding provinces, with a horizontal resolution of 20 × 20 km (150 × 100 grids). The meteorological initial conditions were derived from the 6-h National Centers for Environmental Prediction (NCEP) final analysis data, with a spatial resolution of 1° × 1° (28). The initial conditions for atmospheric chemistry were obtained from the Community Atmosphere Model with Chemistry (CAM-Chem) model, with a 6-h interval and a spatial resolution of 1.9° × 2.5° (29). Anthropogenic emissions data was sourced from the Multi-resolution Emission Inventory for China (MEIC) developed by Tsinghua University (30). Biomass burning emissions were derived from the Fire INventory from NCAR (FINN) (31). Biogenic emissions were based on the commonly used Model of Emissions of Gases and Aerosols from Nature (MEGAN) inventory (32). Dust emissions were implemented using the Air Force Weather Agency (AFWA) emission scheme (33). The selected physical and chemical parameterization schemes for the simulation are presented in Table 1.
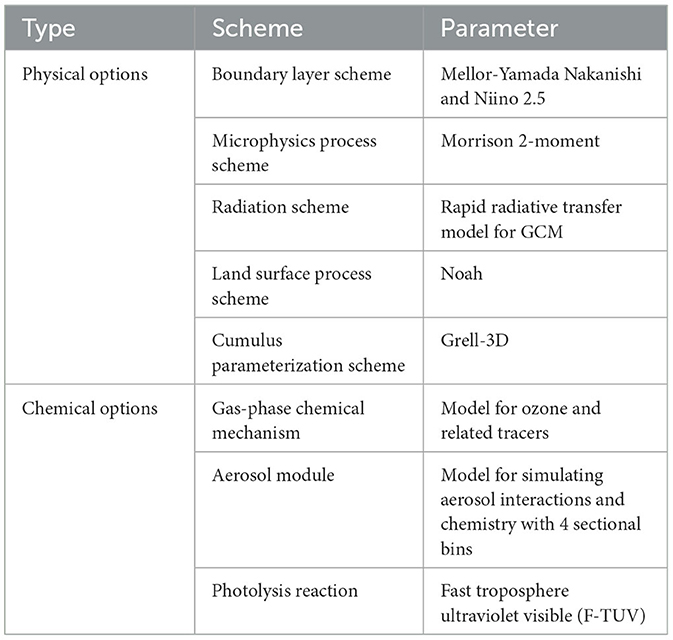
Table 1. Main physical and chemical parameters adopted in the WRF-Chem simulation.
The WRF-Chem model simulation results were evaluated using environmental monitoring data. The daily average PM2.5 concentration data for Gansu Province in 2019 were sourced from the Gansu Provincial Environmental Monitoring Center Station. These data covered 33 national air quality monitoring sites across 14 cities and prefectures. Various evaluation metrics were used, including normalized mean bias (NMB), normalized mean error (NME), mean fractional bias (MFB), mean fractional error (MFE), and the correlation coefficient (R). Overall, the simulation of PM2.5 concentrations in Gansu Province in 2019 showed good performance (34, 35). The NMB, NME, MFB, and MFE values were 0.08, 0.29, 0.04, and 0.20, respectively, and the results of R (0.56) was significant at the 1% level (P < 0.01).
2.2 Calculation of premature mortality
The Global Exposure Mortality Model (GEMM) optimized by Burnett et al. (5) was employed to estimate premature mortality attributable to PM2.5 pollution in adults (aged 25+). The GEMM took into account deaths from non-communicable diseases and lower respiratory infections (NCD+LRI), which are considered as non-accidental deaths. It also considers deaths from five major diseases, namely IHD, stroke, COPD, LC, and LRI, which represent deaths caused by specific diseases. The difference between non-accidental deaths and the sum of deaths from these five specific diseases represents deaths from other diseases. The computation formula used is as follows:
where the subscripts i and j represent the disease type and age structure (25–29, 30–34, 35–39, 40–44, 45–49, 50–54, 55–59, 60–64, 65–69, 70–74, 75–79 and ≥80 years old), respectively; Mi,j is premature mortality caused by PM2.5 exposure; Pop refers to the exposed population to PM2.5; PSj is the proportion of a specific age group within the exposed population; Bi,j represents the baseline mortality rate; RRi,j is the relative risk; C is the annual average PM2.5 concentration; C0 is the counter-factual concentration below which it is assumed that there is no additional risk (2.4 μg·m−3) (1, 18); θ, α, μ, and ν are fitting parameters for the PM2.5 exposure-response function. The values for θ, α, μ, and ν can be found in the references provided by Burnett et al. (5). Population data was sourced from the Gansu Development Yearbook 2020 (36). Age structure data and baseline mortality rates for each age group come from the China Cause-of-Death Surveillance Dataset 2019 (37), with data from the western region applied to Gansu Province.
Considering the uncertainty of RR in the model, a 95% confidence interval (CI) was calculated using the standard error in the GEMM:
where SE(θi,j) represents the standard deviation of θi,j, with its value referenced in the study by Burnett et al. (5).
2.3 Evaluation of health economic loss
The VSL was used to assess the economic losses resulting from PM2.5-related premature deaths. VSL quantifies the monetary value individuals are willing to pay (WTP) to reduce the death risk and is commonly used in assessing health economic losses related to air pollution (13, 38). The formula is as follows:
where EBg,t represents the health economic losses in region g (i.e., Gansu Province) in year t attributed to PM2.5. VSLg,t indicates the VSL in Gansu Province in year t. Since specific VSL results for Gansu Province are not available, this study adopts the VSL survey results from existing domestic regions as a reference. The benefit transfer method is employed, adjusting for differences in per capita GDP across different regions and timeframes. The formula is as follows:
where VSLb represents the VSL of the reference region. For this study, we have selected the latest VSL survey results for Beijing in 2016 conducted by Jin et al. (39), which amount to 5.54 million yuan. GDPg and GDPb represent the per capita GDP of Gansu Province and Beijing in 2016, respectively. η is the income elasticity of VSL, and we have adopted the recommended value of 0.8 from the Organization for Economic Co-operation and Development (OECD) (40). ΔPg is the percentage change in the Consumer Price Index (CPI) in year t for Gansu Province compared to 2016. ΔGg is the percentage change in per capita GDP in year t for Gansu Province compared to 2016. The per capita GDP and CPI for Gansu Province in 2019 are sourced from the Gansu Development Yearbook 2020 (36), while the per capita GDP for Beijing in 2016 come from the China Statistical Yearbook 2017 (41).
3 Results
3.1 PM2.5 pollution characteristics
Based on the WRF-Chem simulation data, the spatial distribution of the annual average PM2.5 concentration in Gansu Province in 2019 is shown in Figure 2. The overall distribution exhibited higher concentrations in the north and lower concentrations in the south. The regions with higher concentrations were mainly located in the Hexi Corridor region and certain parts of the central-eastern region. Specifically, Jiuquan and Jiayuguan recorded the highest population-weighted annual mean PM2.5 concentrations, reaching 41.48 and 40.28 μg·m−3, respectively, exceeding the Chinese Ambient Air Quality Standards (CAAQS) (35 μg·m−3 for Grade II). Qingyang, Wuwei, and Jinchang followed closely, with concentrations ranging between 32.82 and 34.86 μg·m−3. The concentrations in Lanzhou, Pingliang, Baiyin, and Zhangye all exceeded 30 μg·m−3. Gannan registered the lowest concentration at 12.22 μg·m−3. Notably, the vast majority of areas in Gansu Province had an annual average PM2.5 concentration exceeding 15 μg·m−3 for Grade I in CAAQS.
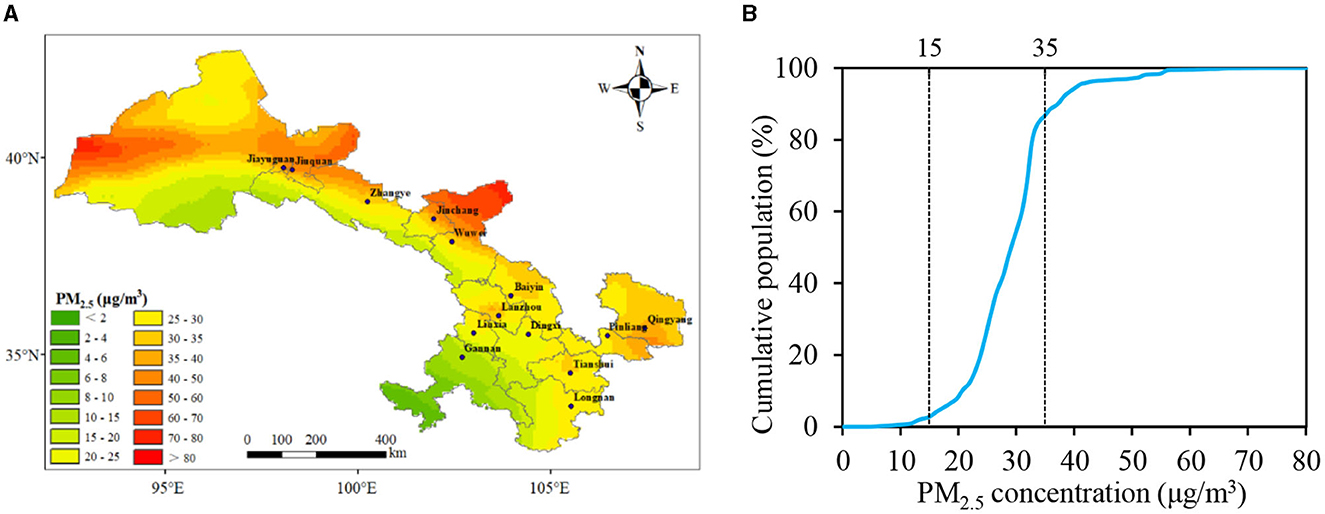
Figure 2. Exposure levels of PM2.5 in Gansu Province, 2019. (A) Spatial distribution of PM2.5 concentration; (B) cumulative distribution in various levels of PM2.5 concentration.
Using the simulated PM2.5 concentration and population data, we calculated the cumulative distribution of the population under different PM2.5 concentrations for 2019 (Figure 2). It can be observed that in 2019, 86.6% of the population in Gansu Province lived in areas with an annual average PM2.5 concentration below 35 μg·m−3. However, only 2.7% of the population resided in areas where the PM2.5 concentration was smaller than 15 μg·m−3.
3.2 Cause-specific premature mortality
Using the GEMM model, we estimated the mortality burden attributable to PM2.5 pollution in Gansu Province in 2019 (Figure 3). According to the GEMM NCD+LRI model, there were 14,224 (95% CI: 11,716–16,689) non-accidental deaths due to PM2.5 pollution in Gansu Province in 2019, accounting for 8.6% of the total deaths. The numbers of PM2.5-attributed deaths for IHD, stroke, LC, COPD, and LRI were 3,956 (95% CI: 3,608–4,299), 3,244 (95% CI: 1,602–4,807), 2,440 (95% CI: 1,189–3,615), 1,286 (95% CI: 780–1,764), and 853 (95% CI: 445–1,204) respectively, and represented 14.2, 8.4, 11.4, 12.8, and 24.1% of the deaths from the corresponding specific causes. It was evident that around a quarter of LRI deaths were caused by PM2.5 pollution, followed by IHD. Meanwhile, <1/10 of stroke deaths could be attributed to PM2.5. Although LRI deaths were more closely associated with PM2.5 pollution, the absolute number of deaths from LRI was much lower than those from IHD and stroke due to its lower baseline mortality rate.
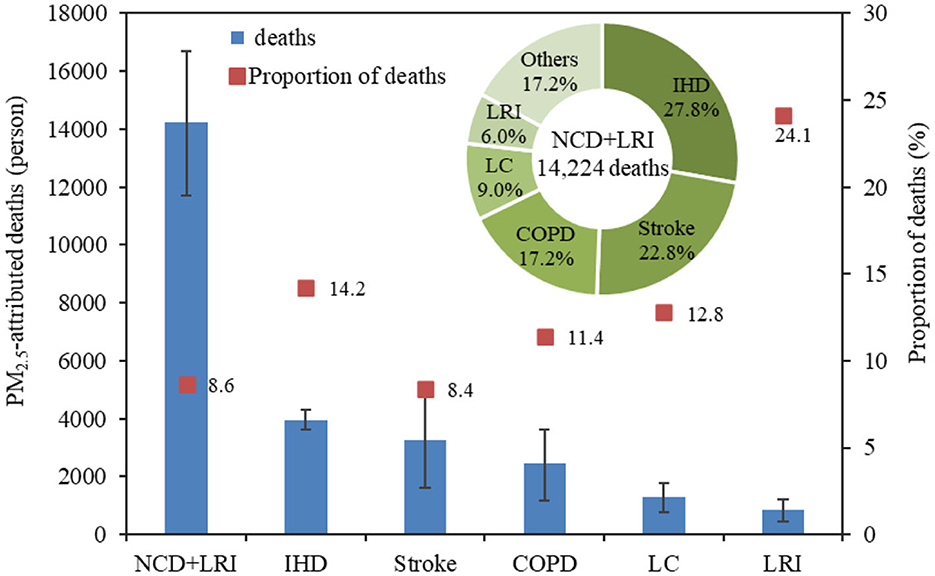
Figure 3. The number and proportion of PM2.5-attributed deaths in Gansu Province, 2019.
When examining the proportion of deaths attributable to PM2.5 for different diseases relative to non-accidental deaths (NCD+LRI), the proportion for IHD was the highest at 27.8%, followed by stroke at 22.8%, and the combined percentage of these two diseases accounted for more than 50%. COPD, LC, and LRI constituted 17.2, 9.0, and 6.0%, respectively, while deaths from other diseases made up 17.2%. From this, it can be inferred that the majority of PM2.5-attributed deaths come from IHD and stroke. Moreover, a substantial proportion is due to causes other than these five specific diseases.
3.3 Age-specific premature mortality
Figure 4 present the number and proportion of deaths attributable to PM2.5 pollution by age group in Gansu Province in 2019. It was obvious that there were substantial differences in the number of deaths from various diseases caused by PM2.5 across different age groups. Generally, the number of non-accidental deaths and disease-specific deaths attributable to PM2.5 increased with age. There were 11,615 (95% CI: 9,562–13,633) non-accidental deaths in people aged 60 and above, representing 81.7% of all non-accidental deaths, which was much higher than that of people under 60 years old. Notably, 34.0% of these deaths were reported in the age group of 80 and above.
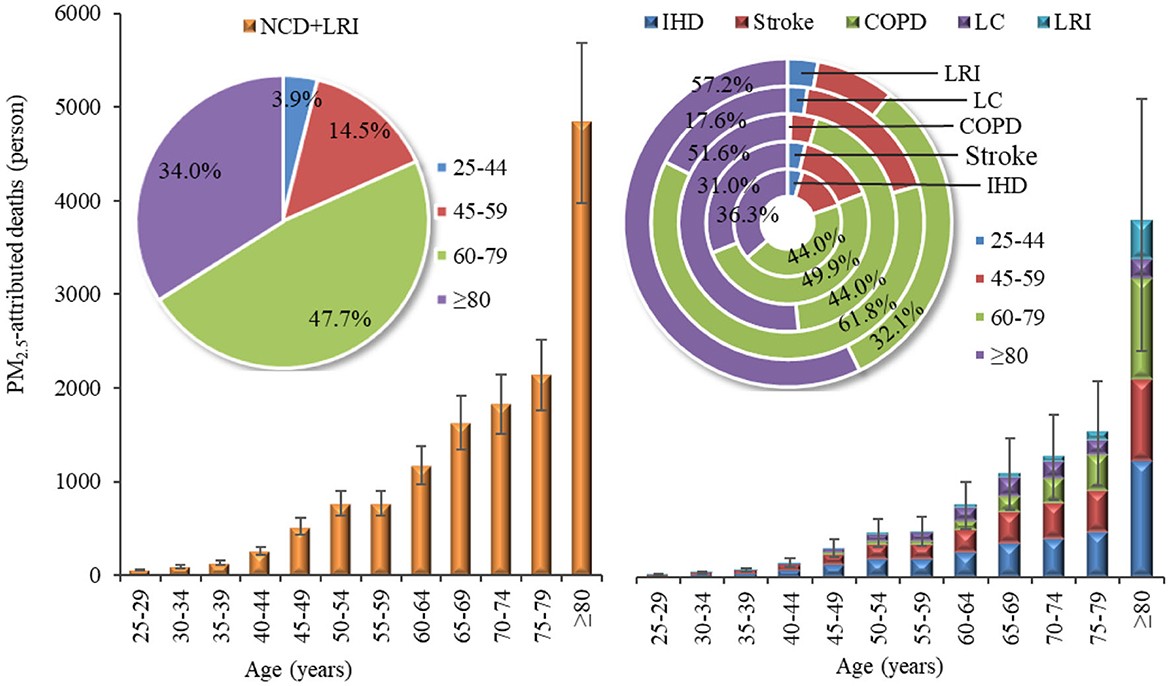
Figure 4. PM2.5-attributed deaths by age group in Gansu Province, 2019.
IHD was the primary cause of death burden across all age groups. For those under the age of 80, the number of deaths from stroke exceeded that from COPD, whereas for those aged 80 and above, deaths due to COPD outnumbered those from stroke. The age distribution of IHD and stroke deaths attributable to PM2.5 pollution mirrored the patterns seen with non-accidental deaths. Among those aged 60 and older, the numbers of IHD and stroke deaths were 3,178 (95% CI: 2,896–3,457) and 2,625 (95% CI: 1,292–3,901), respectively, accounting for 80.3 and 80.9% of the total deaths from these diseases across all age groups. For the same age bracket (aged 60+), the numbers of COPD and LRI deaths attributable to PM2.5 were 2,334 (95% CI: 1,137–3,457) and 762 (95% CI: 398–1,075), respectively, representing a staggering 95.6 and 89.3% of the total deaths from these conditions across all ages. Within this, the contribution from those aged 80 and above alone exceeded half, at 51.6 and 57.2%, respectively. For LC deaths attributable to PM2.5 across all age strata, the highest numbers were still among those aged 60 and above, with 1,021 (95% CI: 620–1,400) deaths, constituting 79.4% of all LC deaths. It was worth noting that, unlike other diseases, the proportion of LC deaths was highest in the 60–74 age group (17.9%) and those aged 80 and above (17.6%).
3.4 Region-specific premature mortality
The spatial distribution of non-accidental deaths attributable to PM2.5 pollution in Gansu Province in 2019 is illustrated in Figure 5. Lanzhou, the provincial capital, recorded the highest number of PM2.5-attributed deaths at 2,103 (95% CI: 1,733–2,467), accounting for 15.0% of the total non-accidental deaths in the province. Tianshui followed with 1,757 (95% CI: 1,447–2,062) deaths, making up 12.5% of the provincial total. The cities of Qingyang, Dingxi, Longnan, Pingliang, and Wuwei reported attributed death numbers ranging between 1,000 and 1,500. Jiayuguan, Gannan, and Jinchang, on the other hand, had lower non-accidental death counts, all under 500. It was observed that areas with higher population densities also exhibited higher numbers of non-accidental deaths attributable to PM2.5 pollution. Although the Hexi Corridor region had relatively high PM2.5 concentrations, the lower population density of this area, especially in Jiayuguan and Jinchang, resulted in significantly fewer PM2.5-attributed deaths compared to other regions.
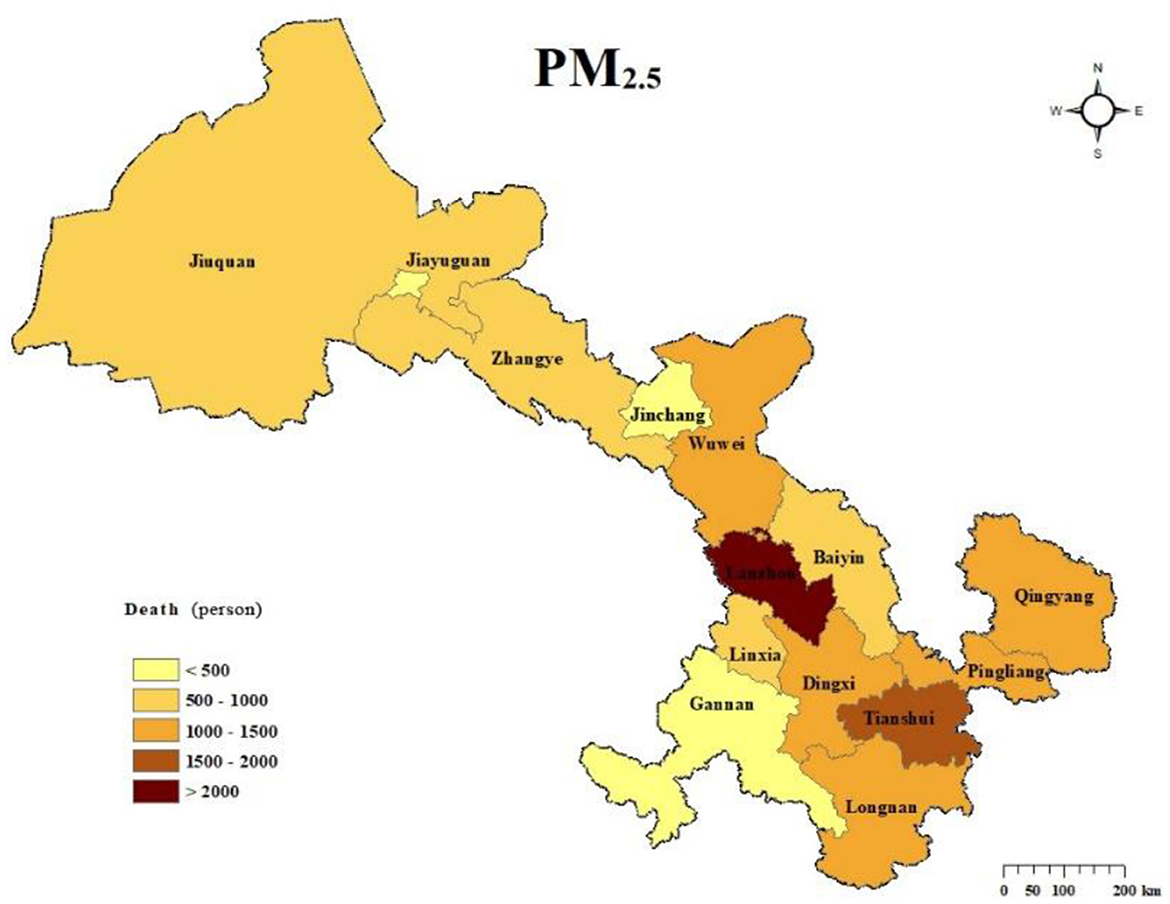
Figure 5. Spatial distribution of PM2.5-attributed deaths in Gansu Province, 2019.
3.5 Health economic loss
Based on the assessment of deaths attributable to PM2.5, the health economic loss associated with PM2.5-attributed mortality in Gansu Province was estimated using the VSL method, as depicted in Figure 6. In 2019, the health economic loss caused by PM2.5 in Gansu Province amounted to 28.66 (95% CI: 23.61–33.63) billion yuan, accounting for 3.3% of the region's GDP. The combined health economic losses for the five diseases were calculated to be 23.74 (95% CI: 15.36–31.61) billion yuan.

Figure 6. Health economic loss attributable to PM2.5 pollution in Gansu Province in 2019.
For the various regions (Figure 7), Lanzhou experienced the highest health economic loss, totaling 8.10 (95% CI: 6.67–9.50) billion yuan, contributing 29.0% to the overall health economic loss in Gansu Province. This was followed by Qingyang, Tianshui, and Jiuquan, whose combined contributions accounted for 27.2% of the total health economic loss in the province. Gannan reported the lowest health economic loss at 0.31 (95% CI: 0.25–0.37) billion yuan. The per capita health economic losses caused by PM2.5 across various regions in Gansu Province ranged from 428 to 2,575 yuan. Jiayuguan recorded the highest per capita health economic loss, reaching 2,575 yuan. Jiuquan and Lanzhou followed closely with per capita losses of 2,190 and 2,135 yuan, respectively, while Jinchang also experienced a relatively high per capita loss of 1,796 yuan. Meanwhile, the ratio of per capita health economic loss to per capita GDP revealed that Jiuquan, Tianshui, Wuwei, and Baiyin had notably high proportions. Conversely, although Jiayuguan and Jinchang had elevated per capita health economic losses, their ratios in relation to per capita GDP were lower. Moreover, Gannan exhibited the lowest figures both in terms of per capita health economic loss and its proportion to per capita GDP.
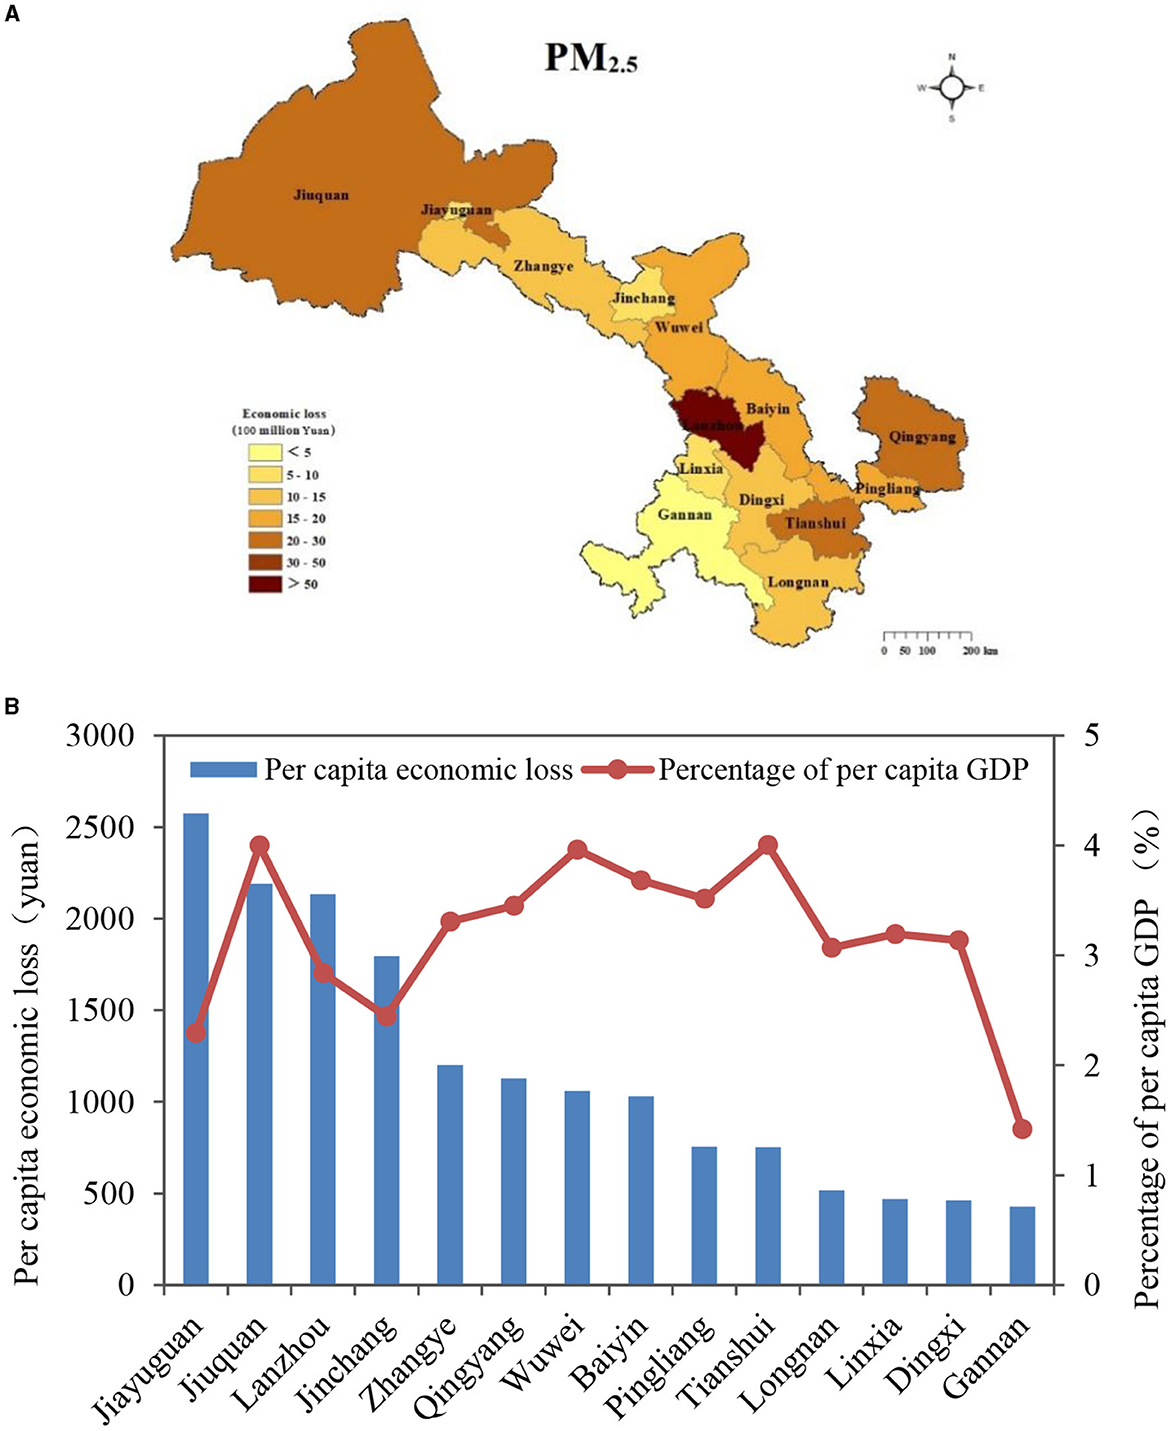
Figure 7. Health economic losses attributable to PM2.5 pollution in Gansu Province in 2019. (A) Spatial distribution of health economic losses; (B) per capita health economic losses and the proportion of per capita GDP.
4 Discussion
The spatial distribution of PM2.5 concentrations in Gansu Province varied significantly due to the differences in sources and emission levels of air pollutants. The Hexi region, situated in the western dust corridor of China, was severely influenced by the Tengger Desert, Badain Jaran Desert, and Kumtag Desert (42). Sandstorms had the most effect on Jiuquan and Jiayuguan, located in the westernmost part of Gansu Province (27). In the central and eastern regions of Gansu Province, cities like Lanzhou, Qingyang, Pingliang, and Baiyin had higher air pollutant emissions from anthropogenic sources such as industry and transportation. Conversely, in the southern areas, Gannan and Longnan relied more on green industries like eco-tourism and agricultural product processing, resulting in lower total air pollutant emissions (43). In conclusion, the PM2.5 concentration in Gansu Province was influenced by both natural and anthropogenic sources. Therefore, it is crucial for Gansu Province, located in the northwest of China, to consider the multiple sources of PM2.5 and implement region-specific measures to address PM2.5 pollution.
The study results showed the number of cardiovascular diseases (IHD and stroke: 7,200 individuals) deaths attributable to PM2.5 pollution in Gansu Province was higher than respiratory diseases (COPD, LC, and LRI: 4,579 individuals) deaths. This finding is consistent with previous research conducted in other regions of China (16, 26, 44). The higher number of premature cardiovascular deaths can be attributed to the generally high baseline mortality rate from cardiovascular diseases (45). In a study conducted in 2019, it was also found that IHD and stroke were the primary causes of PM2.5-attributed mortality in China (25). However, the proportion of COPD and LRI-related deaths (15.8%) was lower compared to ours (23.2%), possibly due to higher baseline mortality rates for these diseases in western China. According to the China Cause-of-Death Surveillance Dataset 2019 (37), the baseline mortality rates for COPD and LRI in western China were notably higher than in the central and eastern regions. Some studies have also observed that while PM2.5-attributed deaths from respiratory diseases have been decreasing, deaths from cardiovascular diseases (especially IHD) have been increasing (17). This trend is expected to continue with the rise of unhealthy lifestyles and an aging population. Therefore, in addition to reducing PM2.5 pollution levels, it is important to focus on improving healthcare and promoting healthier lifestyles to lower the baseline mortality rate of cardiovascular diseases and reduce the number of PM2.5-related deaths from such conditions in the future.
Considering the variations in total population among different age groups, this study further calculated the PM2.5-attributed mortality rate to better compare the premature deaths caused by PM2.5 pollution in different age categories (Figure 8). It was evident that the PM2.5-attributed mortality rate showed substantial disparities among different age groups, with a noticeable increase in older age groups. The non-accidental mortality attributable to PM2.5 reached 960 per 100,000 individuals in the population aged 80 and above. This finding is consistent with previous studies (46), indicating that older adults are more susceptible to the adverse effects of air pollution due to their elevated baseline mortality rate (16). Therefore, it is essential to consider the impacts of air pollution on different age groups and diseases and implement proactive and effective measures to shield older adults and enhance their overall health. Additionally, given the projected increase in the aging population in the future (47), it is imperative to estimate the influence of age structure on mortality attributed to air pollution in order to accurately understand the health effects on the population.
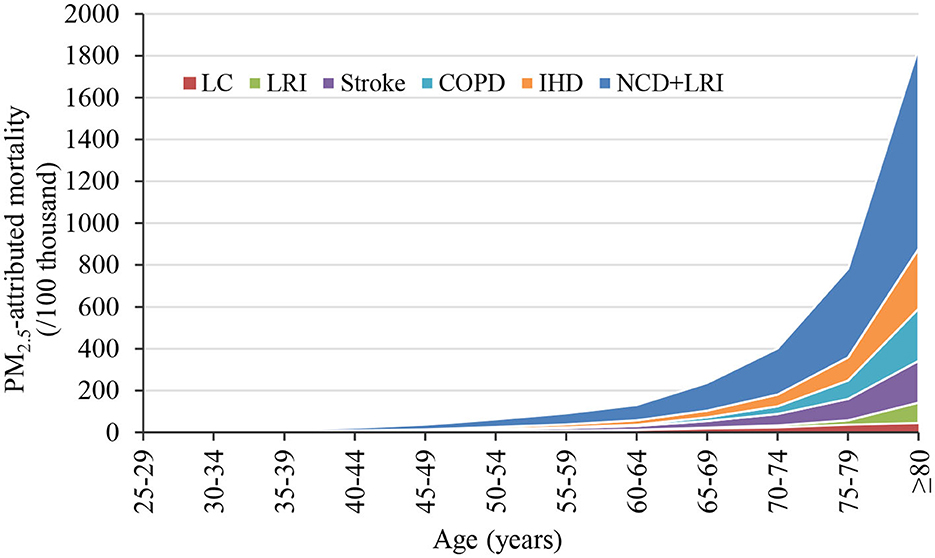
Figure 8. PM2.5-attributed mortality rates for different age groups in Gansu Province, 2019.
Premature deaths attributable to PM2.5 varied significantly across different regions, with the number of deaths being mainly influenced by PM2.5 concentration and population density when using a consistent baseline mortality rate. Lanzhou, a provincial capital, had a higher number of PM2.5-attributed deaths compared to other regions. This can be attributed to the combination of sandstorms from the Hexi Corridor and surrounding areas, rapid economic growth, heavy industries, and transportation development in Lanzhou. As a result, Lanzhou has elevated PM2.5 concentrations and the highest population density, leading to significant health implications. Research by Guan et al. (48) revealed that air pollution-related health impacts in regional hub cities contribute significantly to the overall health burden within the province, especially in central and western China. Although Jiayuguan, an industrially advanced city, has higher PM2.5 concentrations, its unique population distribution with low population density results in a lower health impact. The distribution of PM2.5-related health economic losses in different regions shows similarities, but there are still some disparities. These variations primarily stem from health economic losses being dependent on the level of attributable deaths and health costs, denoted as the value of VSL, which is influenced by the local level of economic development (13, 49). Even if the per capita health economic loss is relatively low, it can still represent a higher proportion of the per capita GDP. In other words, the economic burden caused by air pollution can be considerable.
Despite the important findings outlined above, there are still significant uncertainties and limitations in estimating the disease burden attributable to PM2.5 pollution. First, different means of measuring PM2.5 may affect the concentration data. Simulation results with the WRF-Chem model faced uncertainties from emission inventories and simulations of chemical-physical processes. We adopted anthropogenic emission data from MEIC, which has been widely used in air quality simulation. Meanwhile, the reliability of the WRF-Chem model simulation was evaluated using common evaluation metrics. Second, the exposure-response relationship between PM2.5 and health outcomes was also a major source of uncertainty (44). Previous studies mainly utilized the IER model, which only incorporated cohort study data from European and American regions, potentially underestimating the health burden in areas with higher PM2.5 concentrations. In contrast, the GEMM model considered higher air pollution levels and included the results of a cohort study in China, estimating a 120% larger mortality burden than the IER model (5). Therefore, it may be more appropriate to use exposure-response models based on specific Chinese cohort studies, although the accuracy of the GEMM model requires further scientific validation (26, 50). Third, the exposure-response model assumes that the toxicity of ambient PM2.5 is only influenced by concentrations, but the health effects of PM2.5 from different chemical components or different sources may vary greatly (38). This is particularly important in Gansu Province, which has complex PM2.5 emission sources and lacks relative risk functions for specific sources. Fourth, due to more elaborate data limitations, this study used baseline mortality rates and age structure from western China for Gansu Province, and did not consider their spatial variability across the study region, which may have introduced some discrepancies in the estimated results. Fifth, the VSL played a key role but also caused uncertainties when assessing health economic losses. The VSL estimates from developed countries could not be applied to China due to differences in socio-economic characteristics and air pollution levels. There are relatively few studies on VSL conducted in China (39, 51–53). However, owing to differences in the timing of willingness-to-pay surveys and economic development levels, the values of VSL were considerable uncertainties, leading to significant variations in the estimated health economic losses. In view of the rising income level in China in recent years and the increasing public awareness of air pollution, the results of the more recent VSL survey were used in our study.
5 Conclusion
This study utilized simulated PM2.5 concentration data and an exposure-response model to investigate the impact of PM2.5 pollution on premature deaths and health economic losses in Gansu Province. The results indicated that there were 14,224 non-accidental deaths attributed to PM2.5 pollution in 2019, with the majority caused by IHD and stroke. Older adults (aged 60+) were more affected by PM2.5 pollution than those under 60 years old. The distribution of deaths varied spatially, with high concentrations in densely populated areas like Lanzhou and Tianshui. The health economic losses due to PM2.5 pollution accounted for 3.3% of the annual GDP, with Lanzhou contributing the most. Jiayuguan, Jiuquan, and Lanzhou had higher per capita health economic losses. In conclusion, there are significant differences in the diseases, age groups, and regional distribution of disease burden attributable to PM2.5 in Gansu Province. It is recommended to implement region-specific measures to address PM2.5 pollution and improve the health of older adults to prevent more deaths and economic losses.
Data availability statement
The original contributions presented in the study are included in the article/supplementary material, further inquiries can be directed to the corresponding author.
Author contributions
QL: Conceptualization, Methodology, Writing—original draft. ZL: Formal analysis, Writing—original draft. YL: Methodology, Visualization, Writing—review & editing. NK: Formal analysis, Writing—review & editing. XD: Formal analysis, Writing—review & editing. YN: Visualization, Writing—original draft. YT: Conceptualization, Writing—review & editing.
Funding
The author(s) declare financial support was received for the research, authorship, and/or publication of this article. This research was supported by the Key Research and Development Program of Gansu Province (21YF5FA109), the Youth Science and Technology Fund Program of Gansu Province (20JR5RA574), and the Youth Innovation Promotion Association, Chinese Academy of Sciences (2022434).
Conflict of interest
The authors declare that the research was conducted in the absence of any commercial or financial relationships that could be construed as a potential conflict of interest.
Publisher's note
All claims expressed in this article are solely those of the authors and do not necessarily represent those of their affiliated organizations, or those of the publisher, the editors and the reviewers. Any product that may be evaluated in this article, or claim that may be made by its manufacturer, is not guaranteed or endorsed by the publisher.
References
1. Murray CJL, Aravkin AY, Zheng P, Abbafati C, Abbas KM, Abbasi-Kangevari M, et al. Global burden of 87 risk factors in 204 countries and territories, 1990-2019: a systematic analysis for the Global Burden of Disease Study 2019. Lancet. (2020) 396:1223–49. doi: 10.1016/S0140-6736(20)30752-2
2. Lepeule J, Laden F, Dockery D, Schwartz J. Chronic exposure to fine particles and mortality: an extended follow-up of the Harvard Six Cities study from 1974 to 2009. Environ Health Perspect. (2012) 120:965–70. doi: 10.1289/ehp.1104660
3. Burnett RT, Pope III CA, Ezzati M, Olives C, Lim SS, Mehta S, et al. An integrated risk function for estimating the global burden of disease attributable to ambient fine particulate matter exposure. Environ Health Perspect. (2014) 122:397–403. doi: 10.1289/ehp.122-A235
4. Apte JS, Marshall JD, Cohen AJ, Brauer M. Addressing global mortality from ambient PM2.5. Environ Sci Technol. (2015) 49:8057–66. doi: 10.1021/acs.est.5b01236
5. Burnett R, Chen H, Szyszkowicz M, Fann N, Hubbell B, Pope III CA, et al. Global estimates of mortality associated with long-term exposure to outdoor fine particulate matter. Proc Nat Acad Sci. (2018) 115:9592–7. doi: 10.1073/pnas.1803222115
6. Zhang Q, Zheng Y, Tong D, Shao M, Wang S, Zhang Y, et al. Drivers of improved PM2.5 air quality in China from 2013 to 2017. Proc Nat Acad Sci. (2019) 116:24463–9. doi: 10.1073/pnas.1907956116
7. Yue H, He C, Huang Q, Yin D, Bryan BA. Stronger policy required to substantially reduce deaths from PM2.5 pollution in China. Nat Commun. (2020) 11:1462. doi: 10.1038/s41467-020-15319-4
8. Yin P, Brauer M, Cohen AJ, Wang H, Li J, Burnett RT, et al. The effect of air pollution on deaths, disease burden, and life expectancy across China and its provinces, 1990-2017: an analysis for the Global Burden of Disease Study 2017. Lancet Planet Health. (2020) 4:e386–98. doi: 10.1016/S2542-5196(20)30161-3
9. Yin H, Brauer M, Zhang JF, Cai W, Navrud S, Burnett R, et al. Population ageing and deaths attributable to ambient PM2.5 pollution: a global analysis of economic cost. Lancet Planetary Health. (2021) 5:E356–67. doi: 10.1016/S2542-5196(21)00131-5
10. Guan Y, Kang L, Wang Y, Zhang NN, Ju MT. Health loss attributed to PM2.5 pollution in China's cities: Economic impact, annual change and reduction potential. J Clean Prod. (2019) 217:284–94. doi: 10.1016/j.jclepro.2019.01.284
11. Song CB, He JJ, Wu L, Jin T, Chen X, Li R, et al. Health burden attributable to ambient PM2.5 in China. Environ Pollut. (2017) 223:575–86. doi: 10.1016/j.envpol.2017.01.060
12. Huang J, Pan XC, Guo XB, Li G. Health impact of China's air pollution prevention and control action plan: an analysis of national air quality monitoring and mortality data. Lancet Planet Health. (2018) 2:e313–23. doi: 10.1016/S2542-5196(18)30141-4
13. Maji KJ, Ye WF, Arora M, Nagendra SS. PM2.5-related health and economic loss assessment for 338 Chinese cities. Environ Int. (2018) 121:392–403. doi: 10.1016/j.envint.2018.09.024
14. Zheng YX, Xue T, Zhang Q, Geng G, Tong D, Li X, et al. Air quality improvements and health benefits from China's clean air action since 2013. Environ Res Lett. (2017) 12:114020. doi: 10.1088/1748-9326/aa8a32
15. Xue T, Liu J, Zhang Q, Geng G, Zheng Y, Tong D, et al. Rapid improvement of PM2.5 pollution and associated health benefits in China during 2013-2017. Sci China Earth Sci. (2019) 62:1847–56. doi: 10.1007/s11430-018-9348-2
16. Wu WJ, Yao MH, Yang XC, Hopke PK, Choi H, Qiao X, et al. Mortality burden attributable to long-term ambient PM2.5 exposure in China: using novel exposure-response functions with multiple exposure windows. Atmosp Environ. (2021) 246:118098. doi: 10.1016/j.atmosenv.2020.118098
17. Li Y, Liao Q, Zhao XG, Tao Y, Bai Y, Peng L. Premature mortality attributable to PM2.5 pollution in China during 2008-2016: underlying causes and responses to emission reductions. Chemosphere. (2021) 263:127925. doi: 10.1016/j.chemosphere.2020.127925
18. Li J, Liu H, Lv ZF, Zhao R, Deng F, Wang C, et al. Estimation of PM2.5 mortality burden in China with new exposure estimation and local concentration-response function. Environ Pollut. (2018) 243:1710–8. doi: 10.1016/j.envpol.2018.09.089
19. Geng G, Zheng Y, Zhang Q, Xue T, Zhao H, Tong D, et al. Drivers of PM2.5 air pollution deaths in China 2002-2017. Nat Geosci. (2021) 14:645–50. doi: 10.1038/s41561-021-00792-3
20. Xu L, Chen F, Zhong X, Ye R, Cai W, Rao Q, et al. Spatial disequilibrium of fine particulate matter and corresponding health burden in China. J Clean Prod. (2019) 238:117840. doi: 10.1016/j.jclepro.2019.117840
21. Xu M, Qin Z, Zhang S, Xie Y. Health and economic benefits of clean air policies in China: a case study for Beijing-Tianjin-Hebei region. Environ Pollut. (2021) 285:117525. doi: 10.1016/j.envpol.2021.117525
22. Chen Y, Zang L, Du W, Xu D, Shen G, Zhang Q, et al. Ambient air pollution of particles and gas pollutants, and the predicted health risks from long-term exposure to PM2.5 in Zhejiang province, China. Environ Sci Pollut Res. (2018) 25:23833–44. doi: 10.1007/s11356-018-2420-5
23. Lu XC, Chen Y, Huang YQ, Chen D, Shen J, Lin C, et al. Exposure and mortality apportionment of PM2.5 between 2006 and 2015 over the Pearl River Delta region in southern China. Atmos Environ. (2020) 231:117512. doi: 10.1016/j.atmosenv.2020.117512
24. Han CL, Xu RB, Ye TT, Xie Y, Zhao Y, Liu H, et al. Mortality burden due to long-term exposure to ambient PM2.5 above the new WHO air quality guideline based on 296 cities in China. Environ Int. (2022) 166:107331. doi: 10.1016/j.envint.2022.107331
25. Xie R, Sabel CE, Lu X, Zhu W, Kan H, Nielsen CP, et al. Long-term trend and spatial pattern of PM2.5 induced premature mortality in China. Environ Int. (2016) 97:180–6. doi: 10.1016/j.envint.2016.09.003
26. Maji KJ. Substantial changes in PM2.5 pollution and corresponding premature deaths across China during 2015-2019: a model prospective. Sci Total Environ. (2020) 729:138838. doi: 10.1016/j.scitotenv.2020.138838
27. Guan QY, Cai A, Wang FF, Yang L, Xu C, Liu Z. Spatio-temporal variability of particulate matter in the key part of Gansu Province, Western China. Environ Poll. (2017) 230:189–98. doi: 10.1016/j.envpol.2017.06.045
28. NCEP (National Center for Atmospheric Research)/National Weather Service/NOAA/US Department of Commerce. NCEP FNL Operational Model Global Tropospheric Analyses, Continuing From July 1999. (2000). Available online at: http://rda.ucar.edu/datasets/ds083.2 (accessed March 6, 2023).
29. Buchholz RR, Emmons LK, Tilmes S. CESM21/CAM-chem Instantaneous Output for Boundary Conditions UCAR/NCAR - Atmospheric Chemistry Observations and Modeling Laboratory (2019). doi: 10.5065/NMP7-EP60
30. MEIC (Multi-resolution Emission Inventory model for Climate Air Pollution Research). (2021). Available online at: http://www.meicmodel.org (accessed March 10, 2023).
31. Wiedinmyer C, Akagi SK, Yokelson RJ, Emmons LK, Al-Saadi JA, Orlando JJ, et al. The Fire INventory from NCAR (FINN): a high resolution global model to estimate the emissions from open burning. Geosci Model Dev. (2011) 4:625–41. doi: 10.5194/gmd-4-625-2011
32. Guenther A, Karl T, Harley P, Wiedinmyer C, Palmer PI, Geron C. Estimates of global terrestrial isoprene emissions using MEGAN (Model of Emissions of Gases and Aerosols from Nature). Atmosp Chem Phys. (2006) 6:3181–210. doi: 10.5194/acp-6-3181-2006
33. LeGrand SL, Polashenski C, Letcher TW, Creighton GA, Peckham SE, Cetola JD. The AFWA dust emission scheme for the GOCART aerosol model in WRF-Chem v381. Geosci Model Dev. (2019) 12:131–66. doi: 10.5194/gmd-12-131-2019
34. Boylan JW, Russell AG. PM and light extinction model performance metrics, goals, and criteria for three-dimensional air quality models. Atmos Environ. (2006) 40:4946–59. doi: 10.1016/j.atmosenv.2005.09.087
35. Zhang Y, Zhang X, Wang L, Zhang Q, Duan F, He K. Application of WRF/Chem over East Asia: Part I. Model evaluation and intercomparison with MM5/CMAQ. Atmosp Environ. (2016) 124:285–300. doi: 10.1016/j.atmosenv.2015.07.022
36. Gansu Gansu Province Bureau of Statistics and and Survey Office of the National Bureau of Statistics in Gansu. Gansu Development Yearbook 2020. Beijing: China Statistics Press (2020).
37. National Center for Chronic and Noncommunicable Disease Control and Prevention, Chinese Center for Disease Control and Prevention, Center for Health Statistics and Information, National Health Commission. National Cause-of-Death Surveillance Dataset 2019. Beijing: China Science and Technology Press (2019).
38. Yao M, Wu G, Zhao X, Zhang J. Estimating health burden and economic loss attributable to short-term exposure to multiple air pollutants in China. Environ Res. (2020) 183:109184. doi: 10.1016/j.envres.2020.109184
39. Jin YN, Andersson H, Zhang SQ. Do preferences to reduce health risks related to air pollution depend on illness type? Evidence from a choice experiment in Beijing, China. J Environ Econ Manag. (2020) 103:102355. doi: 10.1016/j.jeem.2020.102355
40. OECD (Organization for Economic Co-operation and Development). The Cost of Air Pollution: Health Impacts of Road Transport. Paris: OECD Publishing (2014).
41. National Bureau of Statistics of China. China Statistical Yearbook 2017. Beijing: China Statistics Press (2017).
42. Yang XL, Chen L, Zhang YH, Wang S. Variation characteristic of sand-dust days and its relationship with meteorological factors in east of Hexi corridor. Res Environ Sci. (2018) 31:1373–81. doi: 10.13198/j.issn.1001-6929.2018.05.10
43. Zhang J, Ju T, Li B, Li C, Wang J, Xia X, et al. Spatial and temporal distribution characteristics and transport path analysis of regional particulate matter over Gansu Province. China Environ Sci. (2021) 41:3990–4000.
44. Zheng S, Schlink U, Ho KF, Singh RP, Pozzer A. Spatial distribution of PM2.5-related premature mortality in China. GeoHealth. (2021) 5:e2021GH000532. doi: 10.1029/2021GH000532
45. Zhou MG, Wang HD, Zeng XY, Yin P, Zhu J, Chen W, et al. Mortality, morbidity, and risk factors in China and its provinces, 1990-2017: a systematic analysis for the Global Burden of Disease Study 2017. Lancet. (2019) 394:1145–58. doi: 10.1016/S0140-6736(19)30427-1
46. Tang R, Zhao J, Liu Y, Huang X, Zhang Y, Zhou D, et al. Air quality and health co-benefits of China's carbon dioxide emissions peaking before 2030. Nat Commun. (2022) 13:1008. doi: 10.1038/s41467-022-28672-3
47. United Nations, Department of Economic and Social Affairs, Population Division. World Population Prospects 2022. New Yorkm NY: United Nations (2022).
48. Guan Y, Xiao Y, Wang Y, Zhang N, Chu C. Assessing the health impacts attributable to PM2.5 and ozone pollution in 338 Chinese cities from 2015 to 2020. Environ. Pollut. (2021) 287:117623. doi: 10.1016/j.envpol.2021.117623
49. Li Y, Liao Q, Zhao XG, Bai Y, Tao Y. Influence of PM2.5 pollution on health burden and economic loss in China. Environ Sci. (2021) 42:1688–95. doi: 10.13227/j.hjkx.202008313
50. Xue T, Zhu T, Zheng YX, Liu J, Li X, Zhang Q. Change in the number of PM2.5-attributed deaths in China from 2000 to 2010: comparison between estimations from census-based epidemiology and pre-established exposure-response functions. Environ Int. (2019) 129:430–7. doi: 10.1016/j.envint.2019.05.067
51. Wang H, Mullahy J. Willingness to pay for reducing fatal risk by improving air quality: a contingent valuation study in Chongqing, China. Sci Total Environ. (2006) 367:50–7. doi: 10.1016/j.scitotenv.2006.02.049
52. Hoffmann S, Krupnick A, Qin P. Building a set of internationally comparable value of statistical life studies: estimates of Chinese willingness to pay to reduce mortality risk. J Benefit Cost Anal. (2017) 8:251–89. doi: 10.1017/bca.2017.16
Keywords: PM2.5, premature mortality, specific differences, economic loss, Northwestern China
Citation: Liao Q, Li Z, Li Y, Dai X, Kang N, Niu Y and Tao Y (2023) Specific analysis of PM2.5-attributed disease burden in typical areas of Northwest China. Front. Public Health 11:1338305. doi: 10.3389/fpubh.2023.1338305
Received: 14 November 2023; Accepted: 24 November 2023;
Published: 22 December 2023.
Edited by:
Zhaobin Sun, Chinese Academy of Meteorological Sciences, ChinaReviewed by:
Bin Luo, Lanzhou University, ChinaZhao Xiuge, Chinese Research Academy of Environmental Sciences, China
Ling Han, National Institute for Communicable Disease Control and Prevention (China CDC), China
Copyright © 2023 Liao, Li, Li, Dai, Kang, Niu and Tao. This is an open-access article distributed under the terms of the Creative Commons Attribution License (CC BY). The use, distribution or reproduction in other forums is permitted, provided the original author(s) and the copyright owner(s) are credited and that the original publication in this journal is cited, in accordance with accepted academic practice. No use, distribution or reproduction is permitted which does not comply with these terms.
*Correspondence: Yan Tao, taoyan@lzu.edu.cn