 Haifeng Chen1,2†
 Dongqing Ye
 Xinyu Fang
- 1Department of Epidemiology and Biostatistics, School of Public Health, Anhui Medical University, Hefei, Anhui, China
- 2Inflammation and Immune Mediated Diseases Laboratory of Anhui Province, Hefei, Anhui, China
- 3Department of Health Management Center, The First Affiliated Hospital of Anhui Medical University, Hefei, Anhui, China
Objective: Recent studies suggest air pollution as an underlying factor to kidney disease. However, there is still limited knowledge about the short-term correlation between glomerulonephritis (GN) and air pollution. Thus, we aim to fill this research gap by investigating the short-term correlation between GN clinical visits and air pollution exposure.
Methods: Between 2015 and 2019, daily GN visit data from two grade A tertiary hospitals in Hefei City were collected, along with corresponding air pollution and meteorological data. A generalized linear model integrated with a distributed lag nonlinear model was employed to analyze the relationship between GN visits and air pollutants. Moreover, we incorporated a dual pollutant model to account for the combined effects of multiple pollutants. Furthermore, subgroup analyses were performed to identify vulnerable populations based on gender, age, and season.
Results: The association between 23,475 GN visits and air pollutants was assessed, and significant positive associations were found between CO and NO2 exposure and GN visit risk. The single-day lagged effect model for CO showed increased risks for GN visits from lag0 (RR: 1.129, 95% CI: 1.031–1.236) to lag2 (RR: 1.034, 95% CI: 1.011–1.022), with the highest risk at lag0. In contrast, NO2 displayed a more persistent impact (lag1–lag4) on GN visit risk, peaking at lag2 (RR: 1.017, 95% CI: 1.011–1.022). Within the dual-pollutant model, the significance persisted for both CO and NO2 after adjusting for each other. Subgroup analyses showed that the cumulative harm of CO was greater in the cold-season and older adult groups. Meanwhile, the female group was more vulnerable to the harmful effects of cumulative exposure to NO2.
Conclusion: Our study indicated that CO and NO2 exposure can raise the risk of GN visits, and female and older adult populations exhibited greater susceptibility.
1. Introduction
Glomerulonephritis (GN) is a heterogeneous collection of diseases identified by inflammatory damage within the renal small vessels and glomeruli (1). Ranking as the third and second leading causes of chronic kidney disease (CKD) (2) and end-stage renal disease (ESRD) (3) worldwide, GN has witnessed a considerable escalation in disease burden, with 6.9 million disability-adjusted life years (DALYs) due to CKD brought about GN in 2019, representing a 66% increase compared to 1990 (2). Despite progress in the nosogenesis of GN, the etiology of GN remains elusive. In recent years, environmental factors, notably air pollution, have been increasingly recognized as potential factors to the occurrence and progression of kidney diseases, including GN (4–8).
In a groundbreaking nanomedicine study (9), researchers have shown initial evidence of inhaled aerosol particles’ potential to interact with renal tissue. The investigation revealed that gold nanoparticles with a diameter of ≤4 nm, when inhaled, can penetrate alveolar tissue, subsequently entering the bloodstream and being detected in participants’ urine within three months. Supporting these findings, in vivo experiments (10–12) have demonstrated that sustained exposure to fine particulate matter of 2.5 μm or less in diameter (PM2.5) may elicit renal inflammatory responses, structural damage, and oxidative stress in the kidneys of rodent models.
Despite these findings, only a few researchers have explored the correlation between atmospheric contaminant exposure and some clinical subtypes of GN. These studies (5–8) have provided some indications that exposure to elevated concentrations of PM2.5 or acidic gases increases the risk of developing IgA nephropathy (only for PM2.5) and nephrotic syndrome. However, there is still limited knowledge regarding the short-term link between GN and air pollution. Moreover, the combined effects of multiple pollutants and the differences in risk among populations with different demographic characteristics are still unclear.
To fill this research gap and elucidate the potential correlation between exposure to atmospheric contaminants and GN, we inquired into the short-term relationship between GN visits and air pollution exposure based on data from nephrology clinics at two grade a class 3 hospitals in Hefei, China, from 2015 to 2019. In addition, we further identified risk patterns across age and gender to explain the latent impact of discrepancies in susceptibility between subpopulations.
2. Materials and methods
2.1. Study area
The study was conducted in Hefei City, encompassing four Districts. As the capital of Anhui Province, Hefei spans 11,445 km2 and houses approximately 8.19 million inhabitants (13). Situated within the mid-latitude zone (31°N, 117°E), Hefei experiences a humid subtropical monsoon climate typical of the region. As part of the “Yangtze River Delta” city cluster, Hefei is located in the coastal hinterland and serves as a vital industrial economic center. Consequently, the city grapples with significant air pollution issues, resulting in substantial public health concerns (14).
2.2. Study population
We amassed daily visit data for GN patients between 2015 and 2019 from the electronic medical record information systems of the First Affiliated Hospital of Anhui Medical University and the First Affiliated USTC. The variables compiled for the GN data encompassed age, gender, outpatient date, and residential address. The diagnostic criteria for GN are as follows: (1) Persistent proteinuria and/or hematuria over an extended period; (2) A history of prolonged hypertension, mild renal impairment, or/and edema; (3) Gradual, relentless progression of renal impairment, culminating in end-stage renal failure in later stages; (4) Symmetrical reduction in kidney size; and (5) Exclusion of secondary chronic nephritis syndrome, which would point toward a primary diagnosis (3, 15). The inclusion criteria for GN patients in this investigation were: (1) adherence to the diagnostic criteria for GN; (2) current address in Hefei; and (3) possession of hospital records. Furthermore, we applied exclusion criteria: (1) concurrent visits or a second visit to both hospitals within a brief period; (2) unclear diagnosis; (3) non-local residents; and (4) patients devoid of demographic information (e.g., age and gender). The data variables utilized in this study were anonymized, negating the need for ethical restrictions due to the absence of risk research requirements.
2.3. Air pollution and meteorological data
Air pollution data were procured from the average values of 10 ambient air pollution monitoring stations at the Hefei Environmental Monitoring Center, which included 24-h average levels of particulate matter of 10 μm or less in diameter (PM10), PM2.5, carbon monoxide (CO), nitrogen dioxide (NO2), sulfur dioxide (SO2), and daily maximum 8-h average ozone (O3-8h) concentration. Concurrently, meteorological data were acquired from the China meteorological data network,1 comprising daily average temperature (Temp), air humidity (RH), sunshine duration (SSD), and rainfall (RF).
2.4. Statistical analysis
By aggregating daily data, we employed a time-series study to calculate the risk of GN visits associated with short-term exposure to atmospheric contaminants from 2015 to 2019. As GN visits represent a low probability event within the population and exhibit overdispersion (Supplementary Table S1), a typical time series generalized linear model (GLM) with a quasi-Poisson connection was integrated with the distributed lag nonlinear model (DLNM) to determine the relationship between atmospheric contaminants and GN visits (16). The maximum delay on day 7 was utilized to capture the lagged impact of atmospheric contaminants (16).
To circumvent multicollinearity issues and account for the non-normal distribution (Supplementary Table S2) of variables, we performed Spearman correlation analysis on all variables, excluding those with correlation coefficients greater than 0.7 (17). The final model is presented below:
Here, E[Yt] represents the anticipated count of patients with GN on day t; cb(X0) denotes the cross-basis function of the explanatory variable, which employs the “lin” function and “poly” function (degree = 3) to define the matrices of exposure and lag (0–7), respectively; α signifies the intercept; β stands for the cross-basis function’s coefficient; ns represents the natural cubic spline (ns) function; time refers to the long-term time trend effect; dfs is the degrees of freedom, which is chosen based on the minimum value of the Akaike information criterion (AIC) applicable to the quasi-Poisson model (16). To control potential confounders, we introduced meteorological factors (Temp, RH, SSD, and RF) and other atmospheric contaminants (when X0 is CO: NO2, SO2, O3-8h, and PM10) with ns function. Furthermore, we incorporated holiday parameters and DOW into the model as categorical variables to control the holiday and day-of-the-week effects.
We incorporated air pollutants individually upon constructing a working model (the core model) containing all control variables and verifying their suitability. Subsequently, we calculated the lag effect of atmospheric contaminants on GN visits from the current day (lag0) to 7 days prior (lag7). Previous research (18) has indicated that single-day lag models may neglect the cumulative effect. Consequently, we integrated the cumulative lag effect analysis into the model. Relative risk (RR) values and 95% confidence interval (CI) of air pollutant concentration per 10 μg/m3 increment (1 mg/m3 CO) were employed to calculate the short-term correlation between atmospheric contaminants and GN visits. Lastly, we used P50 as the reference base to calculate the association between the single-day effect and the cumulative lag effect of increasing air pollutant concentration on GN visits.
While the single pollutant model can predict the association between one atmospheric contaminant and GN visits, air pollutants often coexist and interact, resulting in a comprehensive impact on human health (19). To assess this potential combined effect and the robustness of the impact caused by pollutants, we established a dual pollutant model to study the intermingling effects of pollutants. The formulation of the dual pollutant model is as under:
Here, cb(Xa) and cb(Xb) are the cross-basis functions of the included dual pollutants, and β is the coefficient. All other parameters remain the same as in Model (1).
Additionally, to identify vulnerable populations and seasons, we further stratified the population by gender (male and female), season (cold season: November–April in the next year; warm season: May–October), and age (<65 and ≥ 65 years) to conduct subgroup analyses (20). Subsequently, the Wilcoxon signed-rank test was employed to confirm dissimilarities among the aforementioned subgroups.
2.5. Sensitivity analyses
To evaluate the reliability of the results, we carried out sensitivity assessments. First, we varied the dfs (3–8 dfs) (21) for the time, air pollutions, and meteorological factors. Second, we adjusted the maximum delay of air pollutants to intervals of 14 and 21 days to examine the harvesting effect (22, 23). Lastly, we set the reference values of all pollutants to 0, plotted the overall exposure-response curves, and calculated the relative risk (RR) values for the corresponding pollutants.
All statistical computations were performed with the aid of R software (version 4.2.3). Statistical significance of the effect was acknowledged when p < 0.05 (two-sided).
3. Results
3.1. Descriptive analysis
Between 2015 and 2019, the electronic medical record information system registered 23,475 GN visits at the two hospitals, comprising 47.23% males (11,088), 10.02% older adults aged ≥65 (2,352), and 49.37% occurring during the cold season (11,589). Throughout the research duration, the daily mean levels (with standard deviation) of CO, NO2, PM10, PM2.5, SO2, and O3-8h were 0.84 (0.28) mg/m3, 40.31 (17.76) μg/m3, 76.17 (38.90) μg/m3, 52.29 (33.41) μg/m3, 10.55 (6.08) μg/m3, and 86.32 (44.01) μg/m3, respectively. Additionally, Temp, RH, SSD, and RF (with standard deviation) were found to be 16.85 (9.21)°C, 76.51 (11.99)%, 4.92 (4.02) h, and 3.18 (8.88) mm, respectively (Table 1). To better illustrate the geographical context of our study, we have included a map showcasing the locations of these two hospitals and 10 ambient air pollution monitoring stations within the city (Figure 1). Besides, the time series distribution of the data over 5 years is illustrated in Supplementary Figure S1. The Spearman correlation analysis revealed a strong correlation between PM2.5 with PM10 (rs = 0.806, p < 0.001) and CO (rs = 0.812, p < 0.001), prompting its exclusion from the model (Supplementary Figure S2).
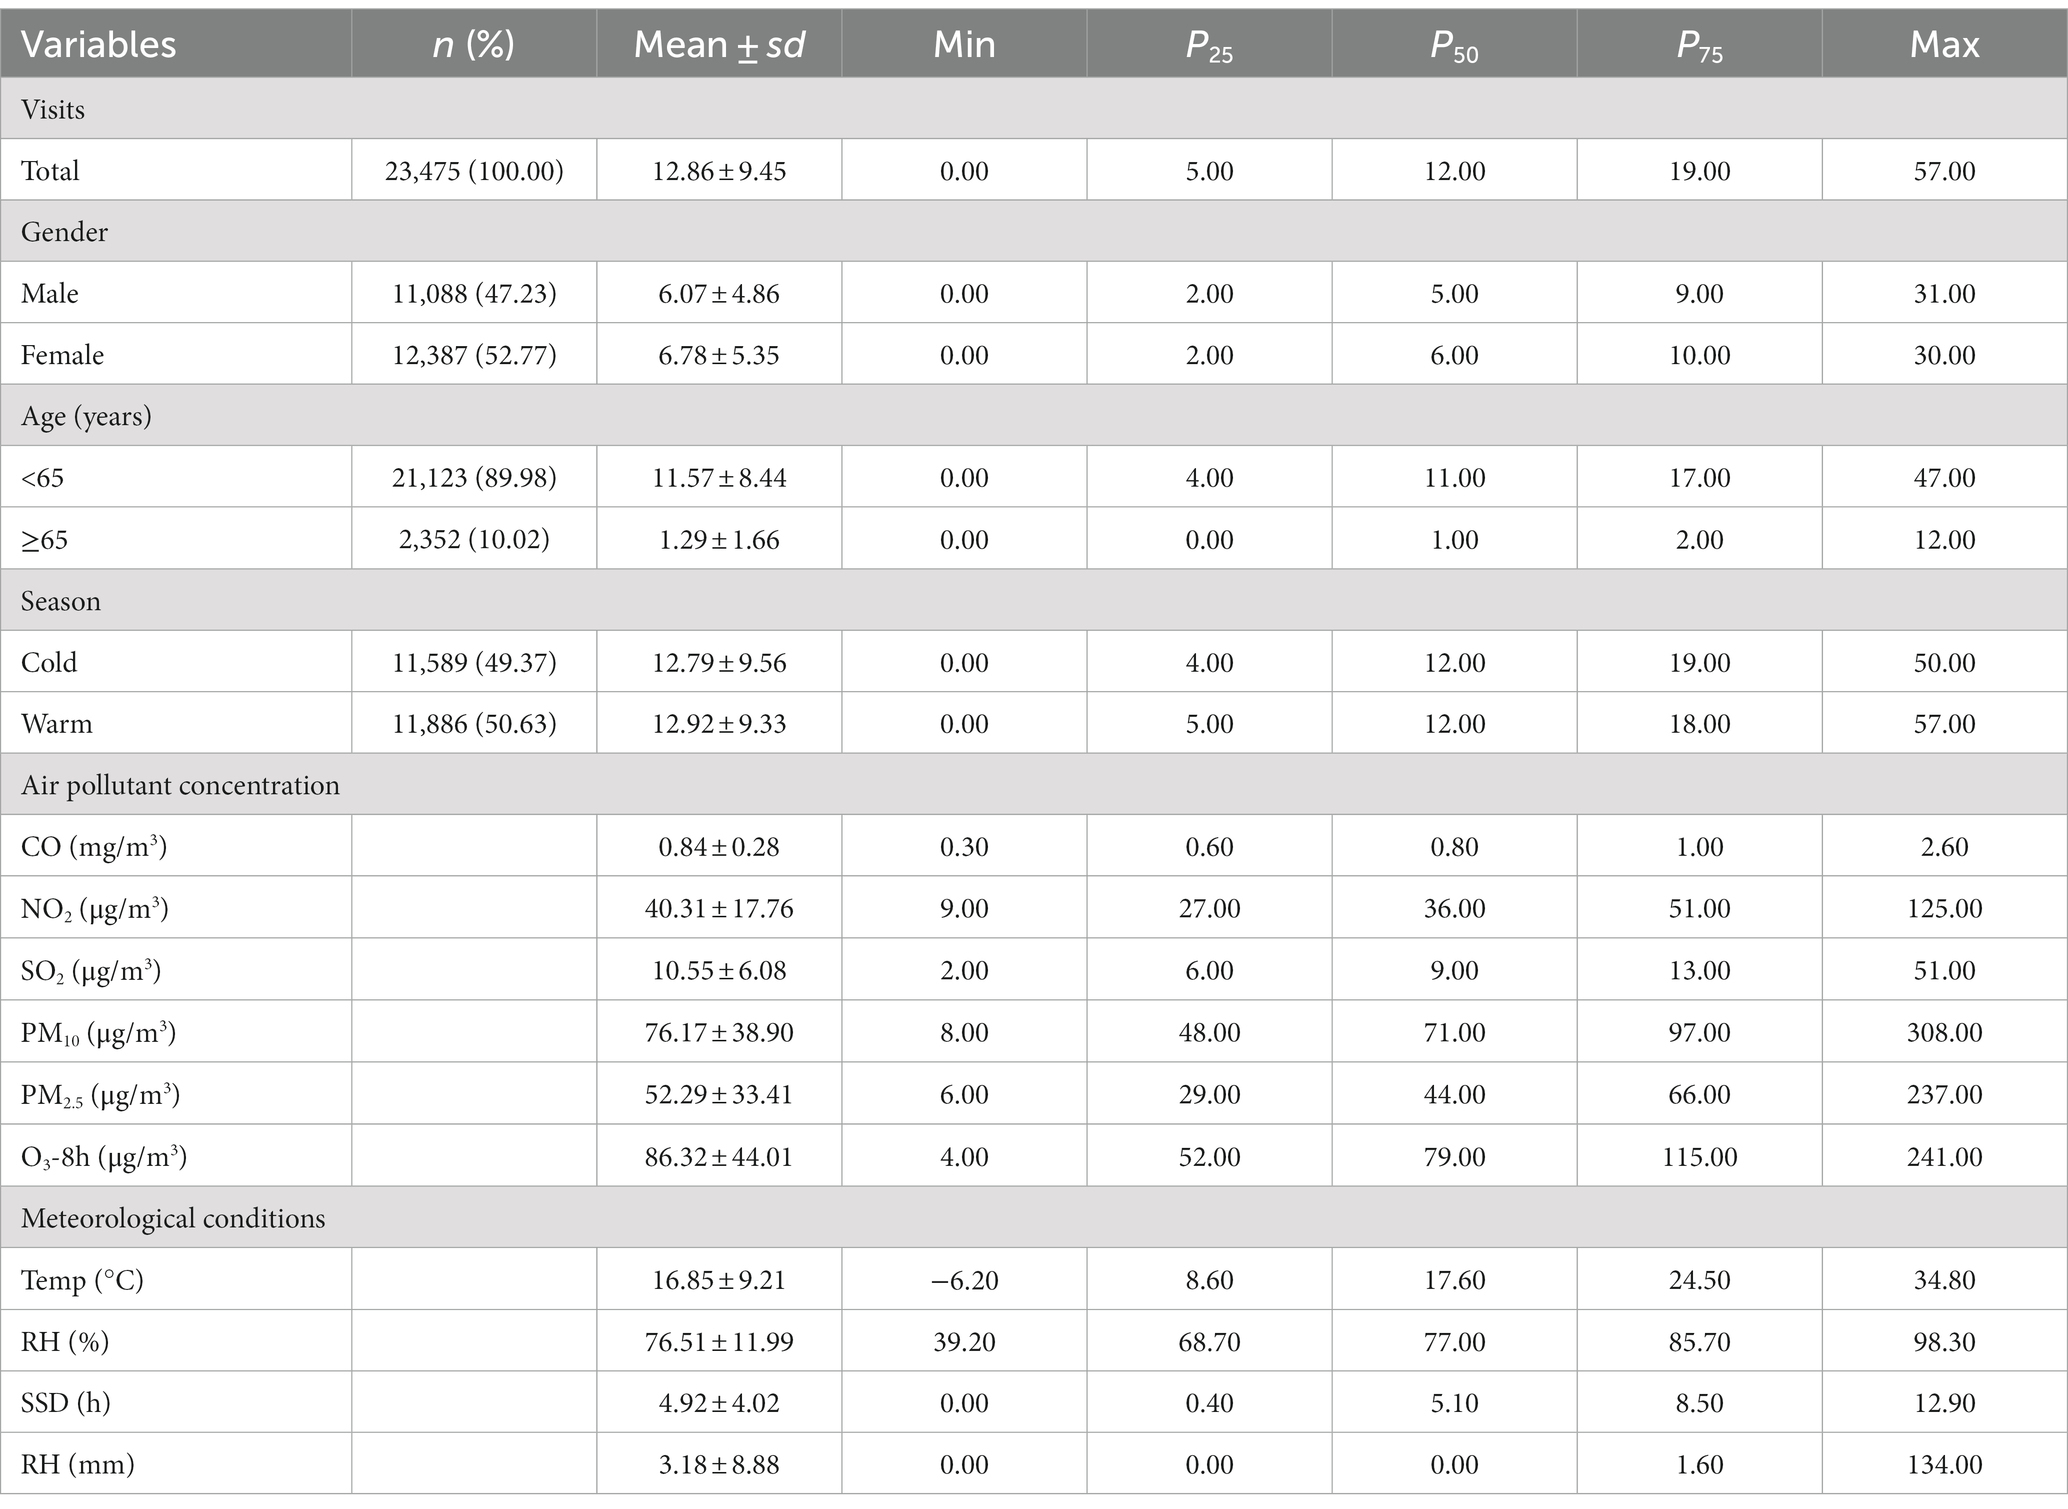
Table 1. Descriptive statistics of the daily outpatient visits for GN, air pollutant concentrations, and meteorological parameters in Hefei City, 2015–2019.
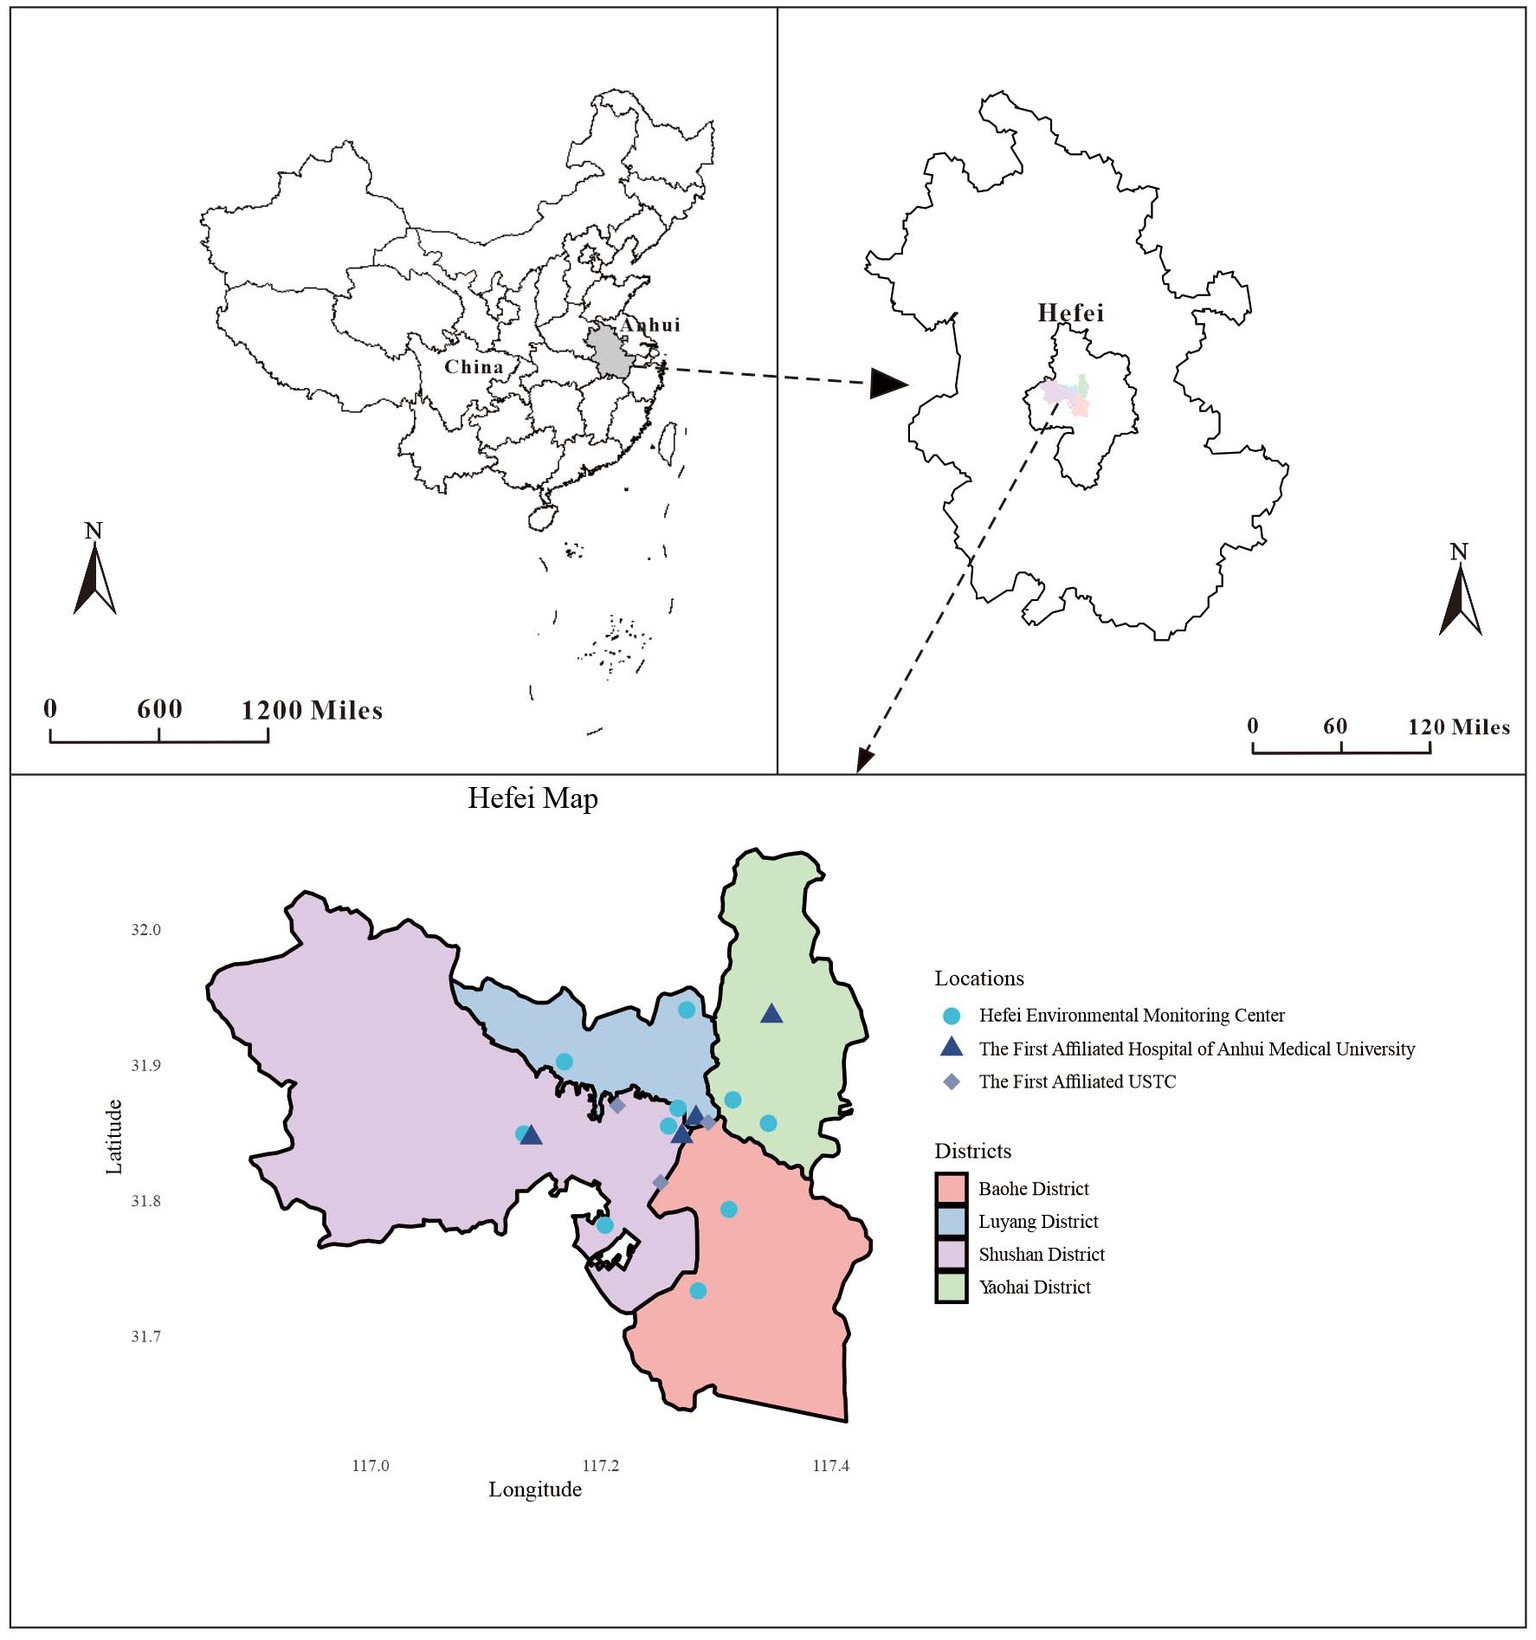
Figure 1. Geographical distribution of environmental monitoring stations and the two hospitals in Hefei.
3.2. Overall effects
The overall exposure-response relationship between atmospheric contaminants (CO, NO2, PM10, SO2, and O3-8h) and GN visits is predicted by the DLNM model (Supplementary Figure S3). The curves demonstrated a positive correlation between CO and NO2 exposure and an escalated risk of GN visits when the maximum lag was 7 days (Supplementary Figures S3A,B). No significant overall exposure-response associations were observed between SO2, PM10, and O3-8h and GN visits, as their 95% CIs included the null value (RR = 1.000) throughout the entire range (Supplementary Figures S3C–E). Consequently, the model included PM10, SO2, and O3-8h as covariates for subsequent analyses to account for potential confounding effects.
The exposure-response correlation between GN visits and two atmospheric contaminants, CO and NO2, reveals a significant positive association at low lag days when concentrations of CO and NO2 are high (with reference concentrations of 0.8 mg/m3 and 36 μg/m3, respectively). However, as the lag time increases, exposure to elevated levels of CO and NO2 appeared to diminish the risk of GN visits (Figures 2, 3).
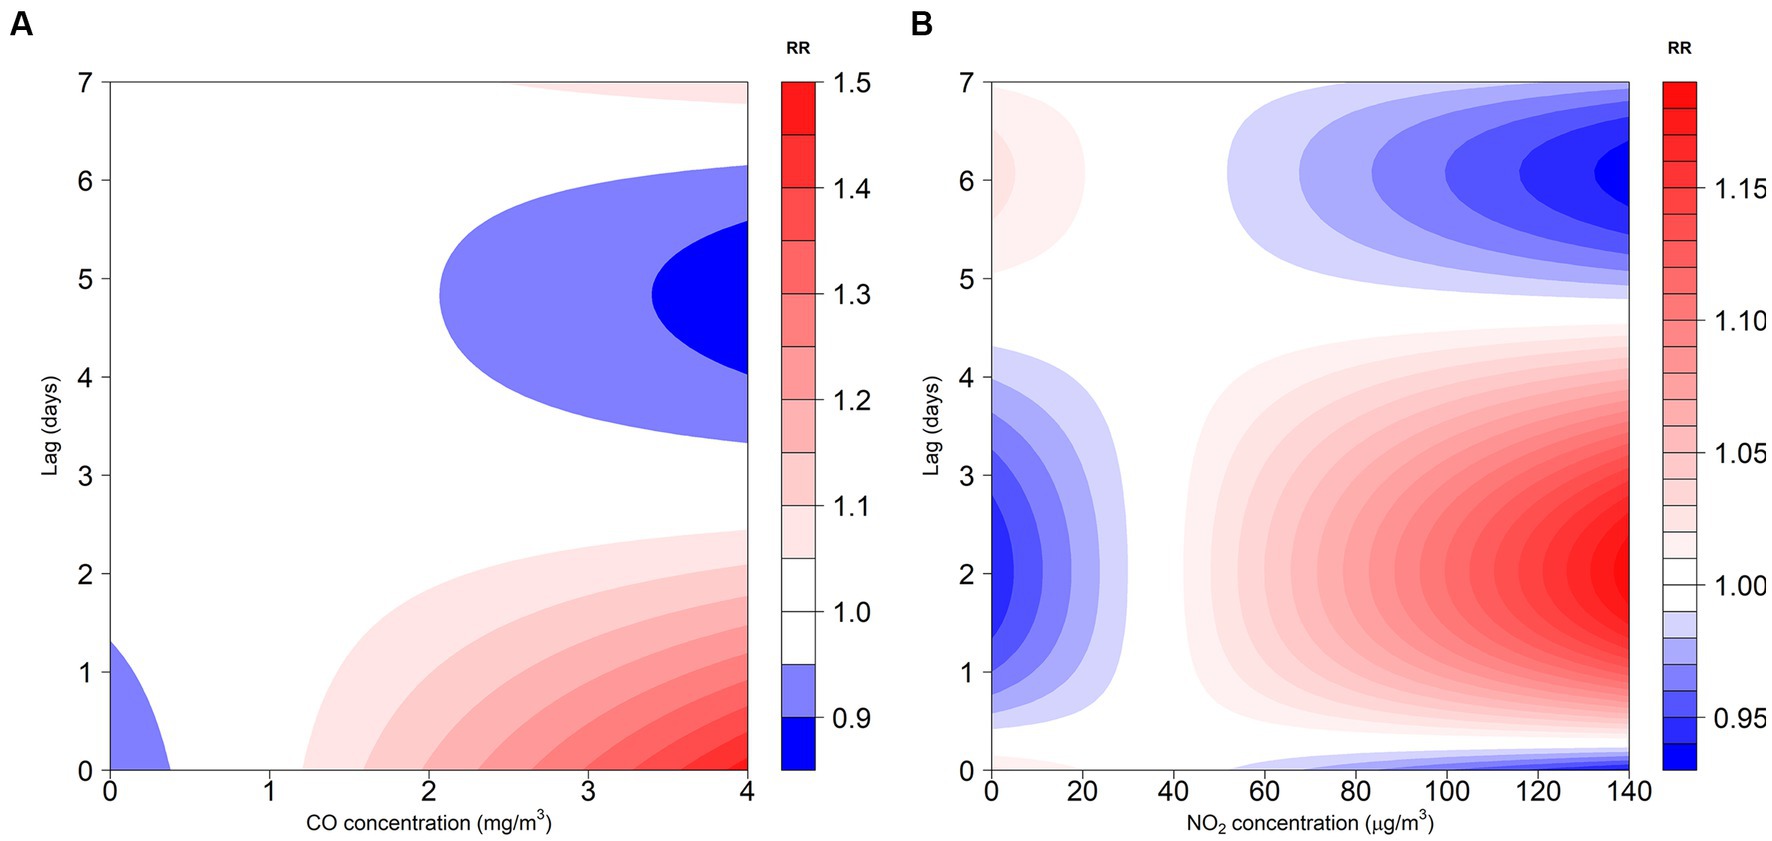
Figure 2. Contour plot for the association between air pollutants (CO and NO2) and GN visits in Hefei, China, 2015–2019. (A) Contour plot of CO; (B) Contour plot of NO2. CO, carbon monoxide; NO2, nitrogen dioxide; and RR, relative risk. The P50 was used as the reference concentration. The P50 concentration of CO is 0.8 mg/m3 and the P50 concentration of NO2 is 36 μg/m3.
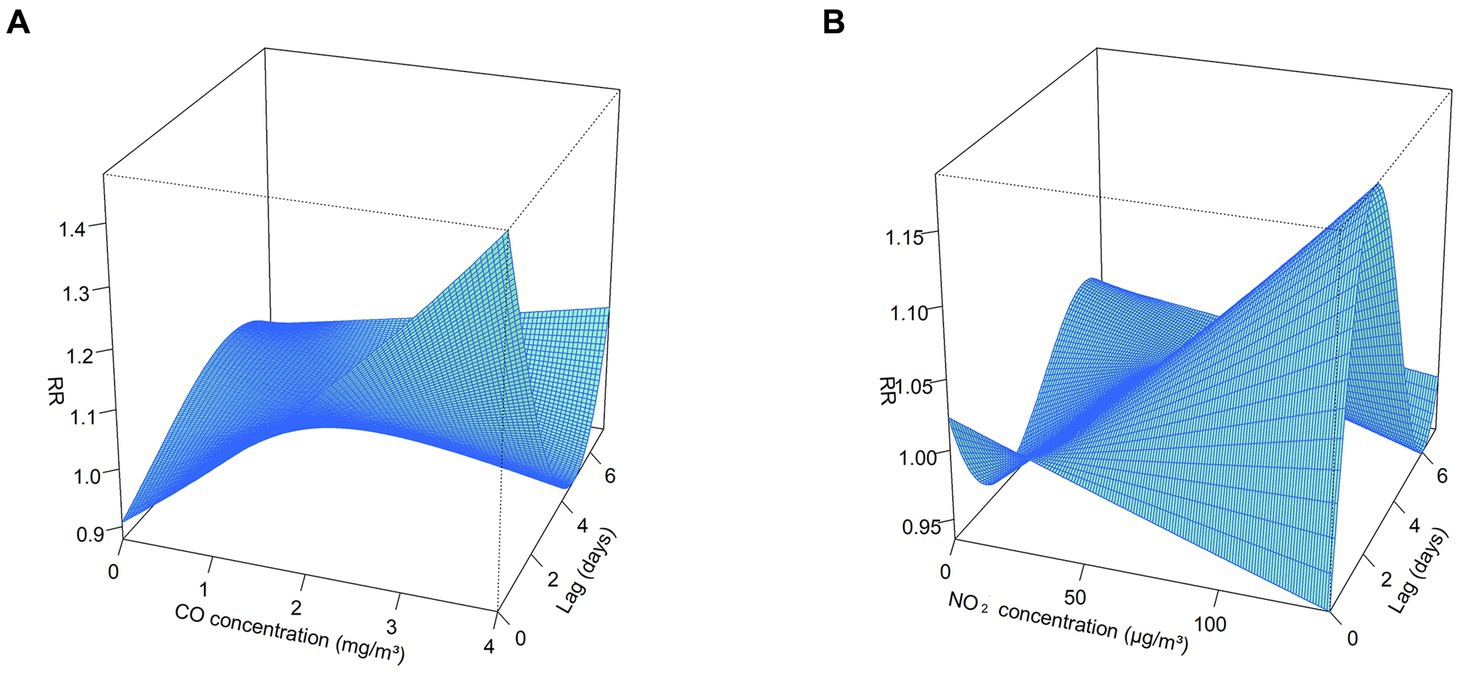
Figure 3. 3D plot for the association between air pollutants (CO and NO2) and GN visits in Hefei, China, 2015–2019. (A) 3D plot of CO; (B) 3D plot of NO2. CO, carbon monoxide; NO2, nitrogen dioxide; and RR, relative risk. The P50 was used as the reference concentration. The P50 concentration of CO is 0.8 mg/m3 and the P50 concentration of NO2 is 36 μg/m3.
3.3. Association between air pollutants and GN visits in a single pollutant model
Our analysis revealed variations in the RR values corresponding to 1 mg/m3 per CO concentration increment and 10 μg/m3 per NO2 concentration increment across different lag days for GN visitations (Figure 4; Supplementary Table S3). In the single-day lag effect model for CO, the risks for GN visits were positively associated with CO from lag0 (RR: 1.129, 95% CI: 1.031–1.236) to lag2 (RR: 1.034, 95% CI: 1.000–1.070), peaking at lag0. Conversely, the risks decreased at lag4 (RR: 0.968, 95% CI: 0.943–0.993) and lag5 (RR: 0.961, 95% CI: 0.930–0.993). Cumulative lagged effects analysis of CO revealed increased risks of GN visits for all lag days except lag06, and the risk reached its maximum value at lag02 (RR: 1.263, 95% CI: 1.132–1.410).
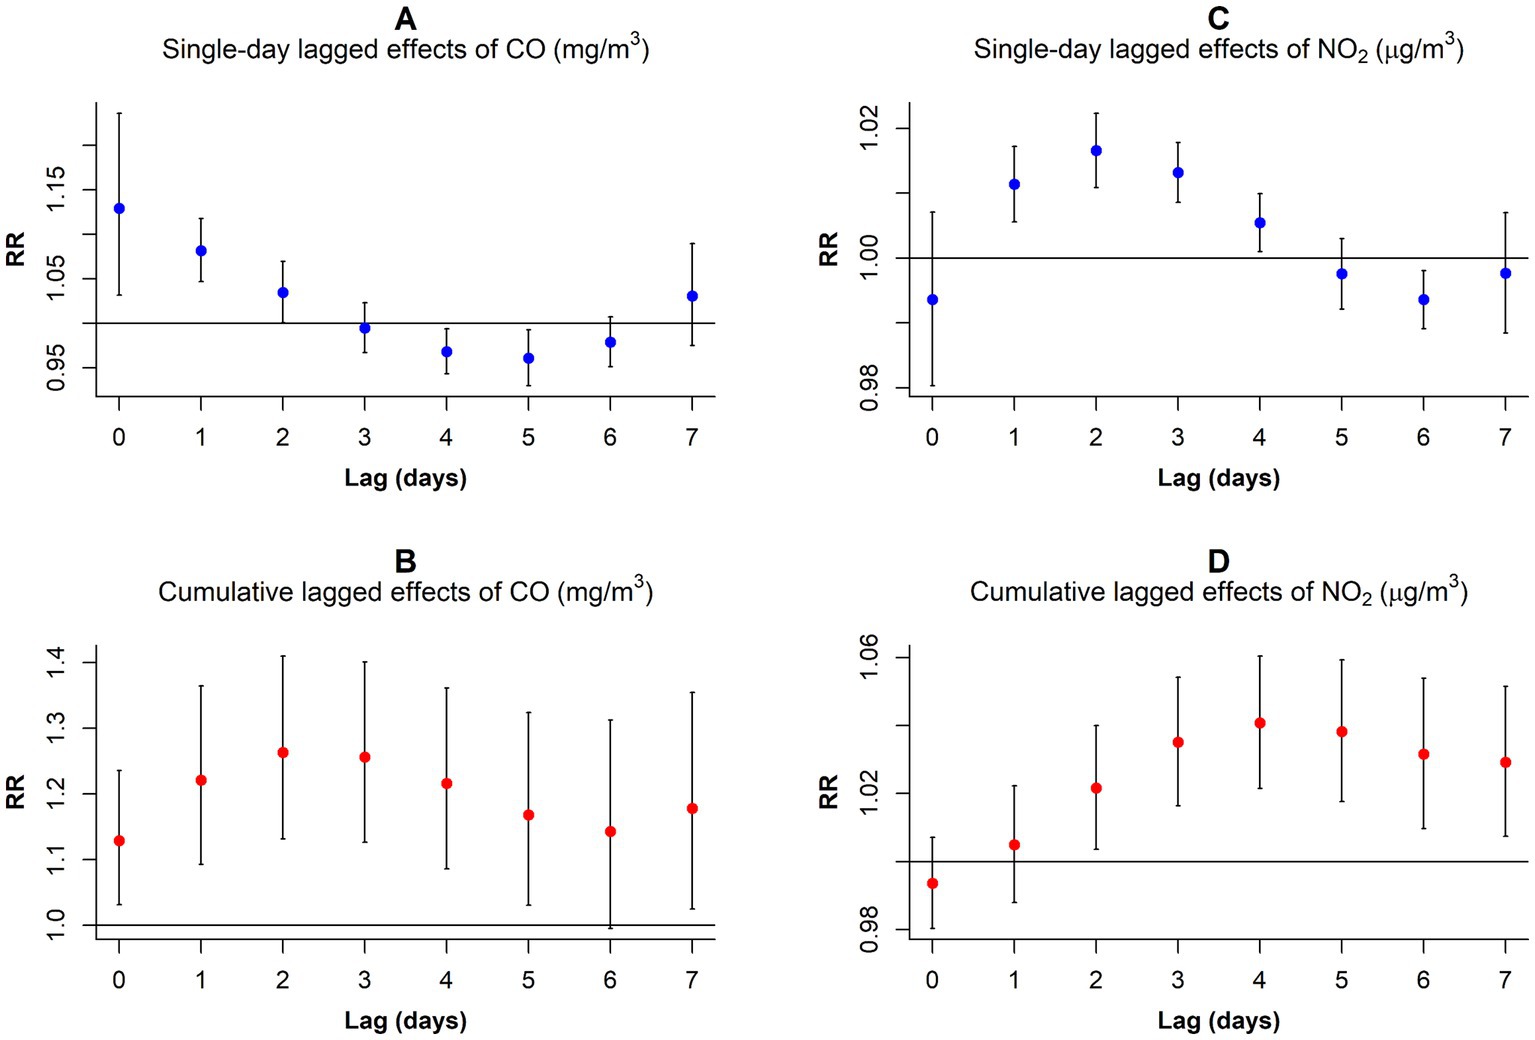
Figure 4. RR values and 95% CI in the number of daily outpatient visits for GN associated with increases of 1 mg/m3 in CO and 10 μg/m3 in NO2 concentrations at different lag days. (A) Single-day lagged effects of CO; (B)Cumulative lagged effects of CO; (C) Single-day lagged effects of NO2; (D) Cumulative lagged effects of NO2. CO, carbon monoxide; NO2, nitrogen dioxide; and RR, relative risk.
In contrast to CO, the harm of NO2 came more slowly. When considering a single-day lag, increased NO2 exposure elevated GN visit risk during the preceding 4 days (lag1–lag4), peaking at lag2 (RR: 1.017, 95% CI: 1.011–1.022). However, the risk decreased at lag6 (RR: 0.994, 95% CI: 0.989–0.998). Furthermore, cumulative lag models showed harmful NO2 effects persisting from lag02 to lag07, with the highest risk observed on lag04 (RR: 1.041, 95% CI: 1.021–1.060).
3.4. Association between air pollutants and GN visits in a dual-pollutant model
In the dual-pollutant model, the significance of NO2 and CO persisted when controlling for each other. With NO2 adjustment, the single-day lagged effect curve of CO exposure on GN risk exhibited a U-shaped pattern, peaking on exposure day (RR: 1.193, 95% CI: 1.086–1.310) and at the lowest point on the lag3 (RR: 0.936, 95% CI: 0.905–0.968; Figure 5A; Supplementary Table S4). In the cumulative lag model, CO exposure only increased GN visits during the first 3 days (lag01–lag03; Figure 5B; Supplementary Table S4).
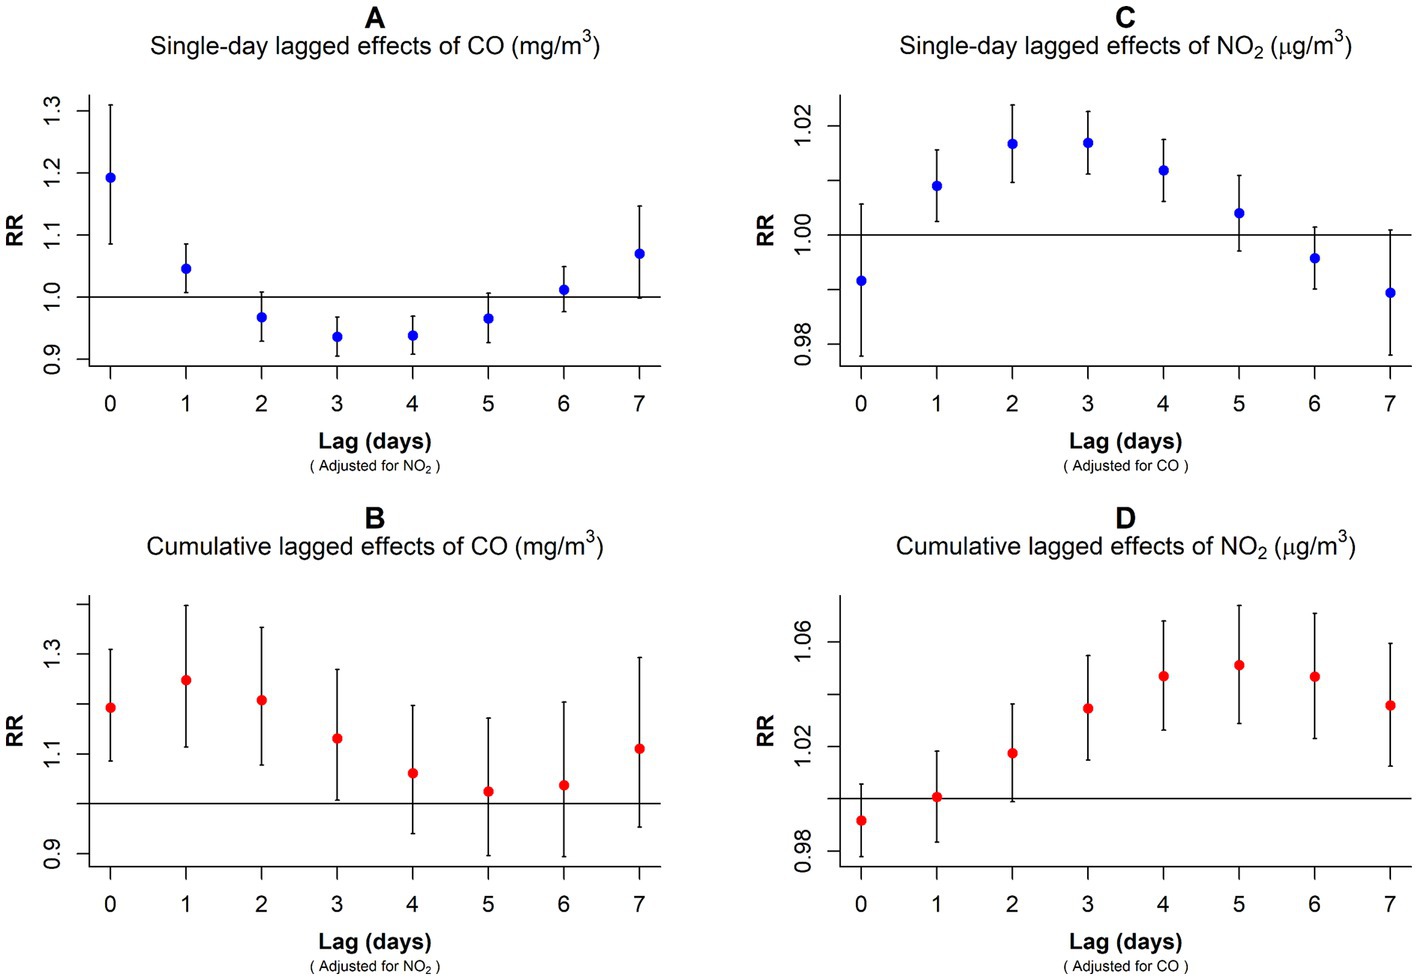
Figure 5. RR values and 95% CI in the number of daily outpatient visits for GN associated with increases of 1 mg/m3 in CO and 10 μg/m3 in NO2 concentrations in the dual-pollutant model. (A,B) Harmful effects of CO exposure after correcting for NO2 interference. (C,D) Harmful effects of NO2 exposure after correcting for CO interference. CO, carbon monoxide; NO2, nitrogen dioxide; and RR, relative risk.
After adjusting for CO, the single-day lagged effect trend of NO2 followed an inverted U-shape with the prolongation of lag days, peaking at lag3 (RR: 1.017, 95% CI: 1.011–1.023; Figure 5C; Supplementary Table S4). In the cumulative lagged effect model of NO2, lag03–lag07 were positively associated with GN visit risk, and the RR value peaked at lag05 (RR: 1.051, 95% CI: 1.029–1.074; Figure 5D; Supplementary Table S4).
3.5. Subgroup analysis
Upon conducting stratified analyses based on sex, age, and season, we found that contact with CO and NO2 was linked to an increased risk of GN visits across all subgroups (all p < 0.05) except for the cumulative lagged effect of the seasonal grouping of NO2 (Supplementary Tables S4–S6; Figures 6–9). However, our results from the Wilcoxon signed-rank test showed that only the differences in cumulative lag effect for the age group, season group of CO, and gender group of NO2 had statistically significant (Supplementary Table S7). Notably, the older adult and cold-season groups exhibited a heightened susceptibility to the cumulative lagged effect of CO exposure compared to age < 65 years and warm-season groups. The female group was more vulnerable to the harmful effects of cumulative exposure to NO2.
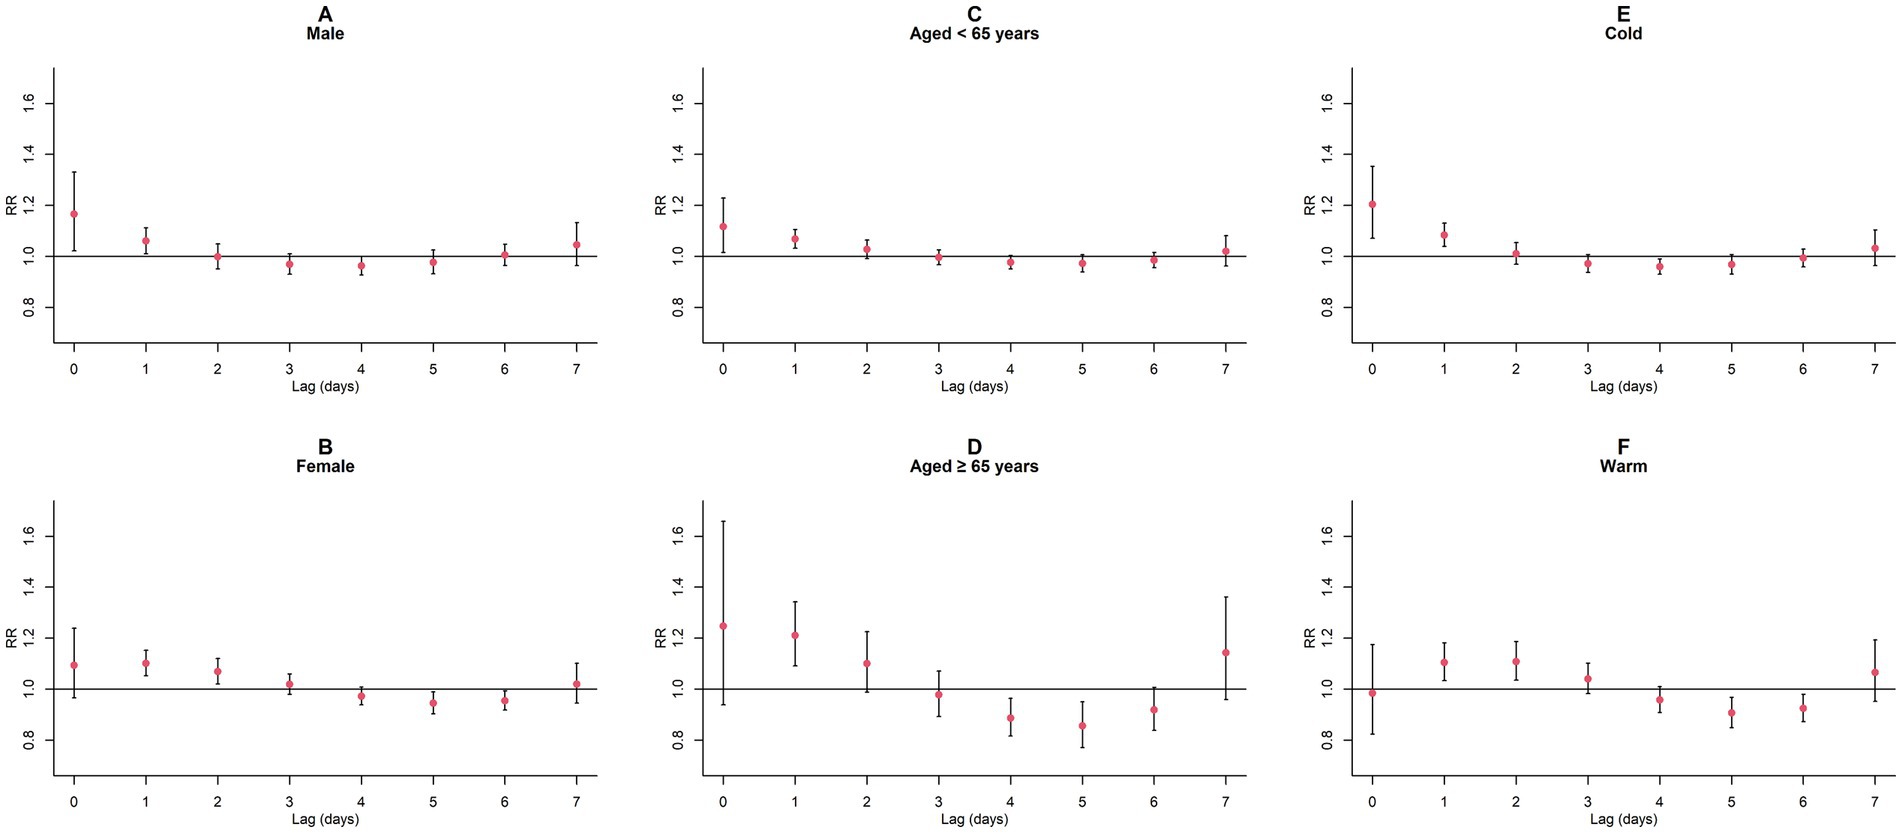
Figure 6. Single-day lagged RR values and 95% CI of GN visits per 1 mg/m3 increase in CO concentration in a model stratified by gender, age, and season. (A,B) Single-day lagged effects of CO grouped by gender; (C,D) Single-day lagged effects of CO grouped by age; (E,F) Single-day lagged effects of CO grouped by season. Harmful effects of CO stratified by sex, age, and season.
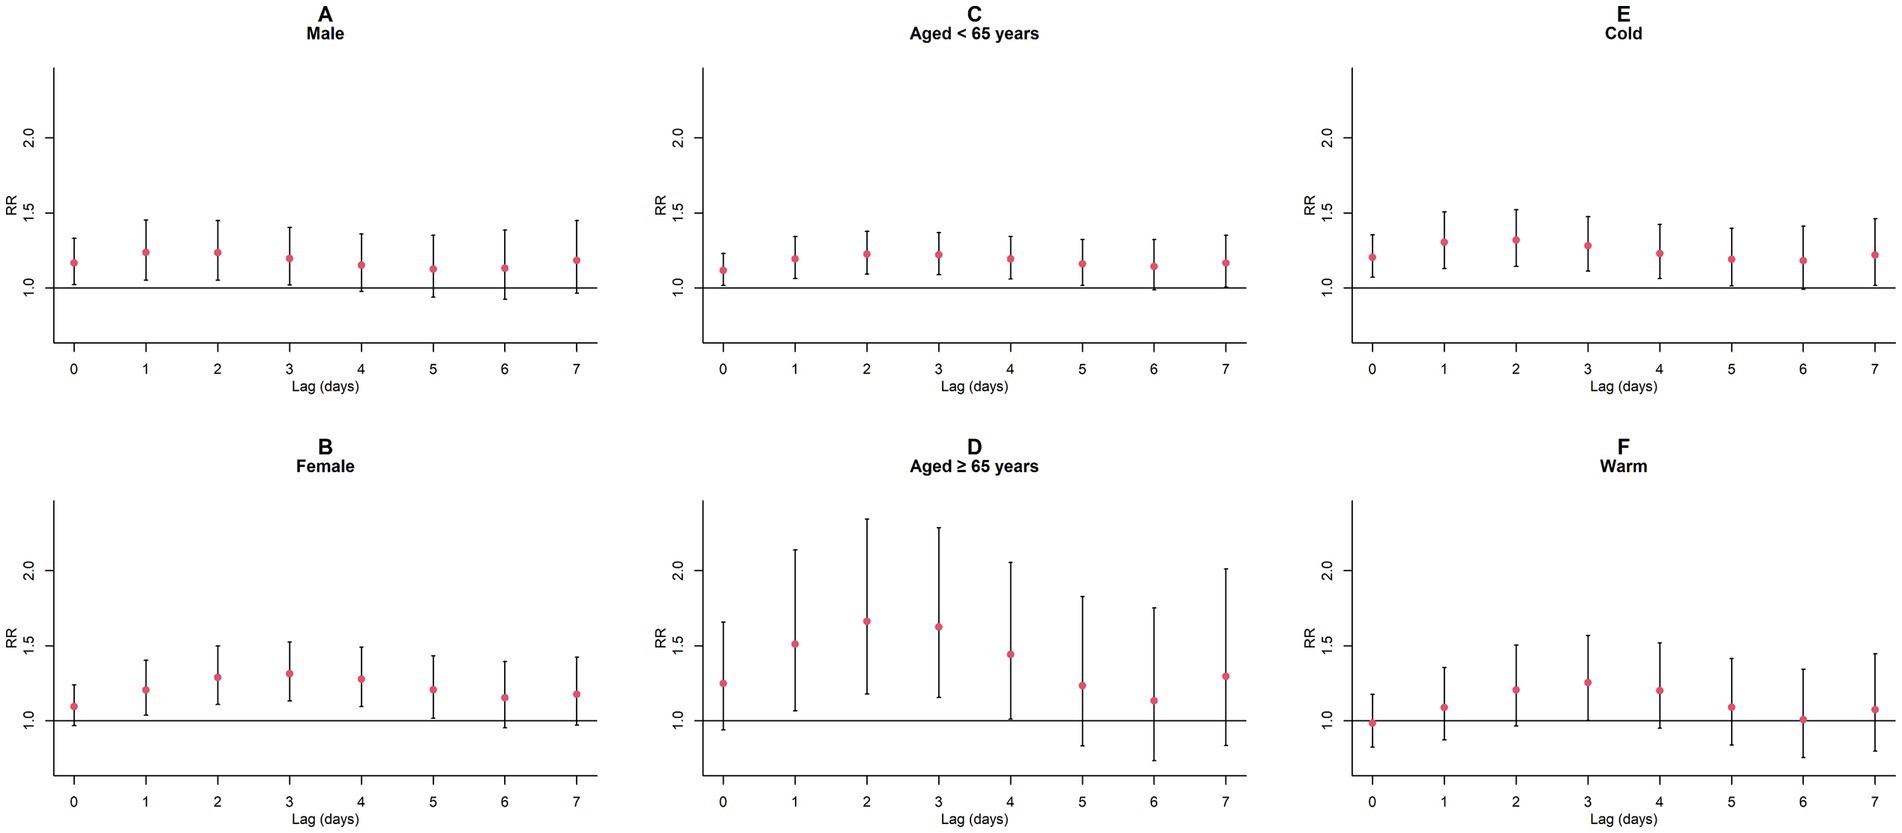
Figure 7. Cumulative lagged RR values and 95% CI of GN visits per 1 mg/m3 increase in CO concentration in a model stratified by gender, age, and season. (A,B) Cumulative lagged effects of CO grouped by gender; (C,D) Cumulative lagged effects of CO grouped by age; (E,F) Cumulative lagged effects of CO grouped by season. Harmful effects of CO stratified by sex, age, and season.
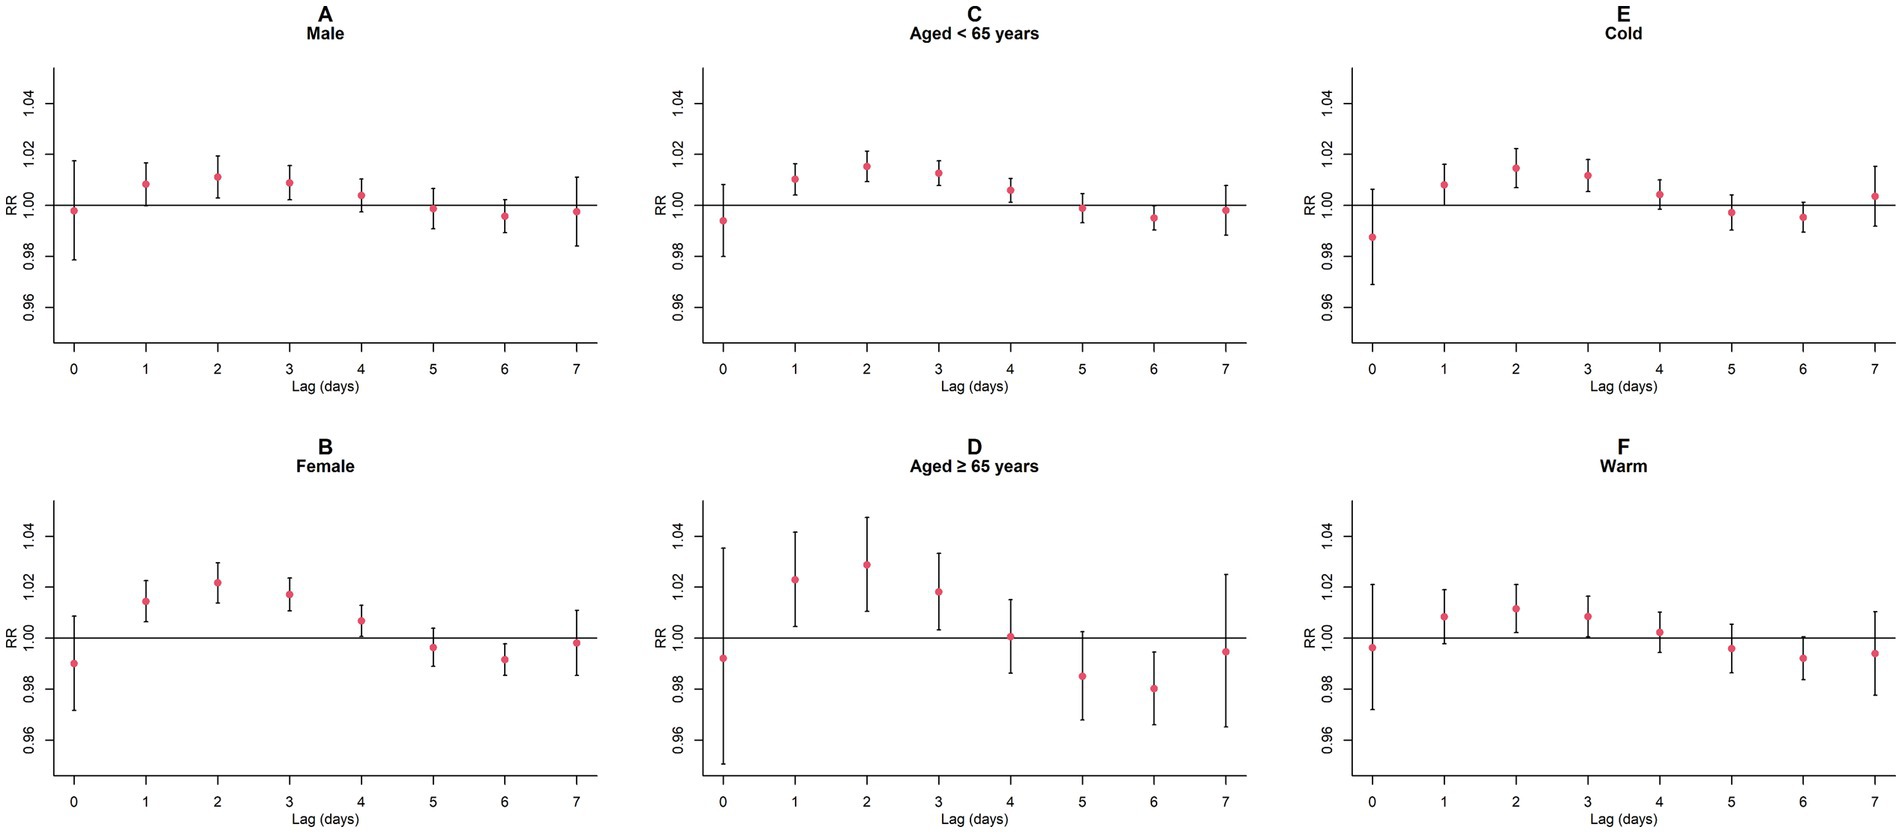
Figure 8. Single-day lagged RR values and 95% CI of GN visits per 10 μg/m3 increase in NO2 concentration in a model stratified by gender, age, and season. (A,B) Single-day lagged effects of NO2 grouped by gender; (C,D) Single-day lagged effects of NO2 grouped by age; (E,F) Single-day lagged effects of NO2 grouped by season. Harmful effects of NO2 stratified by sex, age, and season.

Figure 9. Cumulative lagged RR values and 95% CI of GN visits per 10 μg/m3 increase in NO2 concentration in a model stratified by gender, age, and season. (A,B) Cumulative lagged effects of NO2 grouped by gender; (C,D) Cumulative lagged effects of NO2 grouped by age; (E,F) Cumulative lagged effects of NO2 grouped by season. Harmful effects of NO2 stratified by sex, age, and season.
3.6. Sensitivity analyses
The AIC values of the model when choosing different dfs (3–8) for time, air pollutions, and meteorological factors are presented in Supplementary Table S8. In the CO and NO2 models, the AIC value is both the smallest (CO: 11250.67; NO2:11246.88) when the dfs for time, air pollutions, and meteorological factors are 7, 5, and 7, respectively.
Sensitivity analysis results indicated that the consequences of CO and NO2 contact on the risk of GN visits remain generally robust after varying the dfs of the time, air pollutions, and meteorological factors (Supplementary Figures S4–S9) and regulating the maximum lag periods for CO and NO2 (Supplementary Figures S10, S11). After setting the reference values of each pollutant model to 0, our overall exposure effect results remained unchanged (Supplementary Figures S3, S12). Furthermore, the subsequent analyses of single-day and cumulative lag effects for CO and NO2 were highly consistent with our previous findings (Figure 4; Supplementary Figure S13; Supplementary Tables S3, S9).
4. Discussion
In this investigation, we analyzed nephritis outpatient records from the two prominent grade A tertiary hospitals from 2015 to 2019 to quantitatively assess the correlation between atmospheric contaminants and GN visits. Our findings indicated that contact with CO and NO2 were significantly associated with an elevated risk of GN-related hospital visits, suggesting that these pollutants might be a potential risk factor for GN. For each 1 mg/m3 elevation in CO level, the GN visit risk escalated by 12.9% in the single-day lag model (lag0, 95% CI: 3.1–23.6%) and by up to 26.3% in the cumulative lag model (lag02, 95% CI: 13.2–41.0%). Meanwhile, every 10 μg/m3 elevation in NO2 concentration resulted in a 1.7% increase in GN visit risk (lag2, 95% CI: 1.1–2.2%) in the single-day lag model and a 4.1% increase in the cumulative lag model (lag04, 95% CI: 2.1–6.0%).
Previous epidemiological studies examining the correlation between atmospheric contaminants and GN incidence are scarce, focusing more on CKD or ESRD. Our results are supported by a study (24) conducted on a national cohort of US veterans, which observed a positive correlation between increased interquartile ranges (IQR) of CO and NO2 concentrations and the decline of glomerular filtration rate, as well as the incidence and progression of CKD and ESRD. However, some studies (25, 26) reported damages of CO exposure on kidney function without identifying an association between kidney disease and NO2 exposure. A retrospective cohort research (25) of CKD patients in Seoul, South Korea, confirmed the significant correlation between CO and PM2.5 and the long-term mortality risks in CKD patients, but no effects of other pollutants (e.g., NO2) on CKD patient mortality were observed. Another study (26) from Korea found that exposure to CO and SO2 had the most severe perniciousness on CKD clinic visits. In contrast, studies by Łukasz Kuźma et al. (27) and Szu-Ying Chen et al. (28) identified increased mean levers of NO2 and PM2.5 as relevant factors for the prevalence and progression of CKD in Bialystok, Poland, and Chinese Taipei, respectively. Interestingly, a national study (29) based on the Chinese CKD survey only demonstrated that long-term exposure to O3 elevated the risk of CKD in the general Chinese population. The discrepancies and heterogeneity between these studies may arise from geographical variations, participant sizes, data sources, exposure assessment methods, and distinct air pollution conditions across countries. There are several plausible explanations for the discrepancies between our findings and those of other studies: (1) Substantial differences in air pollution levels between studies could result in the absence of correlation, complicating the comparison of results. For instance, the median annual mean levers of NO2 and PM2.5 in Bialystok, Poland, were 13.1 and 10.9 μg/m3, respectively (27), while in Taipei, China, the annual average concentrations were 24.3 and 23.5 μg/m3, respectively (28). Throughout the study period in Hefei City, the levels of NO2, CO, PM10, PM2.5, SO2, and O3-8h were 40.31 μg/m3, 0.84 mg/m3, 76.17 μg/m3, 52.29 μg/m3, 10.55 μg/m3, and 86.32 μg/m3, respectively. These considerable differences can partially account for the lack of a significant correlation between PM2.5 exposure and our study’s increased risk of GN visits. (2) The effects of participants’ social and economic status and risky behaviors may also influence the results. Individuals in countries or regions with higher per capita income typically have better education and higher income, potentially providing protective effects against the development of kidney disease (30–32). (3) Variations in disease definitions and diagnostic criteria used across studies may lead to inconsistent results. Although GN ranks as the third and second primary cause of CKD (2) and ESRD (3), the biochemical markers and clinical manifestations used for diagnosis are not identical. Furthermore, the data types and study designs employed in different studies could also affect the results. For example, some studies utilized cross-sectional designs and generalized additive models, while our study adopted time series analysis and DLNM, which might have contributed to differences in the results between studies.
Previous research on air pollution and public health had commonly employed single-pollutant models, neglecting the complex interplay among various pollutants and their collective impact on environmental and human health. In this study, we incorporated both CO and NO2 into our model framework. After adjusting for NO2 interference, we observed a reduction in the lagged impacts of CO exposure on the risk of GN visits. The RR values diminished more swiftly with increasing lag time but still peaked on the day of exposure (lag0) in the single-day lag model. This phenomenon aligns with previous research (26) examining emergency room visits due to kidney disease concerning ambient air pollution in Korea. In order to examine whether this phenomenon is due to the harvesting effect (22, 23), we reevaluated the risk correlation between CO exposure and GN visits for extended maximum lag days (14 and 21), as depicted in Supplementary Figure S10. The absence of a cosine-like plotting pattern was observed, indicating that it is unlikely that the harvesting effect would have a substantial impact on our estimates. Correspondingly, after controlling for CO interference, the detrimental effects of NO2 exposure manifested later, and the decline in RR values decelerated compared to the single-pollutant model. This phenomenon may be attributed to the differential absorption and metabolism rates of various air pollutants in the human body. For instance, a CO inhalation experiment (33) indicated rapid blood CO saturation within 4–5 h, while a NO2 inhalation study (34) demonstrated a more gradual response to exposure. Therefore, it is essential to recognize that high CO concentrations may significantly elevate the risk of GN visits and various comorbidities on the day of exposure, while increased attention should be given to the harmful effects of NO2 in the days following exposure.
Gender, age, and season are considered influential factors in health assessments and are often standardized as appropriate stratification methods within populations. In this study, we identified compelling results among various subpopulations: females were found to be more susceptible to the effects of NO2 than males. This observation may be attributed to the fact that non-smokers are more sensitive to air pollution than smokers (35, 36), and that smoking rates among females are much lower than among males in China (37). Furthermore, regarding the association between age and GN visit risk, CO exhibited more excellent detrimental effects on older than younger individuals. This finding aligns with previous researches (38, 39) examining the link between atmospheric contaminants and disease. The underlying cause may be the higher prevalence of chronic diseases such as diabetes (40), and heart disease (41) among older adults, which are linked to the nosogenesis of kidney diseases (42). Concurrently, CO exposure increases the risk of developing diabetes (43, 44), and heart disease (45, 46). These discoveries emphasize the importance of controlling health indicators such as blood glucose and blood pressure levels to maintain kidney function in older adults. In addition, CO exposure was more strongly associated with GN visits during the cold season. This observation could be explained by the physiological adaptations under colder conditions, where the human body’s blood vessels constriction, intensifying renal ischemia and decreasing renal resistance to both hypoxia and harmful substances (47). Consequently, susceptible populations in highly polluted environments during the cold season, such as females and older individuals, should adopt additional safeguard procedures to alleviate the deleterious influences of atmospheric contaminants on their health.
Various potential biological mechanisms may help elucidate the connection between NO2 and CO exposure and the elevated risk of GN visits. CO readily binds to hemoglobin, increasing its affinity for oxygen and subsequently leading to tissue hypoxia (48). Insufficient renal oxygen supply may cause glomerular capillary constriction, impacting filtration function and decreasing glomerular filtration rate (47). Furthermore, tissue hypoxia may result in tubular dysfunction. Animal studies (49) have demonstrated that energy metabolism in renal tubular epithelial cells is impaired under oxygen-deprived conditions, weakening the reabsorption and secretion of filtrate. Additionally, renal hypoxia can stimulate excessive matrix protein production, leading to tissue hardening, functional impairment, and interstitial fibrosis (50). Compared to CO, the biological mechanisms underlying renal injury caused by NO2 exposure are more complex. Firstly, NO2 may induce renal damage by increasing oxidative stress responses. Toxicological evidence (51) from an animal model suggests that NO2 exposure elevates oxidative stress reactions. Moreover, Mirowsky et al. (52) found that genes associated with oxidative stress were highly expressed in primary human bronchial epithelial cells under NO2 induction, while substantial evidence (53–55) indicates that oxidative stress has detrimental effects on the kidneys. Secondly, toxicological evidence (56, 57) from animal experiments implies that NO2 might straight damage renal function by augmenting the risk of glomerular damage, expansion, hyperfiltration, and heightening susceptibility to infection. Lastly, NO2 can activate immune cells, inducing the production of pro-inflammatory cytokines (e.g., TNF-α, IL-1β) (58–60), leading to renal inflammatory responses (61–63).
As an observational investigation, our research presents several limitations that should be considered. Firstly, it is unable to establish causality between atmospheric contaminants and the GN visit risk, and the findings may be subject to residual confounding. Moreover, our study is concentrated solely on Hefei and due to its unique geographical and environmental attributes, the findings might not be universally applicable to other areas. Lastly, we used fixed-site monitoring data to assess air pollution exposure, which does not provide information about individual or indoor exposure levels. Future research should prioritize comprehensive, multi-city analyses and the collection of personal exposure data to assess better potential health risks associated with air pollution exposure.
Notwithstanding its limitations, the present investigation holds considerable merit for multiple reasons. To begin with, it represents the first study that quantifies short-term correlations between CO and NO2 exposure and the occurrence of GN clinic visits, employing time-series analysis techniques. This exploratory study contributes to the existing body of research in this domain, providing preliminary insights into the potential implications of air pollutants on GN. Furthermore, this study’s outpatient and meteorological datasets are complete. This comprehensive data allowed for the robust examination of the correlations between atmospheric contaminants and the risk of GN visits and the identification of susceptible subpopulations. Consequently, our findings have the potential to inform the optimization of health policies and regulations aimed at mitigating the impact of GN.
5. Conclusion
In summary, the present investigation revealed a significant correlation between contact with CO and NO2 and the rising risk of GN visits. Notably, the detrimental impact of CO was discernible on the day of exposure, whereas NO2’s adverse consequences emerged in subsequent days. Further stratified analysis unveiled that the cumulative harm of CO was greater in cold seasons and older adult groups. Simultaneously, the female population was more susceptible to the harmful effects of cumulative NO2 exposure. Collectively, the findings of this study offer valuable proof that could bolster public health endeavors to mitigate the impacts of GN via synergistic efforts encompassing efficient environmental regulations and preventive approaches.
Data availability statement
The data analyzed in this study are subject to the following licenses/restrictions: the dataset is not publicly available in the article and can be requested from the authors upon request. However, only the basic data of deidentified individuals in the article are provided, and proposals for data acquisition can be submitted within 36 months after the publication of the article. Requests to access these datasets should be directed to XF, xinyufang@ahmu.edu.cn.
Author contributions
HC: conceptualization, data curation, formal analysis, investigation, methodology, validation, visualization, writing—original draft, and writing—review and editing. QD: data curation, writing—original draft, and writing—review and editing. HZ, SW, and XZ: writing—review and editing. DY: data curation, funding acquisition, project administration, resources, supervision, and writing—review and editing. XF: data curation and writing—review and editing. All authors contributed to the article and approved the submitted version.
Funding
This work was funded by Foundation of Anhui Educational Committee (KJ2020A0223); Inflammation and Immune Mediated Diseases Laboratory of Anhui Province Open Project (IMMDL202110); and The Fund of Anhui Provincial Laboratory of Inflammation and Immune Mediated Diseases (Population Epidemiology Study).
Conflict of interest
The authors declare that the research was conducted in the absence of any commercial or financial relationships that could be construed as a potential conflict of interest.
Publisher’s note
All claims expressed in this article are solely those of the authors and do not necessarily represent those of their affiliated organizations, or those of the publisher, the editors and the reviewers. Any product that may be evaluated in this article, or claim that may be made by its manufacturer, is not guaranteed or endorsed by the publisher.
Supplementary material
The Supplementary material for this article can be found online at: https://www.frontiersin.org/articles/10.3389/fpubh.2023.1239378/full#supplementary-material
Footnotes
References
1. Nalewajska, M, Gurazda, K, Styczyńska-Kowalska, E, Marchelek-Myśliwiec, M, Pawlik, A, and Dziedziejko, V. The role of Micro RNAs in selected forms of glomerulonephritis. Int J Mol Sci. (2019) 20:20. doi: 10.3390/ijms20205050
2. Hu, J, Ke, R, Teixeira, W, Dong, Y, Ding, R, Yang, J, et al. Global, regional, and National Burden of CKD due to glomerulonephritis from 1990 to 2019: a systematic analysis from the global burden of disease study 2019. Clin J Am Soc Nephrol. (2023) 18:60–71. doi: 10.2215/cjn.0000000000000017
3. Chadban, SJ, and Atkins, RC. Glomerulonephritis. Lancet. (2005) 365:1797–806. doi: 10.1016/S0140-6736(05)66583-X
4. Couser, WG, and Johnson, RJ. The etiology of glomerulonephritis: roles of infection and autoimmunity. Kidney Int. (2014) 86:905–14. doi: 10.1038/ki.2014.49
5. Luo, C, Ouyang, Y, Shi, S, Li, G, Zhao, Z, Luo, H, et al. Particulate matter of air pollution may increase risk of kidney failure in IgA nephropathy. Kidney Int. (2022) 102:1382–91. doi: 10.1016/j.kint.2022.08.020
6. Lin, SY, Hsu, WH, Lin, CL, Lin, CC, Lin, CH, Wang, IK, et al. Association of Exposure to fine-particulate air pollution and acidic gases with incidence of nephrotic syndrome. Int J Environ Res Public Health. (2018) 15:15. doi: 10.3390/ijerph15122860
7. Xu, X, Wang, G, Chen, N, Lu, T, Nie, S, Xu, G, et al. Long-term exposure to air pollution and increased risk of membranous nephropathy in China. J Am Soc Nephrol. (2016) 27:3739–46. doi: 10.1681/asn.2016010093
8. Wang, C, Tsai, JD, Wan, L, Lin, CL, and Wei, CC. Association between gaseous air pollutants and idiopathic nephrotic syndrome in children: a 12-year population-based cohort study. Ital J Pediatr. (2022) 48:70. doi: 10.1186/s13052-022-01269-8
9. Miller, MR, Raftis, JB, Langrish, JP, McLean, SG, Samutrtai, P, Connell, SP, et al. Inhaled nanoparticles accumulate at sites of vascular disease. ACS Nano. (2017) 11:4542–52. doi: 10.1021/acsnano.6b08551
10. Nemmar, A, Karaca, T, Beegam, S, Yuvaraju, P, Yasin, J, Hamadi, NK, et al. Prolonged pulmonary exposure to diesel exhaust particles exacerbates renal oxidative stress, inflammation and DNA damage in mice with adenine-induced chronic renal failure. Cell Physiol Biochem. (2016) 38:1703–13. doi: 10.1159/000443109
11. Yuan, CS, Lai, CS, Chang-Chien, GP, Tseng, YL, and Cheng, FJ. Kidney damage induced by repeated fine particulate matter exposure: effects of different components. Sci Total Environ. (2022) 847:157528. doi: 10.1016/j.scitotenv.2022.157528
12. Tavera Busso, I, Mateos, AC, Juncos, LI, Canals, N, and Carreras, HA. Kidney damage induced by sub-chronic fine particulate matter exposure. Environ Int. (2018) 121:635–42. doi: 10.1016/j.envint.2018.10.007
13. Statistics APBo (2022). Anhui statistical yearbook—2019.2019 12-09. Available at: http://tjj.ah.gov.cn/oldfiles/tjj/tjjweb/tjnj/2019/cn.html (Accessed September 12, 2022).
14. Zhang, C, Ding, R, Xiao, C, Xu, Y, Cheng, H, Zhu, F, et al. Association between air pollution and cardiovascular mortality in Hefei, China: a time-series analysis. Environ Pollut. (2017) 229:790–7. doi: 10.1016/j.envpol.2017.06.022
15. Sethi, S, Haas, M, Markowitz, GS, D'Agati, VD, Rennke, HG, Jennette, JC, et al. Mayo Clinic/Renal Pathology Society consensus report on pathologic classification, diagnosis, and reporting of GN. J Am Soc Nephrol. (2016) 27:1278–87. doi: 10.1681/asn.2015060612
16. Gasparrini, A, Armstrong, B, and Kenward, MG. Distributed lag non-linear models. Stat Med. (2010) 29:2224–34. doi: 10.1002/sim.3940
17. Wu, Q, Xu, Z, Dan, YL, Cheng, J, Zhao, CN, Mao, YM, et al. Association between traffic-related air pollution and hospital readmissions for rheumatoid arthritis in Hefei, China: a time-series study. Environ Pollut. (2021) 268:115628. doi: 10.1016/j.envpol.2020.115628
18. Bell, ML, Samet, JM, and Dominici, F. Time-series studies of particulate matter. Annu Rev Public Health. (2004) 25:247–80. doi: 10.1146/annurev.publhealth.25.102802.124329
19. Mokoena, KK, Ethan, CJ, Yu, Y, Shale, K, and Liu, F. Ambient air pollution and respiratory mortality in Xi'an, China: a time-series analysis. Respir Res. (2019) 20:139. doi: 10.1186/s12931-019-1117-8
20. Gong, T, Sun, Z, Zhang, X, Zhang, Y, Wang, S, Han, L, et al. Associations of black carbon and PM2.5 with daily cardiovascular mortality in Beijing, China. Atmos Environ. (2019) 214:116876. doi: 10.1016/j.atmosenv.2019.116876
21. Perperoglou, A, Sauerbrei, W, Abrahamowicz, M, and Schmid, M. A review of spline function procedures in R. BMC Med Res Methodol. (2019) 19:46. doi: 10.1186/s12874-019-0666-3
22. Schwartz, J. Is there harvesting in the association of airborne particles with daily deaths and hospital admissions? Epidemiology. (2001) 12:55–61. doi: 10.1097/00001648-200101000-00010
23. Zhang, F, Zhang, H, Wu, C, Zhang, M, Feng, H, Li, D, et al. Acute effects of ambient air pollution on clinic visits of college students for upper respiratory tract infection in Wuhan. China Environ Sci Pollut Res Int. (2021) 28:29820–30. doi: 10.1007/s11356-021-12828-7
24. Bowe, B, Xie, Y, Li, T, Yan, Y, Xian, H, and Al-Aly, Z. Associations of ambient coarse particulate matter, nitrogen dioxide, and carbon monoxide with the risk of kidney disease: a cohort study. Lancet Planet Health. (2017) 1:e267–76. doi: 10.1016/s2542-5196(17)30117-1
25. Jung, J, Park, JY, Kim, YC, Lee, H, Kim, E, Kim, YS, et al. Effects of air pollution on mortality of patients with chronic kidney disease: a large observational cohort study. Sci Total Environ. (2021) 786:147471. doi: 10.1016/j.scitotenv.2021.147471
26. Lee, W, Prifti, K, Kim, H, Kim, E, Yang, J, Min, J, et al. Short-term exposure to air pollution and attributable risk of kidney diseases: a Nationwide time-series study. Epidemiology. (2022) 33:17–24. doi: 10.1097/ede.0000000000001430
27. Kuźma, Ł, Małyszko, J, Bachórzewska-Gajewska, H, Kralisz, P, and Dobrzycki, S. Exposure to air pollution and renal function. Sci Rep. (2021) 11:11419. doi: 10.1038/s41598-021-91000-0
28. Chen, SY, Chu, DC, Lee, JH, Yang, YR, and Chan, CC. Traffic-related air pollution associated with chronic kidney disease among elderly residents in Taipei City. Environ Pollut. (2018) 234:838–45. doi: 10.1016/j.envpol.2017.11.084
29. Yang, C, Wang, W, Wang, Y, Liang, Z, Zhang, F, Chen, R, et al. Ambient ozone pollution and prevalence of chronic kidney disease: a nationwide study based on the China national survey of chronic kidney disease. Chemosphere. (2022) 306:135603. doi: 10.1016/j.chemosphere.2022.135603
30. Venkataramani, AS, Brigell, R, O'Brien, R, Chatterjee, P, Kawachi, I, and Tsai, AC. Economic opportunity, health behaviours, and health outcomes in the USA: a population-based cross-sectional study. Lancet Public Health. (2016) 1:e18–25. doi: 10.1016/s2468-2667(16)30005-6
31. Olden, K. The inaugural Olden distinguished lecture: economic inequality and health disparities. Environ Health Perspect. (2021) 129:41001. doi: 10.1289/ehp8631
32. Vega, WA, and Sribney, WM. Growing economic inequality sustains health disparities. Am J Public Health. (2017) 107:1606–7. doi: 10.2105/ajph.2017.304024
33. Pedley, FG. The effects of small amounts of carbon monoxide on the human organism. Can Med Assoc J. (1929) 21:209–10.
34. Brand, P, Bertram, J, Chaker, A, Jörres, RA, Kronseder, A, Kraus, T, et al. Biological effects of inhaled nitrogen dioxide in healthy human subjects. Int Arch Occup Environ Health. (2016) 89:1017–24. doi: 10.1007/s00420-016-1139-1
35. Myers, R, Brauer, M, Dummer, T, Atkar-Khattra, S, Yee, J, Melosky, B, et al. High-ambient air pollution exposure among never smokers versus ever smokers with lung Cancer. J Thorac Oncol. (2021) 16:1850–8. doi: 10.1016/j.jtho.2021.06.015
36. Fiorito, G, Vlaanderen, J, Polidoro, S, Gulliver, J, Galassi, C, Ranzi, A, et al. Oxidative stress and inflammation mediate the effect of air pollution on cardio-and cerebrovascular disease: a prospective study in nonsmokers. Environ Mol Mutagen. (2018) 59:234–46. doi: 10.1002/em.22153
37. Liu, S, Zhang, M, Yang, L, Li, Y, Wang, L, Huang, Z, et al. Prevalence and patterns of tobacco smoking among Chinese adult men and women: findings of the 2010 national smoking survey. J Epidemiol Community Health. (2017) 71:154–61. doi: 10.1136/jech-2016-207805
38. Tian, Y, Liu, H, Zhao, Z, Xiang, X, Li, M, Juan, J, et al. Association between ambient air pollution and daily hospital admissions for ischemic stroke: a nationwide time-series analysis. PLoS Med. (2018) 15:e1002668. doi: 10.1371/journal.pmed.1002668
39. Wang, Z, Zhou, Y, Zhang, Y, Huang, X, Duan, X, Ou, Y, et al. Association of hospital admission for bronchiectasis with air pollution: a province-wide time-series study in southern China. Int J Hyg Environ Health. (2021) 231:113654. doi: 10.1016/j.ijheh.2020.113654
40. Liu, M, Liu, SW, Wang, LJ, Bai, YM, Zeng, XY, Guo, HB, et al. Burden of diabetes, hyperglycaemia in China from to 2016: findings from the 1990 to 2016, global burden of disease study. Diabetes Metab. (2019) 45:286–93. doi: 10.1016/j.diabet.2018.08.008
41. Moran, AE, Forouzanfar, MH, Roth, GA, Mensah, GA, Ezzati, M, Flaxman, A, et al. The global burden of ischemic heart disease in 1990 and 2010: the global burden of disease 2010 study. Circulation. (2014) 129:1493–501. doi: 10.1161/circulationaha.113.004046
42. Tsioufis, C, Tatsis, I, Thomopoulos, C, Wilcox, C, Palm, F, Kordalis, A, et al. Effects of hypertension, diabetes mellitus, obesity and other factors on kidney haemodynamics. Curr Vasc Pharmacol. (2014) 12:537–48. doi: 10.2174/157016111203140518173700
43. Song, J, Lu, M, Lu, J, Chao, L, An, Z, Liu, Y, et al. Acute effect of ambient air pollution on hospitalization in patients with hypertension: a time-series study in Shijiazhuang. China Ecotoxicol Environ Saf. (2019) 170:286–92. doi: 10.1016/j.ecoenv.2018.11.125
44. Li, Y, Xu, L, Shan, Z, Teng, W, and Han, C. Association between air pollution and type 2 diabetes: an updated review of the literature. Ther Adv Endocrinol Metab. (2019) 10:2042018819897046. doi: 10.1177/2042018819897046
45. Li, W, Cao, Y, Li, R, Ma, X, Chen, J, Wu, Z, et al. The spatial variation in the effects of air pollution on cardiovascular mortality in Beijing, China. J Expo Sci Environ Epidemiol. (2018) 28:297–304. doi: 10.1038/jes.2016.21
46. Lim, CC, Hayes, RB, Ahn, J, Shao, Y, Silverman, DT, Jones, RR, et al. Mediterranean diet and the association between air pollution and cardiovascular disease mortality risk. Circulation. (2019) 139:1766–75. doi: 10.1161/circulationaha.118.035742
47. Evans, RG, Gardiner, BS, Smith, DW, and O'Connor, PM. Intrarenal oxygenation: unique challenges and the biophysical basis of homeostasis. Am J Physiol Ren Physiol. (2008) 295:F1259–70. doi: 10.1152/ajprenal.90230.2008
48. Chenoweth, JA, Albertson, TE, and Greer, MR. Carbon Monoxide Poisoning. Crit Care Clin. (2021) 37:657–72. doi: 10.1016/j.ccc.2021.03.010
49. Rosenberger, C, Mandriota, S, Jürgensen, JS, Wiesener, MS, Hörstrup, JH, Frei, U, et al. Expression of hypoxia-inducible factor-1alpha and-2alpha in hypoxic and ischemic rat kidneys. J Am Soc Nephrol. (2002) 13:1721–32. doi: 10.1097/01.asn.0000017223.49823.2a
50. Nangaku, M, and Eckardt, KU. Hypoxia and the HIF system in kidney disease. J Mol Med. (2007) 85:1325–30. doi: 10.1007/s00109-007-0278-y
51. Lu, C, Liu, Q, Deng, M, Liao, H, Yang, X, and Ma, P. Interaction of high temperature and NO (2) exposure on asthma risk: in vivo experimental evidence of inflammation and oxidative stress. Sci Total Environ. (2023) 869:161760. doi: 10.1016/j.scitotenv.2023.161760
52. Mirowsky, JE, Dailey, LA, and Devlin, RB. Differential expression of pro-inflammatory and oxidative stress mediators induced by nitrogen dioxide and ozone in primary human bronchial epithelial cells. Inhal Toxicol. (2016) 28:374–82. doi: 10.1080/08958378.2016.1185199
53. Ogura, Y, Kitada, M, and Koya, D. Sirtuins and renal oxidative stress. Antioxidants. (2021) 10:10. doi: 10.3390/antiox10081198
54. Coppolino, G, Leonardi, G, Andreucci, M, and Bolignano, D. Oxidative stress and kidney function: a brief update. Curr Pharm Des. (2018) 24:4794–9. doi: 10.2174/1381612825666190112165206
55. Yaribeygi, H, Farrokhi, FR, Rezaee, R, and Sahebkar, A. Oxidative stress induces renal failure: a review of possible molecular pathways. J Cell Biochem. (2018) 119:2990–8. doi: 10.1002/jcb.26450
56. Cattell, V, Largen, P, de Heer, E, and Cook, T. Glomeruli synthesize nitrite in active Heymann nephritis; the source is infiltrating macrophages. Kidney Int. (1991) 40:847–51. doi: 10.1038/ki.1991.284
57. Sugimoto, H, Shikata, K, Matsuda, M, Kushiro, M, Hayashi, Y, Hiragushi, K, et al. Increased expression of endothelial cell nitric oxide synthase (ec NOS) in afferent and glomerular endothelial cells is involved in glomerular hyperfiltration of diabetic nephropathy. Diabetologia. (1998) 41:1426–34. doi: 10.1007/s001250051088
58. Devlin, RB, McDonnell, WF, Mann, R, Becker, S, House, DE, Schreinemachers, D, et al. Exposure of humans to ambient levels of ozone for 6.6 hours causes cellular and biochemical changes in the lung. Am J Respir Cell Mol Biol. (1991) 4:72–81. doi: 10.1165/ajrcmb/4.1.72
59. Ayyagari, VN, Januszkiewicz, A, and Nath, J. Effects of nitrogen dioxide on the expression of intercellular adhesion molecule-1, neutrophil adhesion, and cytotoxicity: studies in human bronchial epithelial cells. Inhal Toxicol. (2007) 19:181–94. doi: 10.1080/08958370601052121
60. Amakawa, K, Terashima, T, Matsuzaki, T, Matsumaru, A, Sagai, M, and Yamaguchi, K. Suppressive effects of diesel exhaust particles on cytokine release from human and murine alveolar macrophages. Exp Lung Res. (2003) 29:149–64. doi: 10.1080/01902140303770
61. Donnahoo, KK, Shames, BD, Harken, AH, and Meldrum, DR. Review article: the role of tumor necrosis factor in renal ischemia-reperfusion injury. J Urol. (1999) 162:196–203. doi: 10.1097/00005392-199907000-00068
62. Mühl, H, and Pfeilschifter, J. Anti-inflammatory properties of pro-inflammatory interferon-gamma. Int Immunopharmacol. (2003) 3:1247–55. doi: 10.1016/s1567-5769(03)00131-0
Keywords: air pollution, glomerulonephritis, carbon monoxide, nitrogen dioxide, distributed lag nonlinear model, time-series study air pollution, time-series study
Citation: Chen H, Duan Q, Zhu H, Wan S, Zhao X, Ye D and Fang X (2023) Short-term association of CO and NO2 with hospital visits for glomerulonephritis in Hefei, China: a time series study. Front. Public Health. 11:1239378. doi: 10.3389/fpubh.2023.1239378
Edited by:
Zhaobin Sun, Chinese Academy of Meteorological Sciences, ChinaReviewed by:
Ling Han, National Institute for Communicable Disease Control and Prevention (China CDC), ChinaFaxue Zhang, Wuhan University, China
Copyright © 2023 Chen, Duan, Zhu, Wan, Zhao, Ye and Fang. This is an open-access article distributed under the terms of the Creative Commons Attribution License (CC BY). The use, distribution or reproduction in other forums is permitted, provided the original author(s) and the copyright owner(s) are credited and that the original publication in this journal is cited, in accordance with accepted academic practice. No use, distribution or reproduction is permitted which does not comply with these terms.
*Correspondence: Dongqing Ye, ydq@ahmu.edu.cn; Xinyu Fang, xinyufang@ahmu.edu.cn
†These authors have contributed equally to this work and share first authorship