Corrigendum: A comparative study for accessing primary healthcare between planning assessment and actual utilization for older adults: a case from Dalian City, China
 Jiayuan Bai
 Wei Lu
- School of Architecture and Art, Dalian University of Technology, Dalian, China
Introduction: As China has rapidly evolved into an aging society, the Chinese government has developed a community-oriented primary healthcare system to vigorously expedite the transfer of primary health care (PHC) from higher-level hospitals to community health centers (CHCs). However, current planning standards for CHCs have not considered the heterogeneity of older adults in supply-demand services, such that the areas with severe aging may comprise of underestimated levels of accessibility.
Methods: This study focuses on the gap in PHC access between planning assessment and actual utilization for older adults. We conducted an empirical study in the city area of Dalian based on the check-in and survey data from CHCs during the COVID-19 pandemic. A comparison model was built to calculate matching probability using a modified Gaussian Two-Step Floating Catchment Area (G2SFCA) method.
Results: As indicated by the results, the communities in the primary healthcare shortage area (PHCSA) increased 6.8% by considering the heterogeneity of older adults; these communities with underserved PHC were ignored by the current planning assessment. Based on the comparison of actual and theoretical accessibility for older adults, we found that the average matching probability was about 76.6%, which means approximately a quarter of older adults have been misestimated the accessibility of PHC.
Discussion: Further analysis for the older adults with mismatched accessibility showed two causes of the gap, one is the lack of connection between the spatial distribution of facilities and the allocation of service supply, and the other is the subjective cross-catchment visit to CHCs for older adults.
1. Introduction
The unprecedented challenge for China's public healthcare in the 21st century is the increasingly aging population (1). According to the Seventh National Population Census (2), China has over 2.64 billion adults aged over 60 years (3), representing nearly 18.7% of the total population (4). This number is predicted to reach over 30% by 2050, which means that the population will enter an advanced stage of aging (5). The pronounced consequences in the wake of the fast-aging society involve surges in the prevalence of chronic non-communicable diseases (CNCDs) and the elevated risk of death from infectious diseases (6). As indicated by the data originating from the Global Burden of Diseases, Injuries, and Risk Factors Study (GBD) 2017, CNCDs have already been the leading cause of death in China (nearly 86.6% by population) (7). Moreover, the prevalence of CNCDs in people aged over 60 years is as high as 76%, which is much higher than people aged between 15 and 64 years (52%) (8, 9). Based on early tracking data during the COVID-19 pandemic in China, the fatality ratio (CFR) increased with age, from 0.4 % or lower in patients aged 40 years or younger but 3.6 % in patients aged over 60 years (10), and over 80% of deaths are among older adults (11). The above data fully reveal the vulnerability of older adults to health risks. In order to respond to the social structure of population aging, a powerful primary healthcare (PHC) system is regarded as the key to solving the aging problem (12–14).
Back in 1978, the declaration of Alma-Ata defined PHC as the first level of contact of healthcare services (15) that which should be provided as close as possible to where people live and work (16). In most countries, PHC is primarily provided by community hospitals, clinics, and general practitioners (GPs) (17). By contrast, the PHC service in China has long been provided by high-level general hospitals (GHs) instead of community health facilities (18, 19). As societies age, China soon realized that the current hospital-centric delivery system was costly and did not serve the changing needs of the aging population, which is undergoing an epidemiological transition (20). Thus, China started a new health reform in 2009 to build a community-oriented PHC system that aims to prevent and manage chronic diseases and infectious diseases, supporting a healthy aging society. In the past decade, the government has increased funding 10-fold in community settings (20, 21); as Figure 1 shows, this promoted a transfer of PHC from GHs to community health centers and their subordinate stations (CHCs) (22). CHCs have become the core facilities of PHC, mainly providing prevention, early diagnosis, treatment, and rehabilitation (23).
FIGURE 1
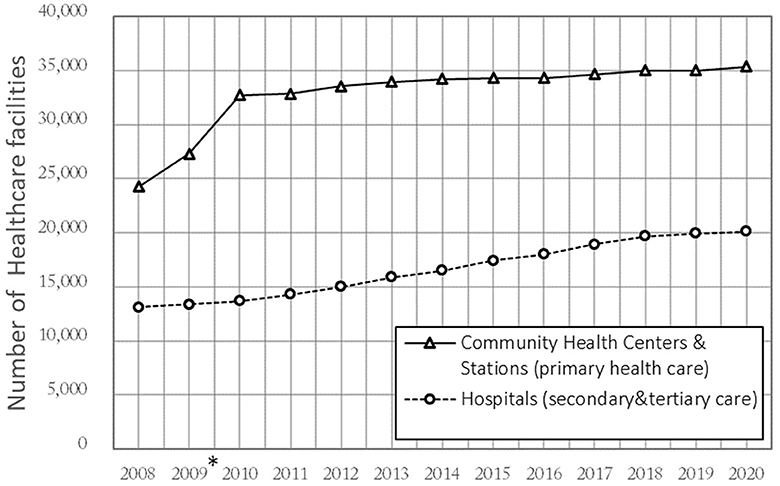
Figure 1. Number of healthcare facilities in China 2008–2020. *The Chinese government conducted a reform in 2009 that transferred “City-District-Street” 3-level to “City-Community” 2-level.
The planning of CHCs, as the key part of the Urban Healthcare Facilities Plan, is established together by the regional public health department and urban planning commission, and the purpose is to facilitate the equalization of PHC and enhance the coping ability of the major epidemic and public health security events (23, 24). Figure 2 illustrates the planning process of CHCs, which includes four steps. The first step is to define the CHCs' allocation following the supply–demand equilibrium. The supply–demand scale is determined by a quantitative target of local health needs and the population size of health service zoning, including primary care physicians (PCPs) and beds per 1,000 of the population. The second step is to select the candidate locations based on the traffic and land use. The catchment area is set to a time threshold that meets the range of neighborhood living circle to ensure residents can access CHCs within a walkable distance, i.e., 15 min in urban areas, 20 min in remote plains, and 30 min in mountain areas (25, 26). The third step is to design the construction or re-construction scheme of CHCs. In general, it cooperates with the new community development or the old community transformation. In the last step, to ensure the rationality and equity of the CHC planning process, the local government will revise the plan (every 5 years) to identify the primary healthcare shortage area (PHCSA) by examining the accessibility of CHCs.
FIGURE 2
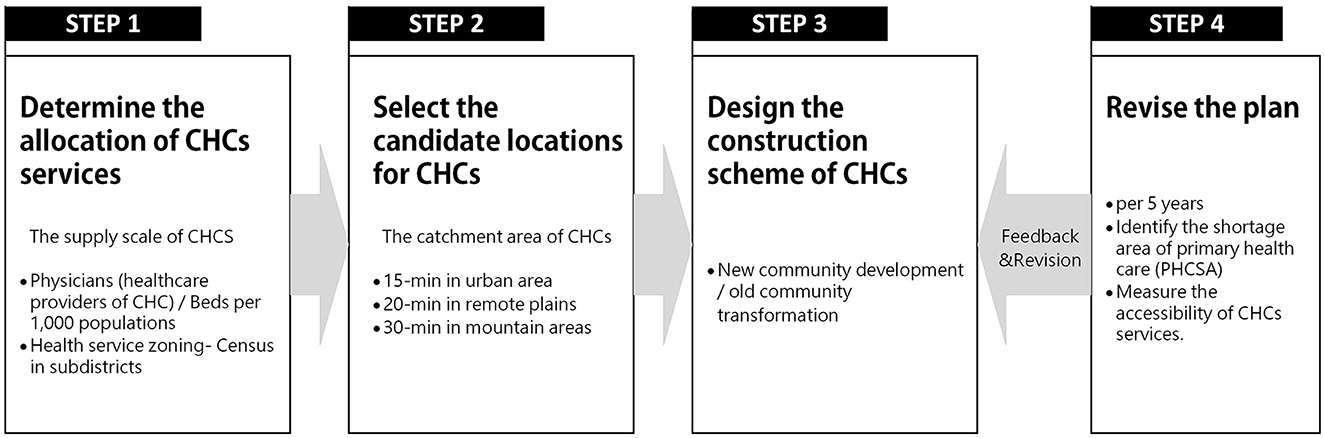
Figure 2. CHC planning process and standards.
Although the current planning plays a positive role in ensuring that residents can access adequate PHC services, it has still been doubted and criticized by people because a gap exists in the results between theoretical assessment and actual utilization (14), notably for older adults (25). A limitation of the current planning is that the planning assessment using subdistricts (administrative districts) as assessment units (AUs) remains a macro-scale scheme (urban or region area scale), and there has rarely been detailed data and empirical research at the micro-scale (community scale) to validate the results. Another important limitation is that the planning standards did not consider the demographic heterogeneity in service needs. Specifically, the 2-week visiting rate in older adults was ~2.5 times the average (8). Relative to younger adults, older adults are more dependent on the community settings (27, 28) due to poorer health status and limited mobility options (e.g., walking difficulties and driving restrictions) (29). Research by Liu et al. indicated that the acceptable distance for older adults in seeking PHC was 200–600 m, and 800 m is a walking limit, which is far lower than general capabilities (30). As a logical consequence, the current planning, which defined the catchment and population sizes of CHCs based on general walkable distance and indistinctive-age population, may cause the misestimation of PHC accessibility in the areas with a high aging rate.
Based on the above inference, we searched parallel literature and found that most studies that have explored the gap in healthcare between potential access (supply) and realized access (utilization) focus on a large scale (city, county, or village scale) (31–33). In China, the restricting factor could be linked to the uncompleted constructed database at the community level and undisclosed information of CHCs (private or public–private partnership). Fortunately, closed-off management of CHCs provided a good opportunity for investigation during the COVID-19 pandemic such that our research could narrow the scale of assessment to explore the gap in PHC access between planning assessment and actual utilization for older adults. Ultimately, the aim of this study was to improve the problems of current planning and re-define the PHCSA in an aging society. Based on the data from a CHC survey in Dalian and the geographic data of PCPs, the theoretical and practical accessibility for older adults from communities with different aging levels was measured, and we identified which communities have misestimated accessibility, specifically including two aspects as follows.
(1) Whether a gap exists between the theoretical accessibility in planning assessment and the practical accessibility in real-world utilization.
(2) Whether there is a gap in accessing CHC services between the communities with different aging levels.
2. Methodology
2.1. Study area
The empirical survey for this study was conducted in the city area of Dalian, located in the northeast peninsula of China (Figure 3). Dalian represents a unique geographic and societal setting for the research on access to PHC with the background of the aging population. Dalian has a population of more than 450,000 older adults. The aging rate of Dalian reached 24.7% in 2020 (34), which means that society has entered an advanced stage of aging. In addition, the city area of Dalian is composed of gentle slope hills and mountains such that residents mostly rely on walking for short-distance travel rather than using bicycles or electric vehicles. Thus, Dalian can serve as a typical study case to assess PHC based on a pedestrian neighborhood network, and it can also provide references for other cities in which society is at an early stage of aging. Following the planning scope of the Dalian Regional Healthcare Plan (2016–2020) (30), the study area for this study was five administrative districts (i.e., Zhongshan, Xigang, Shahekou, Ganjingzi, and Gaoxinyuan districts), including 1,359 communities and 95 CHCs (Figure 4).
FIGURE 3
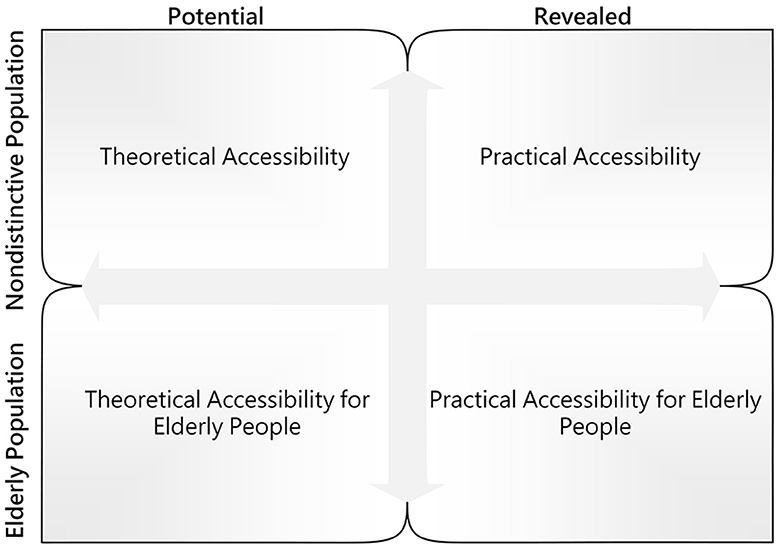
Figure 3. Comparison framework for accessibility.
FIGURE 4

Figure 4. Location, aging rate, and community health center distribution of the study area. *The distribution of older adults (aged over 60 years) is based on the 2021 population census.
2.2. Data and pre-processing
The data of this study were collected from the related official information and questionnaire surveys. Data from the statistical department of the Dalian Health Commission and Dalian Planning Board were highly conducive to this study. The spatial location and basic supply of CHCs presented in Figure 5 were based on Dalian Health Statistics in 2022. Moreover, the spatial distribution of the community older adults presented in Figure 6 was obtained and then determined based on the Seventh National Population Census taken in Dalian. Furthermore, the pedestrian network adopted to measure accessibility was developed based on a revised line file provided by the Dalian Municipal Transportation Bureau. Since the original government data comprised a motor vehicle network at the city scale, the data were supplemented with more detailed internal roads in the neighborhood environment based on the satellite imagery from Baidu Maps.
FIGURE 5
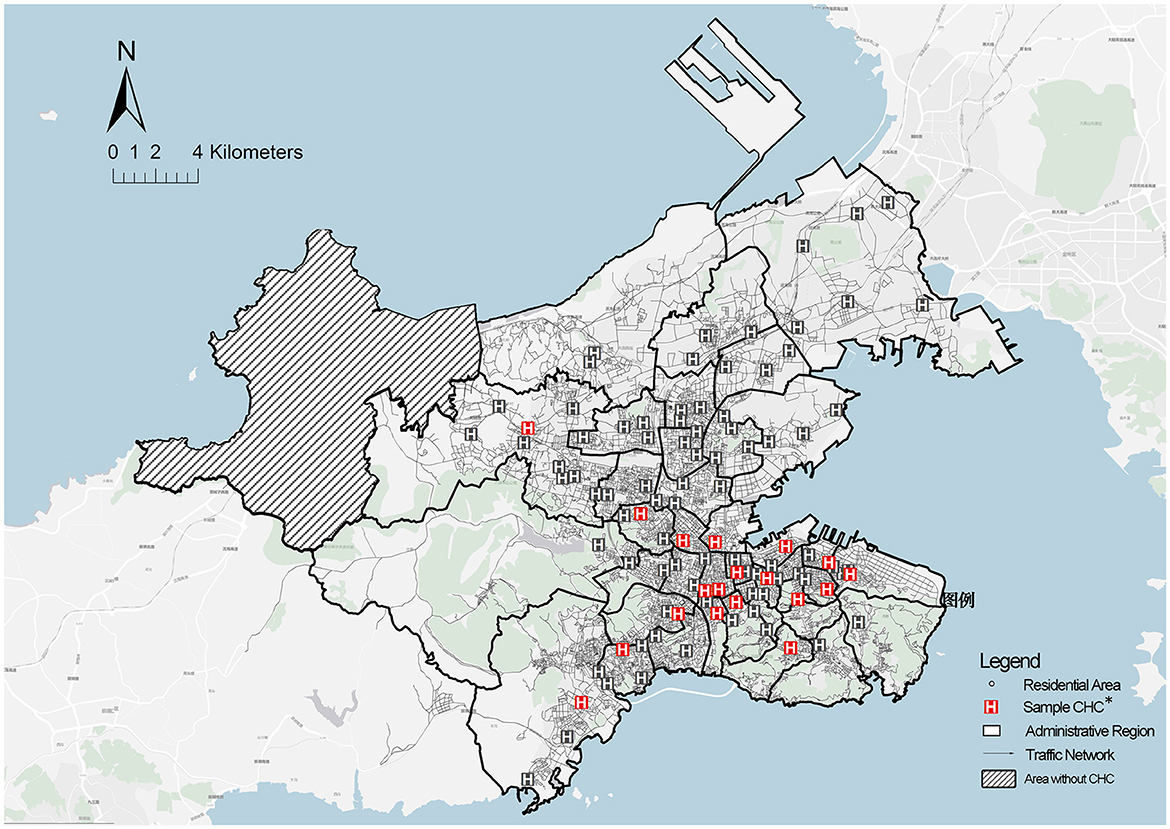
Figure 5. Spatial distribution of older adults at the community scale. *Community = 1,359. Data from the Seventh Population Census of Dalian.
FIGURE 6
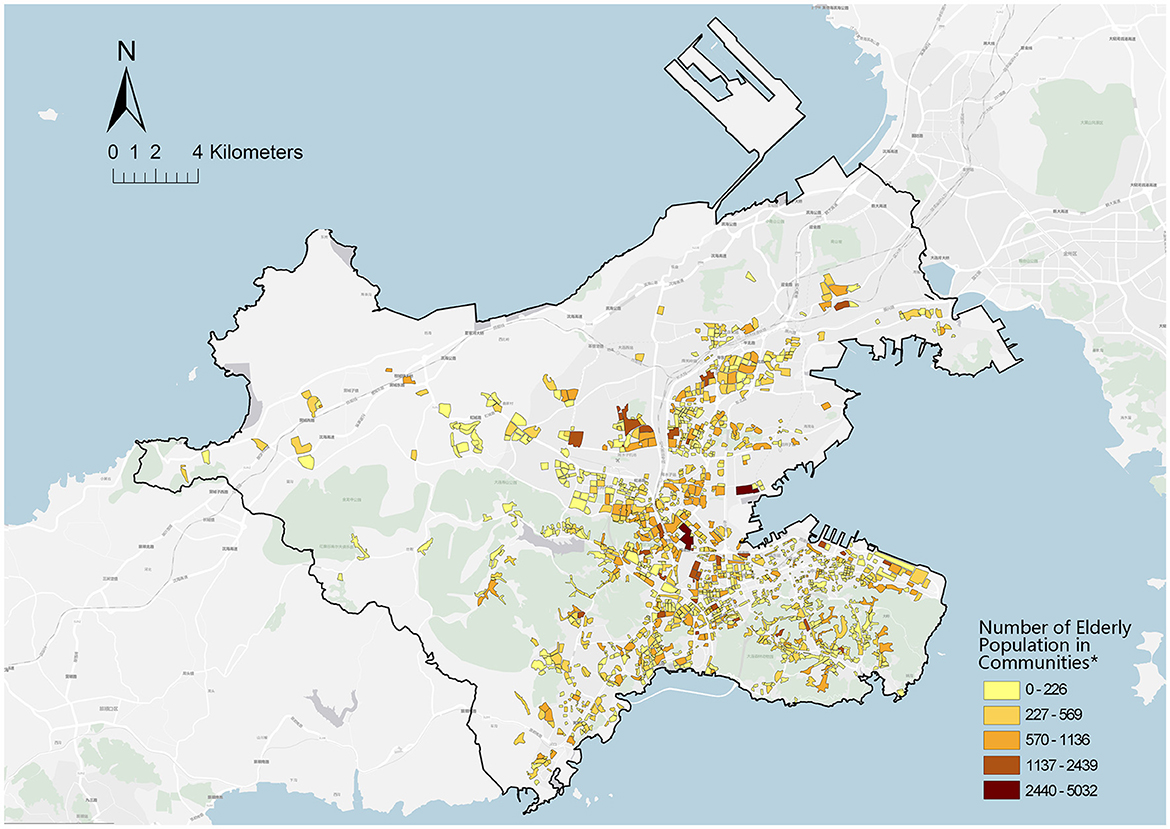
Figure 6. Spatial distribution of community health centers. *CHCs = 95 (including 22 CHSs); Sampled CHCs = 18; Data from Dalian Health Agency and Municipal Transportation Bureau.
The questionnaire was conducted from 18 to 20 April 2021 with the support of the administrators of public CHCs. We selected 18 CHCs that were allowed to survey based on the supply–demand ratio (Rj) for the older adults (High-Rj, Middle-Rj, and Low-Rj), including 938 older adults (aged over 60 years). During the COVID-19 epidemic period, all visitors to CHCs were asked to register their identifiable information (e.g., home address and personal identity). Accordingly, after asking respondents for permissions, we obtained their registered information and questionnaire results. All respondents were voluntary and were informed of the investigation objective. Their privacy is strictly protected.
Table 1 lists the descriptive statistics of respondents. The variables that represent the social characteristics of older adult patients are categorized into four dimensions, namely demographic characteristics, socioeconomic status, health condition, and service utilization. The first dimension reflects the aging level and composition. As Table 1 shows, the proportion of older men (46.38%) and women (53.62%) is relatively even. The old-old (aged 75–89, WHO) makes up about a fifth of the older adults, and the rest is the young-old (aged 60–74, WHO). The second dimension is the annual income of older adults, which has been proven to be an important socioeconomic constraint in health access (27). The third dimension is older adults' health conditions, including chronic diseases, long-term disease, and postoperative care, which indirectly reflects their pressing needs for PHC. For example, almost all have chronic diseases, more than half have long-term disease, and a third need postoperative care. Finally, the last dimension is the service utilization for older adults, including the visit frequency, travel time, and average access time. This directly reflects older adults' needs for CHC services; for example, 55.02% of older adults' access to CHC is beyond the preset time threshold of planning, and the old-old in poor health seldom visit CHC. To sum up, the results for the preliminary processing of survey data confirmed our suspicions that older adults have more difficulty accessing PHC in practice.
TABLE 1
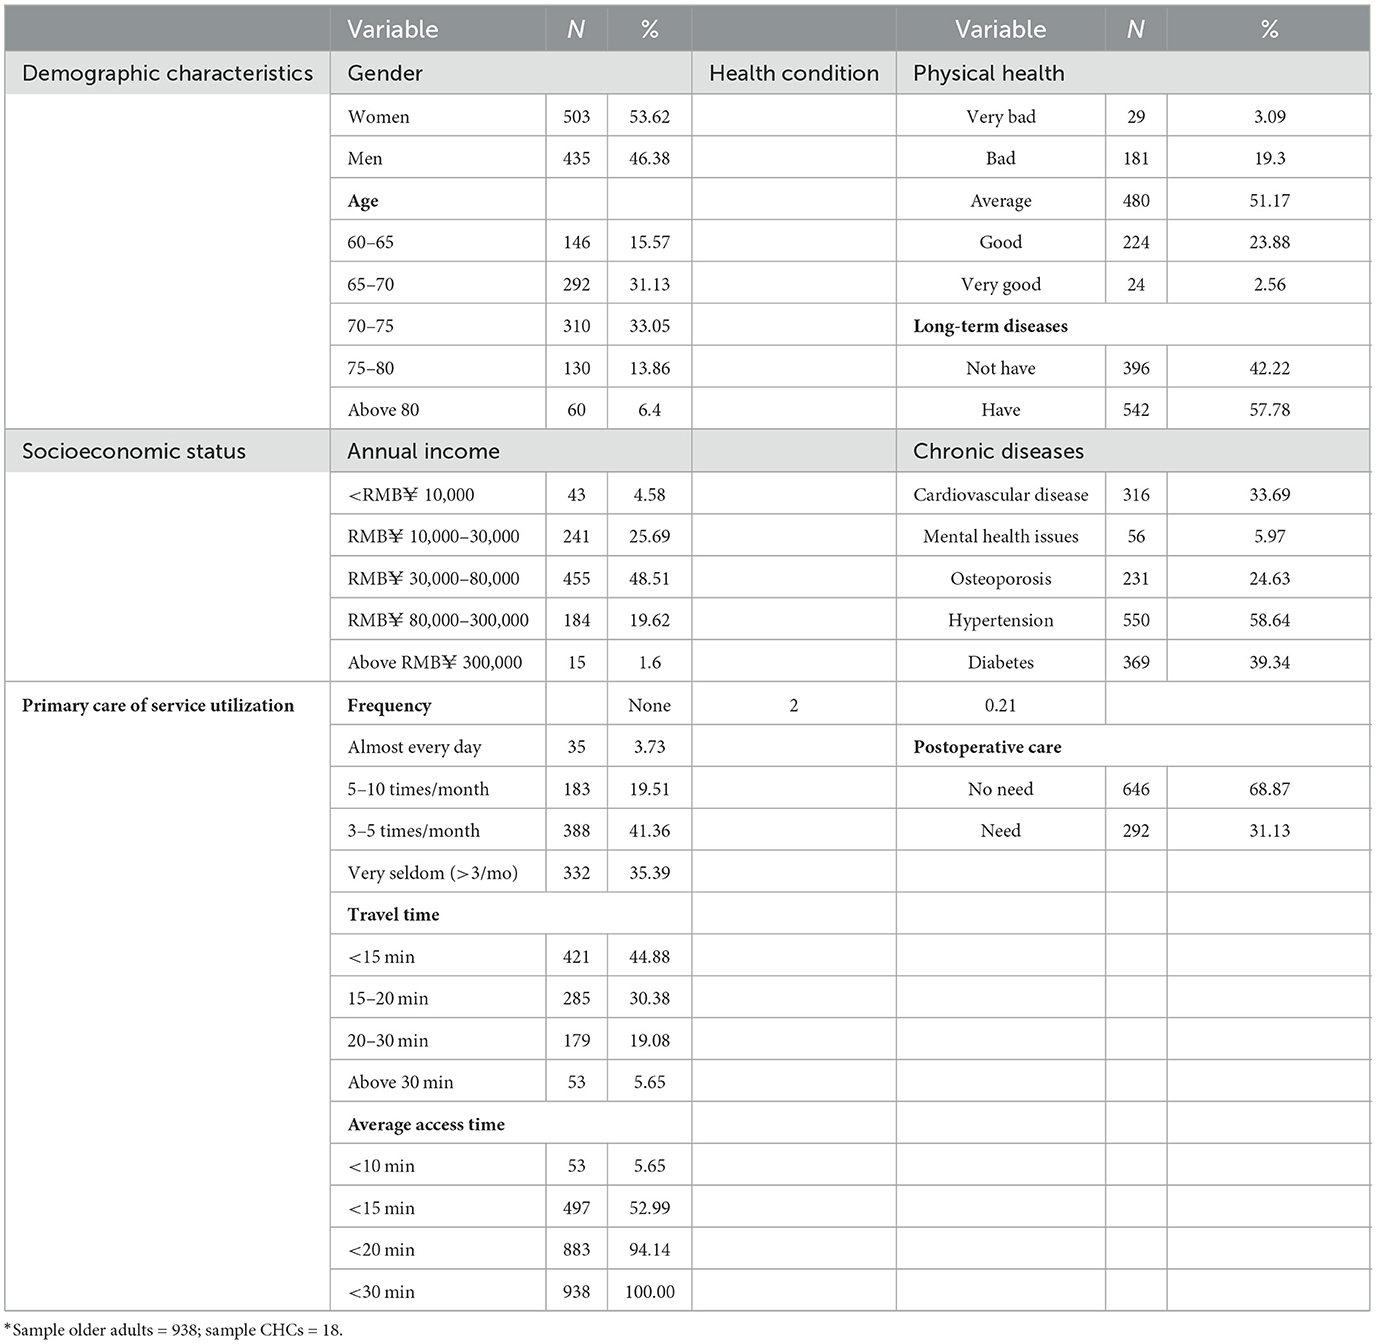
Table 1. Descriptive statistics of individual characteristics (N = 938).
2.3. Measurement for the accessibility of PHC
As GIS-based spatial measurement models developed more practically (14), accessibility becomes the main basis to quantitatively assess the spatial equity and allocation rationality of public healthcare resources in urban planning, which is an aggregative index considering geographic locations and the demand–supply equilibrium distribution (35, 36). For the associated measurement methods, the series of two-step floating catchment area (2SFCA) method (37), provided by Luo et al. following the Floating Catchment Area (FCA) method, has been most extensively employed (38). The accessibility in the 2SFCA method was defined as a ratio of population to providers in the predefined health service and the population catchments (39). Furthermore, given the multi-modal traffic (40) and the diversity demand from subpopulation (39, 41), the extension models of 2SFCA (e.g., E2SFCA, KD2SFCA, 3SFCA, and i2SFCA) (36, 42–45) further improved the demand-supply scales and interaction (46) to match the real-world applications.
For high-level health services, PHC has different supply and demand sizes in accessibility measurement. First, the population size was generally smaller than 30 km, which was originally proposed by Luo et al. (47, 48) [e.g., 3 km catchment for general practitioners (GPs) in Canada (49), 4 km catchment for GPs in New Zealand (50), and population grid cell at 250 × 250 resolution in Finland (51)]. Given the population attribute, Lan et al. modeled a requirement difference among the population in ages by introducing a demand weight index (39). Second, the catchment area was calculated according to pedestrian and public transport networks instead of motor traffic networks (52). Yu et al. demonstrated the differences in healthcare accessibility measured based on the pedestrian network and motor traffic network in Shenzhen China, and they used the Delaunay triangulation skeleton model to simulate the intra-community street network that provided positive reference to our study (53). Related to the age-appropriate studies, the travel mode of older adults was considered in defining the pharmacy catchment, such as a 10-min walk or 15 min by mixed transport (54). Moreover, older adults' travel behavior was more widely considered in calculating the probability of subjective choice (39). Moreover, the reference of most significance for our study was from Di et al., where they established an indicator system to assess the spatial equity of community care services for older adults. To be specific, the accessibility of older adults was divided to three dimensions, including potential accessibility, realized accessibility, and sustainable accessibility (55).
Following the accessibility concepts proposed by Khan et al. (56) and the analytical framework for older adults accessing community care from Di et al. (55), the accessibility in this study was expressed as two dimensions and then compared horizontally and vertically. Figure 3 presents the comparison framework for accessibility. A modified Gaussian 2SFCA method was employed for accessibility measurement. Compared with other distance decay functions, the Gaussian function declined at a slower rate close to the origin, such that it was adopted to express the impedance factor for a short-distance journey. Furthermore, a comparison model was developed to determine the matching probability between theoretical accessibility and practical accessibility for older adults. The specific calculation steps are elucidated as follows:
Step 1: Defining the demand variance index. In this study, we set this index based on the prevalence rate of NCD patients for different ages rather than the common weight value (3–5) in existing research (57). First, the proportion of older adult patients (Dk) is calculated by the following equation:
where Dall denotes the total patients of NCD; Dold is older adults, and Vold is the average NCD prevalence rate of older adults aged over 60 years. The population demand Pk is revised as follows:
where Pkall denotes the population of location k; Pkold is older adults of location k; and DW is the demand weight index and set to 1.94 following function (1).
Step 2: Computing the supply–demand ratio Rj, which is the ratio of service supply to all demand in the catchment area.
where Sj denotes the service supply capacity of CHC j (j = 1,…,95); Pk represents the total population demand of community k (k = 1,…, n) in the catchment area j; tkj expresses the travel time between j and k; t0 represents the time threshold specified by the standard (23, 30, 58); and F(tjk) (tjk ≤ t0, t0 = 30min) is the impedance function in a walkable distance.
where tij represents the potential access time from community i to CHC j, which is computed by the average pace of adults in general (90m/min) and older adults (58m/min) (54), and the initial impedance with no decay is set to 15 min following the planning standard (23, 25).
Step 3: Computing the accessibility for community i (i=1,...,1359) accessing CHC services in the catchment area .
where tij denotes the access time from Community i (i=1,...,1359) to CHC j (j=1,...,95).
Step 4: Using the comparison model to calculate the matching probability, which estimated the matches between potential access time and perceived travel time.
where Et denotes the matching probability between theoretical accessibility and practical accessibility; tr represents the travel time of older adults, including four time segments (i.e., 0–15, 16–20, 21–30, and above 30); ti expresses the potential access time, which is the average value of communities in the catchment area; fj denotes the sampled older adults of the respective CHC, which is derived from 2% of older adults in the catchment area; ftr represents statistics matching ti, suggesting that the time segment is not consistent with access time as the two-dimensional judgment function.
where ftr denotes a binary variable; ftr = 1 represents two variables that are matching each other; and ftr = 0 if they do not.
3. Results
3.1. Comparison of two theoretical accessibility
To prove that the current planning assessment using a non-distinct population age may cause a gap in accessibility measurement, the results of two theoretical accessibilities that were measured based on all populations and the older adults population were first compared, respectively. Figure 7 presents the spatial distribution of two theoretical accessibility at a community scale. The accessibility score fell into five grades (None, Low, Middle, High, and Very High) by using a natural break method (59). Furthermore, the rank of accessibility score from high to low is displayed as colors from cool to warm (red to green). The red blocks represent the communities in the PHCSA, i.e., residents' access to CHC services in the time threshold of planning standards.
FIGURE 7
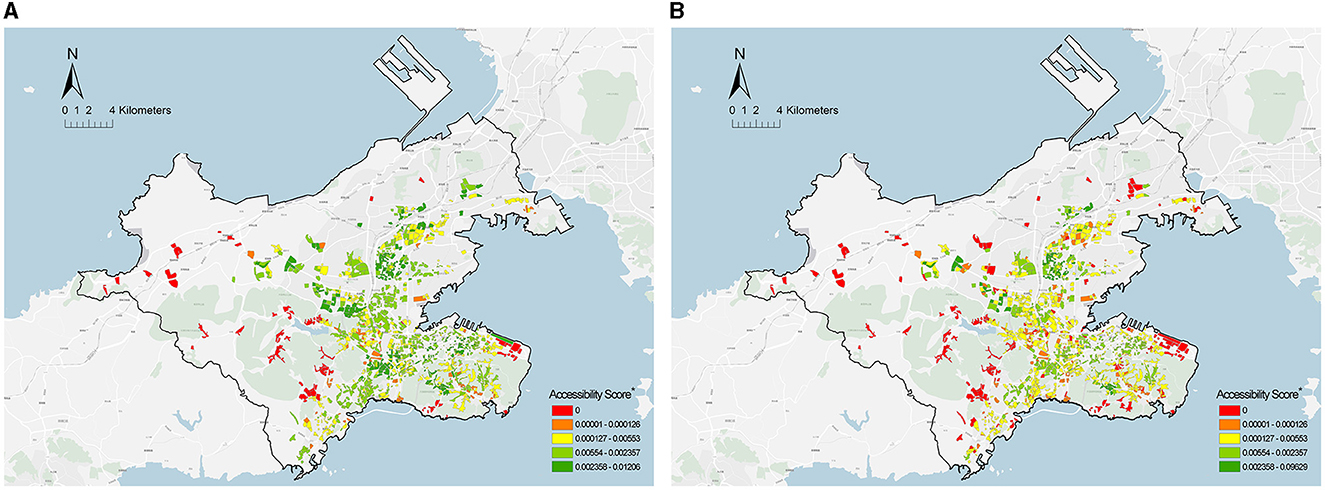
Figure 7. Spatial distribution of theoretical accessibility of PHC at a community scale. (A) All populations. (B) Older adult population. *Community health center = 95; Community = 1,359.
The potential access time for all populations was <15 min, whereas it was nearly 23 min for the older adults population, far beyond the time threshold of the planning standard. In addition, the comparison of communities suggested that the proportion of communities with good accessibility (High level and Very High level) for the older adults population declined by 26% (61.7%−35.2%) relative to all populations, and the proportion of communities in the PHCSA increased by 6.8% (7.5%−14.3%). Notably, most communities with lower accessibility scores were distributed in the fringe areas surrounded by mountains, such that a poor pedestrian neighborhood environment was generally created (e.g., more ramps and long paths). Lastly, the degree of difference between the two theoretical accessibility was investigated. Both theoretical accessibilities displayed non-normal distributions, which were dependent on the result of the Shapiro–Wilk test. Thus, the degree of difference was obtained by paired samples of the Wilcoxon test. As depicted in Table 2, there was a significant gap between the two theoretical accessibilities (p < 0.001), and Cohen's d value indicated a moderate degree of difference (60).
TABLE 2
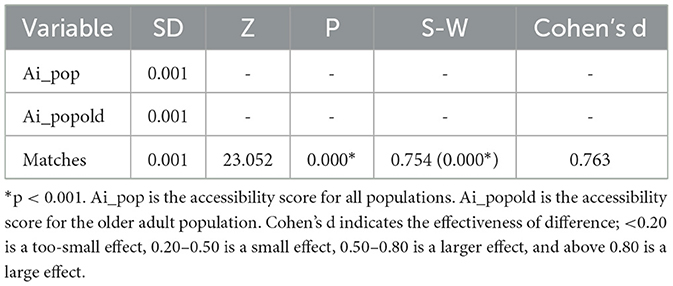
Table 2. Results of the paired samples of the Wilcoxon test.
3.2. Comparison of practical and theoretical accessibility
Based on the survey data of CHC services, we further compared the theoretical and practical accessibility for older adults. Table 3 shows the statistical results of the matching probability (Et) for older adults in the survey. The average matching probability (Et) was 76.6%, meaning that approximately a quarter of older adults experience a misestimated accessibility for PHC. In the association analysis between Et and the variables from the planning standards, we found six variables associated with matching probability (p < 0.01), namely actual travel time, potential access time, visit frequency, long-term diseases, chronic diseases, and postoperative care. The result was discussed in the following four aspects: (1) demographic characteristics (age and gender) have no associations with Et (p > 0.05); (2) economic status (physical health) has a positive association with Et (p < 0.05), which shows the number of matches in the lowest income group is significantly less than in other groups; (3) health conditions (chronic diseases and postoperative care) were negatively associated with Et (p < 0.001), and it is worth noting that the older adults who already suffer from mental health issues has the lowest Et (60%) among all chronic diseases; (4) service utilization (visit frequency, actual travel time, and potential access time) was significantly associated with Et (p < 0.001). The most interesting thing we found was that Et declined to 31% when older adults' actual travel time was beyond 20 min, whereas their potential access time showed good matching on the whole.
TABLE 3
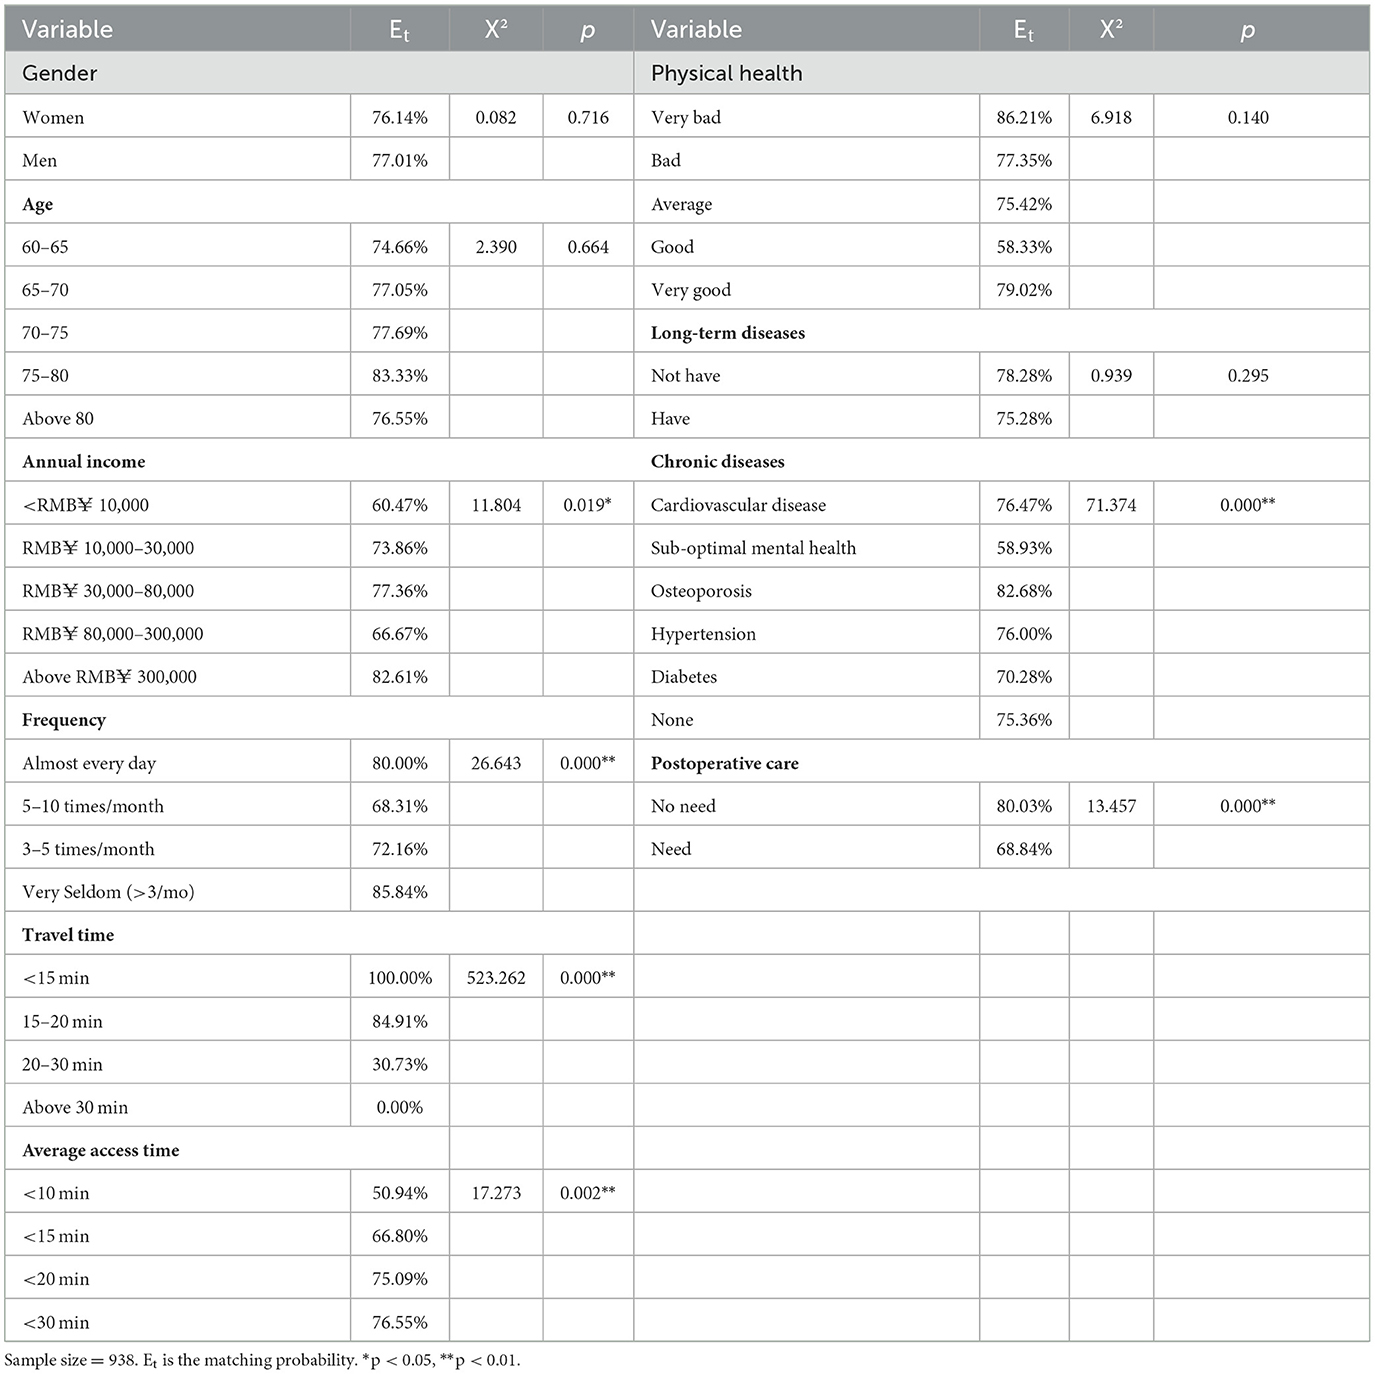
Table 3. Results of the matching probability (Et) in the survey.
Subsequently, we explored the endogenous association between the matching probability (Et) and six associative variables. Table 4 lists the results of the Pearson correlation analysis. As indicated by the result, Et was negatively correlated with the actual travel time for older adults, whereas it was positively correlated with their potential access time, suggesting that long travel times in actual utilization and the short-distance access in planning assessment can contribute to the mismatch between practical and theoretical accessibility. Moreover, we noted that the supply and demand ratio (Rj) negatively correlated with Et, but it was not correlated with the potential access time of older adults. This illustrated that there was a lack of links between the spatial distribution and service allocation of CHCs, which may also contribute to mismatching.
TABLE 4
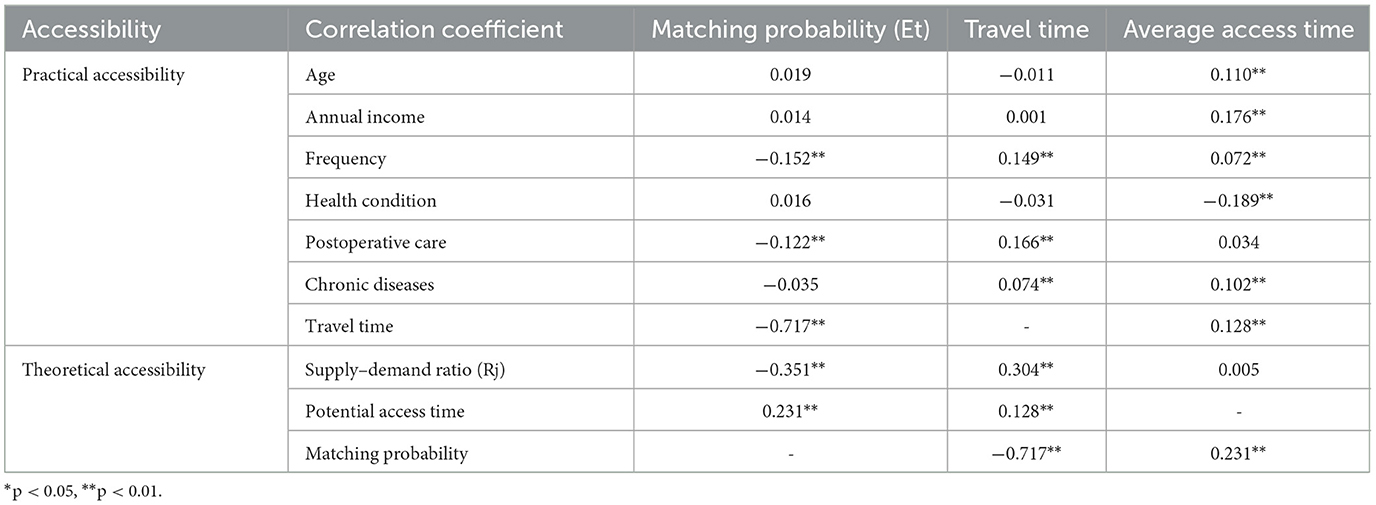
Table 4. Pearson's correlation analysis of two accessibility and matching probability.
Another notable finding is that 95% of older adults with mismatched practical and theoretical accessibility selected a farther distance CHCs for PHC rather than the adjacent one. This suggests that the cross-catchment access to CHCs for older adults was probably a subjective factor of mismatched accessibility. To verify the speculation, the correlation between the proportion of cross-catchment visits (x) and the matching probability (y) was studied through a linear regression (Table 5). Linear correlation analysis indicated that they showed a significant negative correlation (b = −0.853, t = 12.617, p < 0.01) and passing F-test (F = 159.192, p = 0.000 < 0.05), and x can explain 90.4% variance of y.
TABLE 5
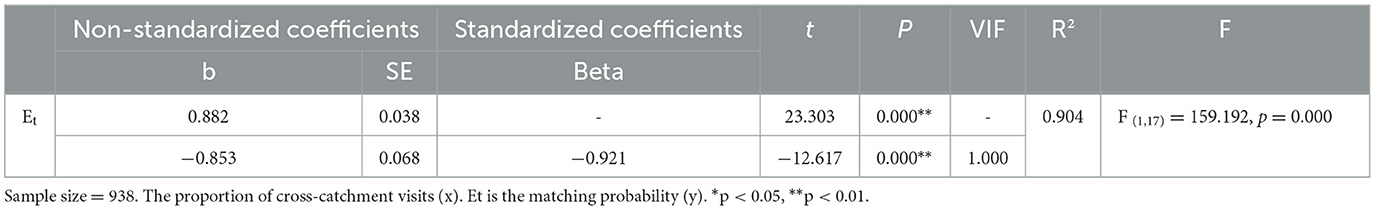
Table 5. Correlation analysis of the proportion of cross-catchment visits (x) and matching probability (y).
Figure 8 presents the spatial distribution of older adults with cross-catchment visits to CHCs, and the above-described communities are classified into two categories. The first category is communities with a high aging rate but scarce services, located on Dalian Airport Street, Dalian Square Island, China. Notably, the reason for the older adults cross-catchment to visit CHCs was to seek better medical services. The second category is communities with a high aging rate and overabundant services (primarily covering the residential areas in Chunliu Street, Malan Square, and Taoyuan Street). These areas were intensively developed in the 1990s such that the surrounding infrastructure was mostly old and creaky. Through follow-up phone calls to interview these older adults after the questionnaire, we found that they always did other activities on the way to CHCs (e.g., grocery shopping, fitness, and care massage), which led to the cross-catchment visits to CHCs.
FIGURE 8
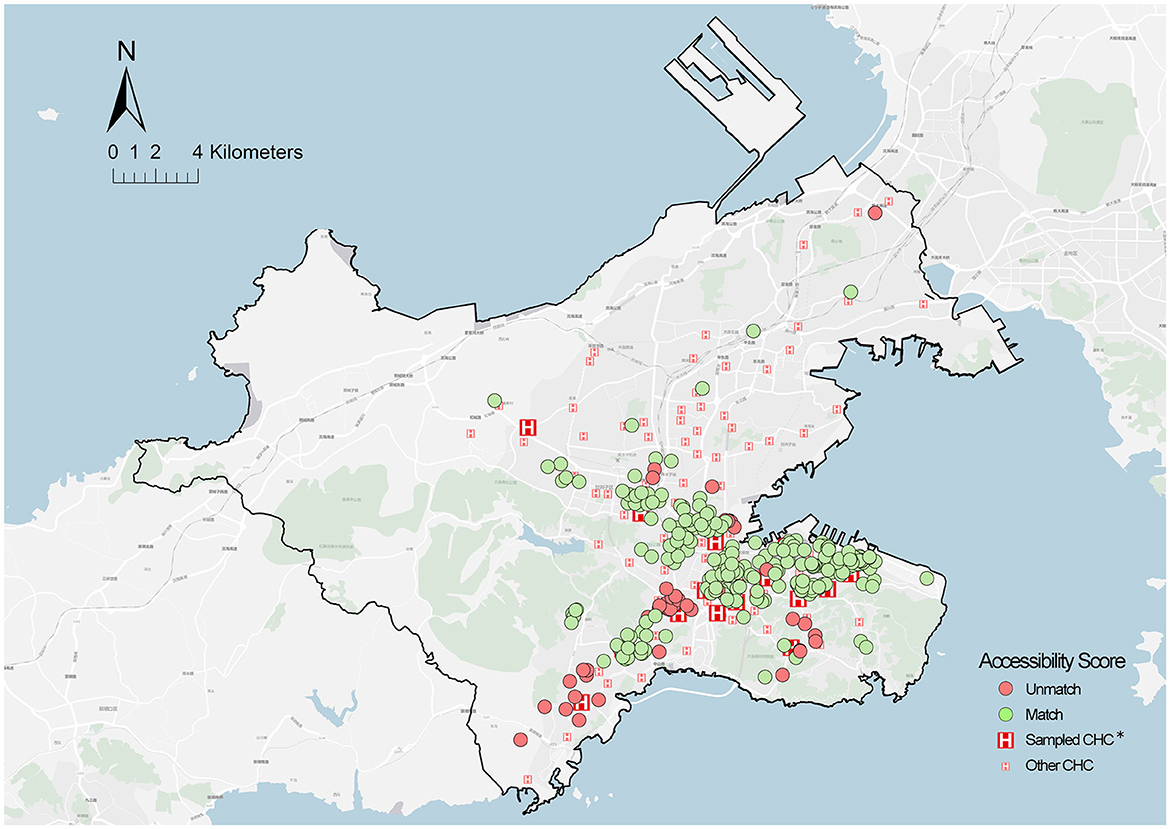
Figure 8. Spatial distribution of cross-catchment visit locations. *Sampled CHCS = 18; the community of sampled older adults = 579.
4. Discussion
4.1. Main findings
The above results show that both comparisons have a gap in accessibility measurement for PHC, where one is between the theoretical accessibility based on all populations and the older adult population, and the other is between the practical and theoretical accessibility for older adults. The former considered the heterogeneity of older adults in the supply–demand of PHC. The results found that 10.3% of communities were identified as PHCSA, distributed across Yingchengzi, Lingshui, Xishan Reservoir, Tiger Beach, Eastport, and Dalian Bay Districts. Specifically, these areas were distributed in the fringe areas or the residential areas around mountain ranges, where poor transportation is most likely worsening an already difficult situation for older adults. The latter is based on the analysis of the variables affecting the matching probability and their endogenous effects. The analysis indicated that the factors in the aspects of socioeconomic status, health conditions, and service utilization were correlated with the matching probability of older adults. Notably, the difference of aging development between regions widened the gap between theoretical assessment and actual utilization. In addition, an unexpected finding shows that the actual travel time and potential access time have an opposite correlation with the matching probability of older adults, suggesting that both the overserved and underserved PHC affected the older adults' matches between actual utilization and planning assessment. Thus, the main reasons of mismatched accessibility can be summarized as two points. One is the lack of connection between the spatial distribution of facilities and allocation of service supply, and the other is the subjective cross-catchment visit to CHCs for older adults.
4.2. Policy implications
Based on the above findings, some age-friendly implications for PHC planning were proposed to improve the current gaps of accessibility. On the one hand, flexible standards should be developed for planning assessments to accommodate the regional differences in the aging level. For the allocation of CHC services, given the proportion of older adults in different health service areas, the supply amountof CHCs (physicians and beds per 1,000 people) can be increased appropriately, and some special communities should be designated (e.g., a senior-friendly community and super-aged community). Furthermore, the supply scope standard for CHCs should adjust multiple catchments by considering poor mobility among older adults, which can be determined according to the pedestrian-friendly index in the catchment area. In addition to the supply amount and scope of CHCs, the spatial aggregation of CHCs with other facilities should add to the considerations in planning standards, for instance, building a 30-min transport network between CHCs and adjacent higher-level hospitals for healthcare service at the city scale, and a collaboration network between CHCs, older adults care facilities, and other living facilities for older adult care services on a community scale. On the other hand, planning should adopt reasonable PHC zoning by using finer assessment units, specifically re-clustering the population size instead of simply using census data. It is necessary to develop a comprehensive assessment framework for PHCSA considering aging level, traffic conditions, market capacity, existing facilities, and the results of Community Health Impact Assessment (CHIA). Moreover, rather than building new facilities, ensuring the dynamics and supply–demand equilibrium of service allocation are more efficient means to improve the gap in accessibility measurement. One of the communities in the PHCSA is the community of Yingcheng District, located in a sparsely populated and high-aging fringe area, which has limited access to shopping facilities and poor transportation, where there should be an increase in dynamic services (e.g., home care, specialist visits, and treatment online). Another is the community of Eastport District, where apartments were developed with a new central business district (CBD) and are mainly used by white-collars with good mobility; therefore, PHC should combine with other public services to build multi-functional public constructions.
4.3. Limitations and future work
Several limitations remain in this study. Since health statistics at the community scale are non-public data in China, the samples in this study originated from older adults who were patients of CHCs, and the questionnaire did not survey older adults who were not seeking CHC services. Moreover, the actual travel time of the older adults was a self-reported subjective value, regardless of the individual differences in physical fitness and perceptive ability. Thus, more interactive tools and GPS should be adopted to measure the travel behavior of older adults in practice, and more multi-dimensional surveys should be conducted in a pedestrian environment in future research. In the aspect of analyzing factors for matching, subsequent studies should further consider environmental factors that have been confirmed to affect the accessibility for older adults (e.g., taking into account slopes and intersections).
5. Conclusion
Although China has been vigorously building community-oriented primary healthcare systems in recent years, spatial inequities have existed or even been ignored due to the lack of integrated, systematic, and age-appropriate planning frameworks. In the past, researchers have attempted to improve models of accessibility measures or to establish fuzzy evaluation frameworks to provide a basis for decision-making under uncertainty[62, 63]. However, few have strived to find the causes for the discrepancy between theoretical findings and practical measurements. This study demonstrated and analyzed the accessibility gap between theoretical assessment and actual utilization in PHC access for older adults and described the problem of ignoring the heterogeneity of older adults in the current planning assessment for CHCs. The proposed method has important advantages over the accessibility measures available in the literature: (i) a precise scale, (ii) combined survey experiences with planning standards, (iii) supply–demand allocation based on a population model instead of population size, and (iv) supporting sustainable planning.
Data availability statement
The original contributions presented in the study are included in the article, further inquiries can be directed to the corresponding author.
Author contributions
JB and WL: conceptualization, validation, and supervision. JB: methodology, software, investigation, data curation, writing—original draft preparation, visualization, and resources. WL: writing—reviewing and editing. All authors have read and agreed to the published version of the manuscript.
Funding
This study was funded by the National Natural Science Foundation of China, grant number 51808094 and supported by the Fundamental Research Funds for the Central Universities, grant number DUT20RC(3)051.
Acknowledgments
The authors are grateful for the comments provided by reviewers and the editor, which were of great value in improving the final version of the manuscript. The authors thank the editing services of EditX.
Conflict of interest
The authors declare that the research was conducted in the absence of any commercial or financial relationships that could be construed as a potential conflict of interest.
Publisher's note
All claims expressed in this article are solely those of the authors and do not necessarily represent those of their affiliated organizations, or those of the publisher, the editors and the reviewers. Any product that may be evaluated in this article, or claim that may be made by its manufacturer, is not guaranteed or endorsed by the publisher.
References
1. Fang EF, Xie C, Schenkel JA, Wu C, Long C, Cui H, et al. A research agenda for ageing in China in the 21st century (2nd edition): Focusing on basic and translational research, long-term care, policy and social networks. Ageing Res Rev. (2020) 64:101174. doi: 10.1016/j.arr.2020.101174
2. National Bureau of Statistics. 7th National Population Census Bulletin (No. 5), 2021, Office of the Seventh National Census. (2021). Available online at: https://www.gov.cn/xinwen/2021-05/11/content_5605787.htm (accessed May 10, 2021).
5. Mo, LAWY. Quantitative Study of Coordination Between Population Aging and Economic Development in China From 1980 to 2050. Springer Singapore: Singapore. (2020). p. 3–19.
6. Fang EF, Scheibye-Knudsen M, Jahn HJ, Li J, Ling L, Guo H, et al. A research agenda for aging in China in the 21st century. Ageing Res Rev. (2015) 24:197–205. doi: 10.1016/j.arr.2015.08.003
7. Zhou MG, Wang HD, Zeng XY, Yin P, Zhu J, Chen WQ, et al. Mortality, morbidity, and risk factors in China and its provinces, 1990-2017: a systematic analysis for the Global Burden of Disease Study (2017). Lancet. (2019) 394:1145–58. doi: 10.1016/S0140-6736(19)30427-1
8. Institute of Gerontology CMU. China Longitudinal Aging Social Survey. Beijing: China Survey and Data Center of Chinese University. (2016).
9. Yao S-S, Cao G-Y, Han L, Chen Z-S, Huang Z-T, Gong P, et al. Prevalence and patterns of multimorbidity in a nationally representative sample of older chinese: results from the china health and retirement longitudinal study. J Gerontol Series A-Biol Sci Med Sci. (2020) 75:1974–80. doi: 10.1093/gerona/glz185
10. Chen Y, Klein SL, Garibaldi BT, Li H, Wu C, Osevala NM, et al. Aging in COVID-19: vulnerability, immunity and intervention. Ageing Res Rev. (2021) 65:101205. doi: 10.1016/j.arr.2020.101205
11. Sepúlveda-Loyola W, Rodríguez-Sánchez I, Pérez-Rodríguez P, Ganz F, Torralba R, Oliveira DV, et al. Impact of social isolation due to COVID-19 on health in older people: mental and physical effects and recommendations. J Nutr Health Aging. (2020) 24:938–47. doi: 10.1007/s12603-020-1500-7
12. Guida C, Carpentieri G. Quality of life in the urban environment and primary health services for the elderly during the Covid-19 pandemic: an application to the city of Milan (Italy). Cities. (2021) 110, 103038. doi: 10.1016/j.cities.2020.103038
13. Yin C, He Q, Liu Y, Chen W, Gao Y. Inequality of public health and its role in spatial accessibility to medical facilities in China. Appl Geog. (2018) 92:50–62. doi: 10.1016/j.apgeog.2018.01.011
14. Guida C, Carpentieri G, Masoumi H. Measuring spatial accessibility to urban services for older adults: an application to healthcare facilities in Milan. Eur Transport Res Rev. (2022) 14:23. doi: 10.1186/s12544-022-00544-3
15. Word Health Organization. Declaration of Alma-Ata. Alma-Ata: World Health Organization Regional Office for Europe (1978).
16. Assembly WH. International Conference on Primary Health Care, Alma-Ata: Twenty-Fifth Anniversary. World Health Organization: Geneva, Switzerland. (2003).
17. Heaney D, Black C, O'donnell CA, Stark C, van Teijlingen E. Community hospitals – the place of local service provision in a modernising NHS: an integrative thematic literature review. BMC Public Health. (2006) 6:309. doi: 10.1186/1471-2458-6-309
18. Hu R, Liao Y, Du Z, Hao Y, Liang H, Shi L. Types of health care facilities and the quality of primary care: a study of characteristics and experiences of Chinese patients in Guangdong Province, China. BMC Health Serv Res. (2016) 16:335. doi: 10.1186/s12913-016-1604-2
19. Bhattacharyya O, Delu Y, Wong ST, Bowen C. Evolution of primary care in China 1997-2009. Health Policy, (2011) 100:174–80. doi: 10.1016/j.healthpol.2010.11.005
20. Li X, Krumholz HM, Yip W, Cheng KK, De Maeseneer J, Meng Q, et al. Quality of primary health care in China: challenges and recommendations. Lancet. (2020) 395:1802–12. doi: 10.1016/S0140-6736(20)30122-7
21. Wang HHX, Wang JJ, Wong SYS, Wong MCS, Mercer SW, Griffiths SM. The development of urban community health centres for strengthening primary care in China: a systematic literature review. Br Med Bull. (2015) 116:139–53. doi: 10.1093/bmb/ldv043
22. Zhang X, Chen L-W, Mueller K, Yu Q, Liu J, Lin G. Tracking the effectiveness of health care reform in China: A case study of community health centers in a district of Beijing. Health Policy. (2011) 100:181–8. doi: 10.1016/j.healthpol.2010.10.003
23. Commission BMH. Beijing Municipal Standards for the Planning and Construction of Community Health Service Institutions. Beijing: Commission BMH. (2022).
24. Jia P, Wang YF, Yang M, Wang LM, Yang XC, Shi XY, et al. Inequalities of spatial primary healthcare accessibility in China. Social Sci Med. (2022) 314:115458. doi: 10.1016/j.socscimed.2022.115458
25. Huang X, Gong P, White M. Study on spatial distribution equilibrium of elderly care facilities in downtown Shanghai. Int J Environ Res Public Health. (2022) 19:7929. doi: 10.3390/ijerph19137929
26. Zhang J, Han P, Sun Y, Zhao J, Yang L. Assessing Spatial Accessibility to Primary Health Care Services in Beijing, China. Int J Environ Res Public Health. (2021) 18:13182. doi: 10.3390/ijerph182413182
27. Ryvicker M, Gallo WT, Fahs MC. Environmental factors associated with primary care access among urban older adults. Soc Sci Med. (2012) 75:914–21. doi: 10.1016/j.socscimed.2012.04.029
28. Bissonnette L, Wilson K, Bell S, Shah TI. Neighbourhoods and potential access to health care: The role of spatial and aspatial factors. Health Place. (2012) 18:841–53. doi: 10.1016/j.healthplace.2012.03.007
29. Cheng L, Yang M, Vos J, Witlox F. Examining geographical accessibility to multi-tier hospital care services for the elderly: a focus on spatial equity. J Transp Health. (2020) 19:100926. doi: 10.1016/j.jth.2020.100926
30. Whitehead J, Pearson AL, Lawrenson R, Atatoa-Carr P. How can the spatial equity of health services be defined and measured? A systematic review of spatial equity definitions and methods. J Health Servi Res Policy. (2019) 24:270–8. doi: 10.1177/1355819619837292
31. Deborah OML, Chiu MYL, Cao K. Geographical accessibility of community health assist scheme general practitioners for the elderly population in singapore: a case study on the elderly living in housing development board flats. Int J Environm Res Public Health. (2018).15:9. doi: 10.3390/ijerph15091988
32. Luan J, Tian Y, Jim CY, Liu X, Yan M, Wu L. Assessing spatial accessibility of community hospitals for the elderly in Beijing, China. Int J Environ Res Public Health. (2023) 20:890. doi: 10.3390/ijerph20010890
33. Dalian Municipal Bureau of Statistics. Dalian Seventh National Population Census Bulletin 2021. Dalian: Dalian Municipal Bureau of Statistics (2021). p. 124.
34. Dalian Health Commission. Dalian Regional Health Plan (2016 to 2020). Dalian: General Office of Dalian Municipal Government (2016).
35. Taleai M, Sliuzas R, Flacke J. An integrated framework to evaluate the equity of urban public facilities using spatial multi-criteria analysis. Cities. (2014) 40:56–69. doi: 10.1016/j.cities.2014.04.006
36. Wan N, Zou B, Sternberg T. A three-step floating catchment area method for analyzing spatial access to health services. Int J Geogr Inf Sci. (2012) 26:1073–89. doi: 10.1080/13658816.2011.624987
37. Luo W, Wang FH. Measures of spatial accessibility to health care in a GIS environment: synthesis and a case study in the Chicago region. Environ Plann B Plann Des. (2003) 30:865–84. doi: 10.1068/b29120
38. Chen X, Jia PF. A comparative analysis of accessibility measures by the two-step floating catchment area (2SFCA) method. Int J Geogr Inf Sci. (2019) 33:1739–58. doi: 10.1080/13658816.2019.1591415
39. Mao L, Nekorchuk D. Measuring spatial accessibility to healthcare for populations with multiple transportation modes. Health Place. (2013) 24:115–22. doi: 10.1016/j.healthplace.2013.08.008
40. Zhang F, Li D, Ahrentzen S, Zhang J. Assessing spatial disparities of accessibility to community-based service resources for Chinese older adults based on travel behavior: a city-wide study of Nanjing, China. Habitat Int. (2019) 88:101984. doi: 10.1016/j.habitatint.2019.05.003
41. Luo W, Qi Y. An enhanced two-step floating catchment area (E2SFCA) method for measuring spatial accessibility to primary care physicians. Health Place. (2009) 15:1100–7. doi: 10.1016/j.healthplace.2009.06.002
42. Delamater PL. Spatial accessibility in suboptimally configured health care systems: A modified two-step floating catchment area (M2SFCA) metric. Health Place. (2013) 24:30–43. doi: 10.1016/j.healthplace.2013.07.012
43. Zheng Z, Shen W, Li Y, Qin Y, Wang L. Spatial equity of park green space using KD2SFCA and web map API: a case study of zhengzhou, China. Appl Geog. (2020) 123:102310. doi: 10.1016/j.apgeog.2020.102310
44. Li Z, Fan Z, Song Y, Chai Z. Assessing equity in park accessibility using a travel behavior-based G2SFCA method in Nanjing, China. J Transp Geog. (2021) 96:103179. doi: 10.1016/j.jtrangeo.2021.103179
45. McGrail MR, Humphreys JS. Measuring spatial accessibility to primary health care services: Utilising dynamic catchment sizes. Appl Geograp. (2014) 54:182–8. doi: 10.1016/j.apgeog.2014.08.005
46. Luo W, Whippo T. Variable catchment sizes for the two-step floating catchment area (2SFCA) method. Health Place. (2012) 18:789–95. doi: 10.1016/j.healthplace.2012.04.002
47. McGrail MR. Spatial accessibility of primary health care utilising the two step floating catchment area method: an assessment of recent improvements. Int J Health Geogr. (2012). 11:50. doi: 10.1186/1476-072X-11-50
48. Shah TI, Bell S, Wilson K. Spatial accessibility to health care services: Identifying under-serviced neighbourhoods in Canadian urban areas. PLoS ONE. (2016) 11:12. doi: 10.1371/journal.pone.0168208
49. Whitehead J, Pearson AL, Lawrenson R, Carr PA. Defining general practitioner and population catchments for spatial equity studies using patient enrolment data in Waikato, New Zealand. Appl Geog. (2020) 115:102137. doi: 10.1016/j.apgeog.2019.102137
50. Kotavaara O, Nivala A, Lankila T, Huotari T, Delmelle E, Antikainen H. Geographical accessibility to primary health care in Finland – Grid-based multimodal assessment. Appl Geog. (2021) 136:102583. doi: 10.1016/j.apgeog.2021.102583
51. Ma L, Luo N, Wan T, Hu C, Peng M. An improved healthcare accessibility measure considering the temporal dimension and population demand of different ages. Int J Environ Res Public Health. (2018) 15:2421. doi: 10.3390/ijerph15112421
52. Yu W, Ai T, Li J, Yang M, Shual Y. Potential change of spatial accessibility to health services with the opening of private streets in Shenzhen, China. IEEE Access. (2018) 6:72824–35. doi: 10.1109/ACCESS.2018.2881654
53. Padeiro M. Geographical accessibility to community pharmacies by the elderly in metropolitan Lisbon. Res Social Administrative Pharm. (2018) 14:653–62. doi: 10.1016/j.sapharm.2017.07.014
54. Di X, Wang L, Dai X, Yang L. Assessing the accessibility of home-based healthcare services for the elderly: a case from Shaanxi province, China. Int J Environ Res Public Health. (2020) 17:7168. doi: 10.3390/ijerph17197168
55. Khan AA. An integrated approach to measuring potential spatial access to health-care services. Socioecon Plann Sci. (1992) 26:275–87. doi: 10.1016/0038-0121(92)90004-O
56. Standing Committee of Dalian Municipal People's Congress. Regulations on Planning and Construction of Medical and Health Facilities in Dalian, Standing Committee of Dalian Municipal People's Congress, Standing Committee of Dalian Municipal People's Congress. (2016).
57. Zhang T, Xu Y, Ren J, Sun L, Liu C. Inequality in the distribution of health resources and health services in China: hospitals versus primary care institutions. Int J Environ Res Public Health. (2017) 16:42. doi: 10.1186/s12939-017-0543-9
58. Yang N, Shen L, Shu T, Liao S, Peng Y, Wang J. An integrative method for analyzing spatial accessibility in the hierarchical diagnosis and treatment system in China. Social Sci Med. (2021) 270:113656. doi: 10.1016/j.socscimed.2020.113656
Keywords: healthy aging, community-oriented, primary health care, accessibility, planning assessment
Citation: Bai J and Lu W (2023) A comparative study for accessing primary healthcare between planning assessment and actual utilization for older adults: a case from Dalian City, China. Front. Public Health 11:1207098. doi: 10.3389/fpubh.2023.1207098
Received: 17 April 2023; Accepted: 02 August 2023;
Published: 07 September 2023.
Edited by:
Liliana Giraldo Rodríguez, Instituto Nacional de Geriatría, MexicoReviewed by:
Caroline Barakat, Ontario Tech University, CanadaQi Jing, Weifang Medical University, China
Copyright © 2023 Bai and Lu. This is an open-access article distributed under the terms of the Creative Commons Attribution License (CC BY). The use, distribution or reproduction in other forums is permitted, provided the original author(s) and the copyright owner(s) are credited and that the original publication in this journal is cited, in accordance with accepted academic practice. No use, distribution or reproduction is permitted which does not comply with these terms.
*Correspondence: Wei Lu, luweieds@dlut.edu.cn