 Peng Wang†
 Shunfei Yu†
 Hua ZouXiaoming Lou
 Hong RenLei ZhouZhongjun Lai
 Zhiqiang Xuan
 Xiangjing Gao
 Qiuliang XuZhen ZhouYaoxian Zhao
 Yiyao Cao*
- Institute of Occupational Health and Radiation Protection, Zhejiang Provincial Center for Disease Control and Prevention, Hangzhou, China
Objectives: Radioactivity monitoring around nuclear facilities is crucial to provide important baseline data for effective detection of radioactive leakage to the environment. We aim to establish a baseline study for monitoring radioactive levels of 90Sr and 137Cs around Sammen Nuclear Power Plant (SNPP) and to assess their associated health impact on surrounding residents.
Methods: In this study, we collected water and food samples around the SNPP from 2011 to 2020 and determined for 90Sr and 137Cs activity concentrations. We statistically analyzed the temporal trends of 90Sr and 137Cs and evaluated their radiation exposure to the local residents.
Results: During this period, the activity concentrations of 90Sr and 137Cs varied within 1.2–9.9 mBq/L and 0.10–7.6 mBq/L in water, and 0.037–1.3 Bq/kg and 0.011–0.45 Bq/kg in food, respectively, with no significant seasonal variation trend.
Conclusions: All reported activity concentrations of 90Sr and 137Cs were significantly lower than the recommended value of WHO and Chinese national standards. There is no indication of notable radioactive release into the study area due to the operation of SNPP during 2018–2020. The annual effective doses (AEDs) from the ingestion of 90Sr and 137Cs in water and food were well below the international permissible limits, indicating the radiation exposure around SNPP during 2011–2020 was kept at a safe level.
1. Introduction
Over the past few decades, the contribution of nuclear energy to the overall energy resources has increased rapidly worldwide. 90Sr and 137Cs are two recognized important fission products released from nuclear facility operations and nuclear accidents (1–3). These two radionuclides have relatively long physical half-lives (90Sr, t½ = 28.8 y and 137Cs, t½ = 30.2 y), and once released into the environment, they can be retained for a long time. In addition, 90Sr and 137Cs have high radiotoxicity, which can be enriched in bones and muscle tissues after entering organisms (4, 5). Therefore, 137Cs and 90Sr are highly essential artificial radionuclides to be taken into account in radiation risk assessment for the public and the environment (6–10). The digestion and assimilation of water and food is an important route for 90Sr and 137Cs to enter the human body. Therefore, systematic and continuous monitoring of 90Sr and 137Cs concentrations in water and food is crucial to ensure the radiation safety of the public, which is also a common practice globally for environmental radioactivity monitoring and radiological risk assessment around nuclear facilities (11–13).
Sanmen Nuclear Power Plant (SNPP) is one of the achievements of China's vigorous development of nuclear power, which uses the world's most advanced third-generation pressurized water reactor technology. SNPP covers a total area of 7.4 million square meters, with installation of six of 1.25 million kilowatt nuclear power units (AP1000). It began construction in 2009 and was commenced for operation in 2018. However, very few studies have reported the radioactivity levels nearby SNPP (14, 15), and no baseline data exist for the fission products such as 137Cs and 90Sr in water and food in the surrounding area. In this work, we report for the first time long-term monitoring results of 90Sr and 137Cs in water and food samples collected around SNPP form 2011 to 2020. The levels, temporal variations, and sources of 90Sr and 137Cs in the study area were studied, and the annual effective doses to the local public were estimated based on our monitoring data.
2. Materials and methods
2.1. The study region and sample collection
SNPP is located in Sanmen County, Taizhou City, Zhejiang Province, China, which is 171 km to the north of Hangzhou City, 83 km to the east of Ningbo City, 51 km to the west of Taizhou City, and 150 km to the south of Wenzhou City. During 2011–2020, all samples were collected within 30 km of the SNPP.
Sampling sites of surface water, factory water and tap water were selected in the distance of 5–10, 10–20, 20–30 km from SNPP based on the water source distribution and water supply characteristics of Sanmen County. The reservoir located 10.2 km away from SNPP is one of the main water sources for local residents, which was set as surface water sampling site. Sanmen County has a complete water supply system, and the tap water comes from the municipal water supply company. Factory water sampling site was set at the water plant 6.0 km away from SNPP, and tap water sampling site was set at the Sanmen County Center for Disease Control and Prevention, which is 22.7 km away from SNPP. In order to reflect the time trend and seasonal changes, water samples were collected in the wet season (May) and dry season (October) in each year.
According to the dietary habits of local residents, four typical types of food were selected in this work: rice, cabbage, crucian carp and mullet, which were collected in the harvest season every year. The sampling information of water and food samples in this work are summarized in Figure 1 and Table 1.
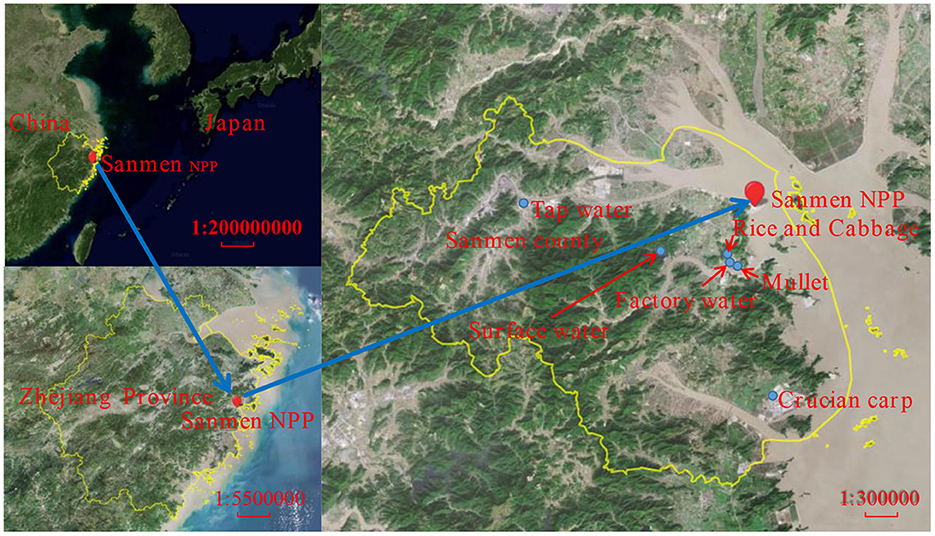
Figure 1. Sampling sites for water and food around SNPP in this study. The map was produced using software MapInfo Professional using data from https://bajiu.cn/ditu/.
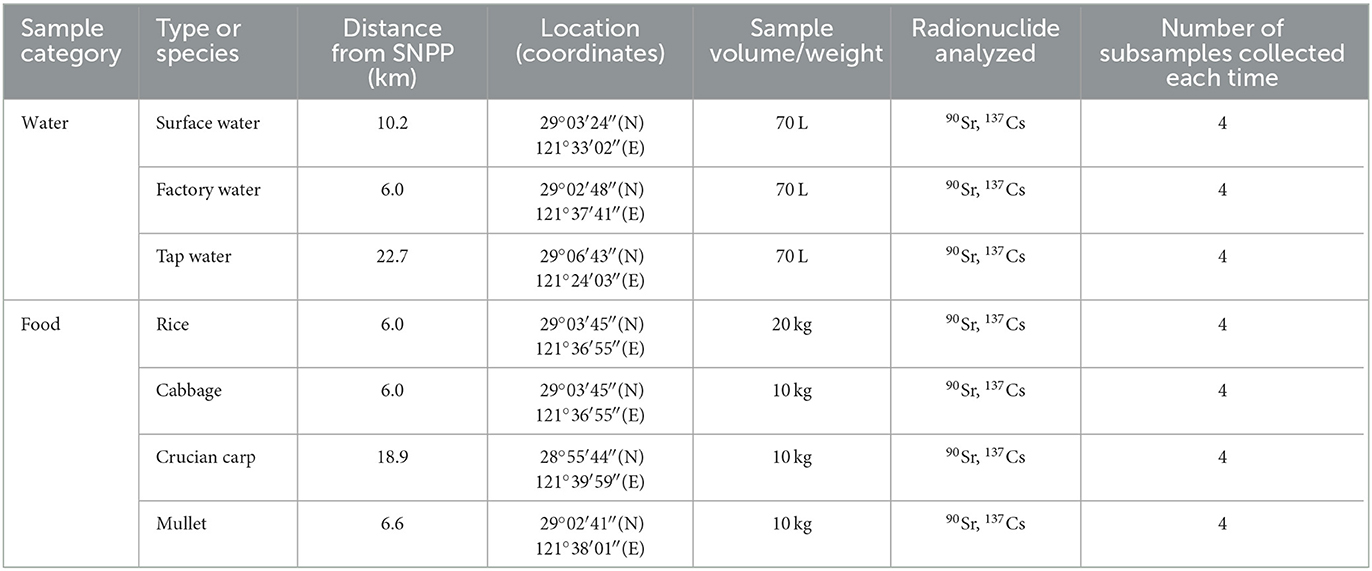
Table 1. Water and food samples collected around SNPP in this study.
The prevailing wind direction of SNPP region was north and north-northwest (16). In this work, all sampling sites were located in the south or southwest of SNPP (except for tap water sampling site, located in the west of SNPP), which were located in the leeward direction of the prevailing wind direction. In addition, tap water was transported through pipelines, the influence of wind direction was considered negligible. Therefore, we believe the sampling sites in this work were representative.
2.2. Reagents and materials
Anhydrous ethanol (CH3CH2OH) (Analytical grade, Anhui Antell Food Co., LTD.), acetic acid (CH3COOH) (Analytical grade, Tianjin Damao Chemical Reagent factory), sodium hydroxide (NaOH), hydrochloric acid (HCl), sodium sulfide (Na2S), nitric acid (HNO3), ammonium phosphomolybdate [(NH4)3PMo12O40], hydrogen peroxide (H2O2) (Analytical grade, Sinopharm Chemical Reagent Co., LTD.), ammonia (NH3·H2O) [Analytical grade, Aladdin Reagent (Shanghai) Co., LTD], 2- (2-ethylhexyl) phosphoric acid (Analytical grade, 60~80 mesh, Beijing Research Institute of chemical Engineering Metallurgy). 90Sr-90Y standard solution (9.78 Bq/g of 90Sr in 0.1 mol/L nitric acid) and 137Cs standard solution (1.47 Bq/g of 137Cs in 0.1 mol/L nitric acid) were purchased from National Institute of Metrology, China. 90Sr-90Y reference source was purchased from Beijing Research Institute of Chemical Engineering Metallurgy, with source intensity (surface particle number/2π·min) of 1.20 × 10³.
2.3. Sample preparation and analysis
After cleaning (washing the sample with water), each fresh food sample was weighted and loaded into a microwave furnace for drying, carbonization and ashing under programmed gradient heating conditions (17). The detailed microwave heating conditions for different types of samples are shown in Table 2. The schematic radioanalytical procedures used in this work for 90Sr and 137Cs determination are demonstrated in Figures 2, 3, respectively.
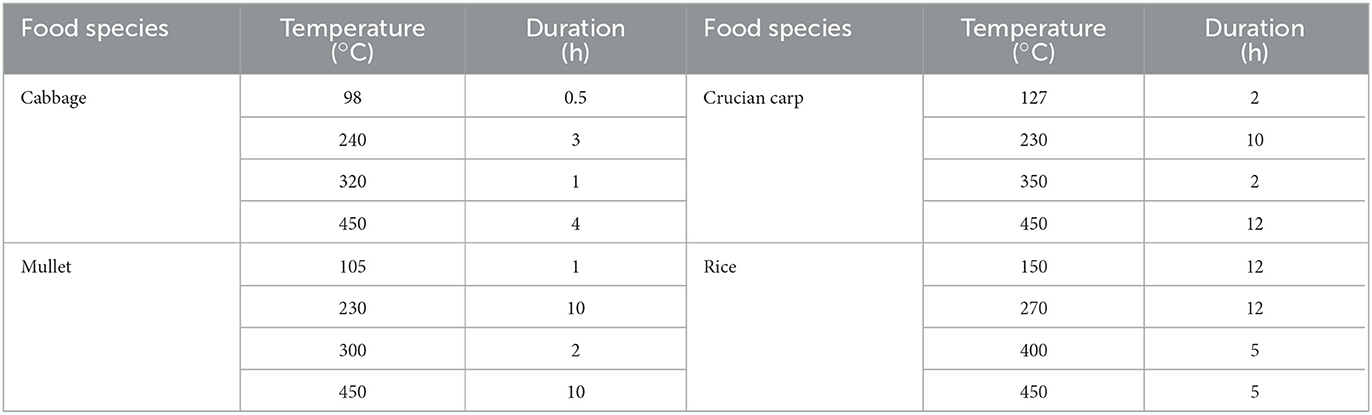
Table 2. Programmed heating conditions of microwave-ashing furnace for food sample pre-treatment in this study.
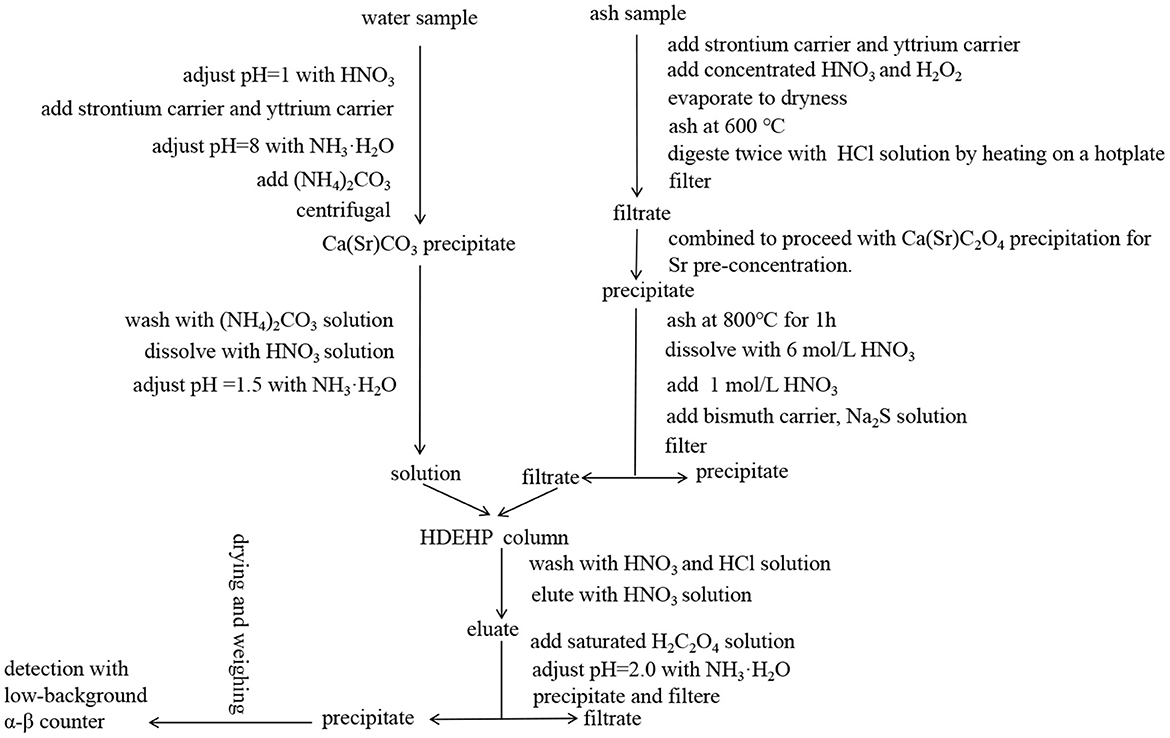
Figure 2. Radioanalytical procedure used in this work for 90Sr determination in water and food samples.
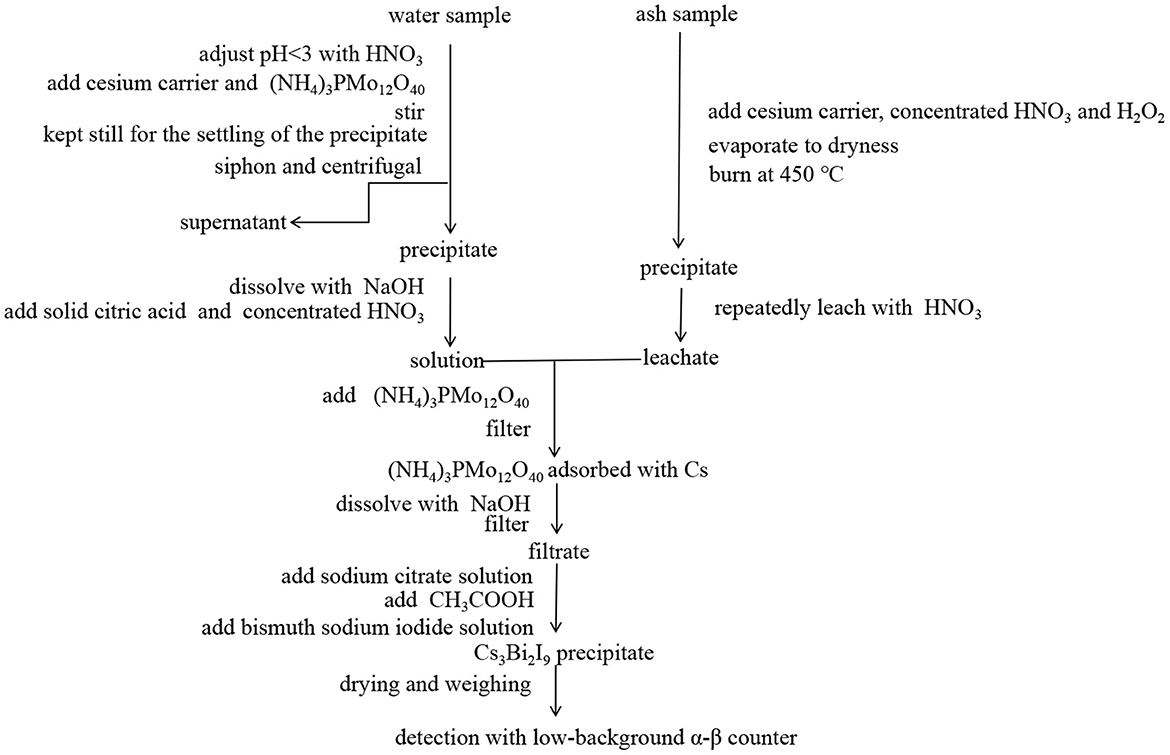
Figure 3. Radioanalytical procedure used in this work for 137Cs determination in water and food samples.
To analyze 90Sr concentrations in water, 30 L of water sample was taken and adjusted to pH = 1.0 with HNO3. After adding 2.0 mL of 50 mg/mL strontium carrier and 1.0 mL of 20 mg/mL yttrium carrier, the pH was adjusted to 8.0 with addition of NH3·H2O. 240 g of (NH4)2CO3 were added to form Ca(Sr)CO3 precipitate, which was separated by centrifugation (twice at 4000 r/min for 5 min). The precipitate was washed with 1% (NH4)2CO3 solution and dissolved in 6 mol/L of HNO3. After adjusting the pH to 1.5 with NH3·H2O, the solution was loaded onto a chromatographic column (1.0 cm inner diameter × 14 cm length) packed with di-(2-ethylhexyl) phosphate (HEDHP) at a flow rate of 2 ml/min. The column was sequentially washed with 10 ml of 1.5 mol/L HNO3, 30 ml of 1.0 mol/L HCl and 30 ml of 1.5 mol/L HNO3 at 2 ml/min. Yttrium (Y) was eluted with 30 ml of 6 mol/L HNO3 at 1 ml/min, the eluate was collected. The starting and ending times of the column separation were recorded for decay correction of 90Y. 5 mL of saturated H2C2O4 solution was added into the eluate. The sample solution was adjusted to pH = 2.0 with ammonia, and heated in a water bath at 80 °C for 30 min to precipitate Y as yttrium oxalate Y2(C2O4)3, then cooled to room temperature. Yttrium oxalate precipitate was filtered through filter paper and washed successively with 10 mL of 1% H2C2O4, 10 mL of water and 10 mL of CH3CH2OH, then dried at 45–50°C until the weight was constant. The chemical recovery of Y was calculated using the weight of obtained yttrium oxalate according to the molecular formula of Y2(C2O4)3·9H2O. The yttrium oxalate precipitate was detected by low-background α-β counter (BH1217II, China National Nuclear Corporation, China; LB790, Berthold Technologies, Germany), with each sample counted for 10 cycles and 100 min. for each cycle (18, 19).
To analyze 90Sr concentrations in food, 10g of ash sample was spiked with 2.0 mL of 50 mg/mL strontium carrier and 1.0 mL of 20 mg/mL yttrium carrier. After adding 10 mL of concentrated HNO3 and 6 mL of H2O2, the sample was evaporated to dryness and ashed at 600 °C until a complete decomposition of organic substance. The sample was digested twice with 40 mL of 2 mol/L HCl solution by heating on a hotplate. The leachate was filtered and combined to proceed with Ca(Sr)C2O4 precipitation for Sr pre-concentration. The precipitate was ashed in a muffle furnace at 800°C for 1h, dissolved with a few milliliter of 6 mol/L HNO3. 35 mL of 1 mol/L HNO3 was added to completely dissolve the precipitate. After the addition of 0.5 mL of bismuth carrier (20 mg/mL), 0.4 mL of 0.3mol/L Na2S solution was dropped to generate black Bi2S3 precipitate to removal of interfering ions such as 210Bi and rare earth elements. The solution was filtered with filter paper and the filtrate (about 60 mL) was collected for further chromatographic purification using HDEHP as described above (19, 20).
To analyze 137Cs concentrations in water, 30 L of water sample was adjusted to pH < 3.0 with HNO3. 1.0 mL of 20 mg/mL cesium carrier and 6 g of (NH4)3PMo12O40 were added to the sample, which was stirred by electric mixer, then kept still for the settling of the precipitate. The supernatant was discarded by siphon, and the remaining precipitate was centrifuged at 3500 r/min for 5 min to remove the liquid phase. The precipitate was dissolved in 60 mL of 2.0 mol/L NaOH, 10 g of solid citric acid and 10 ml of concentrated HNO3 were added. After adding 0.8 g of (NH4)3PMo12O40, the sample was filtrated to separate the (NH4)3PMo12O40 on which cesium was adsorbed. 10 mL of 2.0 mol/L NaOH were added to dissolve (NH4)3PMo12O40 and the solution was filtered again. 5 ml of sodium citrate solution (mass ratio 30%) was added, followed by addition of 2 ml of glacial CH3COOH and 2.5 ml of bismuth sodium iodide solution (mass ratio 42%). The sample was cooled in an ice water bath to finally precipitate cesium as Cs3Bi2I9. Cs3Bi2I9 precipitate was dried and weighed to obtain the chemical yield of Cs, and then detected by low-background α-β counter (BH1217II, China National Nuclear Corporation, China; LB790, Berthold Technologies, Germany). Each sample was counted for 10 cycles with 100 min. for each cycle (21, 22).
To analyze 137Cs concentrations in food, samples were stored for 1 month to allow 131I to decay completely. Each dried food sample was screened by gamma spectrometry to eliminate interferences to the 137Cs measurements from other short-lived radiocesium (i.e., 134Cs, 136Cs, and 138Cs). To 10 g of ash sample, 1.0 mL of 20 mg/mL cesium carrier, 10 mL of concentrated HNO3 and 3 mL of H2O2 were added. After evaporating to dryness, the sample was burned in a muffle furnace at 450°C, then repeatedly leached with 1.5 mol/L HNO3. 0.8 g of (NH4)3PMo12O40 were added to the leachate and the sample was thereafter processed following the same procedure as described above (22, 23).
The main factors affecting the uncertainty of the measurement results of 90Sr and 137Cs in water and food samples were the uncertainties of β radioactivity measurement (counting statistics), instrument detection efficiency, chemical yield and sample quality. The typical relatively uncertainties for 90Sr and 137Cs activity concentrations obtained in this work were at the level of 5–27%.
2.4. Dose assessment
In order to carry out dose assessment for residents around SNPP, Zhejiang Center for Disease Control and Prevention conducted a food consumption survey of residents in Taizhou, Zhejiang Province from 2015 to 2017. Three counties in Taizhou city, Zhejiang province were chosen for this survey, using multi-stage stratified proportional to population cluster random sampling method, i.e., each site from three villages and towns (streets), each street draw two villages (neighborhood committees), every village (neighborhood committees) extract 50 families, the permanent members of each selected family (resident for at least 6 months, resident aged 3 years and above) were identified as the respondents after signing an “informed consent”.
The recorded data of the consumption frequency and average consumption amount of rice, cabbage, crucian carp, mullet and related products were collected by face-to-face survey (using the method of 24 h retrospective for 3 consecutive days). The questionnaire was based on the recommendations from China National Center for Food Safety Risk Assessment. The dietary information of all respondents under the age of 18 was provided by their guardians. According to the survey results, the average consumption of four types of food in Taizhou city, Zhejiang Province was calculated for people of different ages (grouping criteria: 3–12 years old, 12–18 years old and more than 18 years old).
The annual effective dose (AED) due to the ingestion of 137Cs and 90Sr in food was estimated using the following equation:
Where, ISr or ICs is the annual intake of 90Sr or 137Cs (Bq/year) from food. e(g)Sr or e(g)Cs is the age-dependent dose conversion coefficient for ingestion of 90Sr or 137Cs. The corresponding e(g)Sr and e(g)Cs values used in this study were according to Chinese national standards (24), namely, 6.0 × 10⁻⁸ Sv/Bq and 1.0 × 10⁻⁸ Sv/Bq, 8.0 × 10⁻⁸ Sv/Bq and 1.3 × 10⁻⁸ Sv/Bq, 2.8 × 10⁻⁸ Sv/Bq and 1.3 × 10⁻⁸ Sv/Bq, for people with age of 3~12 years, 12~18 years and more than 18 years, respectively.
2.5. Statistical analysis
SPSS 25.0 software was used for statistical analysis, and Mann–Whitney U-test was used to compare the radioactive activity concentration levels of water. p < 0.05 was considered as statistically significant.
3. Results and discussion
3.1. Activity concentrations of 90Sr and 137Cs in waters
The time series of 90Sr and 137Cs activity concentrations in water samples collected around SNPP from 2011 to 2020 are shown in Figure 4. Statistical analysis indicated that, 90Sr and 137Cs activity concentrations in all types of water had no significant difference between the wet season and dry season in each year (p > 0.05). The monitoring results of 90Sr and 137Cs vary within ranges of (2.8 ± 0.2)–(9.9 ± 0.8) mBq/L and (0.19 ± 0.05)–(7.6 ± 0.4) mBq/L, (2.7 ± 0.3)–(8.6 ± 0.6) mBq/L and (0.30 ± 0.02)–(7.0 ± 0.3) mBq/L, (1.2 ± 0.2)–(8.3 ± 0.5) mBq/L and (0.10 ± 0.02)–(5.1 ± 0.2) mBq/L, for surface water, factory water and tap water, respectively. Compared to the concentration limits recommended by WHO (10 Bq/L for 90Sr and 10 Bq/L for 137Cs), the activity concentrations of 90Sr and 137Cs in water samples around SNPP from 2011 to 2020 were 3-4 orders of magnitude lower (25).
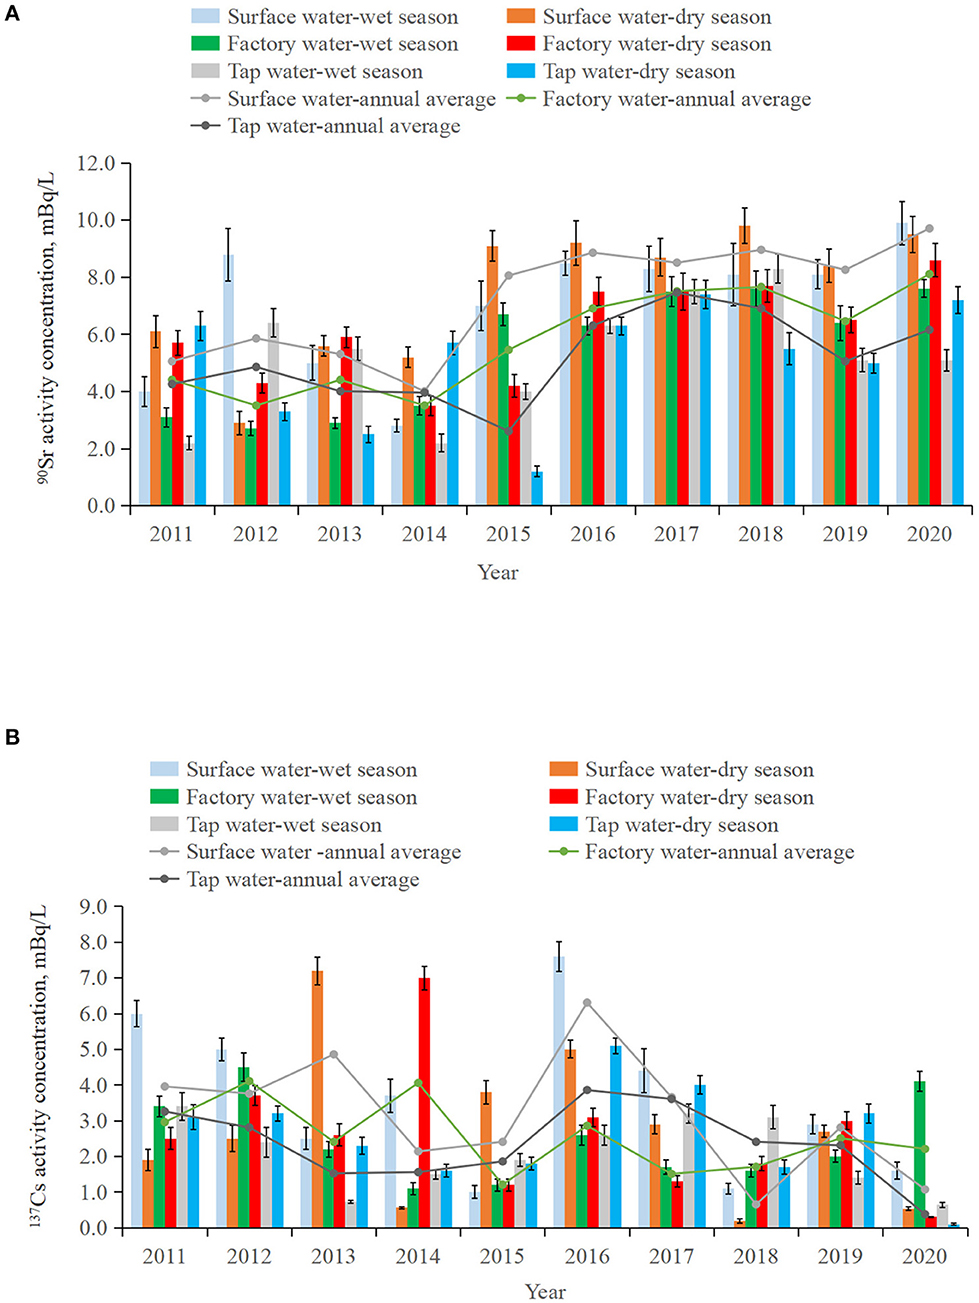
Figure 4. Variation of 90Sr (A) and 137Cs (B) activity concentrations in surface, factory and tap water collected around SNPP during wet and dry seasons in 2011–2020.
The annual mean activity concentrations of 90Sr in all three types of waters showed similar temporal changes, namely, notable increases are observed during 2016–2020 from relatively low and stable levels in 2011–2015 (Figure 4A). Different from 90Sr, activity concentrations of 137Cs in the three types of waters were more fluctuated during 2011–2020 (Figure 4B). For example, the difference between the maximum and minimum annual mean activity concentrations of 137Cs reached 3.4 times in factory water, and more than 9 times in tap water and surface water. In the case for 90Sr, the difference was <2.9 times. This might be related to the higher solubility and mobility of Sr in water, whereas Cs is more particle reactive in the natural environment (26). The highest 137Cs annual mean activity concentrations were seen in 2016 for both surface water and tap water.
Compared with tap water, the annual mean activity concentrations of 90Sr in surface water were generally higher (Figure 4A). Statistical analysis also confirmed this difference (p < 0.05). This phenomena was consistent with our previous findings (27), which should be related to additional water treatment processes (e.g. coagulation, filtration and precipitation) from surface water to tap water.
Table 3 showed the activity concentrations of 90Sr and 137Cs in waters from different regions of the world. The values of waters around SNPP were at background levels and at the same order of magnitude as radioactivity levels in different waters around the globe (11, 27–37).
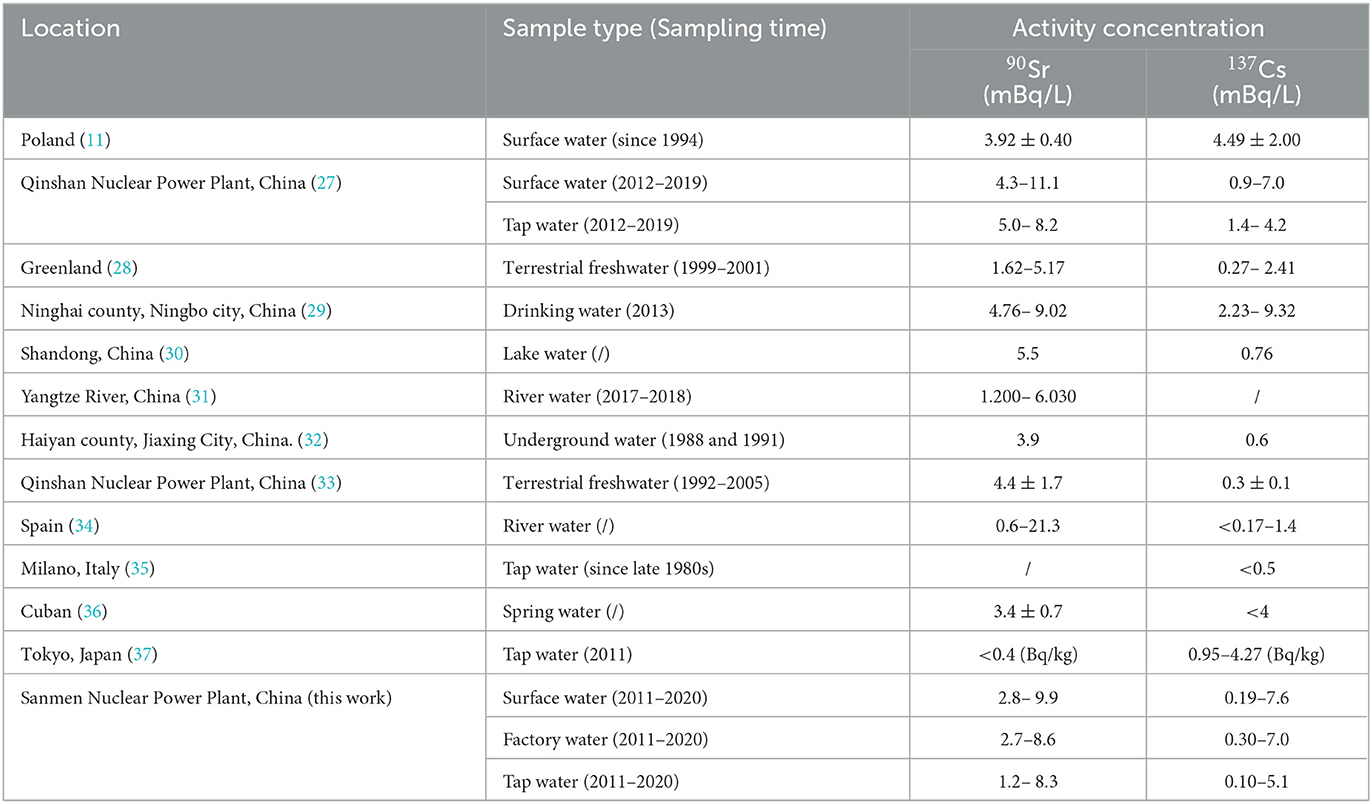
Table 3. Comparison of 90Sr and 137Cs activity concentrations in waters from different regions of the world.
3.2. Activity concentrations of 90Sr and 137Cs in foods
Figure 5 shows the activity concentrations of 90Sr and 137Cs in different types of food samples around SNPP from 2011 to 2020. The variations in activity concentrations of 90Sr and 137Cs in all four types of food showed no significant inter-annual trend. The activity concentrations of 90Sr and 137Cs in rice, cabbage, crucian carp and mullet were (0.037 ± 0.004)–(0.075 ± 0.004) Bq/kg fresh weight (f. w.) and (0.020 ± 0.003)–(0.081 ± 0.008) Bq/kg f. w., (0.065 ± 0.005) – (0.37 ± 0.02) Bq/kg f. w. and (0.011 ± 0.002)–(0.14 ± 0.01) Bq/kg f. w., (0.34 ± 0.04)–(1.3 ± 0.2) Bq/kg f. w. and (0.13 ± 0.02)–(0.45 ± 0.02) Bq/kg f. w., (0.21 ± 0.03)–(0.88 ± 0.08) Bq/kg f. w. and (0.14 ± 0.02)–(0.31± 0.04) Bq/kg f. w., respectively (Table 4). Comparing to the limits of 90Sr and 137Cs activity concentrations in grain (96 and 260 Bq/kg), vegetables (77 and 210 Bq/kg) and fish (290 and 800 Bq/kg) recommended by Chinese national standard (38), the activity concentrations of 90Sr and 137Cs in food samples around SNPP were significantly lower.
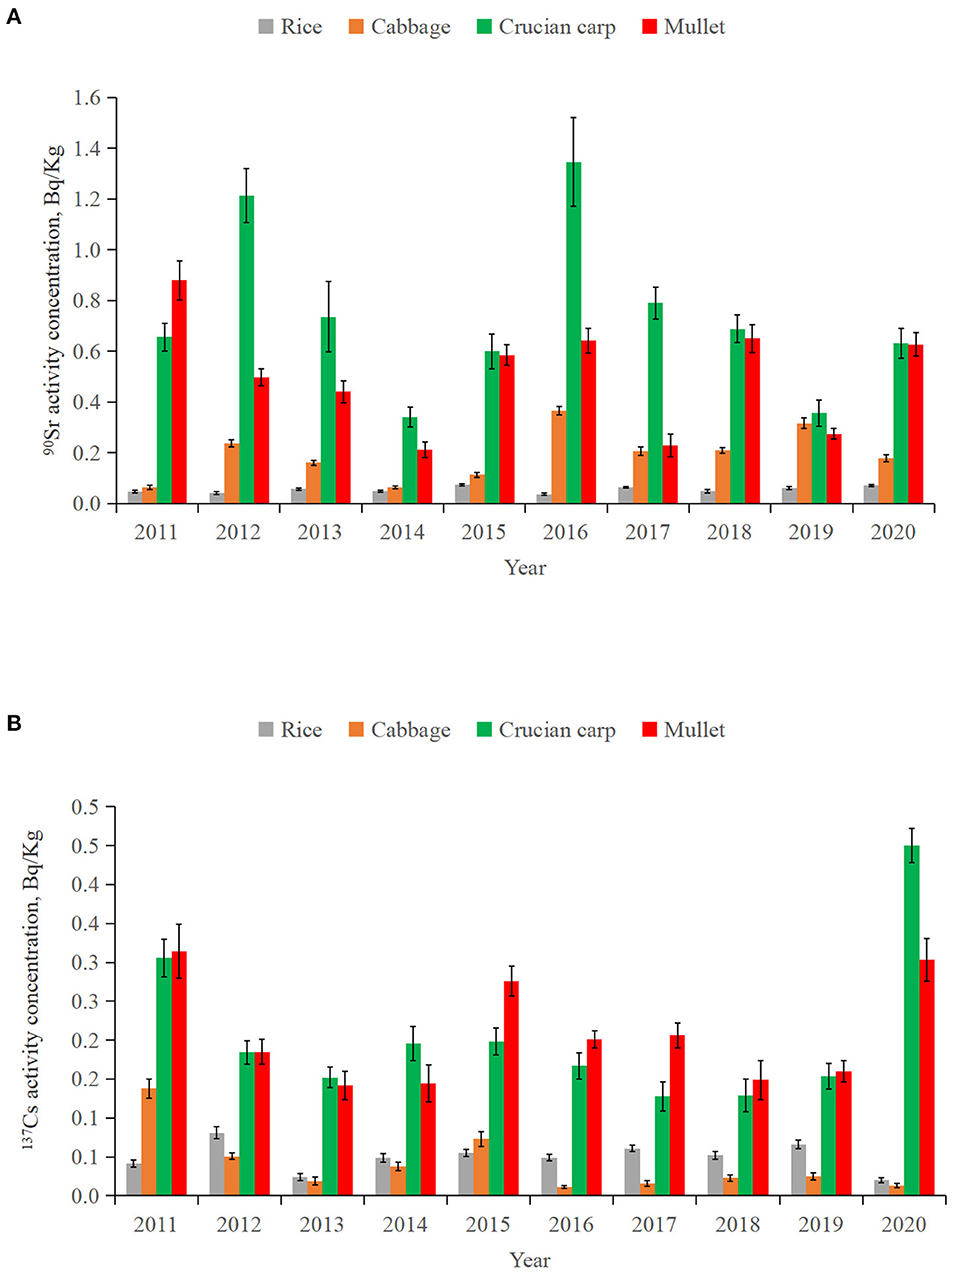
Figure 5. Activity concentrations of 90Sr (A) and 137Cs (B) in different food samples (rice, cabbage, crucian carp and mullet) around SNPP form 2011 to 2020.
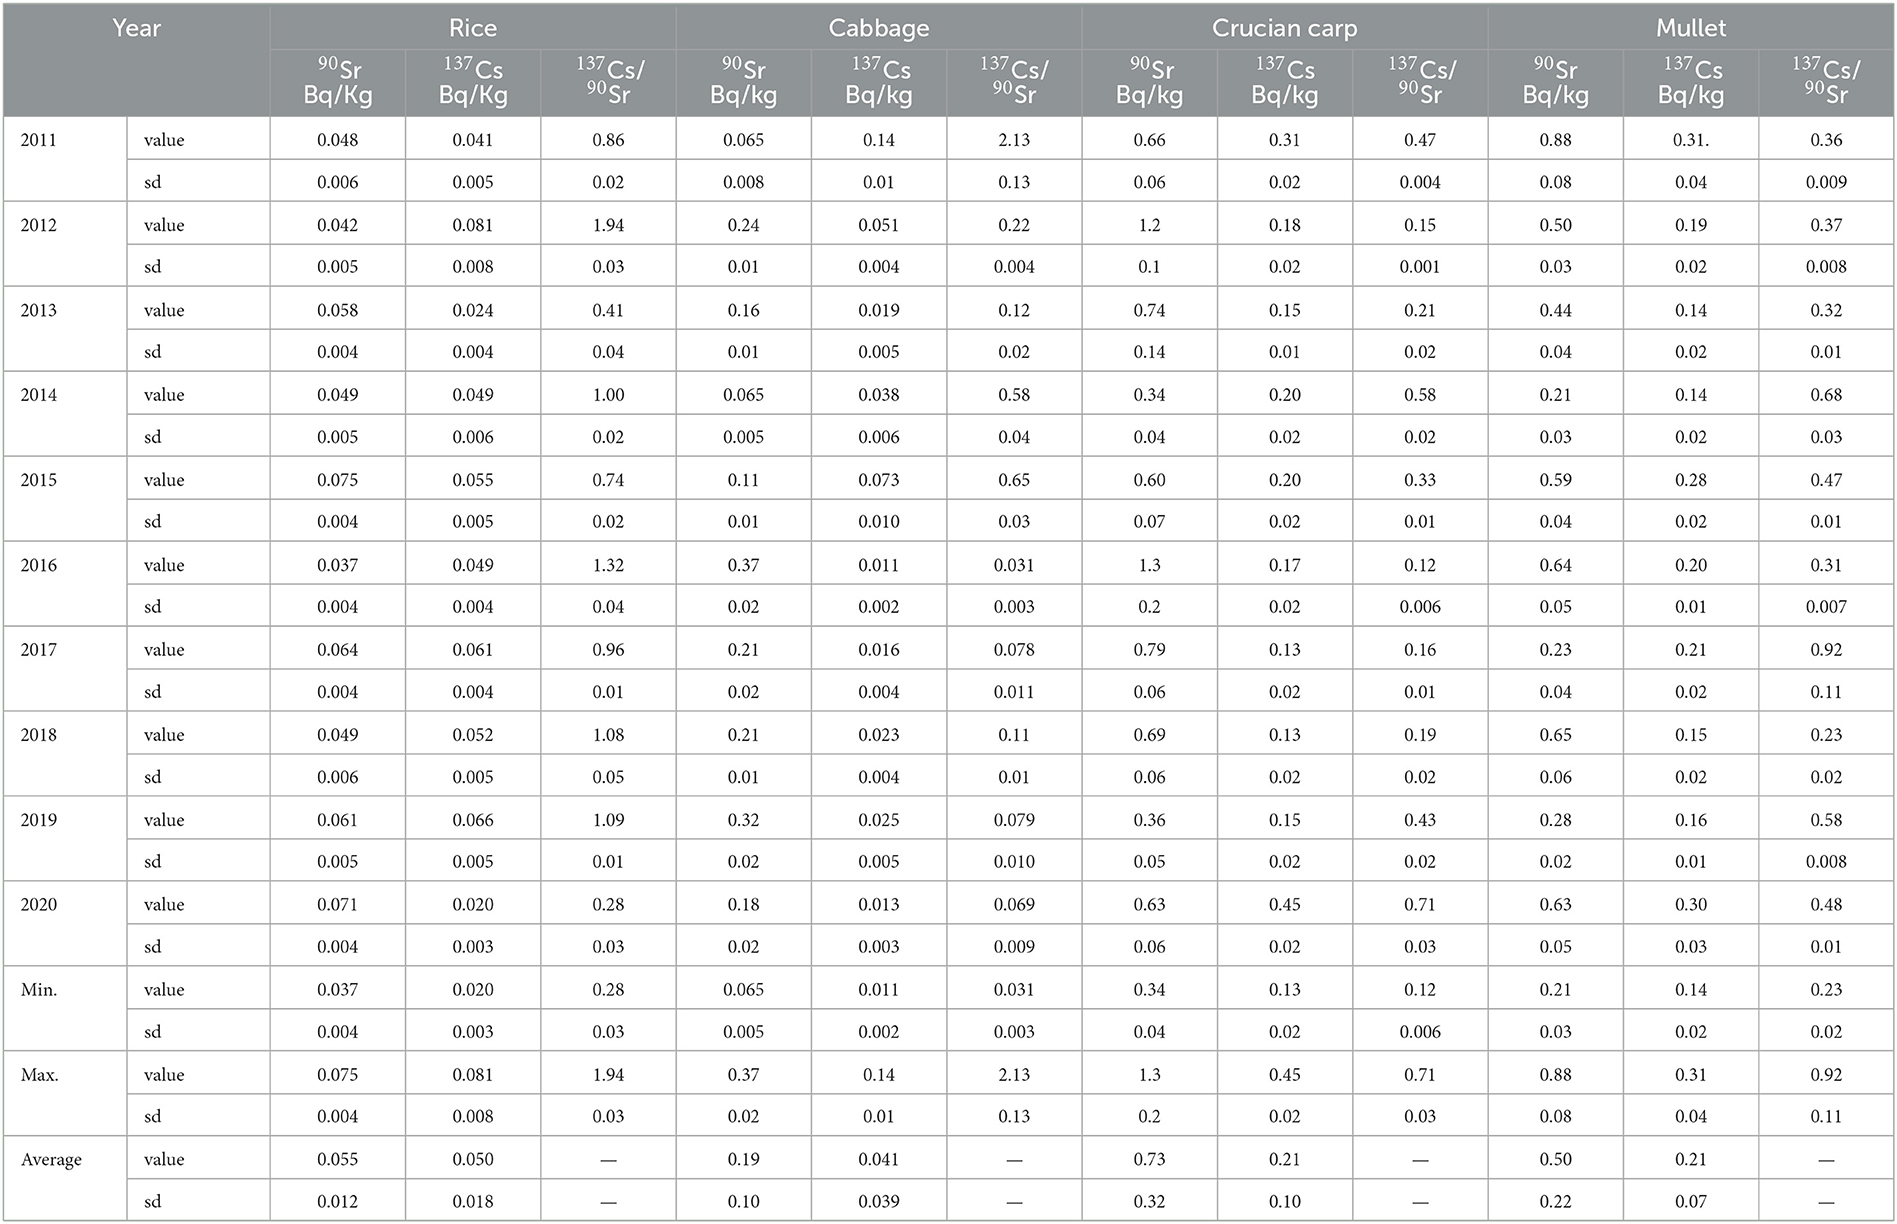
Table 4. Activity concentrations of 137Cs and 90Sr and 137Cs/90Sr activity ratios in food samples around SNPP form 2011 to 2020.
The activity concentrations of 90Sr varied greatly with food species (Figure 5A), with mean activity concentrations over the 10 years generally decreasing following the order of rice (0.055 ± 0.012 Bq/kg f. w.) < cabbage (0.19 ± 0.01 Bq/kg f. w.) < mullet (0.50 ± 0.22 Bq/kg f. w.) < crucian carp (0.73 ± 0.32 Bq/kg f. w.) (Table 4). In contrast to rice, other three types of food showed significant inter-annual variations in activity concentrations of 90Sr during 2011–2020. The difference between maximum and minimum of 90Sr activity concentrations was 5.7, 3.8, and 4.2 times in cabbage, crucian carp and mullet, respectively. The highest 90Sr values were both found in 2016 for cabbage and crucian carp, and in 2011 for mullet.
Different from 90Sr, the mean activity concentrations of 137Cs were comparable between rice (0.050 ± 0.018 Bq/kg f. w.) and cabbage (0.041 ± 0.039 Bq/kg f. w.), and between crucian carp (0.21 ± 0.10 Bq/Kg f. w.) and mullet (0.21 ± 0.07 Bq/Kg f. w.), with much lower levels in the former pair than the latter. These characteristics might be related to the different environmental conditions for the growth of these biota and different physiological metabolisms for 90Sr and 137Cs uptake and excretion among different biological species (4, 5).
Table 5 lists the activity concentrations of 90Sr and 137Cs in foods from different regions in the world. The values obtained in this study were at the same order of magnitude as 137Cs and 90Sr activity concentrations in food samples from other areas reported earlier (27, 29, 36, 39–49).
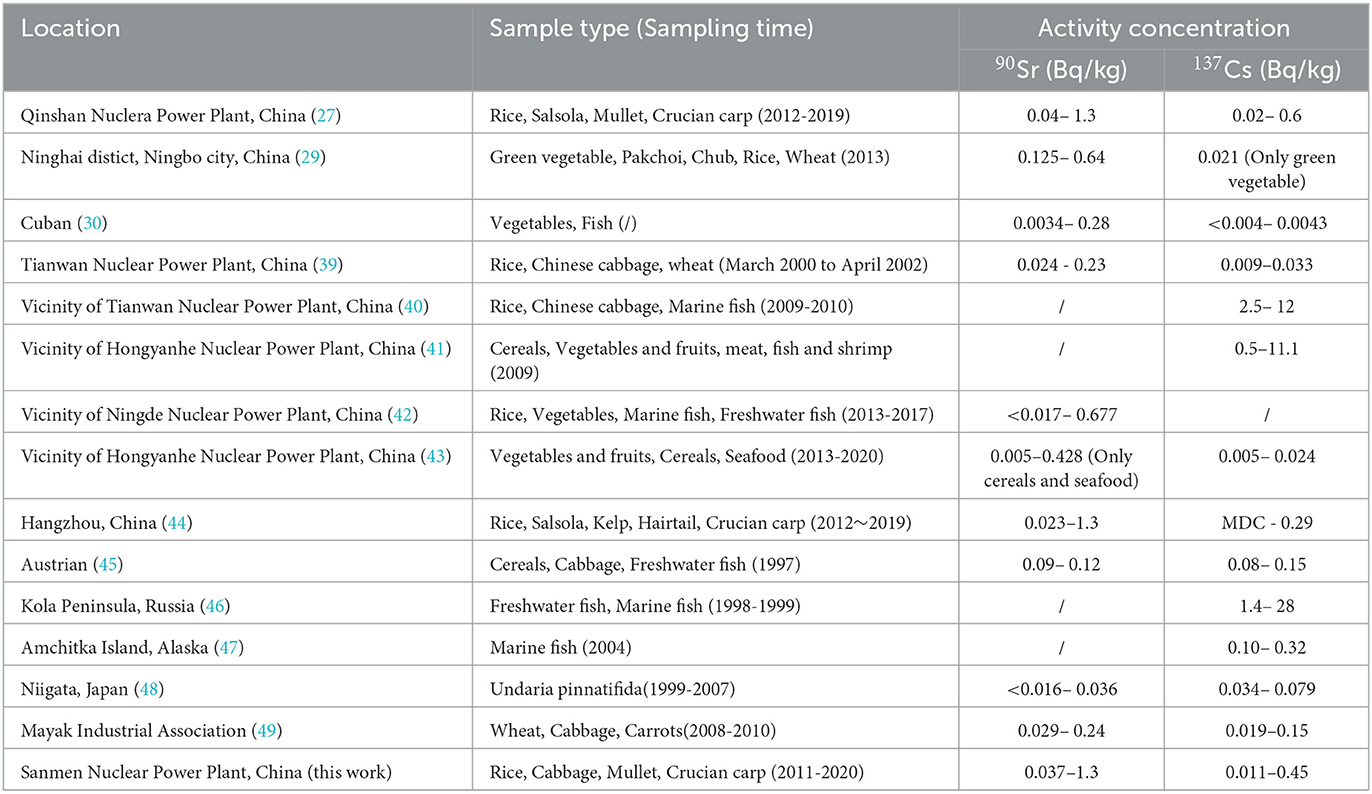
Table 5. Comparison of activity concentrations of 137Cs and 90Sr in foods from different regions of the world.
3.3. Sources of 90Sr and 137Cs in the study region
Figure 6 shows the time series diagram of 137Cs/90Sr activity ratios in the water and food samples investigated from 2011 to 2020. The activity ratios of 137Cs/90Sr in surface water, factory water and tap water were in the ranges of (0.020 ± 0.004)–(1.55 ± 0.12), (0.035 ± 0.001)–(2.05 ± 0.13) and (0.014 ± 0.002)–(1.57 ± 0.04), respectively. The activity ratios of 137Cs/90Sr in rice, cabbage, crucian carp and mullet ranged within (0.28 ± 0.03)–(1.94 ± 0.03), (0.031 ± 0.003)–(2.13 ± 0.13), (0.12 ± 0.006)–(0.71 ± 0.03) and (0.23 ± 0.02)–(0.92 ± 0.11), respectively (Table 4).
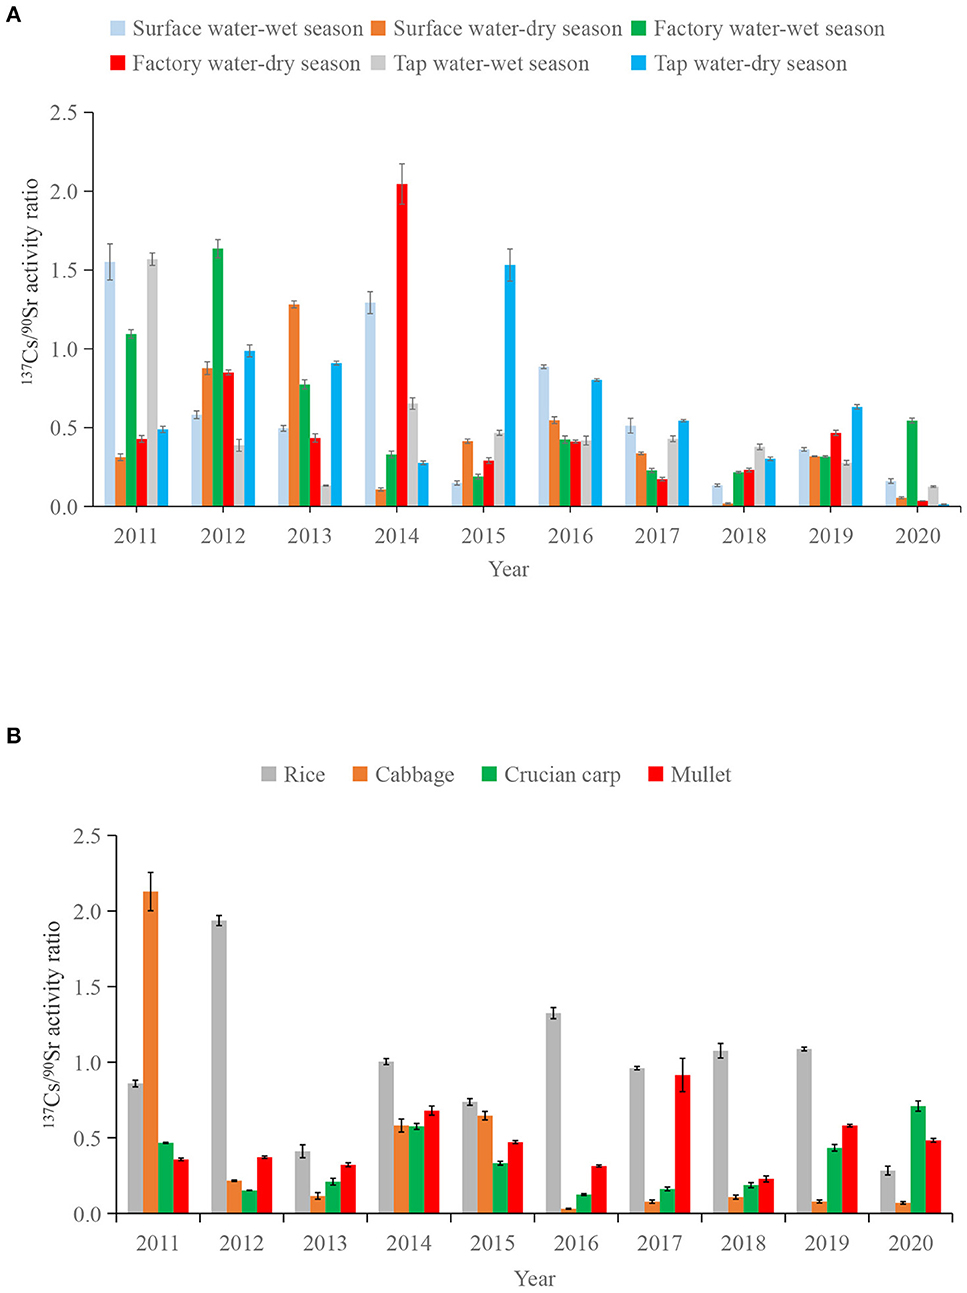
Figure 6. 137Cs/90Sr activity ratios in water (A) and food (B) samples during 2011–2020.
The main pollution source of 90Sr and 137Cs in surface environment would be the global fallout from the atmospheric nuclear weapon tests conducted in 1950–1980s (50, 51). In the study region, in addition to the contamination caused by global fallout, there was also the possibility of radioactive fallout from the operation of local and regional nuclear power plants, e.g., SNPP and Qinshan NPP. Other pollution source, e.g., Chernobyl nuclear accident, was deemed to have contributed little to the quantity of 90Sr and 137Cs in the western North Pacific (52, 53). In addition, there were no evidences showing that Fukushima nuclear accident has significant impact on China. So far, no significant release of radioactivity has been reported from SNPP and Qinshan NPP. Therefore, 90Sr and 137Cs detected in water and food around SNPP should reflect the global radioactive fallout levels.
137Cs/90Sr activity ratio has been used in order to obtain evidence to clarify the origin of these radionuclides (54, 55). The activity ratio of 137Cs/90Sr from the global fallout deposition was estimated to be about 1.6 (51). Much higher 137Cs/90Sr activity ratios have been reported for the local fallout from the Chernobyl (up to 250) (56) and Fukushima (up to 1000) (2, 57) nuclear accidents. Our results showed that the 137Cs/90Sr activity ratios in water and food around SNPP were lower than the global fallout signal, except for individual samples. This may be related to the fact that 90Sr deposited in the soil is easier to migrate to crops and water, because of higher solubility and mobility of 90Sr in the surface environment (58). In our previous studies,the 137Cs/90Sr activity ratios in food and water samples form Qinshan NPP (China) (water: <1.2, food: <1.2) (27) and Hangzhou [water: <1.5(except for individual samples), food: <0.72] (44) were similar to this study, both lower than the global fallout signal.
In this study, the highest activity ratio in surface water occurred in wet season of 2011 (1.55 ± 0.12), which was 5 times higher than that in dry season (0.31 ± 0.02) in the same year, and 2.7 times higher than that in wet season of 2012 (0.58 ± 0.02). This might indicate additional radioactive input in the study area during the wet season of 2011. In addition, the maximum activity ratio of cabbage and rice appeared in 2011 and 2012 respectively, which further proved the possibility of our speculation (Figure 4). However, more in-depth investigation would be needed to clarify this potential source input.
In addition, after the operation of SNPP in 2018, activity ratios of 137Cs/90Sr in either food or water samples during 2018–2020 were not increased compared to earlier year. This indicates that radioactive substances released during the operation of SNPP in 2018–2020 were negligible.
3.4. Dose assessment
According to the annual average food intake of Sanmen County residents (Located in Taizhou City), as shown in Table 6, the mean AED values from 2011 to 2020 were calculated to be 7.2 × 10⁻⁷, 1.3 × 10⁻⁶ and 6.8 × 10⁻⁷ Sv/y, respectively, for people of 3-12 years old, 12-18 years old and more than 18 years old. They were significantly lower than the reference value recommended by Chinese national standards (7.84 × 10⁻⁴ Sv/y) (38), indicating that radioactivity concentrations of 90Sr and 137Cs in food from Sanmen County were at safe levels from 2011 to 2020.
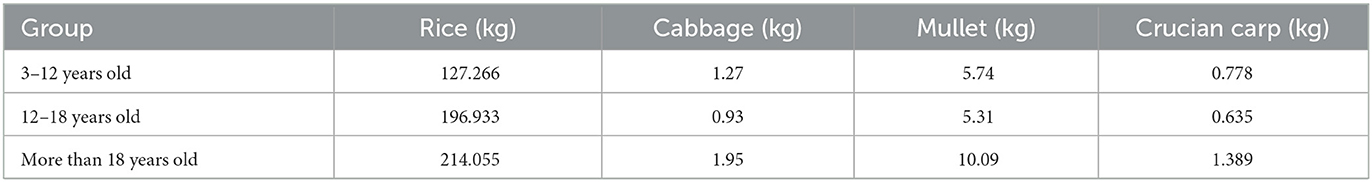
Table 6. Annual average food intake by Sanmen residents.
4. Conclusions
This work provides a long-term and systematic study on the levels, variations, and sources of 90Sr and 137Cs in water and food around SNPP from 2011 to 2020, with dose assessment for the local public. The activity concentrations of 90Sr and 137Cs measured in this study were all at background levels, which were lower than those recommended by WHO.
Mean annual activity concentrations of 90Sr in different types of food decrease according to rice < cabbage < mullet < crucian carp. The mean AEDs of local food containing 90Sr and 137Cs for all three age groups in Sanmen County from 2011 to 2020 were significantly lower than the threshold recommended by the local government. Therefore, radioactivity concentrations of the investigated food products in Sanmen County (China) were at safe levels during 2011–2020.
The 90Sr and 137Cs radioactive materials detected in water and food samples in the study area were mainly from the global fallout of nuclear weapons tests. Since the operation of SNPP in 2018 until 2020, there has been no notable release of radioactive material to the study area.
Data availability statement
The original contributions presented in the study are included in the article/supplementary material, further inquiries can be directed to the corresponding author.
Ethics statement
Ethical review and approval was not required for the study on human participants in accordance with the local legislation and institutional requirements. Written informed consent from the participants was not required to participate in this study in accordance with the national legislation and the institutional requirements.
Author contributions
PW and YC: study design, collection, analysis, interpretation of data, and final approval of the manuscript. SY, HZ, XL, HR, LZ, ZL, ZX, XG, QX, ZZ, and YZ: study design, collection, detection, analysis, interpretation of data, and manuscript writing. All authors contributed to the article and approved the submitted version.
Funding
This work was supported by the Zhejiang Provincial Foundation Public Welfare Research Project (No. LGC21H260001), Zhejiang Health Science and Technology Plan (Nos. 2021KY613, 2022RC120, 2022KY130, 2022KY132, 2023KY643, and 2019KY353), and Project of South Zhejiang Institute of Radiation Medicine and Nuclear Technology (Nos. ZFY-2021-K-003, ZFY-2022-K-001, and ZFY-2022-K-006).
Conflict of interest
The authors declare that the research was conducted in the absence of any commercial or financial relationships that could be construed as a potential conflict of interest.
Publisher's note
All claims expressed in this article are solely those of the authors and do not necessarily represent those of their affiliated organizations, or those of the publisher, the editors and the reviewers. Any product that may be evaluated in this article, or claim that may be made by its manufacturer, is not guaranteed or endorsed by the publisher.
References
1. Wai KM, Krstic D, Nikezic D, Lin TH, Yu PKN. External cesium-137 doses to humans from soil in fluenced by the Fukushima and Chernobyl nuclear power plants accidents: a Comparative Study. Sci Rep. (2020) 10:3575–90. doi: 10.1038/s41598-020-64812-9
2. Miki S, Fujimot K, Shigenobu Y, Ambe D, Kaeriyama H, Takagi K, et al. Concentrations of 90Sr and 137Cs/90Sr activity ratios in marine fishes after the Fukushima Dai-ichi nuclear power plant accident. Fish Oceanogr. (2017) 26:221–33. doi: 10.1111/fog.12182
3. Tazoe H, Yamagata T, Tsujita K, Nagai H, Obata H, Tsumune D, et al. Observation of dispersion in the Japanese coastal area of released 90Sr, 134Cs, and 137Cs from the Fukushima Daiichi nuclear power plant to the sea in 2013. Int J Environ Res Public Health. (2019) 16:4094. doi: 10.3390/ijerph16214094
4. Wicker FW, Nelson WC, Gallegos AF. Fallout 137Cs and 90Sr in trout from mountain lakes in Colorado. Health Phys. (1972) 23:519–27. doi: 10.1097/00004032-197210000-00009
5. Young DR, Folsom TR. Caesium accumulation in muscle tissue of marine fishes. Health Phys. (1979) 37:703–6.
6. Miao XX, Ji YQ, Shao XZ, Wang H, Sun QF, Su X. Radioactivity of drinking-water in the vicinity of nuclear power plants in China based on a large-scale monitoring study. Int J Environ Res Public Health. (2013) 10:6863–72. doi: 10.3390/ijerph10126863
7. Merz S, Shozugawa K, Steinhauser G. Analysis of Japanese radionuclide monitoring data of food before and after the Fukushima nuclear accident. Environ Sci Technol. (2015) 49:2875–85. doi: 10.1021/es5057648
8. Falandysz J, Saniewski M, Zhang J, Zalewska T, Liu HG, Kluza K. Artificial 137Cs and natural 40K in mushrooms from the subalpine region of the Minya Konka summit and Yunnan province in China. Environ Sci Pollut R. (2018) 25:615–27. doi: 10.1007/s11356-017-0454-8
9. Falandysz J, Zhang J, Saniewski M. 137Cs, 40K, and K in Raw and Stir-Fried Mushrooms from the boletaceae family from the midu region in Yunnan, southwest China. Environ Sci Pollut R. (2020) 27:32509–17. doi: 10.1007/s11356-020-09393-w
10. Ishii Y, Matsuzaki SS, Hayashi S. Data on 137Cs concentration factor of freshwater fish and aquatic organisms in lake and river ecosystems. Data Brief. (2020) 28:105043. doi: 10.1016/j.dib.2019.105043
11. Suplińska M, Kardaś M, Rubel B, Fulara A, Adamczyk A. Monitoring of radioactive contamination in Polish surface waters in 2012–2013. J Radioanal Nucl Chem. (2015) 304:81–7. doi: 10.1007/s10967-014-3728-3
12. Shimura T, Yamaguchi I, Terada H, Robert Svendsen ER, Kunugita N. Public health activities for mitigation of radiation exposures and risk communication challenges after the Fukushima nuclear accident. J Radiat Res. (2015) 56:422–9. doi: 10.1093/jrr/rrv013
13. Van TT, Bat LT, Nhan DD, Quang NH, Cam BD, Hung LV. Estimation of radionuclide concentrations and average annual committed effective dose due to ingestion for the population in the Red River Delta, Vietnam. Environ Manage. (2019) 63:444–54. doi: 10.1007/s00267-018-1007-8
14. Cao YY, Xuan ZQ, Yu SF, Lai ZJ, Zhao YX, Luo J, et al. Investigation and analysis of radiation levels in the environment around Sanmen Nuclear Power Plant from 2015 to 2019. Chin J Radiol Med Prot. (2020) 40:951–5. doi: 10.3760/cma.j.issn.0254-5098.2020.12.010
15. Cao YY, Zhao D, Yu SF, Zhang MB, Zou H, Xuan ZQ, et al. Investigation on 90Sr level in offshore seawater and seafood therein around Sanmen Nuclear Power Plant site and assessment of committed effective dose from 2015 to 2019. Chin J Radiol Med Prot. (2021) 41:288–92. doi: 10.3760/cma.j.issn.0254-5098.2021.04.009
16. Suzhou Nuclear Power Research Institute. Environmental Impact Report for Units 3 and 4 of Sanmen Nuclear Power Project (Site Selection Stage). Sanmen: Suzhou Nuclear Power Research Institute (2013).
17. Cao YY, Yu SF, Xuan ZQ, Li XX, Zhao YX, Luo J, et al. Study on rapid microwave ashing pretreatment method for radioactivity monitoring in food. Chin J Radiol Med Prot. (2018) 38:43–7. doi: 10.3760/cma.j.issn.0254-5098.2018.01.009
18. National Environmental Protection Administration of the People's Republic of China. Radiochemical Analysis of Strontium-90 in Water Extraction Chromatography by di-(2-ethylhexyl) Phosphoric Acid: GB 6766-86. Beijing: Standards Press of China (1986).
19. Ministry of Environmental Protection of the People's Republic of China. Radiochemical Analysis of Strontium-90 in Water and Ash of Biological Samples: HJ 815-2016. Beijing: Standards Press of China (2016).
20. Ministry of Health of the People's Republic of China. Examination of Radioactive Materials for Foods-Determination of Strontium-89 and Strontium-90: GB14883.3-1994. Beijing: Standards Press of China (1994).
21. National Environmental Protection Administration of the People's Republic of China. Radiochemical analysis of caesium-137 in water: GB 6767-1986. Beijing: Standards Press of China (1986).
22. Ministry of Environmental Protection of the People's Republic of China. Radiochemical Analysis of Caesium-137 in Water and Ash of Biological Samples: HJ 816-2016. Beijing: Standards Press of China (2016).
23. Ministry of Health of the People's Republic of China. Examination of Radioactive Materials for Foods-Determination of Caesium-137: GB 14883.10-1994. Beijing: Standards Press of China (1994).
24. General General Administration of Quality Supervision Inspection Inspection and Quarantine of the People's Republic of China. Basic Standards for Protection Against Ionizing Radiation and for the Safety of Radiation Sources: GB18871-2002. Beijing: Standards Press of China (2002).
26. Nuclear Emergency Response Headquarters Government Government of Japan. Report of Japanese Government to the IAEA Ministerial Conference on Nuclear Safety - The Accident at TEPCO's Fukushima Nuclear Power Stations. Vienna: IAEA (2011).
27. Cao YY, Zhao ZX, Wang P, Yu SF, Lai ZJ, Zhang MB, et al. Long-term variation of 90Sr and 137Cs in environmental and food samples around Qinshan nuclear power plant, China. Sci Rep. (2021) 11:20903. doi: 10.1038/s41598-021-00114-y
28. Dahlgaard H, Eriksson M, Nielsen SP, Joensen HP. Levels and trends of radioactive contaminants in the Greenland environment. Sci Total Environ. (2004) 331:53–67. doi: 10.1016/j.scitotenv.2004.03.023
29. Hu DB, Lu LC, Hu YM, Zhang F, Dai Z, Zhong PF. Survey of radiation baseline level in Ninghai areas adjacent to the Sanmen nuclear power station. Shanghai J Pre Med. (2016) 28:214–8. doi: 10.19428/j.cnki.sjpm.2016.04.002
30. Deng DP, Xu JA, Zhu JG, Chen YM, Lu F, Song G, et al. Assessment of radiation background level of Shangdong basin in east line of northward rerouting of southern river. Chin J Radiol Med Prot. (2007) 27:188–90. doi: 10.3760/cma.j.issn.0254-5098.2007.02.027
31. Yang Q, Shao Y, Du HY, Lin XF, Wang L, Luo ZY, et al. Impact of the three gorges water conservancy project on radioactivity concentration leves in surrounding waters. Radiat Prot Dosim. (2020) 189:505–16. doi: 10.1093/rpd/ncaa065
32. Liu HS, Hu XY, Chen B, Hu D, Song JF, Li X. Monitoring result of radioactivity level in external environment around Qinshan NPP base during past twenty years. Atom Energ Sci Technol. (2013) 47:1906–15. doi: 10.7538/yzk.2013.47.10.1906
33. Xiang YY, Wang K, Zhang Y, Cao ZG, Ye JD, Wang HF. Radioactivity monitoring in environmental water and air around QNPP. Nucl Sci Tech. (2007) 18:316–20. doi: 10.1016/S1001-8042(07)60069-4
34. Jiménez A, Rufo DLM. Influence of physicochemical characteristics of freshwater on artificial radioactivity content. Water Environ Res. (2001) 73:286–94. doi: 10.2175/106143001X139290
35. Rusconi R, Forte M, Badalamenti P, Bellinzona S, Gallini R, Maltese S, et al. The monitoring of tap waters in Milano: planning, methods and results. Radiat Prot Dosim. (2004) 111:373–6. doi: 10.1093/rpd/nch057
36. Zerquera JT, Alonso MP, Gómez IMF, Castro GVR, Ricardo NM., Bejerano GL, et al. Studies on internal exposure doses received by the cuban population due to the intake of radionuclides from the environmental sources. Radiat Prot Dosim. (2006) 121:168–74. doi: 10.1093/rpd/ncl002
37. Shozugawa K, Riebe B, Walther C, Brandl A, Steinhauser G. Fukushima-derived radionuclides in sediments of the Japanese Pacific Ocean coast and various Japanese water samples (seawater, tap water, and coolant water of Fukushima Daiichi reactor unit 5). J Radioanal Nucl Chem. (2016) 307:1787–93. doi: 10.1007/s10967-015-4386-9
38. Ministry of Health of the People's Republic of China. Limited Concentrations of Radioactive Materials in Foods: GB14882-94. Beijing: Standards Press of China (1994).
39. Lu JG, Huang YJ, Li F, Wang LH, Li SZ, Hsia YF. The investigation of 137Cs and 90Sr background radiation levels in soil and plant around Tianwan NPP, China. J Environ Radioactiv. (2006) 90:89–99. doi: 10.1016/j.jenvrad.2006.06.002
40. Yang XY, Yu, NL, Chen Q, Xu, XS, Zhuang JY. Analysis of radioactivity level in drinking water and food around Tiawan nuclear power plant. Chin J Radiol Med Prot. (2012) 32:407–9. doi: 10.3760/cma.j.issn.0254-5098.2012.04.021
41. Shi EW, Cui Y, Zhang Q, Li D, Li X, Yao S, et al. The radioactivity levels and population doses in areas around Hongyanhe nuclear power plant before operation. Chin J Radiol Med Prot. (2013) 33:648–52. doi: 10.3760/cma.j.issn.0254-5098.2013.06.021
42. Zheng QS, Zhang Y, Huang LH, Zheng SX, Zhao SM, Liu J, et al. Investigation on 90Sr concentration in foods near Ningde nuclear power plant in 2013-2017. Chin J Radiol Med Prot. (2019) 39:931–5. doi: 10.3760/cma.j.issn.0254-5098.2019.12.010
43. Shi EW, Cui Y, Yao S, Li D, Zhou GX, Sun SM. Radioactivity levels in foods during 2013 to 2020 around Hongyanhe nuclear power plant and study on internal doses to the public. Chin J Radio Med Prot. (2021) 41:741–5. doi: 10.3760/cma.j.issn.0254-5098.2021.10.004
44. Cao YY, Zhao ZX, Zou H, Lou XM, Wang P, Gao XJ, et al. Radioactivity in water and food from Hangzhou, China in the past decade: levels, sources, exposure and human health risk assessment. Environ Technol Innov. (2022) 28:102581. doi: 10.1016/j.eti.2022.102581
45. Mück K, Sinojmeri M, Whilidal H, Steger F. The long-term decrease of 90Sr availability in the environment and its transfer to man after a nuclear fallout. Radiat Prot Dosim. (2001) 94:251–9. doi: 10.1093/oxfordjournals.rpd.a006497
46. Travnikova IG, Shutov VN, Ya Bruk G, Balonov MI, Skuterud L, Strand P, et al. Assessment of current exposure levels in different population groups of the Kola Peninsula. J Environ Radioactiv. (2002) 60:235–48. doi: 10.1016/S0265-931X(01)00106-0
47. Burger J, Gochfeld M, Kosson D, Powers CW, Friedlander B, Stabin M, et al. Radionuclides in marine fishes and birds from Amachitka and Kiska Islands in the Aleutians: establishing a baseline. Health Phys. (2007) 92:265–79. doi: 10.1097/01.HP.0000248123.27888.d0
48. Morita T, Fujimoto K, Kasai H, Yamada H, Nishiuchi K. Temporal variations of 90Sr and 137Cs concentrations and the 137Cs/90Sr activity ratio in marine brown algae, Undaria pinnatifida and Laminaria longissima, collected in coastal areas of Japan. J Environ Monit. (2010) 12:1179–86. doi: 10.1039/b920173d
49. Kazachonok NN, Kostyuchenko VA, Popova IY, Polyanchikova GV. Research into the factors affecting the uptake of 90Sr and 137Cs by plants from radioactively contaminated soils of the southern urals. Health Phys. (2012) 103:56–7. doi: 10.1097/HP.0b013e318249ba1a
50. Krey PW, Krajewsky B. Comparison of atmospheric transport model calculations with observations of radioactive debris. J Geophys Res. (1970) 75:2901–8. doi: 10.1029/JC075i015p02901
51. UNSCEAR. Source and Effect of Ionizing Radiation. New York, NY:United Nations Scientifific Committee on the Effect of Atomic Radiation (2000).
52. Aoyama M, Hirose K. The temporal and spatial variation of 137Cs concentration in the Western North Pacific and its marginal seas during the period from 1979 to 1988. J Environ Radioact. (1995) 29:57–74. doi: 10.1016/0265-931X(94)00050-7
53. Ikeuchi Y, Amano H, Aoyama M, Berezhnov VI, Chaykovskaya E, Chumichev VB, et al. Anthropogenic radionuclides in seawater of the Far Eastern Seas. Sci Total Environ. (1999) 237–38. doi: 10.1016/S0048-9697(99)00136-9
54. Igarashi Y, Aoyama M, Hirose K, Miyao T, Yabuki S. Is it possible to use 90Sr and 137Cs as tracers for the aeolian dust transport? Water Air Soil Pollut. (2001) 130:349. doi: 10.1023/A:1013868831120
55. Igarashi Y, Aoyama M, Hirose K, Miyao T, Nemoto K, Tomita M, et al. Resuspension: Decadal monitoring time series of the anthropogenic radioactivity deposition in Japan. J Radiat Res. (2003) 44:319–28. doi: 10.1269/jrr.44.319
56. Irlweck K, Khademi B, Henrich E, Kronraff R. 239(240), 238Pu, 90Sr, 103Ru and 137Cs Concentrations in Curface air in Austria due to dispersion of chernobyl releases over Europe. J Environ Radioactiv. (1993) 20:133–48. doi: 10.1016/0265-931X(93)90038-9
57. Castrillejo M, Casacuberta N, Breier CF, Pike SM, Masqué P, Buesseler KO. Reassessment of 90Sr, 137Cs and 134Cs in the coast off Japan derived from the Fukushima Dai-ichi nuclear accident. Environ Sci Technol. (2016) 50:173–80. doi: 10.1021/acs.est.5b03903
Keywords: radioactivity levels, Sanmen Nuclear Power Plant, radiation exposure, 90Sr, 137Cs, food, water, dose assessment
Citation: Wang P, Yu SF, Zou H, Lou XM, Ren H, Zhou L, Lai ZJ, Xuan ZQ, Gao XJ, Xu QL, Zhou Z, Zhao YX and Cao YY (2023) Levels, sources, variations, and human health risk assessment of 90Sr and 137Cs in water and food around Sanmen Nuclear Power Plant (China) from 2011 to 2020. Front. Public Health 11:1136623. doi: 10.3389/fpubh.2023.1136623
Received: 03 January 2023; Accepted: 06 February 2023;
Published: 22 February 2023.
Edited by:
Tibor Kovács, University of Pannonia, HungaryReviewed by:
Naofumi Akata, Hirosaki University, JapanAnita Csordás, University of Pannonia, Hungary
Copyright © 2023 Wang, Yu, Zou, Lou, Ren, Zhou, Lai, Xuan, Gao, Xu, Zhou, Zhao and Cao. This is an open-access article distributed under the terms of the Creative Commons Attribution License (CC BY). The use, distribution or reproduction in other forums is permitted, provided the original author(s) and the copyright owner(s) are credited and that the original publication in this journal is cited, in accordance with accepted academic practice. No use, distribution or reproduction is permitted which does not comply with these terms.
*Correspondence: Yiyao Cao,  yycao@cdc.zj.cn
†These authors have contributed equally to this work