 Yi Lu1,2*
 Yuhang Wang2
- 1Institute of Emergency Management, Sichuan University, Chengdu, China
- 2Business School, Sichuan University, Chengdu, China
Intention: Global emergencies cause significant damage to lives, assets, and the economy. Therefore, the supply of relief goods is essential in emergency relief contexts, which is generally the function of non-government organizations (NGOs) as they have unique relief goods supply advantages. However, few studies have explored the influencing factors on NGO relief goods supply efficiency. To systematically explore the factors affecting supply efficiency, we aim to develop a supply chain model for simulating and providing policy suggestions.
Method: Taking the 2020 Hubei COVID-19 as case study, this research developed a system dynamic (SD) model for the NGO relief supply system to evaluate and quantify the impact of factor changes on relief supplies.
Conclusion: It was found that transportation and information delays aggravated the NGO emergency supply chain bullwhip effect and caused large supply fluctuations. The initial relief goods inventory was found to be a decisive factor in reducing shortages in disaster areas; however, government support was found to play only a limited role in reducing information and transportation delays.
Value: This study enriches NGO emergency supply chain literature and provides suggestions for guiding NGO relief goods supplies in the future.
1. Introduction
The frequency and scale of humanitarian emergencies from natural disasters, war, and disastrous emergencies such as COVID-19 or terrorism have increased in recent years, with research suggesting that there may be more of such emergencies in the near future (1, 2). These emergencies have highlighted the significant gap in relief goods. For example, relief goods were in short supply during the 2004 Indian Ocean tsunami disaster (3), the 2010 Haiti earthquake (4), and the 2015 Nepalese earthquake (5). During COVID-19, the demand for medical and daily living supplies has also increased significantly (6). Immediately after the occurrence of an emergency in the response phase, it is vital that relief goods are delivered as quickly as possible to the victims in the affected regions (7) as shortages or delivery delays can result in serious losses (8, 9). Therefore, to save the lives of the people in the affected regions (10), relief goods supply is a vital part of emergency relief operations.
Providing relief goods and distributing them to affected areas are important emergency relief operation functions. While there are many relief goods providers, the primary contributors have generally been national government organizations (GO), such as the Federal Emergency Management Agency (FEMA) in the USA, NGOs (the Red Cross, community rescue teams, etc.), and private donors. These three entities have different purposes when providing relief goods to the affected areas and use different distribution channels (11). Of these providers, NGOs have been playing vital roles (12). For example, after the 2005 Hurricane Katrina, the 2008 Wenchuan earthquake, and the 2013 Haiyan typhoon, many NGOs provided emergency relief goods to the affected areas as part of the post-disaster relief and reconstruction (13–15). Compared with the GOs, NGOs are often more flexible in their disaster responses (16–18). For example, when a magnitude 9.0 earthquake struck East Japan on March 11, 2011, the Japanese Council of Social Welfare was supposed to immediately open and manage a disaster volunteer center; however, this was delayed by 1 month. Conversely, the NGOs took between 1 day and 1 week to establish emergency relief centers that provided food and trained rescue teams (19). Another example is the Bhuj earthquake in Turkey when the public rescue team could not access the distant village. However, NGOs managed to successfully reach the community and provide food and medical services (20). In 2004, one of the deadliest tsunamis hit the Indian Ocean and resulted in 227,898 missing persons (21). The Red Cross, Crescent Societies, and hundreds of NGOs responded rapidly using communication technology and modern transportation to rescue people and transport relief goods, which was in contrast to the slow bureaucratic and inefficient decision-making processes of the government (21).
Because of the increased frequency of emergency events, there has been a renewed research focus on emergency supply chains (22). After an emergency, relief goods need to be efficiently transported to the disaster area to reduce casualties. Najafi et al. (23) developed a dynamic earthquake dispatch and vehicle routing to assist disaster managers to plan their logistical activities in the earthquake response phase. Cao et al. (24) designed relief strategies based on a sustainability beneficiary perspective, for which a multi-objective mixed-integer nonlinear programming model was formulated, which was solved using a proposed genetic algorithm. Singh et al. (25) identified and analyzed relief supply chain resilience factors to ensure post-disaster supply capacities. Most previous relief goods supply research has tended to focus on emergency logistics, routing planning, and relief goods allocation. However, systematic research on the influences of the various supply effect factors is equally important.
NGOs and humanitarian supply chains build a “fairness” concept into their supply models (26). Therefore, most humanitarian supply chain research has focused on the last-mile distribution problem. For example, Rabta et al. (27) examined the use of drones for last-mile humanitarian logistics distribution, for which an optimization model was developed for the drone delivery of multiple lightweight relief item packages to remote locations within the disaster-prone area. Chen and Zhao (12) examined NGO capacity limitations and the relationships between GOs and NGOs, for which they modeled the relationships between received and donated relief goods quantities and developed a conditional earmarking donation strategy. Tatham and Blecken (28) empirical survey found that most NGOs did not adequately assess their supply chain performances and the associated logistics activities because they did not have the necessary capabilities. Therefore, to systematically resolve these practical NGO relief goods supply problems, as a case example, this paper employed system dynamics (SD) to study the NGO relief goods supply chains during the 2020 Hubei COVID-19 crisis.
SD is a pseudo-continuous modeling and simulation approach that has been widely used to holistically analyze complex, interdependent, and non-linear systems (29). SD can solve simultaneity (mutual causation) problems by updating all variables in small time increments, providing positive and negative feedback and time delays, and structuring the interactions and control. As the strength of the SD modeling approach is its ability to forecast system behavior beyond the problem symptoms, it has previously been employed to model supply chain systems and evaluate the policy effects on systems (30). Olivares-Aguila and ElMaraghy (31) used an SD framework to observe supply chain behavior and evaluate the disruption impacts, and Xu et al. (32) developed an SD model to assist in the post-seismic relief supply allocations in the Longmen Shan fault area where many destructive earthquakes have occurred. Because SD methods are able to simulate and analyze specific human and environmental characteristics and their relationships during emergency events, it was deemed suitable for an analysis of the complex relief goods supply chain system (33).
In July 2020, the research team was invited to review the joint NGO relief goods supply activities in Hubei, which provided us with a rare opportunity to examine the NGO emergency supply chain system and obtain primary data for the SD model. This study was focused on three key problems: (1) what impact do emergency uncertainties have on NGO relief goods supplies; (2) how do the various factors affect the NGO emergency supply chain; and (3) how can the impact of these adverse factors be mitigated.
Using SD Simulation, this study explored the key elements of the NGO relief goods supply system and the influence of different behaviors on system performance. The preliminary investigation highlighted many of the practical NGO relief goods supply problems; therefore, it is hoped that the developed model and our conclusions can assist in resolving these problems.
2. NGO relief goods supply in Hubei during the COVID-19 crisis
The new coronavirus (COVID-19) that appeared in Hubei, China, at the end of 2019 had infected more than 10,000 Chinese people by February 1, 2020 (34). To mitigate the COVID-19 outbreak, a closure strategy was implemented on January 23, 2020, in Hubei, with other parts of China imposing travel restrictions (35). These policies effectively reduced the increase in infected people but also resulted in severe goods supply problems in Hubei (36). The government allocated more than 66 billion CNY to contain the outbreak and delivered 20 tons of medical supplies per hour across the country to support the relief effort. At the same time, the NGOs were fundraising for an epidemic prevention and control (EPC) program (12), for which the government established a coordination center. Specifically, the charitable foundations collected and donated funding to support the NGOs, and some emergency management NGOs and public health NGOs assisted state agencies, medical institutions, and foundations by delivering materials and services and assisting in the EPC program. Community-based NGOs assisted the local government responses (37), and community volunteers provided material assistance and emotional social support (38), which specifically included materials collection, distribution, transportation, and community services such as purchasing, sterilization, and psychological counseling (39).
While these actions and relief goods greatly assisted the EPC program, there were many problems in the actual goods supply process. For example, the purchase of materials over the internet meant that some elderly groups were unable to source enough materials (40). Because of the insufficient emergency materials reserves, hospitals across the country, and especially those in Hubei where the situation was the most severe, were short of needed medical supplies, especially personal protective supplies such as medical protective clothing and N95 masks (41).
In July 2020, the research team went to Hubei to investigate the NGO relief goods supply process during COVID-19. Supported by the Hubei United Disaster Relief Welfare Network (HUDRWN), 50 HUDRWN NGO members were selected for interviews and questionnaires using stratified sampling, and descriptive statistics, reliability, validity, correlation, and difference analyses were conducted to determine the results. The research team examined the NGO EPC program activities in Hubei and found the following emergency goods supply problems. (1) Because of the traffic controls, there were only a limited number of vehicles authorized to transport goods, which meant that many goods were not delivered on time. (2) There was serious information asymmetry. When the goods collected by the NGOs were delivered, the receiving party's demand was saturated. (3) Because there were many different models and medical materials, the distribution was often incorrect.
These problems were not confined to the NGO relief goods transportation as they also affected the efficiency of the community EPC activities. Therefore, this study sought to systematically analyze the complete NGO emergency goods supply process to determine the key factors affecting its efficiency.
3. Methods
This section reviews the systems dynamics approach, outlines the data analysis procedures, and details the model development.
3.1. SD model development
The empirical SD research involved five consecutive steps (Figure 1): (1) problem definition; (2) systems analysis; (3) scenario analysis; (4) the building of the causal loop diagram (CLD) and the stock and flow diagram (SFD); and (5) conducting the simulation system analysis.
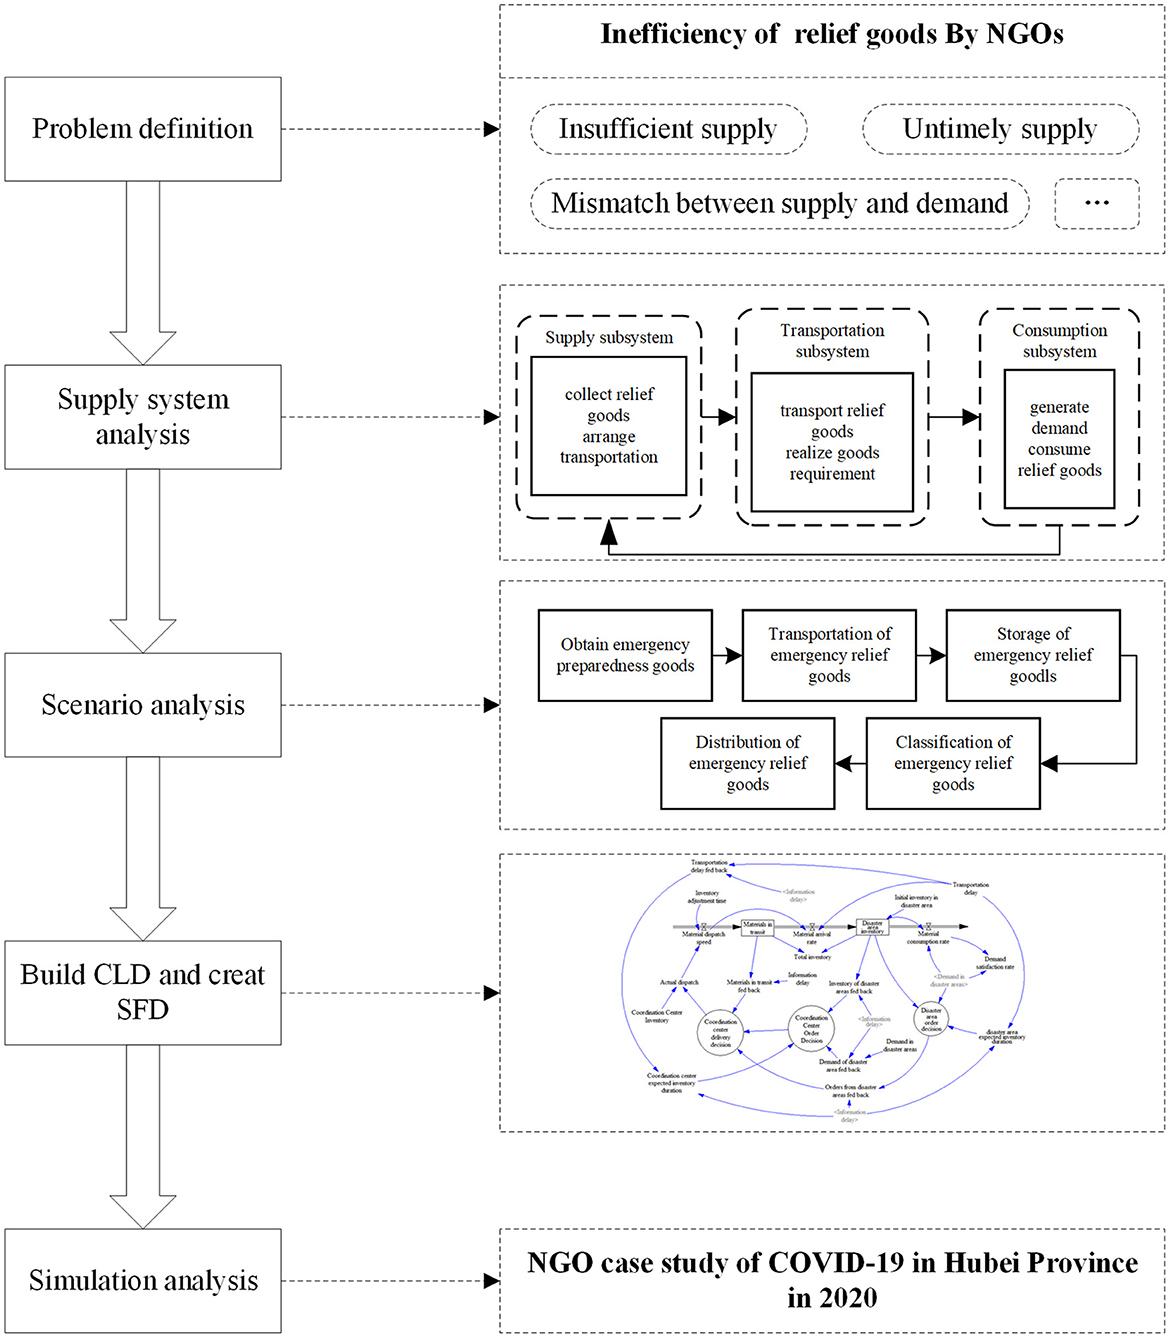
Figure 1. Model development algorithm.
3.1.1. System analysis
Environmental constraints regulate system behavior and system construction. Before describing the system structure, the supply system context needs to be further explored. As the NGO emergency relief goods dispatch and transportation is a complex process that had multiple links; materials procurement, collection, transportation, and distribution; it is necessary to balance the supply and the demand under resource, time, information, and transportation constraints. Therefore, it was necessary to first analyze the system structure and functions.
The NGO relief goods supply chain is a complete process from the receipt of goods to the final distribution to the victims, that is, the process involves relief goods acquisition, procurement, transportation, storage, sorting, and distribution.
The system structure analysis examined all system elements, the interdependencies between these elements, and the mutual interactions. As dynamic behavior comprises information feedback, circular causalities, and the influences of these loops on the system variables (42), the supply system was divided into three subsystems: a supply subsystem; a transportation subsystem; and a consumption subsystem. The main task of the supply subsystem was to collect the relief goods and supply them as required, the actions of which were inevitably influenced by the government and media attention. The main transportation subsystem task was to transport the relief goods and feedback the actual disaster area needs to the NGOs; therefore, transportation and information delays needed to be accounted for. The main consumption subsystem function was to reflect the disaster area needs and the degree to which these needs were being met, as shown in Figure 2.
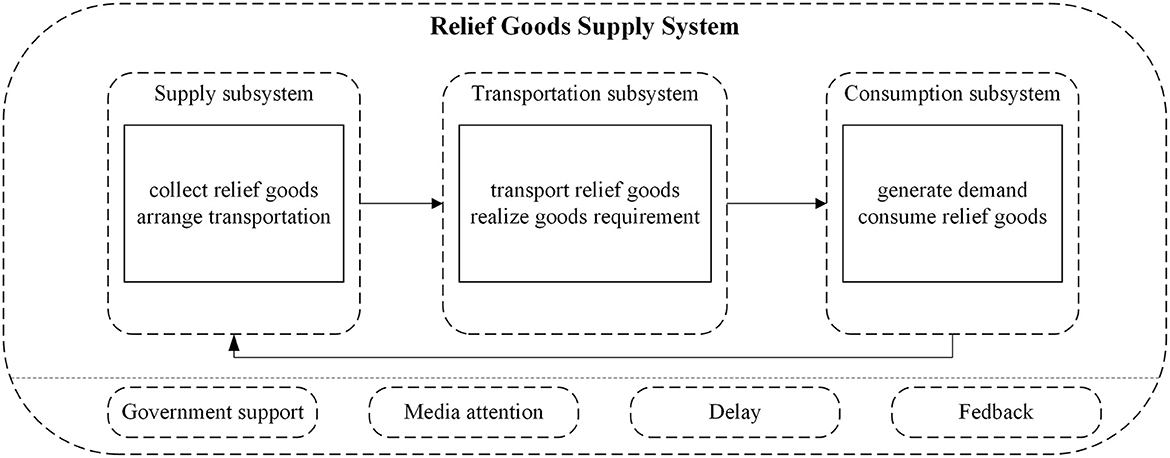
Figure 2. Supply system framework.
3.1.2. Building the causal loop diagram
The dynamics of a system are related to the interactions between the reinforcing feedback loops and the balancing feedback loops (43). The feedback loop visualization embedded in the SD model is known as a causal loop diagram (CLD), the aim of which is to identify the interactions within the model components (44). The definitions for the components used for the CLD creation in this study to explain the dynamics that stimulated changes in the selected supply effect indicators are given in Table 1.
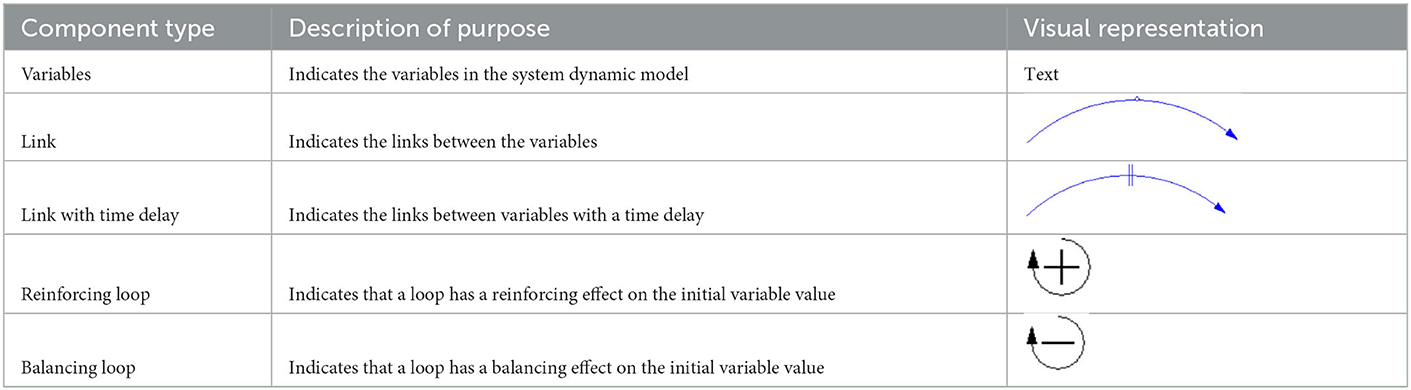
Table 1. CLD components.
Sterman (45) divided the generic stock management control problem into two parts: (1) a stock and flow system structure, and (2) a decision rule to be used by managers (Figure 3). There was one reinforcing loop and two balancing loops in the system. An increase in loss leads to a continuous increase in order and stock, which further increases the loss, which is the reinforcing loop. An increase in stock reduces the gap between stock and expected stock, reduces the adjustment for stock, and finally leads to a reduction in stock, which is the balancing loop. Similarly, the supply line reduces the gap between supply line and expected stock, which leads to a reduction in the adjustment for supply line, further reduces the order and finally leads to a reduction in the supply line, which is the balancing loop.
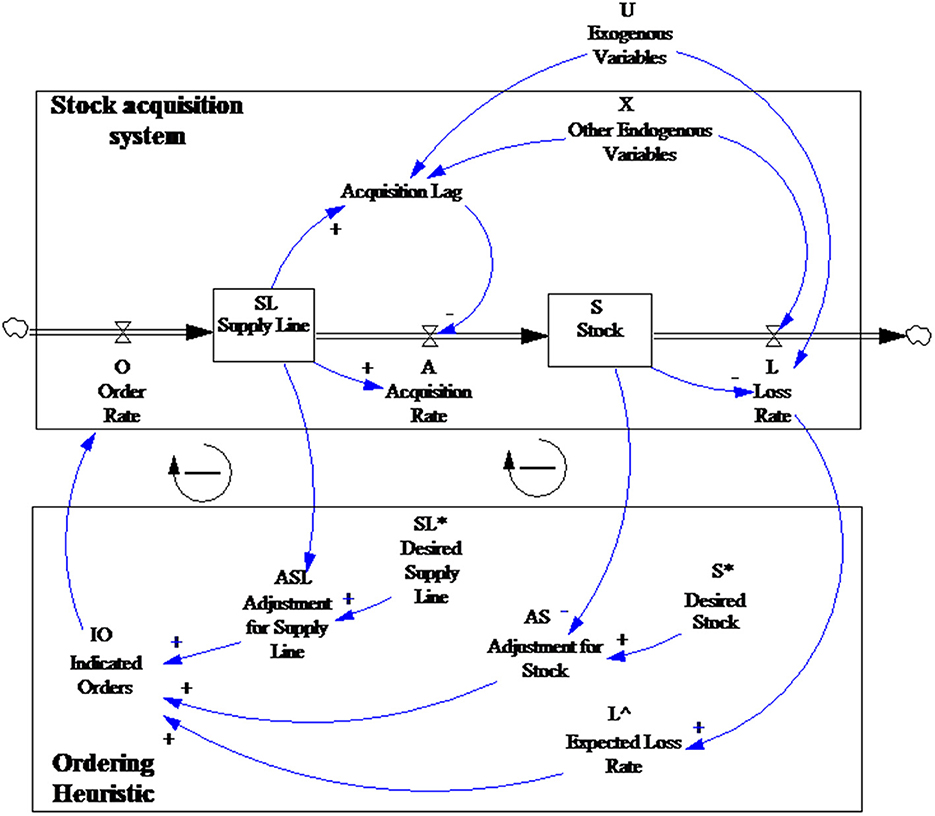
Figure 3. The generic stock-management system by Sterman.
As outlined in NGO relief goods supply in Hubei during the COVID-19 crisis section, compared with general storage and supply models, the NGO emergency goods supply is more specialized. First, the coordination center rather than a supplier makes the order decisions, which can result in information delays between the disaster areas, the coordination center, and NGOs. Second, the demand satisfaction rate for the relief goods supply is far more important than the other evaluation indicators. Third, the factors affecting supply and transportation are more complex, such as focused media attention and government support. This paper, therefore, took Sterman's generic stock-management system model as the framework and then combined it with the emergency relief goods supply characteristics to develop the causal circuit diagram shown in Figure 4.
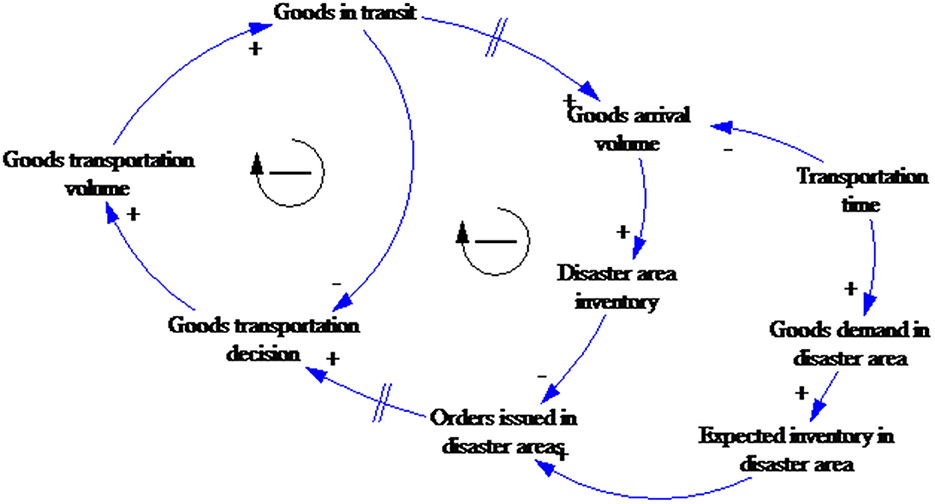
Figure 4. Relief goods supply system casual loop diagram.
The CLD shown in Figure 4 has two balancing loops representing the influence of the delivered goods on the goods transportation decision-making. The two links between goods transit and decision-making are marked for time delays depending on the delay characteristics, that is, material delays, information delays, or transit delays, such as volume restrictions, road conditions, government support, and other factors.
As NGOs have accumulated emergency relief experience, NGOs in China and other countries have gradually formed NGO networks, which has significantly enhanced the ability of NGOs to obtain emergency relief information (46). However, because of limited resources and capacity, and the government's leading role as a most responsible emergency relief provider (47), if the level of government support is improved and a transparent, efficient information platform is established for the disaster areas and the NGOs, the information delay is significantly reduced. The CLD with government support is shown in Figure 5.
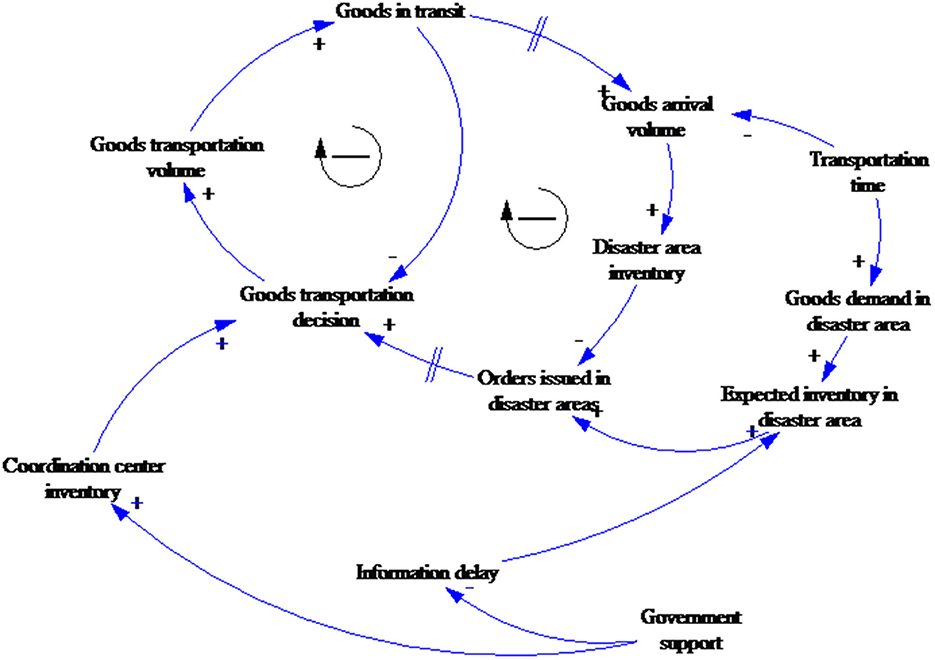
Figure 5. Relief goods supply system casual loop diagram (including government support).
3.1.3. Creating the stock and flow diagram
The SFD distinguishes the nature of each variable and describes the system elements and overall framework. Intuitive symbols depict the logical relationships between the elements to allow for an exploration of the system's feedback and control rules (48). In the system flow diagram shown in Figure 6, the level variables represented by the boxes reflect the system state, the values for which are determined from the materials accumulation and information flow results from an initial point to a particular moment, such as the goods in transit and the disaster area inventories. The rate variables reflect the system state changes per unit time, such as transportation delays, and the constant variables are the system's parameters, which change little over time scope and reflect certain elements, such as the consumption rate.
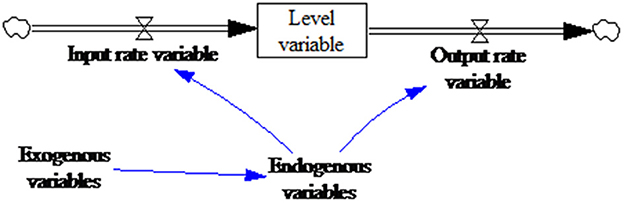
Figure 6. Stock and flow diagram symbols.
Based on the CLD, the resulting SFD is shown in Figure 7.
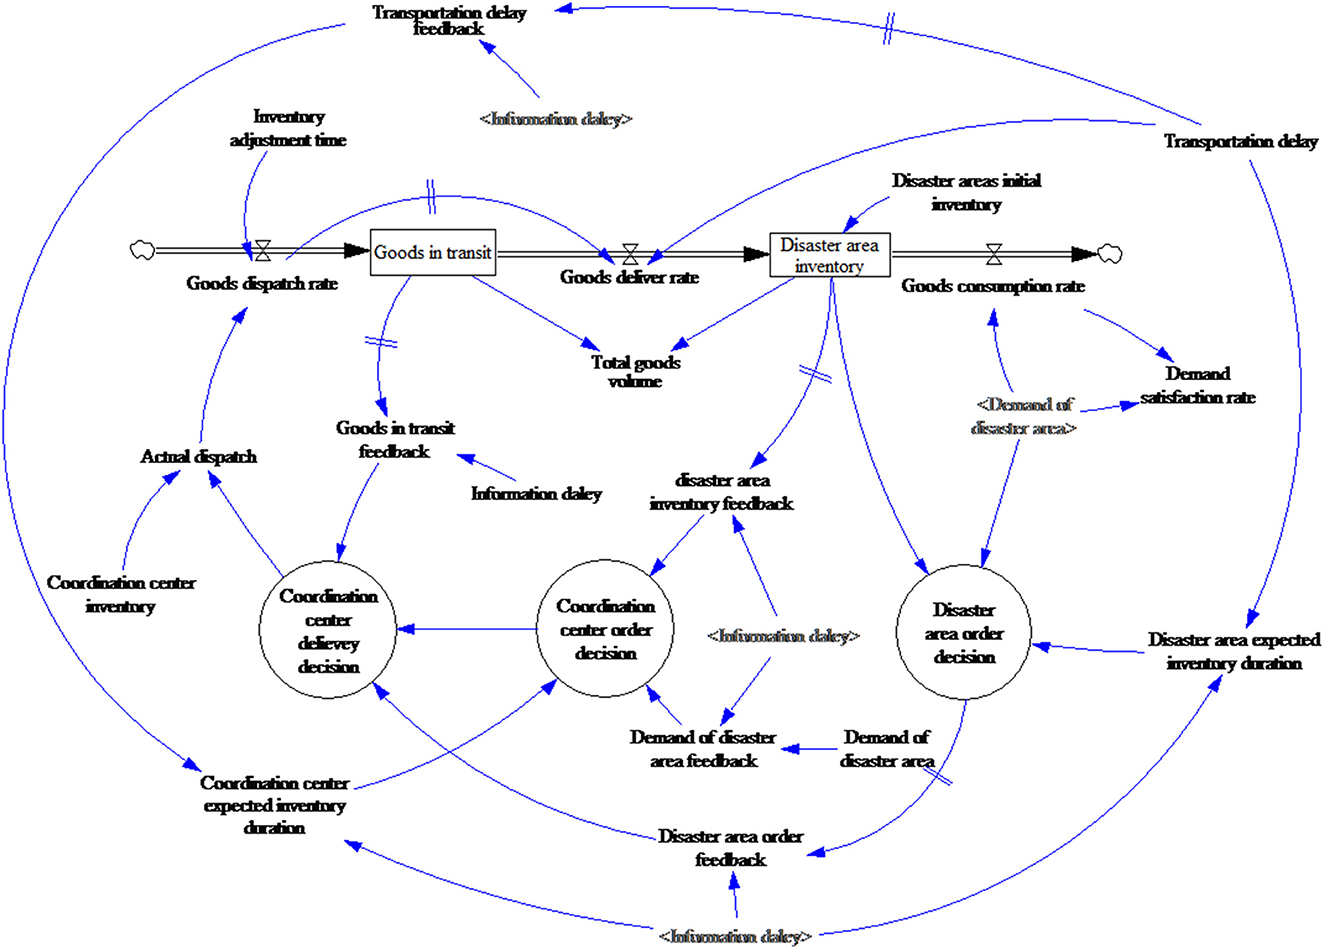
Figure 7. Relief goods supply system stock and flow diagram.
The relief goods volume is the core variable in the model. Depending on the relief scenario, the goods are divided into goods in transit and disaster area inventory. Goods dispatch and goods delivered, respectively result in increases and decreases in the goods in transit, and goods dispatch and goods consumption, respectively result in increases and decreases in the disaster area inventory.
The demand satisfaction rate is the core evaluation index for this model. Nutrition research has found that when the daily adult energy intake is <70% of the general level for some time, it has an adverse impact on health and can result in malnutrition and various diseases (49). Therefore, the time when satisfaction falls below 70% needs to be paid attention to.
The decision variable is the adjustable quantities in the actual decisions, which are represented by a circle in this model, such as the coordination center delivery decision and the disaster area order decision. The coordination center delivery volume is determined after the information delay by the disaster area order decision and the coordination center order decision.
There are two main NGO sources for relief goods and funds; donations from caring enterprises and people, and government service purchases. For the first source, the direct influencing factor is social donation enthusiasm, which is mainly related to the disaster severity, the number of affected people, and the media attention but can also be affected by government policies (support or restrictions). For instance, the release of Indian government documents improved the fund-raising capacities of local NGOs (50), and in another case study, NGO activities were found to be significantly restricted by a lack of government support (51). The second source of resources and funds is affected by the government's actions.
Therefore, because of donor and government influences, NGOs can experience goods supply discontinuities and uncertainties. Taking into consideration the above characteristics, a donation dimension SFD was built (Figure 8).
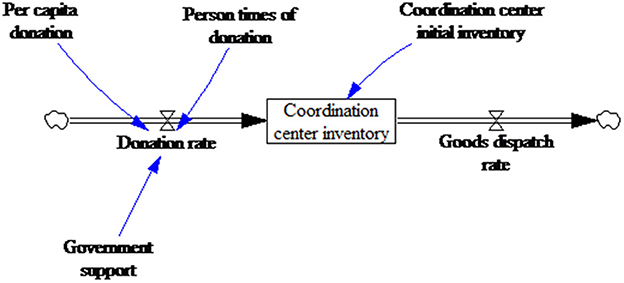
Figure 8. Donation dimension stock and flow diagram.
3.2. Data collection and analysis
Precise time series data are required to develop effective relief goods supply system dynamic models and test the accuracy of the model parameters. The required data were: (1) donation numbers and quantities in the period after the COVID-19 outbreak in Hubei; (2) the number of people affected by the pandemic and the goods consumption rate; and (3) the estimates for the road transport capacity and transportation and information delays.
To find the data for (1), a crawler was applied to the Baidu public donation information disclosure website (https://gongyi.baidu.com/dist/open-info.html) to obtain the donation information related to “COVID-19”, the results from which are shown in Figure 9.

Figure 9. Hubei COVID-19 donation information.
Because of the Hubei lockdown that commenced on January 23 and attracted significant nationwide attention, there was a large number of donations from January 25 to 26. From January 25 to January 27, Baidu launched an “Aid Hubei EPC” fund-raising project, which received a large number of donations from caring people. When the interference of this factor was excluded, after February 1, the donations and the number of people related to COVID-19 peaked within a week and then began to slowly decline. With the input of rescue forces after the pandemic outbreak, the situation was gradually controlled, the demand in the pandemic area reduced, and public attention on COVID-19 gradually weakened, as shown in Figure 9.
Different from a general supply chain, the emergency relief supply chain has urgency and uncertainty characteristics. The relief goods can be divided into two categories: (i) cumulative demand, such as tents and disaster relief equipment, which if not met in time, increases the subsequent demand; and (ii) non-cumulative demand, such as drinking water and food, which is fixed in each time period, that is, the unmet demand does not accumulate.
To find the data for (2), previous studies have examined emergency relief goods demand based on disaster information and historical data (52–54). Because this study was focused on the impact of the dynamic disaster area environment on NGO relief goods supplies, only the non-cumulative demand was considered. Therefore, based on the research, a negative exponential function was used to describe the gradual decline in demand after the emergency, to which a random variable was added to represent the noise, as shown in (1).
When examining the data for (3), because NGO rescues are confronted with road and communication obstacles, the transportation and information delays are generally high. However, as actions are taken to repair the roads, these delays gradually decrease. Therefore, a negative exponential function EXP(−RAMP({slope}, {start}, {finish})) was employed to superimpose the random variables RANDOM UNIFIRM({min}, {max}, {seed}) and describe the changes in the transportation and information delays. Three different delay levels were set to reflect the different emergency types and severities, as shown in Table 2.
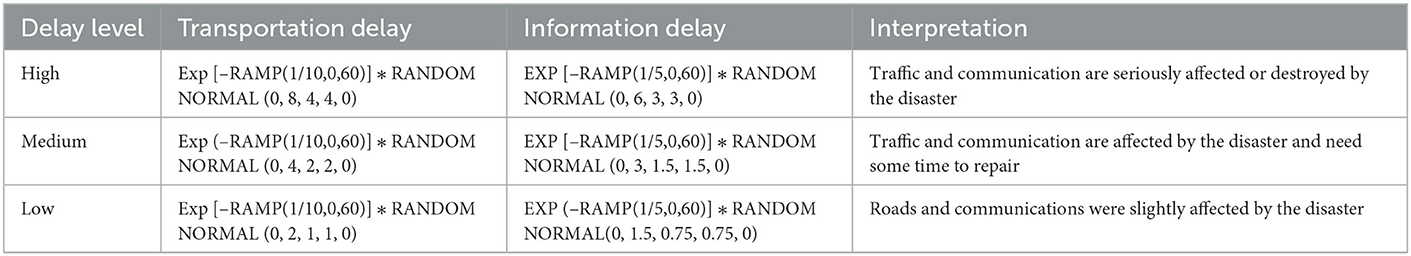
Table 2. Transportation delay and information delay parameter settings.
To study the impact of different government attitudes on NGO relief goods supply, the government's attitudes toward the NGOs' emergency relief were divided into three types: restriction, noninterference, and support; with the respective government support variable values set at −0.5, 0, and 0.5.
4. Results
4.1. Demand simulation
Because different emergencies have different casualty and goods requirements, the needs were divided into low, medium, and high scenarios, the simulation results for which are shown in Figure 10.
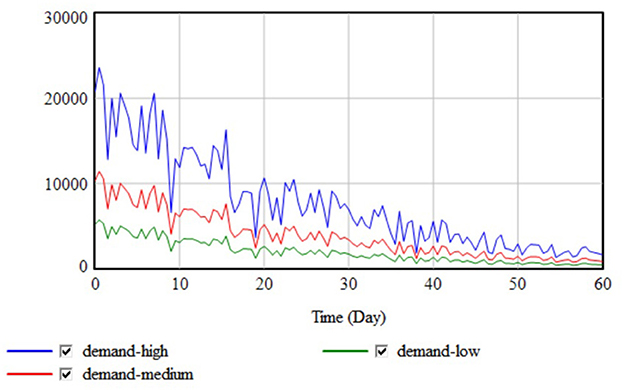
Figure 10. Demand simulation results.
The results showed that the three demand curves all peaked at 0 days and then gradually declined, which aligned with the post-disaster relief goods demand characteristics, that is, the more serious the disaster damage, the higher the demand, and the greater the demand fluctuations caused by secondary disasters.
In the COVID-19 case in Hubei, the wide variety of material types and specifications aggravated the information delay and often resulted in a mismatch between the supply and demand of relief goods. To simplify the model and focus on the supply chain characteristics, only a single type of relief goods was focused on.
4.2. Delay simulation
Based on the data in Table 2, three different transportation and information delays were simulated, with the results shown in Figure 11.
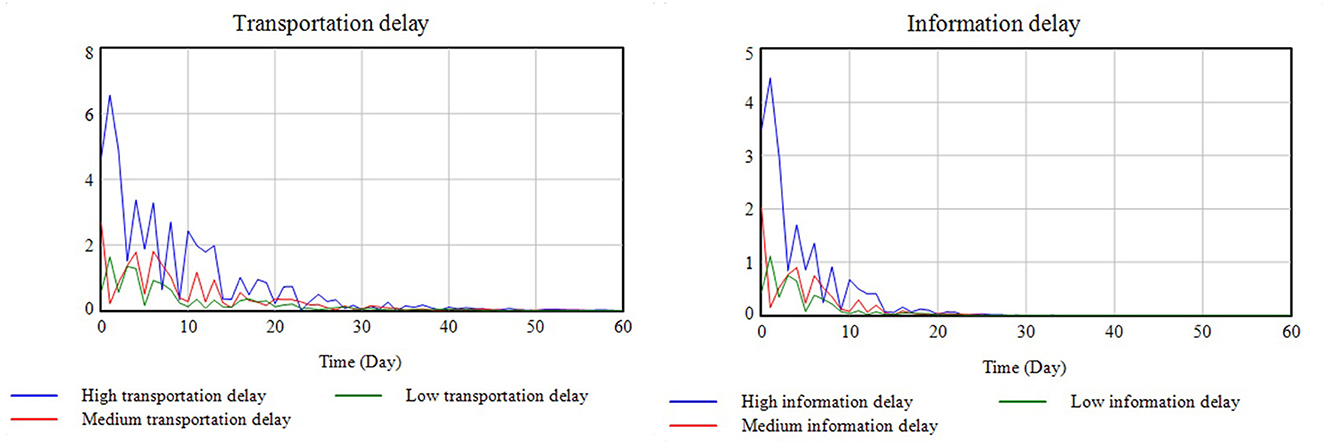
Figure 11. Delay simulation results.
It was found that the change trends in transportation and information delays were basically the same and were only affected by secondary disasters and post-disaster maintenance. However, because communication equipment is easy to replace and less difficult to maintain, the information delay decreased rapidly in the short term after the disaster while the transportation delay decreased more slowly. In the simulated case, COVID-19 was surmised to result in traffic restrictions and increased transportation delays.
The adequacy of NGO funds is also an important factor affecting delays. For example, NGOs can increase transportation capacity and reduce transportation delays by purchasing additional vehicles and can reduce information delays by increasing manpower or equipment inputs. However, during the investigation of the NGOs participating in supplying relief goods during the Hubei 2020 COVID-19 crisis, it was found that the most significant NGO problem was a lack of funds, which meant that the delays did not fall quickly to acceptable levels.
4.3. Supply simulation
(1) Impact of demand fluctuations in the pandemic areas
The NGO relief goods supply simulation results under different dynamic demand levels in the pandemic area are shown in Figures 12A, B.
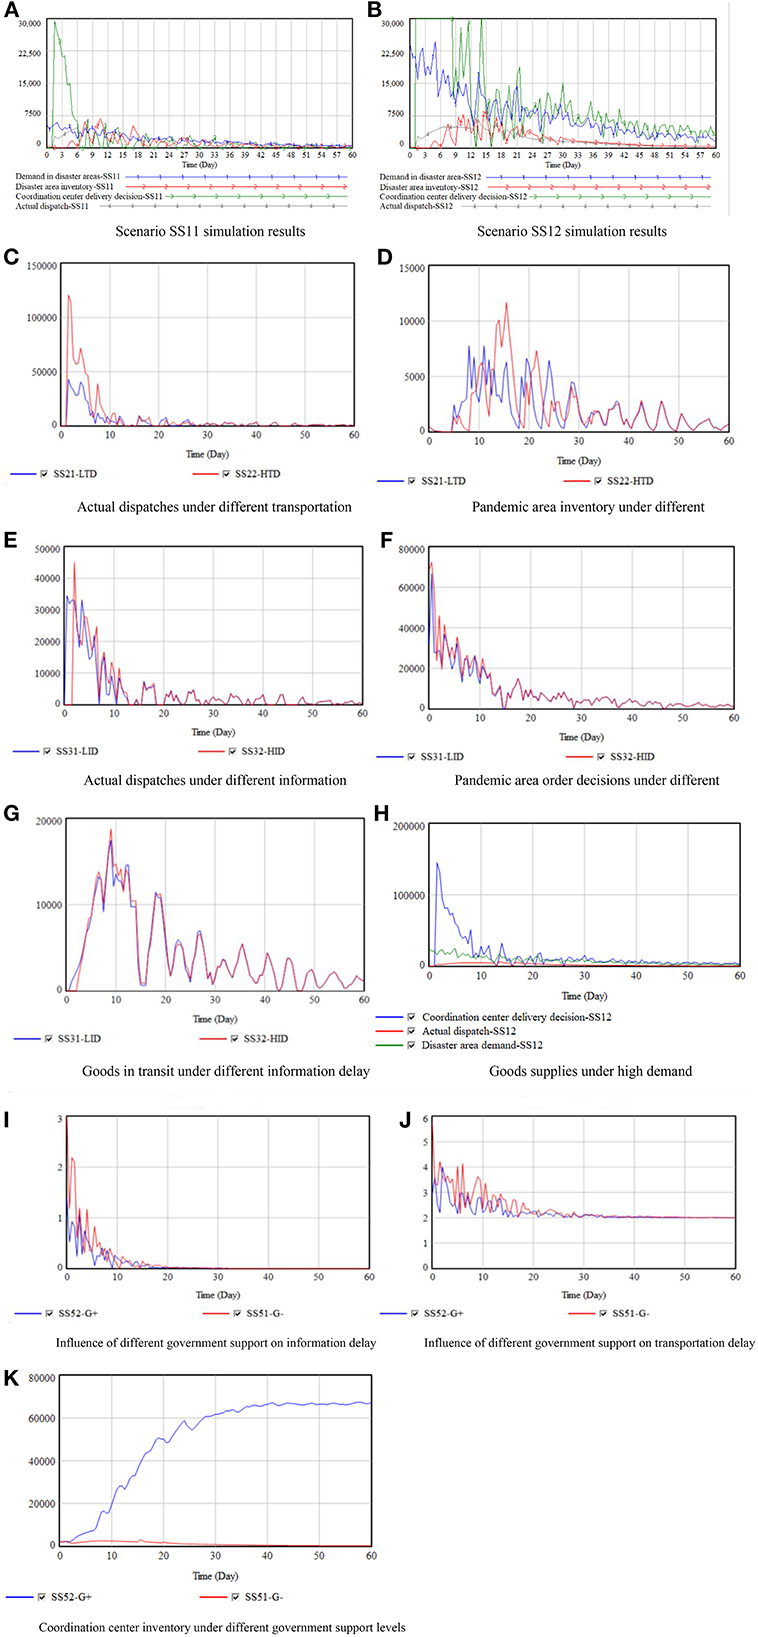
Figure 12. Goods supply simulation results.
Due to the information (medium) and transportation (medium) delays, it was found that the NGOs received information about the relief goods demand in the pandemic area some time after the disaster, which meant the NGO materials were delayed in reaching the pandemic areas, as can be seen by the fluctuations in the curve. Further, because of the long-term nature of the demand and delays, the downstream supply chain fluctuations were amplified compared to the upstream fluctuations, that is, there was a bullwhip effect (55).
When white noise was added to the periodically fluctuating demand, the whole system fluctuated, as shown in Figures 12A, B. This was primarily because of the transportation delays as the demand lag resulted in a decline in inventory, which meant that the actual dispatch volume and demand satisfaction were no longer stable. Compared to the case without white noise (SS01), the total inventory means and variance, respectively increased by 5 and 150%.
With the dynamic changes in demand, the changes in the relief goods supply chain became more complex. When demand dynamically changes, the inventory fluctuates, and the greater the demand fluctuation level, the more intense the shock to the whole system (SS12), and the worse the material supply effect on the system. As shown in Table 3, the supply rate decreased from 57 to 28%, and the total inventory increased by 92%. Even though the demand fluctuated and decreased, the inventory first increased and then decreased, which was due to the following.
(i) The dynamic transportation and information delay changes meant that the expected inventory was no longer stable as the order information was no longer changing regularly with the demand.
(ii) The coordination center was short of goods. Immediately after the emergency, the materials demand reached its peak; however, the insufficient donations led to insufficient inventory at the coordination center to meet the order demands, that is, the system had short supplies in the early stages. As the attention toward the emergency increased, donations increased but demand decreased, which meant that there was a rise in the inventory.
(2) Delay impacts

Table 3. Supply simulation results.
The impacts of the different delays on the relief goods supply system are shown in Figures 12C–G. Note that all other factors are assumed to be at a medium level,
Figure 12C shows that with an improvement in the transportation delay situation, the dispatch increased significantly in the early stage and was relatively consistent in the later stage. This was because the transportation delays decreased over time, which meant that the differences between the two scenarios were also gradually disappearing.
Figure 12D shows the impact of the different transportation delay levels on the inventory in the pandemic areas, indicating that the higher the delay level, the greater the inventory fluctuations, which resulted in goods shortages in the early stage. Table 3 shows that under severe transportation delays, the goods supply rate increased by 1%, and the total inventory increased by 27%.
The simulation results in Figure 12E show that as the information delay increased, the dispatch tended to have more irregular fluctuations, which was because the information delay affected the expected inventory in the pandemic areas, which then affected the order decisions. And the information delays affected the coordination center decisions by affecting the inventory and demand feedback from the pandemic areas.
The information delays also affected the coordination center information regarding the goods in transit. Figure 12G reflects the transit goods backlogs during transportation, which formed a negative feedback loop with the dispatch of the materials, prevented the coordination center from sending excessive materials, and avoided unnecessary congestion. When the information delays increased, the goods in transit also increased, which the results in scenarios SS31 and SS32 in Table 3 also confirmed.
(3) Insufficient supply impacts
In the early emergency relief stage, there was a very large demand for goods in the disaster area, but because inventory had been damaged, there were insufficient supplies. Consequently, it took time for the NGOs to collect the necessary goods, which when complete, were subject to information and transportation delays at the coordination center. In the 2020 Hubei COVID-19 crisis, because there were no reliable procurement channels and the procurement price and quality were difficult to control, it was difficult to convert the raised cash into relief goods. Therefore, the actual dispatch at the initial stage was far less than the demand and available transportation; however, there was better consistency in the latter stages, as shown in Figure 12H.
After February 8, 2020, the goods demand in the pandemic area were basically guaranteed, which was consistent with the simulation results. The 11 emergency scenarios established in this paper indicated that there would be no supply shortages after 20 days. Therefore, the initial goods inventory factor was the main factor affecting demand satisfaction.
(4) Impact of government support
Government support affects the relief goods supply chain by affecting the delay change rate. The government supports NGO emergency relief by sharing information and giving them traffic priority. Therefore, increased government support results in reduced transportation delays and an increase in the efficiency of the goods supply and emergency relief. Increased government support also improves the speed and accuracy of the NGOs' access to information; therefore, an increase in government support results in a reduction in transportation and information delays, as shown in Figures 12I, J.
Second, the government's strict EPC regulations can increase the public's attention on the disaster, which can assist the NGOs to raise funds and acquire materials, that is, the goods supply is promoted. Scenarios SS51 and SS52 (Figure 12K) show the situation when there is full government support and the effect on the goods raised by the NGOs; therefore, government support can have a significant impact on the effectiveness of NGO relief goods collection.
5. Discussion
5.1. Complementary to the simulation results
The results of the research team's investigation in Hubei further confirmed the above simulation results and made supplements to the results.
(1) Effects of delay and use of wechat
Through investigation, delay, especially information delay, had a great negative impact on the efficiency of relief goods supply after the lockdown of Hubei. For example, NGOs have no channels to obtain sufficient relief goods, and the types and models of medical supplies needed in epidemic areas are not clear.
Additionally, in the 2020 Hubei COVID-19 crisis, the popular Chinese social media app “WeChat” played an important demand assessment and goods distribution role, primarily because the NGOs lacked a unified relief goods supply information sharing platform. If this problem were solved, the information delay would have reduced and the transportation efficiency would have significantly improved.
(2) Government influence
Through investigation, the research team found that the NGOs assisting in the Hubei COVID-19 crisis had had significant difficulties because there were no stable, high-quality procurement channels. When many hospitals in Wuhan were reported to be short of medical supplies, the government provided a large number of supplies to NGOs to help alleviate the shortage of supplies in Hubei. So government support will be an effective way to solving this problem. However, the effect of government support is not always significant. For example, the supply effect under government support in scenario SS52 was worse than the supply effect under government non-interference in scenario SS11.
5.2. Policy suggestions
Based on the simulation results, some policy suggestions are given to provide a reference for governments and NGOs when participating in emergency relief goods supply emergencies in the future. When the scale and type of emergency change, the SD model could also be employed to simulate the changed conditions.
(1) Increase the standby emergency relief goods inventories in disaster-prone areas and enhance the relief goods storage resistance capacities to reduce the possible damage to emergency preparedness materials from a disaster. This could effectively deal with the relief goods shortages in the early disaster stage.
(2) A bullwhip effect exists in the supply of NGO relief goods, which becomes more intense and irregular when there are transport and information delays. Therefore, reducing these transportation and information delays is needed to stabilize the system and improve supply efficiency through such means as simplifying approval procedures, establishing integrated information mechanisms, and establishing special roads for emergency supply transport.
(3) In small and medium-sized emergencies, NGOs can play important emergency relief goods supply roles. Governments should support NGO emergency relief operations through policy encouragement and media publicity. However, in large-scale emergencies, the NGOs' roles are smaller as the government undertakes the main emergency relief tasks.
6. Conclusion
Taking the 2020 Hubei COVID-19 crisis as an example, this study conducted SD simulation research on NGO emergency goods supply, from which the following conclusions were drawn.
(1) Secondary disasters cause demand fluctuations in disaster areas, which also have a bullwhip effect on the post-disaster emergency supply chain. Coupled with insufficient funding, the whole system can have large irregular fluctuations.
(2) Dynamic transportation and information delays cause greater system fluctuations and uncertainties. Transportation delays affect inventory by delaying the circulation of goods and influencing decision maker expectations, and information delays affect inventory by influencing disaster information feedback and decision maker expectations. The superposition of these two delays can further amplify system fluctuations and uncertainties.
(3) In all simulated emergency scenarios, it was found that the supply of the goods was sufficient 20 days after the disaster and that the initial inventory at the coordination center played a decisive role in the initial emergency goods supply. If there is a lower initial inventory, there could be chaos or even increased casualties in disaster areas because of the lack of relief supplies.
(4) Government support can significantly reduce transportation and information delays, which in turn can reduce relief goods inventory fluctuations in disaster areas and increase the demand satisfaction rate. However, government support for NGO goods supply was found to be limited. When there is significant disaster damage, the government support impact on supply efficiency was found to be slight.
However, there were some limitations to this study. First, because of its “big government, small society” context, the state-civil society in China is special (46), which also means that NGOs are usually constrained, even though they were fully authorized during the COVID-19 crisis, exploratory research in combination with other countries is needed to assess. Second, the problem structures and environment may change on the different system levels, which means that different methodological choices could be made. However, this study did not conduct a detailed analysis of each system level, which could be a valuable future research direction. Third, long city lockdowns are a rare occurrence; therefore, this research needs to be extended to other types of emergency scenarios, such as local wars or other humanitarian crises, to examine the differences.
Data availability statement
The raw data supporting the conclusions of this article will be made available by the authors, without undue reservation.
Author contributions
YL determined the research contents and methods, reviewed the manuscript, and provided fund support for the research. YW prepared Figures 1–12. All authors wrote the main manuscript text.
Funding
This research was supported by the National Natural Science Foundation of China (Grant Nos. 72274131 and 71704124), the Major Bidding Program of National Social Science Foundation of China (No. 22&ZD142), and the Research Funding of Sichuan University (Grant Nos. 2018hhf-43 and 2020skjd-py04).
Conflict of interest
The authors declare that the research was conducted in the absence of any commercial or financial relationships that could be construed as a potential conflict of interest.
Publisher's note
All claims expressed in this article are solely those of the authors and do not necessarily represent those of their affiliated organizations, or those of the publisher, the editors and the reviewers. Any product that may be evaluated in this article, or claim that may be made by its manufacturer, is not guaranteed or endorsed by the publisher.
References
1. EM-DAT. (2022). The International Disaster Database. Available online at: http://www.emdat.be/ (accessed August 1, 2022)
2. Guha-Sapir D, Hoyois P, Wallemacq P, Below R. Annual Disaster Statistical Review 2016 the Numbers and Trends. Centre for Research on the Epidemiology of Disasters. (2017).
3. Altay N, Green IIIWG. OR/MS research in disaster operations management. Eur J Oper Res. (2006) 175:475–93. doi: 10.1016/j.ejor.2005.05.016
4. Ergun Ö, Gui L, Heier Stamm JL, Keskinocak P, Swann J. Improving humanitarian operations through technology-enabled collaboration. Product Operat Manage. (2014) 23:1002–14. doi: 10.1111/poms.12107
5. Liu C, Fang D, Zhao L. Reflection on earthquake damage of buildings in 2015 Nepal earthquake and seismic measures for post-earthquake reconstruction. Structures. Amsterdam: Elsevier (2021). doi: 10.1016/j.istruc.2020.12.089
6. Paul SK, Chowdhury P. A production recovery plan in manufacturing supply chains for a high-demand item during COVID-19. Int J Phys Distribut Logistics Manage. (2020) 51:104–25. doi: 10.1108/IJPDLM-04-2020-0127
7. Briskorn D, Kimms A, Olschok D. Simultaneous planning for disaster road clearance and distribution of relief goods: a basic model and an exact solution method. OR Spectrum. (2020) 42:591–619. doi: 10.1007/s00291-020-00589-7
8. Beamon BM, Balcik B. Performance measurement in humanitarian relief chains. Int J Public Sector Manage. (2008) 21:4–25. doi: 10.1108/09513550810846087
9. Naor M, Dey A, Meyer Goldstein S, Rosen Y. Civilian-military pooling of health care resources in Haiti: a theory of complementarities perspective. Int J Prod Res. (2018) 56:6741–57. doi: 10.1080/00207543.2017.1355121
10. Wang Z, Zhang J. Agent-based evaluation of humanitarian relief goods supply capability. Int J Disaster Risk Reduct. (2019) 36:101105. doi: 10.1016/j.ijdrr.2019.101105
11. Chen Y. Relief goods distribution problem: considering donation strategies, fairness, and interventions. Progress Disaster Sci. (2021) 12:100198. doi: 10.1016/j.pdisas.2021.100198
12. Chen Y, Zhao Q. Donation-based relief goods distribution problem. Comput Ind Eng. (2021) 152:106990. doi: 10.1016/j.cie.2020.106990
13. Eikenberry AM, Arroyave V, Cooper T. Administrative failure and the international NGO response to Hurricane Katrina. Public Adm Rev. (2007) 67:160–70. doi: 10.1111/j.1540-6210.2007.00825.x
14. Wilkinson O. ‘Faith can come in, but not religion': secularity and its effects on the disaster response to Typhoon Haiyan. Disasters. (2018) 42:459–74. doi: 10.1111/disa.12258
15. Xu J, Xu D, Lu Y, Wang Q. A bridged government–NGOs relationship in post-earthquake reconstruction: the Ya'an service center in Lushan earthquake. Natural Hazards. (2018) 90:537–62. doi: 10.1007/s11069-017-3056-3
16. Bankoff G, Hilhorst D. The politics of risk in the Philippines: comparing state and NGO perceptions of disaster management. Disasters. (2009) 33:686–704. doi: 10.1111/j.1467-7717.2009.01104.x
17. Benson C, Twigg J, Myers M. NGO initiatives in risk reduction: an overview. Disasters. (2001) 25:199–215. doi: 10.1111/1467-7717.00172
18. Luna EM. Disaster mitigation and preparedness: the case of NGOs in the Philippines. Disasters. (2001) 25:216–26. doi: 10.1111/1467-7717.00173
19. Sakamoto M. The rise of NGOs/NPOs in emergency relief in the great east Japan earthquake. Japan Social Innovat J. (2012) 2:26–35. doi: 10.12668/jsij.2.26
20. Shaw R. The role of nongovernmental organizations in earthquake disaster management: an Asian perspective. Reg Dev Dialogue. (2003) 24:117–29.
21. Telford J, Cosgrave J, Houghton R. Joint Evaluation of the International Response to the Indian Ocean Tsunami: Synthesis Report. London: Tsunami Evaluation Coalition (2006).
22. Alem D, Clark A, Moreno A. Stochastic network models for logistics planning in disaster relief. Eur J Oper Res. (2016) 255:187–206. doi: 10.1016/j.ejor.2016.04.041
23. Najafi M, Eshghi K, de Leeuw S. A dynamic dispatching and routing model to plan/re-plan logistics activities in response to an earthquake. OR Spectrum. (2014) 36:323–56. doi: 10.1007/s00291-012-0317-0
24. Cao C, Li C, Yang Q, Liu Y, Qu T. A novel multi-objective programming model of relief distribution for sustainable disaster supply chain in large-scale natural disasters. J Clean Prod. (2018) 174:1422–35. doi: 10.1016/j.jclepro.2017.11.037
25. Singh RK, Gupta A, Gunasekaran A. Analysing the interaction of factors for resilient humanitarian supply chain. Int J Prod Res. (2018) 56:6809–27. doi: 10.1080/00207543.2018.1424373
26. Campbell AM, Vandenbussche D, Hermann W. Routing for relief efforts. Transp Sci. (2008) 42:127–45. doi: 10.1287/trsc.1070.0209
27. Rabta B, Wankmüller C, Reiner G. A drone fleet model for last-mile distribution in disaster relief operations. Int J Disaster Risk Reduct. (2018) 28:107–12. doi: 10.1016/j.ijdrr.2018.02.020
28. Tatham P, Blecken A. Supply chain process modelling for humanitarian organizations. Int J Phys Distribut Logistics Manage. (2010) 40:675–92. doi: 10.1108/09600031011079328
29. Arboleda CA, Abraham DM, Lubitz R. Simulation as a tool to assess the vulnerability of the operation of a health care facility. J Performance Construct Facilities. (2007) 21:302–12. doi: 10.1061/(ASCE)0887-3828(2007)21:4(302)
30. Park M, Ji S-H, Kim W, Lee H-S. Strategies for design-build in Korea using system dynamics modeling. J Construct Eng Manage ASCE. (2009) 135:1125–1137. doi: 10.1061/(ASCE)CO.1943-7862.0000095
31. Olivares-Aguila J, ElMaraghy W. System dynamics modelling for supply chain disruptions. Int J Prod Res. (2021) 59:1757–75. doi: 10.1080/00207543.2020.1725171
32. Xu J, Rao R, Dai J. Risk perception–based post-seismic relief supply allocation in the Longmen Shan fault area: Case study of the 2013 Lushan earthquake. Human Ecol Risk Assess Int J. (2016) 22:825–44. doi: 10.1080/10807039.2015.1115955
33. Allahi F, De Leeuw S, Sabet E, Kian R, Damiani L, Giribone P. A Review of System Dynamics Models Applied in social and Humanitarian Researches. (2018).
34. Leung K, Wu JT, Liu D, Leung GM. First-wave COVID-19 transmissibility and severity in China outside Hubei after control measures, and second-wave scenario planning: a modelling impact assessment. Lancet. (2020) 395:1382–93. doi: 10.1016/S0140-6736(20)30746-7
35. Tian H, Liu Y, Li Y, Wu CH, Chen B, Kraemer MU, et al. An investigation of transmission control measures during the first 50 days of the COVID-19 epidemic in China. Science. (2020) 368:638–42. doi: 10.1126/science.abb6105
36. Li R, Lu Y. Volunteer community service providers during the COVID-19 crisis response in China: What are their personal needs and how to respond? J Contingencies Crisis Manage. (2022) 1–13. doi: 10.1111/1468-5973.12426
37. Hu M, Sidel M. Civil Society and COVID in China: Responses in an authoritarian society. Nonprofit Voluntary Sector Quarterly. (2020) 49:1173–81. doi: 10.1177/0899764020964596
38. O'Leary P, Tsui M-S. Ten Gentle Reminders to Social Workers in the Pandemic. London, England: SAGE Publications (2020). doi: 10.1177/0020872820918979
39. Cheng Y, Yu J, Shen Y, Huang B. Coproducing responses to COVID-19 with community-based organizations: lessons from Zhejiang Province, China. Public Adm Rev. (2020) 80:866–73. doi: 10.1111/puar.13244
40. Min S, Zhang X, Li G. A snapshot of food supply chain in Wuhan under the COVID-19 pandemic. China Agricultural Econ Rev. (2020) 12:689–704. doi: 10.1108/CAER-04-2020-0056
41. Wang X, Zhang X, He J. Challenges to the system of reserve medical supplies for public health emergencies: reflections on the outbreak of the severe acute respiratory syndrome coronavirus 2 (SARS-CoV-2) epidemic in China. Biosci Trends. (2020) 14:3–8. doi: 10.5582/bst.2020.01043
42. Arnold RD, Wade JP. A definition of systems thinking: a systems approach. Procedia Comput Sci. (2015) 44:669–78. doi: 10.1016/j.procs.2015.03.050
43. Sopelana A, Kunc M, Hernáez OR. Towards a dynamic model of organisational flexibility. Syst Practice Action Res. (2014) 27:165–83. doi: 10.1007/s11213-012-9274-4
44. Feofilovs M, Romagnoli F. Dynamic assessment of urban resilience to natural hazards. Int J Disaster Risk Reduct. (2021) 62:102328. doi: 10.1016/j.ijdrr.2021.102328
45. Sterman JD. Modeling managerial behavior: Misperceptions of feedback in a dynamic decision making experiment. Manage Sci. (1989) 35:321–39. doi: 10.1287/mnsc.35.3.321
46. Lu Y, Zhan C, Li R, Su M. An NGO disaster relief network for small and medium-scale natural hazards in China. Natural Hazards. (2021) 106:2689–709. doi: 10.1007/s11069-021-04560-9
47. Espia JCP, Fernandez P. Insiders and outsiders: local government and NGO engagement in disaster response in Guimaras, Philippines. Disasters. (2015) 39:51–68. doi: 10.1111/disa.12086
48. Xu J, Dai J, Rao R, Xie H, Lu Y. Critical systems thinking on the inefficiency in post-earthquake relief: a practice in Longmen Shan fault area. Syst Practice Action Res. (2016) 29:425–48. doi: 10.1007/s11213-016-9374-7
49. Temple NJ. Survey of nutrition knowledge of Canadian physicians. J Am Coll Nutr. (1999) 18:26–9. doi: 10.1080/07315724.1999.10718823
50. Garain S. Government-NGO interface in India: an overview. Indian J. Social Work. (1994) 55:337–337. doi: 10.1007/BF02112470
51. Scott K, George AS, Harvey SA, Mondal S, Patel G, Vr R, et al. Government helper and citizen advocate? A case study of the multiple roles and pressures facing a nongovernmental organization contracted by government to strengthen community health in northern India. Int J Health Plann Manage. (2018) 33:391–404. doi: 10.1002/hpm.2473
52. Chen F, Chen J, Liu J. Forecast of flood disaster emergency material demand based on IACO-BP algorithm. Neural Comput Appl. (2022) 34:3537–49. doi: 10.1007/s00521-021-05883-1
53. Sheu J-B. Dynamic relief-demand management for emergency logistics operations under large-scale disasters. Transp Res Part E Logistics Transp Rev. (2010) 46:1–17. doi: 10.1016/j.tre.2009.07.005
54. Wang Z-X. A genetic algorithm-based grey method for forecasting food demand after snow disasters: an empirical study. Nat Hazards. (2013) 68:675–86. doi: 10.1007/s11069-013-0644-8
Keywords: COVID-19, relief goods supply, NGO (non-governmental organization), system dynamic (SD) model, emergency relief
Citation: Lu Y and Wang Y (2023) Dynamic analysis of NGO emergency relief goods supply: 2020 Hubei COVID-19 as a case. Front. Public Health 11:1037846. doi: 10.3389/fpubh.2023.1037846
Received: 06 September 2022; Accepted: 18 January 2023;
Published: 07 February 2023.
Edited by:
Krzysztof Goniewicz, Polish Air Force University, PolandReviewed by:
Gang Sun, Johns Hopkins University, United StatesMario Ciccotti, Military Pharmaceutical Chemical Plant, Italy
Copyright © 2023 Lu and Wang. This is an open-access article distributed under the terms of the Creative Commons Attribution License (CC BY). The use, distribution or reproduction in other forums is permitted, provided the original author(s) and the copyright owner(s) are credited and that the original publication in this journal is cited, in accordance with accepted academic practice. No use, distribution or reproduction is permitted which does not comply with these terms.
*Correspondence: Yi Lu,  luyiscu@scu.edu.cn