 Peng Zeng1
 Weixing Xu
 Yuanyuan Guo
- 1School of Architecture, Tianjin University, Tianjin, China
- 2School of Architecture & Fine Art, Dalian University of Technology, Dalian, China
- 3College of Intelligence and Computing, Tianjin University, Tianjin, China
China's metro system is developing rapidly. Walking is the most frequently adopted mode to connect to the metro, the attributes of the pedestrian-built environment around the stations directly influence people's willingness to use the metro. However, few studies have paid attention to the comprehensive assessments of the built environment in the metro catchment area. Thus, this paper attempts to construct a walkability evaluation model that combines subjective and objective perspectives. We collected field data of the built environment factors affecting on walkability in the 800 m buffer zone of eight case metro stations in Dalian city, China. We also collected on-site interviews from 867 passengers to evaluate the walkability. A machine learning-based approach was developed to calculate the weights of walkability variables, followed by constructing a Score-Effectiveness framework to identify the built environment factors in the metro catchment area that need to be improved. The study found that the shading facilities, obstacle barriers, and resting seats around pedestrian walkways are the most efficient and imbalanced variables recognized by the crowd. The convenience of overpasses and underpasses are additional efficient imbalance-type variables for leisure and commuting populations, respectively. This indicates that the current level of construction of the above five built environment factors is relatively low, but the construction has a significant impact on the degree of friendliness in supporting pedestrian walkability. In this paper, improvement measures are proposed in a targeted manner in order to achieve the effect of effectively improving the current level of metro catchment area's walkability. The results of the study can provide references to provide strategies for precise pedestrian planning in the metro catchment area, leading to a pedestrian environment with high walking quality.
Introduction
The metro is featured with safety and punctuality, leading to an advantage of avoiding congestion caused by uncertainty compared to other modes of ground transportation. Thus, an increasing number of travelers choose the metro as their primary mode of transportation. The popularity of the metro has led to a rapid increase in pedestrian flow within the catchment area, which in turn has triggered changes in land values and has had a positive impact on housing prices around the stations (1). Even the impact of the COVID-19 epidemic does not jeopardize the price trend of real estate, indicating that the metro has a strong appeal to people (2). At the same time, the metro itself and its combination with other modes of transportation can significantly reduce urban carbon emissions, improve air quality, reduce noise caused by traffic, and promote the physical activity of travelers (3–6). In the context of calling for carbon neutrality in various countries around the world, metro transportation is a strong pillar of sustainable transportation systems. In light of this, effectively guiding travelers' shift from individual motorized transport to transit transportation is the major challenge for sustainable urban transport development in the future faced by planners and policymakers (7–9). By the end of 2021, 48 cities in mainland China have opened metros, with an operational mileage of 7209.7 km, ranking first in the world and showing an increase of 14.8% compared to 2019. The increasing number indicates that China is currently in a period of rapid development of metro transit, and the metro is becoming more and more prominent in China's urban transportation system.
As the most frequently used mode of transportation, walking usually possesses a higher level of satisfaction compared to public transportation and automobiles (10). Improving the pedestrian environment around metro stations will encourage people in the vicinity of the station to walk to the station instead of using other transport modes (11), but travelers are also limited by the time spent and the distance traveled within a certain range (12, 13). Yet, when the purpose of the trip is clear, travelers may also undertake more walking distance and walking time (14). In this sense, the improvement of the walking environment in the metro catchment can fit with the primary goal of Transit Oriented Development (TOD), which aims to create pedestrian-friendly and livable communities that are closely linked to public transit stations (15). Related results highlight that the pedestrian friendliness of the built environment around a site affects people's choice of travel mode, and improving walkability will significantly increase the likelihood that travelers will choose to walk to the site (16). Nevertheless, how the subjective and objective built environment factors of the current situation affect the walkability of the metro catchment areas these factors have not been fully explored (17).
Furthermore, by taking eight metro stations in Dalian, China as a case study, this study attempts to establish a comprehensive framework for the evaluation of the walking environment of the metro catchment area. The framework combines the subjective environmental perception of pedestrians and the objective environmental accessibility of the metro catchment area. In the framework, a machine learning-based approach is developed to systematically identify the weight of key factors that affect the walkability of metro catchment areas. It is expected that the development framework can provide policymakers and planners with references to form strategy directions for improving the walkability environment of metro catchment areas.
The remainder of this paper is organized as follows. Section Literature review presents the review work on the concept of walkability, followed by an overview of influencing factors of walkability, methods of walkability evaluation, and walkability in the metro catchment areas; Section Data introduces the study area, data collection, and description; Section Methodology describes the idea of evaluating the walkability of metro catchment areas, including the introduction of a new method of machine learning; Section Results explains the statistical and modeling results, followed by Section Discussion which holds the discussion and offers policy and practice implications; Section Conclusion concludes the paper and summarizes research limitations.
Literature review
Walkability and influencing factors
Walkability refers to the ability of humans to walk (18). In previous studies, several scholars and experts have proposed different definitions of walkability from various research perspectives. In the field of urban planning, walkability means the degree to the features of the built environment that are friendly to residents' living, commuting, shopping, and leisure (19). In other words, it means how pedestrian-friendly the urban space is (20), and thus, walkability is frequently used to assess the friendliness of walking in an area (21) and then to promote the active behavior of walking (22). Walkability is also considered to be one of the basic criteria of urban planning to counteract urban sprawl by creating good walkable areas for different activities and services (23). In the field of public health, friendly walkable areas can serve as a mental incentive for people to actively take up walking, which can effectively prevent cardiovascular diseases and enhance physical and mental health (24). In addition, scholars in geography have used detailed traffic data to understand the relationship between the built environment and walking behavior (25). By reviewing previous related studies, walkability in this study is defined as the degree to which the built environment allows walking (26) and encourages people to walk in a friendly manner (20, 22). Usually, areas with high walkability can encourage people to increase their subconscious maximum walking distance (27). Thus, improving pedestrian infrastructure in the metro catchment area can strengthen the willingness of travelers to connect to the metro by walking and effectively increase ridership (28).
The built environment factors that influence walkability are multifaceted and can be broadly divided into mesoscale neighborhood factors and microscale pedestrian factors. The former are mainly presented at the neighborhood or community level, such as street connectivity, residential density, and the mix of land uses associated with daily use facilities (29–33). The latter places more emphasis on walkability, focusing on the real pedestrian experience, such as street furniture, walkway width and quality, and other micro factors that affect pedestrian perception and experience (34, 35).
Although most studies have used mesoscale walkability as a research lens, few scholars hold to argue that built environment factors, such as neighborhood size, street network density, and community-level facility diversity, do not reflect how pedestrian-friendly facilities are (36). Also, factors that present positive effects at the mesoscale may even become negative at the microscale, such as road intersection density. For instance, a higher road intersection density represents better connectivity (31, 37). On the contrary, at the microscopic level, the increase in the density of roadway intersections may cause safety concerns due to frequent street crossings (35). As a result, increasing attention has been paid to walkability studies at the microscopic scale, which can truly depict the conditions of the pedestrian-built environment (36). Recent studies on the built environment affecting walkability have focused on walking paths, sidewalks, and lighting at the microscopic scale (32, 35). Walkable areas should also be enhanced with urban imagery such as historic buildings and public artwork, all of which can improve the quality of the pedestrian environment (38). As such, the walkability of an area is largely influenced by the built environment, such as pedestrian trail facilities and pedestrian services (39).
Walkability evaluation
Evaluating how pedestrian friendly an area is can be divided into two perspectives: a subjective or an objective evaluation. People living in the same built environment may exhibit different willingness to travel due to their individual judgments on the walkability of potential routes (40, 41). As such, the spatial experience of the walking process (42) affects the characteristics of their trips (43).
Subjective methods to evaluate walkability are usually based on questionnaires to obtain pedestrians' subjective perceptions of the built environment, such as the Neighborhood Environment Walkability Scale (NEWS), Semantic Differential (SD), Public Life in Public Space (PLPS), Neighborhood Quality of Life Study (NQLS) and Pedestrian Environment Review System (PERS) (44–46). Among them, the NEWS is a widely adopted method for subjective evaluation on walkability (47). The assessment variables involve with several dimensions such as comfort, safety, and convenience (43). The assessment of the quality of the street environment captures people's perceptions of the pedestrian environment (48), including pedestrians' opinions on the aesthetics of the surrounding built environment, pedestrian traffic safety, social crime safety, or neighborhood satisfaction (49).
Studies evaluating walkability by objective methods typically construct multiple environmental variables (50), which are then integrated and calculated to obtain a score value to measure walkability (51). Various types of examples, walkability index, which helps to quantitatively measure walkability, have been proposed by many scholars (52, 53). Particularly, Walk Score is the most popular and commonly used quantitative tool for objectively calculating walkability degree. The tool was introduced in 2007 by a US company to promote walkable communities and has become popular among real estate agents to promote walkable urban areas. The Walk Score considers the vicinity of different facilities via walking by taking into account the attenuation effects due to walking distance, intersection density, and block length (54). However, some scholars point out that the definition, classification, and importance of facilities as well as the raster-based distance decay pattern may differ among different urban regions. This also leads to the problem of non-comparability of walk scores in different regions, especially in high-density Asian regions that differ significantly from North America (28). For example, Hino et al. developed the Japanese Walkability Index (JWI) to measure walkability in cities based on the high-density urban structure of Yokohama. Since the JWI preferentially considers amenities, road networks, and land prices rather than density variables, it is superior for high-density Asian cities (55). Moreover, the European urban context is distinctive from that of US, which featured with low population density, low land use mix, and connectivity. To obtain a walkability index more in line with the European urban context, European scholars adjusted the choice of environmental variables and the size of weights in the walkability index. For example, Grasser et al. (25) used population density, household density, land use mix entropy index, and three-way cross density to construct a walkability index that fits the European regional context.
Moreover, it has been shown that Walk Score presents a positive correlation with both objective built environment factors (29) and the subjective perceived built environment factors (56–60). This suggests that the Walk Score should consider the effect of individual's perception, rather than only deriving from objective evaluation. Actually, the pedestrian experience during walking also plays a corresponding role in promoting or inhibiting walking, such as the degree of sidewalk continuity, safety during walking (61), and sidewalk quality (35).
Walkability of the metro catchment area
The concept of walkability is used by Dutch scholars to explain the link between the built environment and walking as an important component of TOD (37). Current policies also tend to promote a shift to non-motorized and public transportation (62, 63). However, improving the efficiency of public transportation alone is not enough to improve the ridership of public transportation. Enhancing the availability of public transportation (i.e., metro transit) via walking is also essential for promoting the public transport usage. Obviously, inadequate walkability around transit stations may reduce the patronage of the metro (28, 64). For instance, scholars in Italy have shown that public transportation in the country is currently inefficient and unreliable because the built environment in the vicinity of a station is not friendly enough for people to walk, including factors such as insecurity for pedestrian safety, low-quality sidewalks, and impassability due to the presence of obstacles on the sidewalk (35). In addition, the level of walkability in the metro catchment area is significantly and positively correlated with the probability of choosing to walk to and from the station. The study on metro passenger transfer modes by Wu et al. (65) showed that the quality of the pedestrian environment in the metro catchment area was positively related to the probability of passengers choosing walking as a transfer mode. In a medium-sized urban context in Colombia, Arellana et al. (66) also argue that the walkability and friendliness of the built environment, such as sidewalk condition and attractiveness, play an important role in pedestrian travel mode decisions.
Although poor walkability has a debilitating effect on people's willingness to use the metro, the adoption of walkable connections to stations has not yet received enough attention (67). Factors affecting metro catchment area walkability can be divided into mesoscale and microscale. Most previous studies on walkability have focused on built environment factors at the mesoscale, including land use diversity (68), density (69, 70), street design (71), connectivity (72), distance, and accessibility within the metro catchment (73). However, most of the studies are deficient in assessing pedestrian perceptibility of the walking environment at the microscopic scale. Microscopic factors of the built environment have an important influence on the walkability around metro stations (73), which can either facilitate or inhibit pedestrians (74). Moreover, the level of walkability also correlates to an individual's satisfaction with the perceived built environment (75, 76), including the quality and continuity of sidewalks (28), lighting (77), and the degree of obstruction on the walkway (78). Additionally, factors that are essentially subjective in nature, such as the degree of sidewalk cleanliness, social security around the station, traffic safety, and signage, are also found to have an impact on the walkability of the metro catchment area (79, 80).
In summary, although previous methods of evaluating walkability have involved objective spatial factors and subjective psychological factors, few studies have yet been conducted to combine subjective and objective evaluation variables. Meanwhile, the traditional methods of weight determination include correlation analysis and regression analysis, but they involve different subjective and objective dimensions. Further, such methods of pre-determined functional relationships may bring bias in the results. In addition, previous studies have not adequately combined the current built environment of the metro catchment areas with its importance to walkability, which is not conducive to accurately exploring the current shortcomings of the metro catchment area's walkability.
Data
Study area
Dalian, a tourist-oriented city, has a population of about 598.7 million and achieved a GDP of ~703.04 billion RMB by the end of 2020. Dalian opened its first metro line in May 2003, making it the sixth city in mainland China with the operated metro system. As of December 2021, five lines have been put into operation with 201.03 km and 77 stations. The metro was widely used by commuters with an annual passenger volume of ~156 million passengers and an average daily passenger volume of about 426.6 thousand passengers. Due to the transportation needs of foreign tourists and residents, Dalian Metro plays a very important role in passenger transportation.
This study is to investigate the influence of the built environment on the walkability of a metro catchment area, focusing on the environmental perception and the objective supportiveness of the built environment. Therefore, the location and function of the metro station itself are used as the two bases for the classification of metro stations, so that the selected stations are more typical. Additionally, the central city is treated as our study area due to a large proportion of pedestrian connections and the dense distribution of metro lines. A large number of pedestrian flows can ensure the diversity of basic attributes such as social characteristics and the travel purposes of pedestrians. To effectively reflect the variability of the pedestrian environment of the catchment areas, eight stations, namely, Dalian Railway Station (DR-S), Harbor Square (H-S), South China Square (SC-S), Exhibition Center (E-C), Tsingniwa Bridge (TNW-B), Xi'an Road (XA-R), Friendly Square (F-S), and Zhongshan Square (ZS-S), were selected as the sampled stations. These stations can be divided into several types on the basis of their functions related to land use, including residential-dominated, commercial centers, transportation hubs, and landscape open types (Table 1).
Table 1. Overview of research sites.
In addition, previous studies on the walkability of the station usually use the buffer zone with 800-m radius as the catchment area of metro station (17, 81). Meanwhile, the Chinese official Guidelines for Planning and Designing Areas along Urban Railways specify that the rail impact area is the region that is about 500–800 m away from the station, within 15 min walking distance to the station entrance. Therefore, the area within 800 meters radius of the station (i.e., 10 min of walking time) is taken as the built environment background area for assessing walkability (Figure 1).
Figure 1. Case site location map.
Data
Two types of data were used in this study: (1) objective measurement of the built environment of the metro catchment area and (2) subjective perceptions of the walkability of the metro catchment area. Objective data such as pedestrian paths within the built environment were obtained through web-based big data, street maps, and field observations. The subjective perception data was collected by distributing a questionnaire to respondents and quantifying the results with the help of the five-scale Likert approach. The variables in the questionnaire were selected based on the relevant built environment factors affecting station walkability as mentioned above, with consideration of previously studied sidewalk assessment tools (74) and sidewalk levels of service (76). The questionnaire was initially tested among 10 graduate students and reviewed by experts in the field, followed by several modifications on the basis of feedback. In addition, 29 micro-scale built environment factors that promote or inhibit the walkability of the metro catchment area were selected, taking into account the distinctive characteristics of Dalian as a local tourist city. The factors were classified according to their characteristics and hierarchical structure into six design qualities: connectivity, convenience, safety, comfort, pleasure, and diversity (Table 2).
Table 2. Built environment variable attributes.
Survey
The questionnaire and field survey was conducted from August 2021 to March 2022. The field survey was divided into two parts: pre-survey and formal survey. The format, clarity, and wording of the content of the questionnaire were improved through a pre-survey of 30 respondents who randomly distributed the questionnaire. The content of the questionnaire was divided into three parts: basic personal information, travel characteristics, and pedestrian satisfaction with the built environment of the metro catchment area. Personal characteristics included information on gender, age, occupation, monthly income, and home address. The travel characteristics include the purpose of travel, the number of trips per week by metro, and the feeder modes of connecting to metro stations. The final part of the questionnaire collected respondents' subjective satisfaction with the built environment factors of the station area. During the formal research process, the familiarity of the metro catchment area was identified on the spot by asking respondents in advance if they frequently traveled to and from the area by metro. Thus, the questionnaires obtained for this study were representative of respondents who regularly take the metro for various purposes and more than two times per week. The researchers distributed a total of 867 questionnaires in clear weather on weekdays and weekends, respectively, with a valid sample size of 800 and an effective rate of 92.3%, of which 486 questionnaires were collected on weekdays, accounting for 60.8%.
According to the statistics of personal attributes in Table 3, the gender ratio of the respondents was ~50%. Teenagers and middle-aged people make up the majority of the total population. Nearly half of the respondents are commuters, followed by students. This shows the importance of the passengers who take the metro to work and school. Regarding income, most of the respondents are in the middle class, with 27.1% of the respondents in the 2,000–5,000 range and 30.8% in the 5,000–8,000 range. In addition, respondents take the metro about 4 times a week on average. 60.6% of the respondents choose walking as the mode to connect to the metro, which further demonstrates the validity of the sample. The purpose of travel is mainly shopping and dining, accounting for 39.9% of the total, followed by commuting to work, going home, and taking a leisurely walk, accounting for 29.1 and 20.8%, respectively. In summary, the survey sample has good representativeness in terms of both personal information and travel characteristics.
Table 3. Basic attributes statistics table.
Methodology
A total of 867 valid questionnaires were generated during the research. Based on the available data collected, this study designs a machine learning-based prediction algorithm to assign weight to the variables. The algorithm consists of two modules: principal component analysis (PCA) and feedforward neural network.
Among them, PCA can effectively reduce the dimensionality of different types of data while maintaining multiple variations in data samples. It helps to eliminate the multicollinearity that destroys the statistical significance of independent variables in the data set, thus making the statistical results more accurate. At the same time, the value relationships among multiple data are explained more clearly by assigning variable weight labels. We use PCA to reduce the training time and avoid overfitting problems. When implementing PCA, our model's input is the original data, PCA transforms the data to a new subspace. Then we feed the output to the feedforward neural network. We designed the feedforward neural network with four fully-connected layers with 29, 128, 64, and 29 nodes in each layer. The feedforward neural network learns the relationship between the input and output manually. We use Adam Optimizer to train the feedforward model because Adam can tune the learning rates automatically. To compare the difference between the prediction and groundtruth. We leverage the MSE loss function. To get a stable neural network model, we train our model for 250 epochs. We can see from Figure 3, the model is stable when it is trained more than 50 epochs. The machine learning-based variable weight prediction algorithm effectively combines the objective and subjective to eliminate the scale effect and assign more objective weight to the variables. Based on the collected data, the correlation between different kinds of variables is explored with the help of PCA, the feedforward neural network is utilized to learn the weights variation of each variable with the guiding of the weights generated by PCA. Compared with the traditional correlation analysis and regression analysis, it effectively enhances the robustness of weight prediction and makes the research results of weights have the obvious advantages of being more objective and having higher credibility.
The weight of the variable represents the degree of the effect of the pedestrian environment factor on the walkability of the metro catchment area, and some variables even have a critical role. It is reasonable to discover the current problems and directions for improvement in the pedestrian environment by deeply exploring the individual factors that significantly affect the walkability of the metro catchment area. Therefore, this study combines the weighting results with the relevant built environment evaluation scores of the catchment area's current walkability to construct a “Score- Effectiveness” (S-E) two-dimensional quadrant diagram. This framework allows for a comprehensive analysis of the two-way correlation between the walkability performance of each built environment variable in the catchment area and its corresponding weight. This can fully illustrate the correspondence between the current status scores of variables and their effectiveness, to dig out the most sensitive existing problems related to walkability in the catchment area. In particular, for those built environment factors with low scores and high effectiveness, targeted improvement strategies that minimize the cost and maximize the benefit can significantly improve the walkability of the station catchment area. These strategies can precisely and effectively enhance the objective walkability and the subjective pedestrian friendliness of the station catchment area (Figure 2).
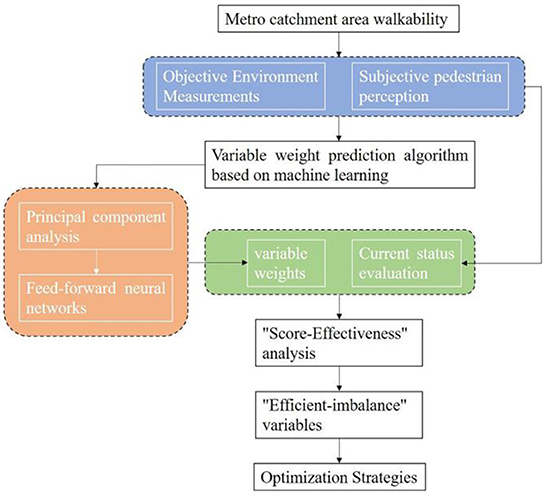
Figure 2. Research framework.
Due to the difference in the unit of selected data, the variables need to be normalized before entering the algorithm model. The evaluation results of the subjective variables are obtained by averaging the five-scale Likert scores of the eight stations, which ranged between 1 and 5 scores. For the objective variables, the scores vary in magnitude due to the existence of different scales. Therefore, the mean of the objective variables was normalized, followed by transferring into the same interval as the subjective scores, thus eliminating the problem of subjective and objective scales, as follows.
Where Y is the normalized mapped value; yMAX is the maximum value of the mapped target interval; yMIN is the minimum value of the mapped target interval; XMAX is the maximum value in the original dataset; XMIN is the minimum value in the original dataset; is the average value in the original dataset.
Results
Subjective and objective variable scores
The scores of each variable are shown in Table 4. Friendly Square (F-S) has 8 variables which ranked first (8), including the rate of walkway area, social security, walkway width, shade facilities, obstacle barrier, resting seat facilities around the walkway, and pedestrian congestion. By contrast, the Zhongshan Square (ZS-S) metro catchment area received 8 variables with the lowest value. It is possible that F-S is located in the financial and commercial center of Renmin Road, the busiest area in Dalian, and serves as an important node connecting transportation hubs and commercial areas such as Dalian Railway Station, Shengli Square, and Tianjin Street. Because of the strong pedestrian demand itself, the construction of pedestrian paths and various services in the catchment area provide pedestrians with high-quality, experiential walking spaces. Moreover, the characteristics of high pedestrian flow also make the two negative variables of obstacle barrier degree and pedestrian crowding degree score significantly larger than other stations. The ZS-S catchment area is one of the most famous squares in Dalian attributed to the circular square of ~168 meters in diameter. At the beginning of its planning and construction, a long and fatiguing walking path for pedestrians was designed. In addition, as a famous and historically significant square in Dalian, ten avenues radiate out from the area, which results in complex road conditions, high traffic flow, and lack of signalization. As a consequence, it causes many concerns about pedestrian safety.
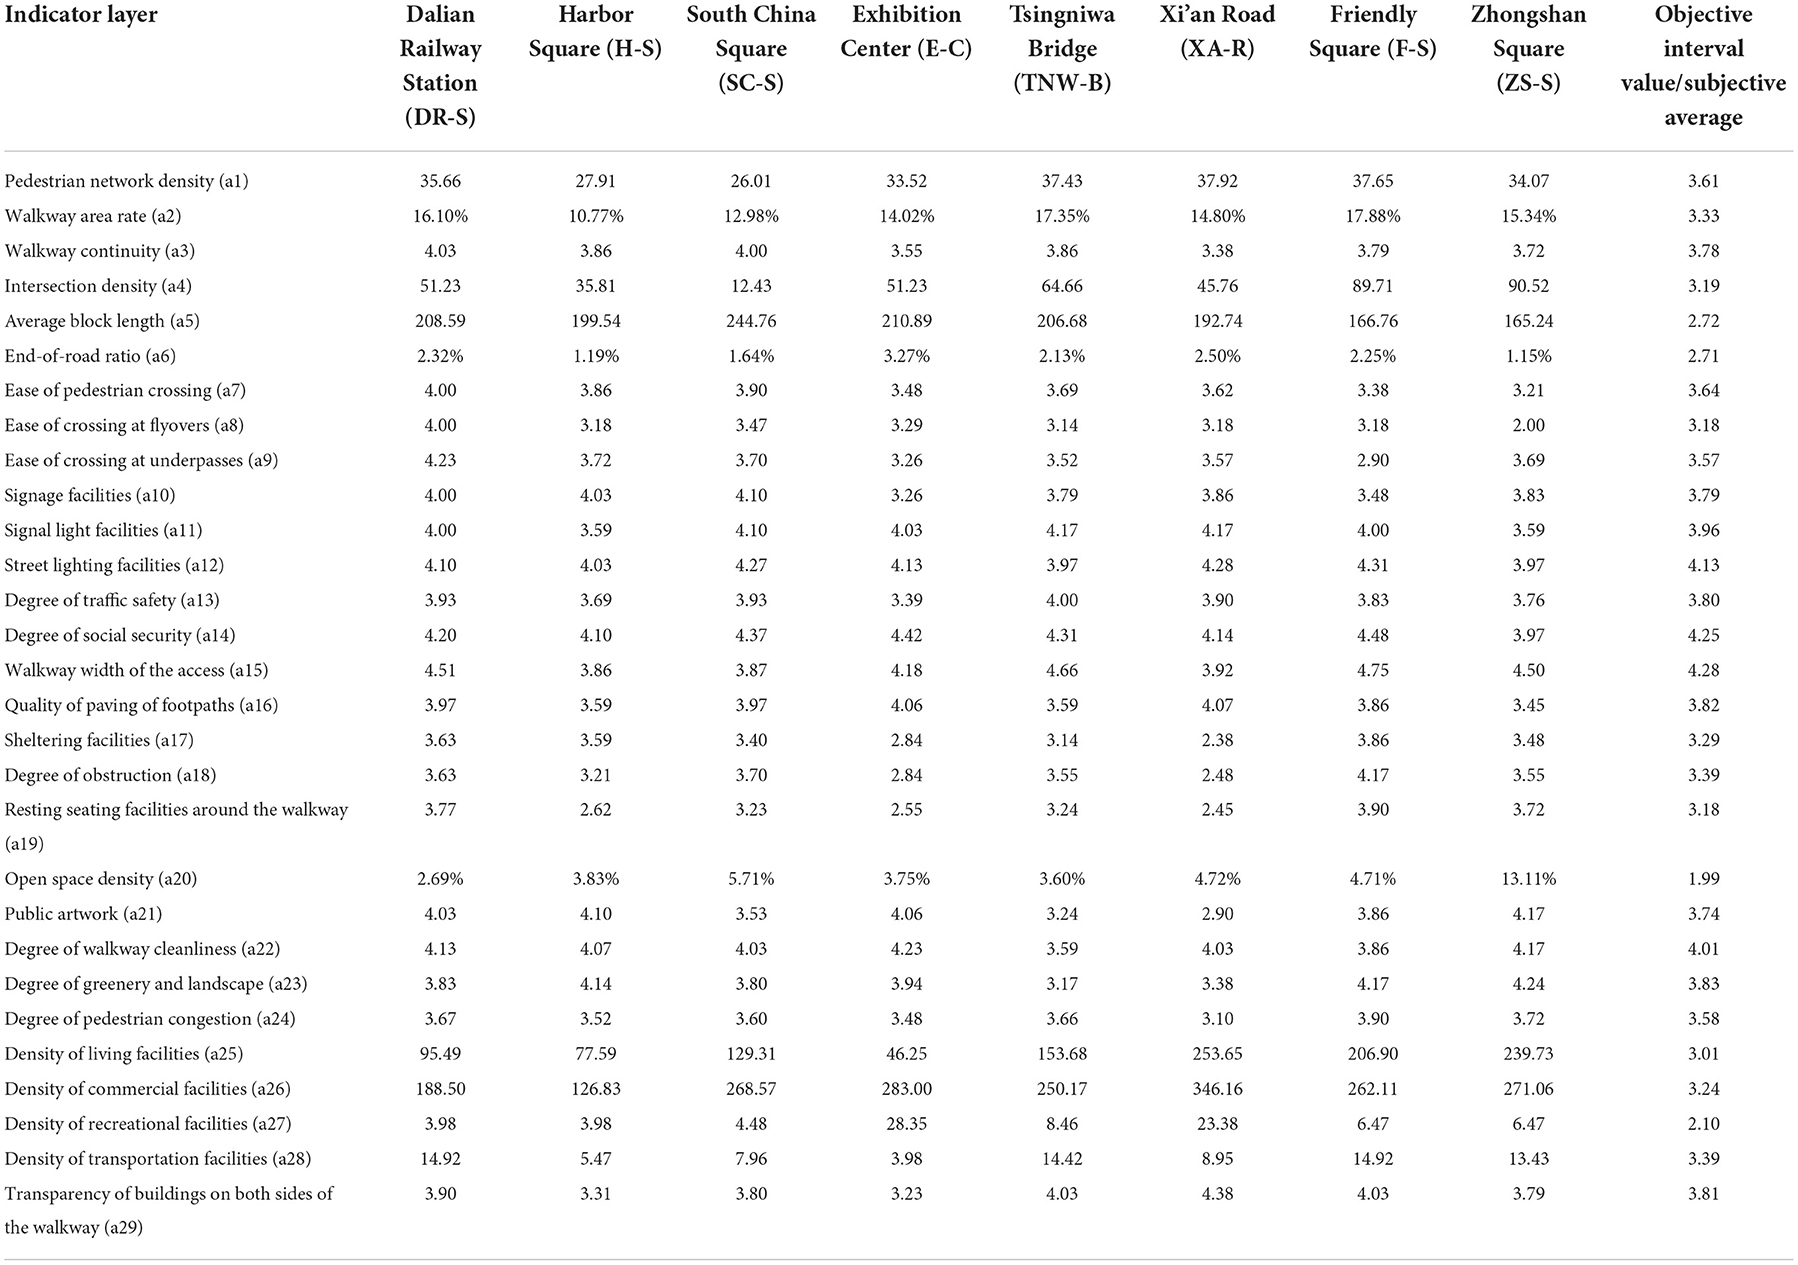
Table 4. Evaluation indicator scores for each station area.
As for the subjective variables, the width of the pedestrian paths in the catchment area, the degree of social security, street lighting facilities, and the neatness of the pedestrian paths were generally recognized by the respondents; the scores of the rest seating facilities, shading facilities and the degree of barrier blockage around the pedestrian paths were significantly lower than the other variables. Combined with the field survey and interviews, most walking paths in the catchment area have problems such as a lack of service facilities, space encroachment, and unclear management.
Machine learning to determine variable weights
For the designed algorithm, the PCA is used to calculate the weights of each variable based on the collected data, the output of the weight calculated by the PCA is used as the data labels, and the feedforward neural network is used to learn the robust mapping from the variable samples to the weight labels. The loss function of this feedforward neural network gradually decreases during the training process until the network converges. The convergence process is shown in Figure 3, where the horizontal coordinate is the number of data iterations and the vertical coordinate is the loss value.
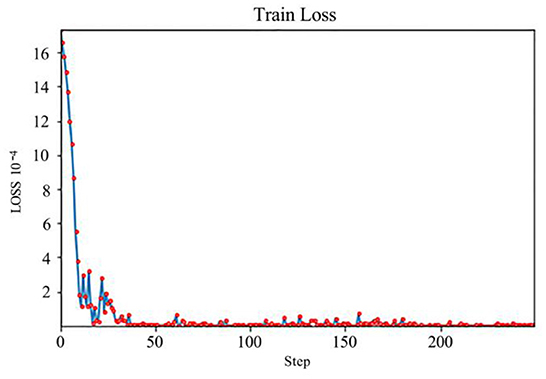
Figure 3. Convergence process of loss function of feedforward neural network.
The modeling results of variable weights are shown in Figure 4. Factors related to walking connectively, include a1 (Pedestrian network density), a2 (Walkway area rate), a3 (Walkway Continuity), a4 (Intersection density), a5 (Average block length), and a6 (End-of-road ratio), are <0.01.
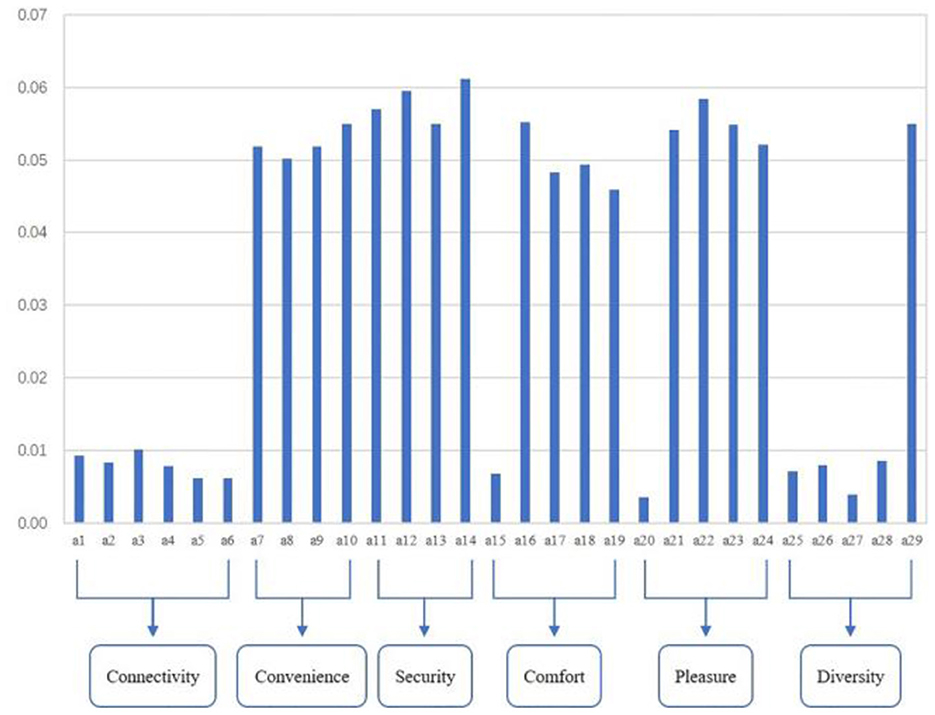
Figure 4. Distribution of variable weights.
As a comparison, convenience and safety variables such as a7 (Ease of pedestrian crossing), a8 (Ease of crossing at flyovers), a9 (Ease of crossing at underpasses), a10 (Signage facilities), a11 (Signal light facilities), a12 (Street lighting facilities), a13 (Degree of traffic safety) and a14 (Degree of social security) have weights above 0.05, indicating the important role on affecting the walkability of metro areas. Among these convenience and safety factors, metro users may have many concerns about social security (a14 with the highest weight of 0.062) when connecting the metro transit.
Regarding the comfort and pleasure variables, only a15 (Walkway width of the access) and a20 (Open space density) have weights below 0.01, while the remaining factors have significantly greater weights than the previous two, including a16 (Quality of paving of footpaths), a17 (Sheltering facilities), a18 (Degree of obstruction), a19 (Resting seating facilities around the walkway), a21 (Public artwork), a22 (Degree of cleanliness of the walkway), a23 (Degree of greenery and landscape), and a24 (Degree of pedestrian congestion). Within the comfort and pleasantness variables, people may place more importance on the cleanliness of the walkway (a12 with the highest weight of 0.058).
On the contrary, most of the variables in diversity have weights below 0.01, such as a25 (Density of living facilities), a26 (Density of commercial facilities), a27 (Density of recreational facilities), and a28 (Density of transportation facilities). And the weight of a29 (Transparency of buildings on both sides of the walkway) is higher than 0.05, which is five times more than the weight values of other variables in the diversity. This indicates that metro users may care more about the façade form of buildings on both sides of the walkway than the density of various service facilities in the catchment area.
“Score-effectiveness” suitability analysis
In this study, we construct a framework of the “Score- Effectiveness” fit quadrant in which the horizontal coordinates are the weights obtained from the variable weight prediction algorithm and the vertical coordinates are the scores of the current variables. The baseline of the four quadrants is the mean value of the weights and satisfaction scores as the parallel axes of the horizontal and vertical coordinates, respectively. To form an effective, precise, and efficient optimization strategy based on field surveys and research.
As shown in Figure 5, both the weights and satisfaction results of variables in quadrant I are higher, indicating that pedestrians are more satisfied with the current situation of this variable, which belongs to the efficient and balanced type. The variables in quadrant II are low-efficiency and high-quality, meaning that pedestrians are also satisfied with these low-efficiency variables and only need to maintain the status quo for these aspects. The variables in quadrants III and IV are the inefficient and poor quality type and the efficient and imbalanced type, respectively. The variables in quadrant III have slightly less influence on satisfaction, and appropriate optimization can be performed at appropriate time points for the weak points with low ratings. Variables in quadrant IV are characterized by high performance and low scores, which have a greater impact on satisfaction while scoring low. This indicates that the efficient imbalance-type variables are built at a relatively low level, but have a direct and important impact on the friendliness of supporting pedestrian walking. Therefore, the relevant variables need to be improved and optimized urgently to be able to improve the current level of metro catchment area walkability in a targeted and maximally effective way.
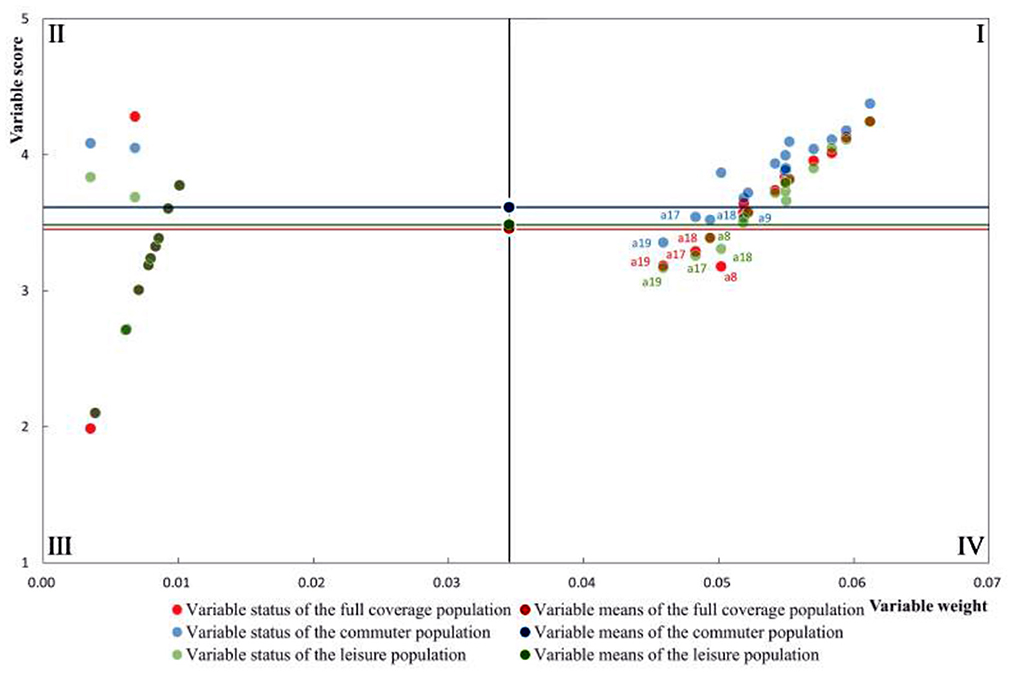
Figure 5. “Score-effectiveness” suitability quadrant.
By counting the data from the questionnaire, as shown in Table 3 above, the respondents in the metro catchment area can be divided into commuting and leisure categories based on different travel purposes. Among them, 37% are commuters (commuting to and from work and school) and 60.7% are leisure people (leisurely walking, shopping and dining). Using the “Score-Effectiveness” model, the efficient imbalance-type variables under the three categories of full coverage, commuting, and leisure were identified by stratifying the purpose of the population trips, respectively. As shown in Figure 5, the efficient imbalance-type variables are consistent for full coverage and leisure populations, including a8 (Ease of crossing at flyovers), a17 (Sheltering facilities), a18 (Degree of obstruction), and a19 (Resting seating facilities around the walkway). For the commuter population, a9 (Ease of crossing at underpasses), a17, a18, and a19 are in low rating, high performance status. In general, a17, a18, and a19 are fixed efficient imbalance variables. While comparing the commuting and leisure population, the former cares more about the performance of a9 and the latter is focused on a8. Both a8 and a9 are crossing facilities, which also shows that the two types of people, commuters and leisure, have different needs for station domain walkability and have differential judgments on crossing forms. The flyover plays the role of outdoor landscape while assuming the traffic function. The leisure population prefers open crossing space, while the commuter population finds the underpass crossing more convenient.
Discussion
In this study, both subjective and objective perspectives are applied to evaluate the walkability of the metro catchment area. An approach of predicting the weight of variables based on machine learning technique is developed to accurately measure the importance of built environment factors that affect walkability. Among the selected built environment factors, the shade facilities, obstacle barriers, and resting seats around the pedestrian paths were found to be highly effective and imbalanced variables recognized as fixed by the population. indicating the necessity for improvement. Meanwhile, the ease of crossing the flyovers and underpasses are additional efficient imbalance-type variables for the leisure and commuting populations. On the basis of the analysis in terms of the five efficient imbalance-type variables, this paper proposes targeted optimization strategies accordingly.
First, pedestrian bridges, an important measure to improve the convenience of walking, are suggested to be installed at traffic nodes such as main roads with high traffic flow and large safety hazards. In Dalian city, motorways, tramways, sidewalks, etc. are crisscrossed in the metro catchment area, causing major hidden dangers to the convenience and safety of pedestrians crossing the street. However, our field observation found that overpass crossing facilities in Dalian are extremely absent, which makes walkers inconvenient for crossing the road. Therefore, overpass crossing facilities should be added at appropriate locations around the catchment area to enhance walkability and form a friendly walking space to separate pedestrians and vehicles (76). In addition, the design of the overpass crossing should take care of the use of vulnerable groups such as the elderly. With the help of barrier-free designs (e.g., elevators and ramps), an effective and friendly pedestrian corridor is formed to eliminate the pedestrian's psychological barriers to walking caused by excessive slopes.
Second, during the interviews, most of the interviewees reported that the interior of the underpass was too dark, poorly tidied, and had a low level of security. It is recommended that large glass areas be used at the entrances and exits of underground passages to introduce a greater range of natural light. Strengthen the relevant management personnel to improve efforts, pay attention to health cleaning, post-maintenance and social security. Reduce the situation of mobile vendors occupying underground traffic sex paths and adopt time-sharing and centralized management. In addition, the underground passageway of the metro catchment area can and should be combined with the surrounding underground commercial space to maximize the use of the pedestrian flow and vitality brought by the station. The benefits are maximized while reducing the pressure of pedestrian flow in the ground commercial walkway.
Third, it is suggested to appropriately improve the ability of the shading facilities to cope with extreme weather. Possible measures include planting street trees along the avenues, building eaves, and setting corridors and canopies. According to the field study, there are very few sheltering facilities along the route to the metro stations, which makes metro users uncomfortable walking to the stations in bad weather. It is suggested to use some flexible sheltering facilities, such as folding devices similar to umbrellas on both sides of the walkway. In addition, shelter facilities can be also designed by integrating the functions of greening and rainwater collection collectively. These techniques will not only improve the overall environmental quality but also makes resources to be utilized more effectively.
Fourth, enhancing the environmental management and optimization in the metro catchment area is encouraged. The field survey also found that the pedestrian space in the catchment area is seriously encroached upon by commercial and advertising obstacles. Excessive space encroachment can directly lead to a significant reduction in walkability because of the increasing traffic chaos and safety risk. Therefore, it is recommended that the relevant authorities should develop management measures to prohibit commercial and advertising barriers in the pedestrian space, particularly around the entrance of metro stations where passengers are usually crowded, to reduce its negative impact on walkability.
Finally, the metro catchment area should be provided with public seating and resting space approximately. In this study, we found that resting seating facilities along the walkway have a positive impact on station area walkability, which is in line with the results of previous studies (77, 82). Dalian is a city with many open squares, and most of the metro catchment areas are accompanied by city squares spatially. However, squares with large sizes may cause fatigue to pedestrians and visitors, and that is why approximate allocation of resting facilities is particularly important to improve the willingness of walking. Therefore, increasing the number of resting seats along the pedestrian walkway can not only make walking less tiring but also improve the neighborhood vitality of the station area and enhance the attractiveness of the city.
Conclusion
Currently, the urban metro system in China is developing rapidly. However, the development of the metro catchment areas, particularly the planning and management of walking-related facilities, does not meet well with demands (i.e., comfort, convenience, and safety) of metro passengers. Considering that the land use has been planned, the optimization of the built environment of the metro catchment area is easier to implement and more effective than the reorganization of built environment factors. In this paper, subjective and objective variables of metro catchment area walkability are effectively combined. Through the innovative machine learning-based variable weight prediction algorithm, the weight value of each variable is obtained more scientifically and objectively. Based on this, this study further constructs a “Score-Effectiveness” suitability system to precisely identify the built environment factors that should be improved to enhance walkability in metro catchment areas.
The results of the study help to understand the priorities of built environment factors that affect the walkability of metro catchment areas, as well as to pinpoint the existing problems related to the walking connection to metro stations. A comparative analysis of the stratification of the population was conducted to find out the differentiated demand for metro catchment area walkability by populations who travel for both commuting and leisure purposes. This study provides relevant governments and planners with targeted and effective optimization strategies to make the metro areas more walkable. The major contributions of this study include: (1) to construct the “Score-Effectiveness” framework to identify the imbalanced factors in terms of the built environment, and hence, contribute to providing targeted policies to improve the walkability of metro areas; (2) to collectively identify the weight of objective and subjective built environment factors through developing a machine learning-based approach, which makes it possible to compare the importance of objective and subjective built environment factors.
However, there are limitations to this study. First, due to the difficulties in data collection, some built environment variables such as traffic congestion, noise, and air pollution (83) that may potentially affect walkability are unselected approximately. Further, we just selected eight sampled metro stations for analysis, which may cause some bias potentially. Future studies can expand the sample city size to enhance comparability.
Data availability statement
The original contributions presented in the study are included in the article/supplementary material, further inquiries can be directed to the corresponding author/s.
Author contributions
WX and YG: conceptualization. PZ and YG: funding acquisition, validation, and writing—review and editing. WX: formal analysis, supervision, methodology, and writing—original draft. BL and LS: investigation. MX: machine learning algorithm design and practice. All authors contributed to the article and approved the submitted version.
Funding
This study was supported by the National Natural Science Foundation of China (No. 51978447) and the Major Training Project of Team+Project in Tianjin (No. XC202061).
Acknowledgments
The authors would like to acknowledge all the teachers and students who assisted in the research, and the writing of the original draft.
Conflict of interest
The authors declare that the research was conducted in the absence of any commercial or financial relationships that could be construed as a potential conflict of interest.
Publisher's note
All claims expressed in this article are solely those of the authors and do not necessarily represent those of their affiliated organizations, or those of the publisher, the editors and the reviewers. Any product that may be evaluated in this article, or claim that may be made by its manufacturer, is not guaranteed or endorsed by the publisher.
References
1. Yang L, Chen Y, Xu N, Zhao R, Chau KW, Hong S. Place-varying impacts of urban rail transit on property prices in Shenzhen, China: insights for value capture. Sustain Cities Soc. (2020) 58:102140. doi: 10.1016/j.scs.2020.102140
2. Yang L, Liang Y, He B, Lu Y, Gou Z. COVID-19 effects on property markets: the pandemic decreases the implicit price of metro accessibility. Tunn Undergr Sp Technol. (2022) 125:104528. doi: 10.1016/j.tust.2022.104528
3. Topalovic P, Carter J, Topalovic M, Krantzberg G. Light rail transit in hamilton: health, environmental and economic impact analysis. Soc Indic Res. (2012) 108:329–50. doi: 10.1007/s11205-012-0069-x
4. Wener RE, Evans GW. A morning stroll: levels of physical activity in car and mass transit commuting. Environ Behav. (2007) 39:62–74. doi: 10.1177/0013916506295571
5. Morency C, Trépanier Martin M, Demers M. Walking to transit: an unexpected source of physical activity. Transp Policy. (2011) 18:800–6. doi: 10.1016/j.tranpol.2011.03.010
6. Edwards RD. Public transit, obesity, and medical costs: assessing the magnitudes. Prev Med. (2008) 46:14–21. doi: 10.1016/j.ypmed.2007.10.004
7. Brons M, Rietveld P. Improving the quality of the door-to-door rail journey: a customer-oriented approach. Built Environ. (2009) 35:122–35. doi: 10.2148/benv.35.1.122
8. de Souza F, La Paix Puello L, Brussel M, Orrico R, van Maarseveen M. Modelling the potential for cycling in access trips to bus, train and metro in Rio de Janeiro. Transp Res Part D Transp Environ. (2017) 56:55–67. doi: 10.1016/j.trd.2017.07.007
9. Li X, Tang J, Hu X, Wang W. Assessing intercity multimodal choice behavior in a Touristy City: a factor analysis. J Transp Geogr. (2020) 86:102776. doi: 10.1016/j.jtrangeo.2020.102776
10. De Vos J, Schwanen T, Van Acker V, Witlox F. Do satisfying walking and cycling trips result in more future trips with active travel modes? An exploratory study. Int J Sustain Transp. (2019) 13:180–96. doi: 10.1080/15568318.2018.1456580
11. Jiao J, Chen Y, He N. Plan pedestrian friendly environments around subway stations: lessons from Shanghai, China. J Urban Des. (2017) 22:796–811. doi: 10.1080/13574809.2017.1336060
12. Rastogi R, Rao KVK. Travel characteristics of commuters accessing transit: case study. J Transp Eng. (2003) 129:684–94. doi: 10.1061/(ASCE)0733-947X(2003)129:6(684)
13. Hoback A, Anderson S, Dutta U. True walking distance to transit. Transp Plan Technol. (2008) 31:681–92. doi: 10.1080/03081060802492785
14. He J, Zhang R, Huang X, Xi G. Walking access distance of metro passengers and relationship with demographic characteristics: a case study of Nanjing Metro. Chinese Geogr Sci. (2018) 28:612–23. doi: 10.1007/s11769-018-0970-6
15. Ibraeva A, Correia GHdA, Silva C, Antunes AP. Transit-oriented development: a review of research achievements and challenges. Transp Res Part A Policy Pract. (2020) 132:110–30. doi: 10.1016/j.tra.2019.10.018
16. Halldórsdóttir K, Nielsen OA, Prato CG. Home-end and activity-end preferences for access to and egress from train stations in the Copenhagen region. Int J Sustain Transp. (2017) 11:776–86. doi: 10.1080/15568318.2017.1317888
17. Jeffrey D, Boulangé C, Giles-Corti B, Washington S, Gunn L. Using walkability measures to identify train stations with the potential to become transit oriented developments located in walkable neighbourhoods. J Transp Geogr. (2019) 76:221–31. doi: 10.1016/j.jtrangeo.2019.03.009
18. Su S, Pi J, Xie H, Cai Z, Weng M. Community deprivation, walkability, and public health: highlighting the social inequalities in land use planning for health promotion. Land Use Policy. (2017) 67:315–26. doi: 10.1016/j.landusepol.2017.06.005
19. Lwin KK, Murayama Y. Modelling of urban green space walkability: eco-friendly walk score calculator. Comput Environ Urban Syst. (2011) 35:408–20. doi: 10.1016/j.compenvurbsys.2011.05.002
20. Gebel K, Bauman A, Owen N. Correlates of non-concordance between perceived and objective measures of walkability. Ann Behav Med. (2009) 37:228–38. doi: 10.1007/s12160-009-9098-3
21. Dovey K, Pafka E. What is walkability? The urban DMA. Urban Stud. (2020) 57:93–108. doi: 10.1177/0042098018819727
22. Moura F, Cambra P, Gonçalves AB. Measuring walkability for distinct pedestrian groups with a participatory assessment method: a case study in Lisbon. Landsc Urban Plan. (2017) 157:282–96. doi: 10.1016/j.landurbplan.2016.07.002
23. Papa E, Bertolini L. Accessibility and transit-oriented development in european metropolitan areas. J Transp Geogr. (2015) 47:70–83. doi: 10.1016/j.jtrangeo.2015.07.003
24. Frank LD, Andresen MA, Schmid TL. Obesity relationships with community design, physical activity, and time spent in cars. Am J Prev Med. (2004) 27:87–96. doi: 10.1016/j.amepre.2004.04.011
25. Grasser G, Van Dyck D, Titze S, Stronegger W. Objectively measured walkability and active transport and weight-related outcomes in adults: a systematic review. Int J Public Health. (2013) 58:615–25. doi: 10.1007/s00038-012-0435-0
26. Kelly CE, Tight MR, Hodgson FC, Page MW. A comparison of three methods for assessing the walkability of the pedestrian environment. J Transp Geogr. (2011) 19:1500–8. doi: 10.1016/j.jtrangeo.2010.08.001
27. Feuillet T, Charreire H, Menai M, Salze P, Simon C, Dugas J, et al. Spatial heterogeneity of the relationships between environmental characteristics and active commuting: towards a locally varying social ecological model. Int J Health Geogr. (2015) 14:1–14. doi: 10.1186/s12942-015-0002-z
28. Koohsari MJ, Sugiyama T, Shibata A, Ishii K, Hanibuchi T, Liao Y, et al. Walk Score® and Japanese adults' physically-active and sedentary behaviors. Cities. (2018) 74:151–5. doi: 10.1016/j.cities.2017.11.016
29. Merlin LA. Can the built environment influence nonwork activity participation? An analysis with national data. Transportation. (2015) 42:369–87. doi: 10.1007/s11116-014-9554-1
30. Lefebvre-Ropars G, Morency C, Singleton PA, Clifton KJ. Spatial transferability assessment of a composite walkability index: the Pedestrian Index of the Environment (PIE). Transp Res Part D Transp Environ. (2017) 57:378–91. doi: 10.1016/j.trd.2017.08.018
31. Mayne DJ, Morgan GG, Willmore A, Rose N, Jalaludin B, Bambrick H, et al. An objective index of walkability for research and planning in the Sydney Metropolitan Region of New South Wales, Australia: an ecological study. Int J Health Geogr. (2013) 12:1–10. doi: 10.1186/1476-072X-12-61
32. Telega A, Telega I, Bieda A. Measuring walkability with GIS—methods overview and new approach proposal. Sustain. (2021) 13:1–17. doi: 10.3390/su13041883
33. Maghelal PK, Capp CJ. Walkability: a review of existing pedestrian indices. URISA J. (2011) 23: 5–19.
34. Al Shammas T, Escobar F. Comfort and time-based walkability index design: a GIS-based proposal. Int J Environ Res Public Health. (2019) 16:2850. doi: 10.3390/ijerph16162850
35. D'Orso G, Migliore M. A GIS-based method for evaluating the walkability of a pedestrian environment and prioritised investments. J Transp Geogr. (2020) 82:102555. doi: 10.1016/j.jtrangeo.2019.102555
36. Park S, Choi K, Lee JS. Operationalization of path walkability for sustainable transportation. Int J Sustain Transp. (2017) 11:471–85. doi: 10.1080/15568318.2016.1226996
37. Leslie E, Coffee N, Frank L, Owen N, Bauman A, Hugo G. Walkability of local communities: using geographic information systems to objectively assess relevant environmental attributes. Heal Place. (2007) 13:111–22. doi: 10.1016/j.healthplace.2005.11.001
38. Ball K, Bauman A, Leslie E, Owen N. Perceived environmental aesthetics and convenience and company are associated with walking for exercise among Australian adults. Prev Med. (2001) 33:434–40. doi: 10.1006/pmed.2001.0912
39. Golan Y, Henderson J, Lee N, Weverka A. Gendered walkability: building a daytime walkability index for women. J Transp Land Use. (2019) 12:501–26. doi: 10.5198/jtlu.2019.1472
40. Jiang Y, Christopher Zegras P, Mehndiratta S. Walk the line: station context, corridor type and bus rapid transit walk access in Jinan, China. J Transp Geogr. (2012) 20:1–14. doi: 10.1016/j.jtrangeo.2011.09.007
41. Li S, Zhao P, Zhang H, Quan J. Walking behavior in the old downtown Beijing: the impact of perceptions and attitudes and social variations. Transp Policy. (2019) 73:1–11. doi: 10.1016/j.tranpol.2018.10.005
42. Middleton J. The socialities of everyday urban walking and the ‘right to the city.' Urban Stud. (2018) 55:296–315. doi: 10.1177/0042098016649325
43. van den Berg P, Sharmeen F, Weijs-Perrée M. On the subjective quality of social interactions: influence of neighborhood walkability, social cohesion and mobility choices. Transp Res Part A Policy Pract. (2017) 106:309–19. doi: 10.1016/j.tra.2017.09.021
44. Krizek KJ. Residential relocation and changes in urban travel: does neighborhood-scale urban form matter? J Am Plan Assoc. (2003) 69:265–81. doi: 10.1080/01944360308978019
45. Sallis JF, Saelens BE, Frank LD, Conway TL, Slymen DJ, Cain KL, et al. Neighborhood built environment and income: examining multiple health outcomes. Soc Sci Med. (2009) 68:1285–93. doi: 10.1016/j.socscimed.2009.01.017
46. Gehl J. Public Spaces for a Changing Public Life. Open Space: People Space. London: Taylor & Francis (2007). p. 23–30. doi: 10.4324/9780203961827
47. Saelens BE, Sallis JF, Black JB, Chen D. Neighborhood-based differences in physical activity: an environment scale evaluation. Am J Public Health. (2003) 93:1552–8. doi: 10.2105/AJPH.93.9.1552
48. Ewing R, Handy S. Measuring the unmeasurable: urban design qualities related to walkability. J Urban Des. (2009) 14:65–84. doi: 10.1080/13574800802451155
49. Cerin E, Saelens BE, Sallis JF, Frank LD. Neighborhood environment walkability scale: validity and development of a short form. Med Sci Sports Exerc. (2006) 38:1682–91. doi: 10.1249/01.mss.0000227639.83607.4d
50. Zarȩba A, Widawski K, Krzemińska A, Dzikowska A. Multiscale Transit Oriented Development (TOD) for sustainable communities. IOP Conf Ser Earth Environ Sci. (2019) 214:012099. doi: 10.1088/1755-1315/214/1/012099
51. Vale DS, Saraiva M, Pereira M. Active accessibility: a review of operational measures of walking and cycling accessibility. J Transp Land Use. (2016) 9:209–35. doi: 10.5198/jtlu.2015.593
52. Frank LD, Engelke P. Multiple impacts of the built environment on public health: walkable places and the exposure to air pollution. Int Reg Sci Rev. (2005) 28:193–216. doi: 10.1177/0160017604273853
53. Frank LD, Sallis JF, Saelens BE, Leary L, Cain L, Conway TL, et al. The development of a walkability index: application to the neighborhood quality of life study. Br J Sports Med. (2010) 44:924–33. doi: 10.1136/bjsm.2009.058701
54. Hall CM, Ram Y. Walk score® and its potential contribution to the study of active transport and walkability: a critical and systematic review. Transp Res Part D Transp Environ. (2018) 61:310–24. doi: 10.1016/j.trd.2017.12.018
55. Hino K, Baba H, Kim H, Shimizu C. Validation of a Japanese walkability index using large-scale step count data of Yokohama citizens. Cities. (2022) 123:103614. doi: 10.1016/j.cities.2022.103614
56. Bereitschaft B. Walk score® versus residents' perceptions of walkability in omaha, ne. J Urban. (2018) 11:412–35. doi: 10.1080/17549175.2018.1484795
57. Frehlich L, Blackstaffe A, McCormack GR. Test–retest reliability and construct validity of an online and paper administered Physical Activity Neighborhood Environment Scale (PANES). Meas Phys Educ Exerc Sci. (2020) 24:1–10. doi: 10.1080/1091367X.2019.1641099
58. Consoli A, Nettel-Aguirre A, Spence JC, McHugh TL, Mummery K, McCormack GR. Associations between objectively-measured and self-reported neighbourhood walkability on adherence and steps during an internet-delivered pedometer intervention. PLoS ONE. (2020) 15:e0242999. doi: 10.1371/journal.pone.0242999
59. Silveira SL, Motl RW. Abbreviated neighborhood environment walkability scale in persons with multiple sclerosis: initial validation of score inferences. J Transp Heal. (2020) 19:100952. doi: 10.1016/j.jth.2020.100952
60. Lo BK, Graham ML, Folta SC, Paul LC, Strogatz D, Nelson ME, et al. Examining the associations betweenwalk score, perceived built environment, and physical activity behaviors among women participating in a community-randomized lifestyle change intervention trial: strong hearts, healthy communities. Int J Environ Res Public Health. (2019) 16:849. doi: 10.3390/ijerph16050849
61. Park A, Clare J, Spicer V, Brantingham PL, Calvert T, Jenion G. Examining context-specific perceptions of risk: exploring the utility of “human-in-the-loop” simulation models for criminology. J Exp Criminol. (2012) 8:29–47. doi: 10.1007/s11292-011-9132-x
62. Migliore M, Catalano M. Urban public transport optimization by bus ways: a neural network-based methodology. WIT Trans Built Environ. (2007) 96:347–56. doi: 10.2495/UT070331
63. Pinna F, Masala F, Garau C. Urban policies and mobility trends in Italian smart cities. Sustain. (2017) 9:494. doi: 10.3390/su9040494
64. Alshalalfah BW, Shalaby AS. Case study: relationship of walk access distance to transit with service, travel, and personal characteristics. J Urban Plan Dev. (2007) 133:114–8. doi: 10.1061/(ASCE)0733-9488(2007)133:2(114)
65. Wu J, Yang M, Sun S, Zhao J. Modeling travel mode choices in connection to metro stations by mixed logit models: a case study in Nanjing, China. Promet Traffic Traffico. (2018) 30:549–61. doi: 10.7307/ptt.v30i5.2623
66. Arellana J, Saltarín M, Larrañaga AM, Alvarez V, Henao CA. Urban walkability considering pedestrians' perceptions of the built environment: a 10-year review and a case study in a medium-sized city in Latin America. Transp Rev. (2020) 40:183–203. doi: 10.1080/01441647.2019.1703842
67. Brown BB, Jensen WA, Tharp D. Residents' expectations for new rail stops: optimistic neighborhood perceptions relate to subsequent transit ridership. Transportation. (2019) 46:125–46. doi: 10.1007/s11116-017-9793-z
68. Hsiao S, Lu J, Sterling J, Weatherford M. Use of geographic information system for analysis of transit pedestrian access. Transp Res Rec. (1997) 1604:50–9. doi: 10.3141/1604-07
69. Chakour V, Eluru N. Examining the influence of stop level infrastructure and built environment on bus ridership in Montreal. J Transp Geogr. (2016) 51:205–17. doi: 10.1016/j.jtrangeo.2016.01.007
70. Sun G, Webster C, Chiaradia A. Objective assessment of station approach routes: development and reliability of an audit for walking environments around metro stations in China. J Transp Heal. (2017) 4:191–207. doi: 10.1016/j.jth.2017.01.010
71. Cervero R, Kockelman K. Travel demand and the 3Ds: density, diversity, and design. Transp Res Part D Transp Environ. (1997) 2:199–219. doi: 10.1016/S1361-9209(97)00009-6
72. Loutzenheiser DR. Pedestrian access to transit: model of walk trips and their design and urban form determinants around bay area rapid transit stations. Transp Res Rec. (1997) 1604:40–9. doi: 10.3141/1604-06
73. Cervero R, Sarmiento OL, Jacoby E, Gomez LF, Neiman A. Influences of built environments on walking and cycling: lessons from Bogotá. Int J Sustain Transp. (2009) 3:203–26. doi: 10.1080/15568310802178314
74. Clifton KJ, Livi Smith AD, Rodriguez D. The development and testing of an audit for the pedestrian environment. Landsc Urban Plan. (2007) 80:95–110. doi: 10.1016/j.landurbplan.2006.06.008
75. Kim S, Park S, Lee JS. Meso- or micro-scale? Environmental factors influencing pedestrian satisfaction. Transp Res Part D Transp Environ. (2014) 30:10–20. doi: 10.1016/j.trd.2014.05.005
76. Bivina GR, Gupta A, Parida M. Influence of microscale environmental factors on perceived walk accessibility to metro stations. Transp Res Part D Transp Environ. (2019) 67:142–55. doi: 10.1016/j.trd.2018.11.007
77. Asadi-Shekari Z, Moeinaddini M, Zaly Shah M. A pedestrian level of service method for evaluating and promoting walking facilities on campus streets. Land Use Policy. (2014) 38:175–93. doi: 10.1016/j.landusepol.2013.11.007
78. Alfonzo MA, Boarnet MG, Day K, Mcmillan T, Anderson CL. The relationship of neighbourhood built environment features and adult parents' walking. J Urban Des. (2008) 13:29–51. doi: 10.1080/13574800701803456
79. Kim S, Ulfarsson GF, Todd Hennessy J. Analysis of light rail rider travel behavior: impacts of individual, built environment, and crime characteristics on transit access. Transp Res Part A Policy Pract. (2007) 41:511–22. doi: 10.1016/j.tra.2006.11.001
80. Doyle S, Kelly-Schwartz A, Schlossberg M, Stockard J. Active community environments and health: the relationship of walkable and safe communities to individual health. J Am Plan Assoc. (2006) 72:19–31. doi: 10.1080/01944360608976721
81. Vale DS. Transit-oriented development, integration of land use and transport, and pedestrian accessibility: combining node-place model with pedestrian shed ratio to evaluate and classify station areas in Lisbon. J Transp Geogr. (2015) 45:70–80. doi: 10.1016/j.jtrangeo.2015.04.009
82. Lund H. Testing the claims of new urbanism: local access, pedestrian travel, and neighboring behaviors. J Am Plan Assoc. (2003) 69:414–29. doi: 10.1080/01944360308976328
83. Victoria Transport Policy Institute. Automobile Dependency and Economic Development. (2002). Available online at: https://vtpi.org/ecodev.pdf (accessed October 07, 2022).
Keywords: metro catchment area, walkability, built environment, machine learning, efficient imbalance-type factors, optimization strategies
Citation: Zeng P, Xu W, Liu B, Guo Y, Shi L and Xing M (2022) Walkability assessment of metro catchment area: A machine learning method based on the fusion of subject-objective perspectives. Front. Public Health 10:1086277. doi: 10.3389/fpubh.2022.1086277
Received: 01 November 2022; Accepted: 22 November 2022;
Published: 06 December 2022.
Edited by:
Yibin Ao, Chengdu University of Technology, ChinaReviewed by:
Qi Li, Colorado School of Mines, United StatesC. Michael Hall, University of Canterbury, New Zealand
Copyright © 2022 Zeng, Xu, Liu, Guo, Shi and Xing. This is an open-access article distributed under the terms of the Creative Commons Attribution License (CC BY). The use, distribution or reproduction in other forums is permitted, provided the original author(s) and the copyright owner(s) are credited and that the original publication in this journal is cited, in accordance with accepted academic practice. No use, distribution or reproduction is permitted which does not comply with these terms.
*Correspondence: Weixing Xu, xuwx@tju.edu.cn; Yuanyuan Guo, yuanyuanguo@tju.edu.cn