 Zhi Pan1†Hongjun Tian2†Tao Fang2Zhidong Liu2Xiangdong Liu2Guangqian Dou2Guoyong Huang1
 Zhenqing Zhang3Guangdong Chen1*Wenqiang Wang3*
 Chuanjun Zhuo2,4,5*
- 1Key Laboratory of Genetic Psychiatry, Wenzhou Seventh People Hospital, Wenzhou, China
- 2Key Laboratory of Real Time Tracing of Brain Circuits of Neurology and Psychiatry, Nankai University Affiliated Tianjin Fourth Center Hospital, Tianjin Medical University Affiliated Tianjin Fourth Center Hospital, Tianjin Fourth Center Hospital, Tianjin, China
- 3Department of Psychiatry, Xiamen Xianyue Hospital, Xiamen, China
- 4Department of Psychiatry, The First Affiliated Hospital of Zhengzhou University, Zhengzhou, China
- 5Biological Psychiatry International Joint Laboratory of Henan, Zhengzhou University, Zhengzhou, China
Depressive disorders are a severe psychiatric and social problem that affect more than 4% of the global population. Depressive disorders have explicit hereditary characteristics; however, the precise driving genetic force behind these disorders has not yet been clearly illustrated. In the present study, we recruited a three-generation Chinese pedigree in which 5 of 17 members had long-term depression. We conducted whole-exome sequencing to identify the genetic mutation profiles of the family, and a list of susceptible genetic variations that were highly associated with depression onset was revealed via multiple omics analysis. In particular, a non-synonymous single nucleotide variation in the oxoglutarate dehydrogenase-like (OGDHL) gene, rs2293239 (p.Asn725Ser), was identified as one of the major driving genetic forces for depression onset in the family. This variant causes an important conformational change in the transketolase domain of OGDHL, thus reducing its binding affinity with the cofactor thiamine pyrophosphate and eventually resulting in the abnormal accumulation of glutamate in the brain. Brain imaging analysis further linked the rs2293239 variant with an enlarged amygdala and cerebellum in depressive family members. In summary, the present study enhances the current genetic understanding of depressive disorders. It also provides new options for prioritizing better clinical therapeutic regimens, as well as identifying a new protein target for the design of highly specific drugs to treat depressive disorders.
Introduction
Depressive disorders, or depression, refers to common but severe mental disorders that affect more than 264 million people worldwide (1). They are also a leading cause of disability, and place heavy economic burdens on both patients' families and society (2). Unfortunately, clinical therapy for depressive disorders, and in particular major depressive disorder (MDD), usually results in poor outcomes because of the heterogeneous pathophysiology of these disorders. Any one or a combination of biological, physical, genetic, and social factors may account for depression onset. Although great efforts have been made over many years, the driving force underlying depressive disorders remains unclear in most cases, which has little benefit for improving therapeutic regimens (3, 4).
Depressive disorders are heritable. Early twin studies estimated the heritability of depression to be about 36% (5, 6). For MDD, heritability was determined to be approximately 32% in a study that measured genomic similarity among unrelated individuals (7). The inheritance of depression from generation to generation makes it feasible to reveal the potential driving genetic force of this disorder. For example, Hu conducted comparative genotyping of a case–control cohort and reported that a single nucleotide polymorphism, rs25531 in SLC6A4, likely impacts depression onset by interfering with the serotonin pathway (8). In addition, Zubenko et al. performed a linkage analysis on 81 families and identified 19 loci that were suspected to relate to depressive disorders (9). Camp et al. reported three loci related to depression or anxiety based on 87 Utah pedigrees (10). Furthermore, Kendler and Flint summarized a number of genes (5HTTP/SLC6A4, APOE, DRD4, GNB3, HTR1A, MTHFR, and SLC6A3) linked to susceptibility to heterogeneous depression by interpreting a large amount of candidate gene literature in 2014 (11). However, despite convincing evidence for their genetic contribution to disease susceptibility, only a few of these genes or loci have substantial molecular evidence to support the diagnoses of the members of this family and clinical therapy (11, 12). In recent years, genome-wide association studies (GWAS) have been applied to the search for genetic associations in various psychiatric diseases. Several biomarker gene variants have been proposed for depression in different ethnic populations, including BICC1 rs9416742 in a UK population (13), SIRT1 rs12415800 in a Chinese Han population (14), and rs12462886 of a non-coding region in a US population (15). However, the results of GWAS for MDD have been questioned because of a lack of generalizability and interpretability (11). It has also been proposed that previously identified candidate genes are likely to be false positives (16). In particular, the variants identified using GWAS approaches usually have low penetrance, and few have had their associations with depression onset confirmed molecularly. To date, strong depression-associated variants have not yet been identified; a large gap remains for the translation of our current knowledge of depressive disorders to efficient clinical therapy.
To narrow this gap, in the present study, we conducted a pedigree analysis in a three-generation Chinese family with depression. We first portrayed the genetic mutation profiles for every family member, from which we identified rare variants with high penetrance that were associated with familial depression. We then performed a protein structure–activity relationship analysis and multimodal brain image analyses to interpret the potential roles of the selected variants in depression onset.
Materials and Methods
This study was approved by the Clinical Research Ethics Committee of the Xiamen Xianyue Hospital, Fujian, China. All experimental protocols were performed in accordance with the Declaration of Helsinki. Written informed consent was obtained from all participants after a complete description of the study.
Family Pedigree
The pedigree in this study was a three-generation family of 17 members, five of whom were diagnosed with different levels of depressive disorders by multiple doctors from the Xiamen Xianyue Hospital. Diagnoses were made strictly according to the guidelines of the International Classification of Diseases, Tenth Revision (ICD-10), and pathophysiology was carefully assessed by reviewing a thorough history, examination, and workup of each patient. The pedigree at the time of this study is illustrated in Figure 1 and demographic information is shown in Table 1.
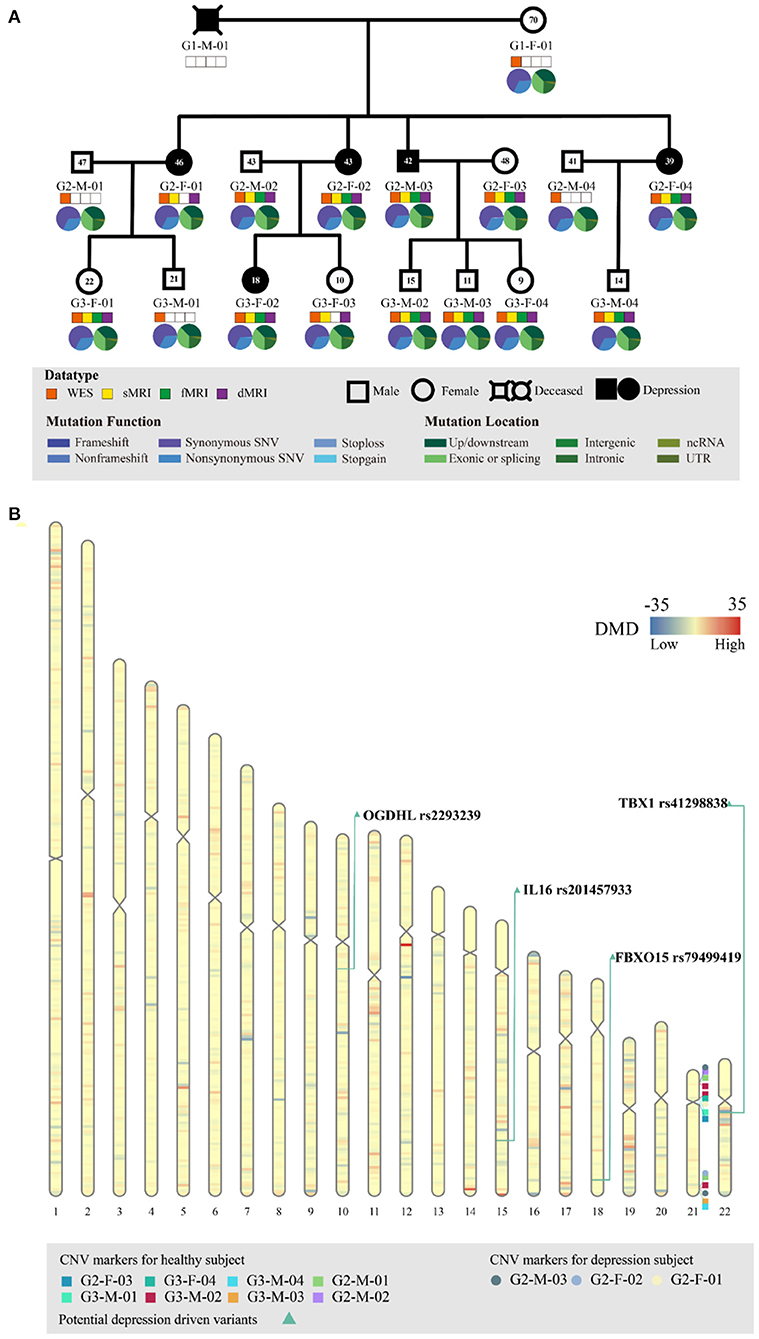
Figure 1. Genetic profiling of the depressive family. (A) The pedigree structure and their genetic mutation profiles. The number inside each large circle or rectangle indicates the age of the family member. The small colored rectangles under the family members indicate the type of data acquired in this study. The pie chart illustrates the mutation composition. (B) The differential mutation density (DMD) landscapes in chromosomes. Several hotspots of differential variants, at 12q12 (DMD = 32.9833), 14q32.33 (DMD = 24.5667), and 15q26.3 (DMD = 22.3000), were observed in the depressive family members, covering 19 genes and 976 variants.
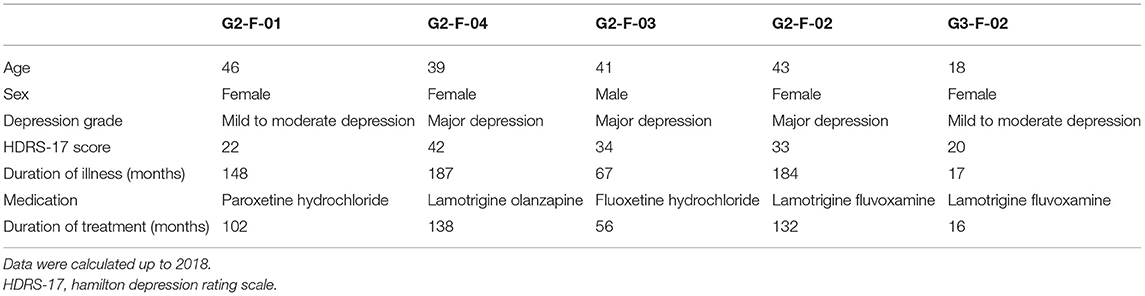
Table 1. Demographic and clinical information of the depressive subjects.
For each family member, 1 mL of peripheral blood was collected in the hospital. Subsequently, plasma separation was conducted by centrifugation at 800 × g for 10 min and 2,500 × g for 10 min consecutively. The separated leukocytes were stored at −80°C before the DNA was extracted.
Mutation Profiling by Whole-Exome Sequencing
The genomic DNA of leukocyte samples was extracted using the EZ-10 Spin Column Blood Genomic DNA Purification Kit (Sangon Biotech Co, Ltd., Shanghai, China). The DNA concentration was measured using the Qubit® DNA Assay Kit and Qubit® 2.0 Fluorometer (Life Technologies, CA, USA). For each sample, 0.6 μg of DNA was used as the input material for the DNA sample preparation. The whole exome was captured using the Agilent SureSelect Human All Exon Kit (Agilent Technologies, CA, USA) and the library for sequencing was prepared according to the manufacturer's instructions. WES was performed by Novogene (Beijing, China) using the Illumina Hiseq platform in a 150-base pair (bp) paired-end mode.
Exome Data Preprocessing and Variant Calling
Before variant calling, quality control was conducted on the raw sequencing data using Trimmomatic (version 0.36; parameters: LEADING = 3, TRAILING = 3, SLIDINGWINDOW = 4:15, MINLEN = 50, http://www.usadellab.org/cms/?page=trimmomatic) (17). Subsequently, Kraken (18) was used to exclude potentially polluted reads. The clean reads were then mapped to the human reference genome (GRCh38) using the Burrows–Wheeler Aligner (19) (v.0.7.17; parameters: mem -t 4 -M). We then used the Genome Analysis Toolkit (20) (GATK, v.4.0.10.1) and Samtools (21) (v.1.9) for basic processing, duplicate marking, and base quality score recalibration. Next, variant calling for germline mutations was conducted using the GATK HaplotypeCaller. Variants were further annotated using ANNOVAR (22) (v.2018Apr16) by referring to databases such as refGene, avsnp150, clinvar_20180603, dbnsfp35a, exac03, exac03nontcga, exac03nonpsych, cosmic70, 1000g2015aug_all, and 1000g2015aug_eas.
Differential Mutation Density
The DMD was determined by summarizing the mutation difference between the depressive and healthy members of the family for every 1,000,000 bp (1 Mbp) segment of chromosome:
where Oi, d indicates the occurrence of a definite mutation i in the depressive members, Nd indicates the number of depressive family members, Oi, h indicates the occurrence of a definite mutation i in the healthy family members, Nh indicates the number of depressive family members, and n indicates the total number of mutations detected in the 1 Mbp segment in this study.
Copy Number Variation Calling and Differential Analysis
eXome Hidden Markov model (XHMM) (23) (v.1.0) and GATK (20) (v.4.0.10.1) were used separately to call CNVs based on exomes. The XHMM method accepted the Burrows–Wheeler Aligner-aligned BAM file as the input. The XHMM module (- PCA) was applied to generate component variation, other modules (- normalization and - matrix) were applied to generate a z-score of read depth and normalization, and the hidden Markov model (- discover) was applied to identify CNVs. The GATK method used the Determine Germline Contig Ploidy module to determine autosomal and allosomal contig ploidy, and subsequently used the Germline CNV Caller module to call CNVs. In the current study, only consensus CNVs that were called by both tools were retained for differential analysis. The CNV differential analysis was conducted between the depressive group and the healthy group using a self-written shell script. The differential CNVs, if available, were further functionally annotated to evaluate their connection with depression using Classify CNV (24) software (v.1.1.0) and referring to the human genome (GRCh38).
Identification of Depression-Associated Variants
We performed a series of bioinformatic analyses one by one to identify depression-associated variants (Figure 2), as follows. (1) A comparison of mutation profiles was performed to extract the differential, non-synonymous, and exonic variants. At the time of this investigation, the third generation of the family were mostly teenagers, when depression is likely under progression but symptoms have not yet appeared. Thus, members of the third generation were excluded from the case–control comparative analysis. The third-generation member G3-F-02, who was diagnosed with depression just before the initiation of this study, was the only exception; she was involved in the variant detection. (2) Genetic segregation analysis was conducted to confirm whether the variants satisfied a Mendelian inheritance model using the segreg program in the Statistical Analysis for Genetic Epidemiology package (25) (v.6.4). Sporadic variants that did not fit the Mendelian inheritance model were excluded because they did not contribute much to familial trait inheritance statistically according to the program. (3) Common variants, with an allele frequency of more than 0.05 in the Exome Aggregation Consortium (ExAC) (26) and the 1000 genome project (27, 28), were excluded. Odds ratios (ORs) were calculated for every retained rare variant following conventional practices, based on the allele frequency difference between the psychosis (ExAC_Psych) and non-psychosis (ExAC_nonPsych) subsets of ExAC release 1.0 (GRCh38). In the same way, we also calculated the ORs for every variant by counting the allele frequency difference between MDDs in Chinese Han women and normal controls in the Convergence of Epicardial and Endocardial Ablation for the Treatment of Symptomatic Persistent Atrial Fibrillation (CONVERGE) study (14). (4) For the remaining variants, deleteriousness was evaluated using 13 different algorithms in dbNSFP (29), including SIFT (30), PolyPhen2 HDIV, PolyPhen2 HVAR (31), LRT (32), MutationTaster (33), MutationAssessor (34), FATHMM (35), PROVEAN (36), MetaSVM, MetaLR (37), GERP++ (38), and PhyloP (39). The variants that were predicted deleterious by at least one algorithm were considered to have high penetrance for depression. Variants with more hits were considered to be more deleterious. The most deleterious variants were considered to be driving variants for depression and were adopted for later functional analyses.
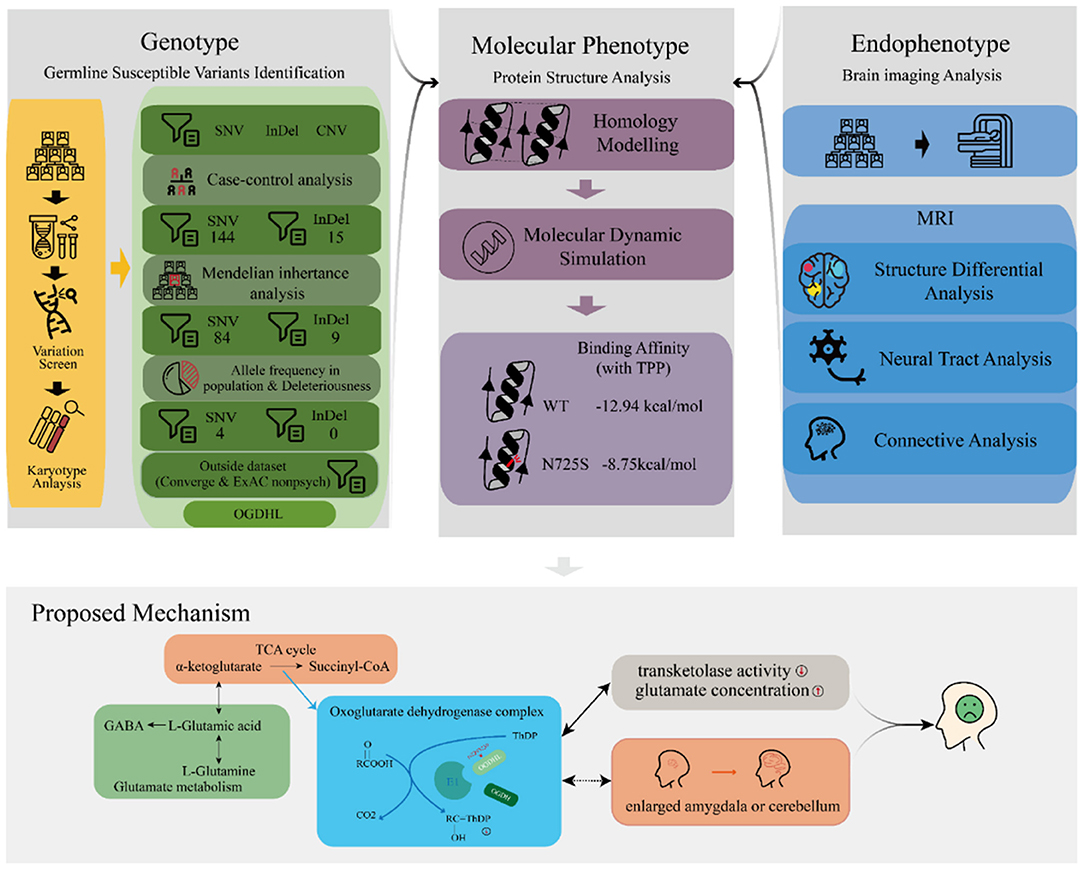
Figure 2. Schema of the discovery of driver variants for the familial depressive disorder.
Protein Structure–Activity Relationship Analysis
Because the human OGDHL protein structure was not yet available in the Protein Data Bank (PDB) database, we used homology modeling to simulate the structure for the structure–activity relationship analysis. The simulation was conducted using the commercial software Molecular Operating Environment (MOE), adopting the multifunctional 2-oxoglutarate metabolism enzyme (PDBID: 2yic) as the template coupled with the cofactor thiamine pyrophosphate (TPP), Ca2+, and Mg2+. The simulated protein structure was stabilized and optimized in a water environment (310 K temperature) using GROMACS software (40) (v.2018.4) for 20 ns molecular dynamics with both force fields: amber general force field (41) and amber ff99SB-ILDN (42). Furthermore, we simulated the mutant protein (OGDHL N725S) by changing the amino acid at position 725 (NP_001334748.1) from asparagine (N) to serine (S), followed by 50 ns molecular dynamics under the same conditions as for the wild-type protein simulation. The structure–activity relationship analysis was performed by evaluating the conformational change and binding affinity between the OGDHL wild type and N725S mutant using MOE software.
Image Data Acquisition and Processing
Magnetic resonance imaging (MRI) of the brain, which included structural MRI (sMRI), functional MRI (fMRI), and diffusion imaging (dMRI), were scanned for every family member when possible. For various reasons, all three imaging modalities were not used for all family members. The image data acquisition statuses are shown in Figure 1A. All images were taken using a MAGNETOM Skyra 3T MRI (Siemens AG, Erlangen, Germany). High-resolution T1-weighted sMRI images were acquired according to a standardized protocol (three-dimensional magnetization-prepared rapid acquisition with gradient echo sequence; repetition time [TR]/inversion time [TI]/echo time [TE] = 2,530/950/2.01 ms; 192 sagittal slices; flip angle = 8°; slice thickness = 1 mm; field of view = 256 × 256 mm2; base resolution = 256). The functional images were obtained using blood oxygen level-dependent contrast-sensitive gradient-echo planar imaging (TE = 30 ms; flip angle = 90°; in-plane resolution = 3.238 × 3.438 mm; volume TR = 2.1 s). The dMRI was acquired using echo-planar imaging (b = 1,000 s/mm2; TR = 11,700 ms; TE = 79 ms; 2 mm thickness, image matrix 112 × 112; field of view = 224 × 224 mm2).
The raw brain images were converted into NIfTI format using dcm2niix (43) (v.25) and were then output for external analyses. For the sMRI images, we used the FIRST module (44) (run_first_all) in FMRIB Software Library (FSL) software (45) (v.6.0.1) to extract the subcortical structure segmentation. Overall, 15 subcortical segments (left-thalamus, left-caudate, left-putamen, left-pallidum, left-hippocampus, left-amygdala, left-accumbens-area, brain-stem, right-thalamus-proper, right-caudate, right-putamen, right-pallidum, right-hippocampus, right-amygdala, and right-accumbens-area) and a cerebellum segment were extracted in this study. The volumes for the subcortical structures and cerebellum were determined using the “fslmath” program of FSL. The volume comparison between the healthy control and depression groups was performed using a randomization test in a self-written R script; its robustness was evaluated using the randomization test. For the fMRI images, raw images were processed for motion correction, field unwarping, normalization, and bias field correction using fMRIPrep (46) software. In the normalized images, the blood oxygen levels of 39 distinct brain regions (nodes) were determined using the Python package nilearn (47), referring to the multi-subject dictionary learning (MSDL) atlas (48). For each family member, the covariance values of the blood oxygen levels between the nodes were calculated to form a 39 × 39 connection matrix. The connectome map was built upon the connection matrix by setting an edge_threshold = 0.99, in which the edge stood for the connectivity [calculated by the tangent (49)] between the nodes. The connection map difference between the healthy control and depression groups was determined using the FSL module randomize (50). The dMRI images were preprocessed using the tract-based spatial statistics (TBSS) module (51) of FSL software to create the fractional anisotropy (FA) image, register the FA image, skeletonize the mean FA image, and project the FA information onto the mean FA skeleton image. The difference in the fiber tract skeleton between the healthy control and depressive groups was then evaluated using the FSL module randomize (50).
Results
Identification of Potential Driver Variants in Familial Depression
WES of the peripheral blood of all 17 family members yielded a mean sequencing depth of 258.94 × (ranging from 234.26 × to 294.52 ×) after quality control (Supplementary Table S1). The sequencing coverage was deep enough for robust variant calling. Overall, 141,022 single nucleotide variants (SNVs) and 19,148 insertion/deletion variants (InDel) were obtained. The distribution of SNVs and InDels in each family member is illustrated in Figure 1A. The family members had almost the same distributions of the different variant types, indicating that the variant calling from WES was well processed.
Before searching for depression-associated variants, we first examined chromosomal integrity by measuring the CNVs caused by abnormal chromosomal events, such as duplication, deletion, rearrangement, or recombination. There were no significant chromosomal differences between the depressive and healthy family members. In particular, no significant CNV differences were observed in the chromosomal region 22q11.2; this region has been linked with schizophrenia and other neuropsychiatric/behavioral disorders. Furthermore, we analyzed the DMD landscapes per 1 Mbp segment of chromosomes (Figure 1B). Three hotspots of DMD (with DMD > 20) were detected, at 12q12 (DMD = 32.9833), 14q32.33 (DMD = 24.5667), and 15q26.3 (DMD = 22.3000). These three DMD hotspots may be chromosomal fragments that are mutual to the depressive members, and are inherited from generation to generation (Figure 1B). These chromosomal fragments covered 19 genes and 976 variants: four genes in 12q12 (SLC2A13, LRRK2, MUC19, and CNTN1), five genes in 14q32.33 (TDRD9, RASPG, KIF26A, C14orf180, and TMEM179), and 10 genes in 15q26.3 (LRRK, CHSY1, SELENOS, SNRPA1, PCSK6, TM2D3, TARS3, OR4F6, OR4F15, and OR4F4). Although a literature search of these genes and variants revealed some clues of their association with depressive or other affective disorders, a series of bioinformatic analyses (including OR association analyses and deleteriousness analyses) on these variants did not confirm their significant association with or penetrance for depression in our pedigree. Hence, we no longer considered the variants at these depression-specific hotspots as the candidate driving force of familial depressive disorders.
To identify potential depression-associated variants, we conducted a series of bioinformatic analyses. The case–control analysis extracted 159 differential, non-synonymous, and exonic variants between the depressive and other family members, including 144 SNVs and 15 InDels. According to the segregation analysis based on the whole mutation profiles, the familial depression likely fit either an autosomal dominant or a recessive Mendelian inheritance gene model (Table 2). Hence, variants that did not fit Mendelian inheritance were excluded; 93 variants were consequently retained, including 84 SNVs and nine InDels. Furthermore, because the estimated incidence rate of depression worldwide is about 2–6% (52), driver genetic variants are more likely to be rare variants than common variants. Accordingly, common variants (with an allele frequency > 0.05 in the population) were also removed from the candidate list by referring to ExAC and the 1000 Genome project. Moreover, a deleteriousness analysis was conducted to evaluate the penetrance of the variants on depression. Only four SNV variants were considered to have high penetrance for depression: OGDHL rs2293239, TBX1 rs41298838, IL16 rs201457933, and FBXO15 rs79499419 (Table 3).
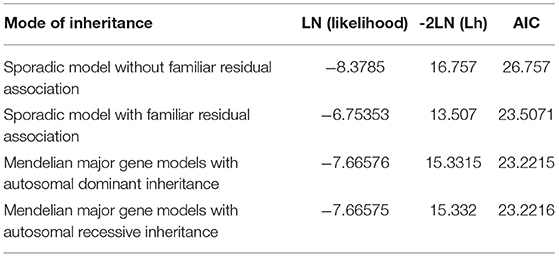
Table 2. Segregation analysis of the family based on the whole-exome sequencing data.
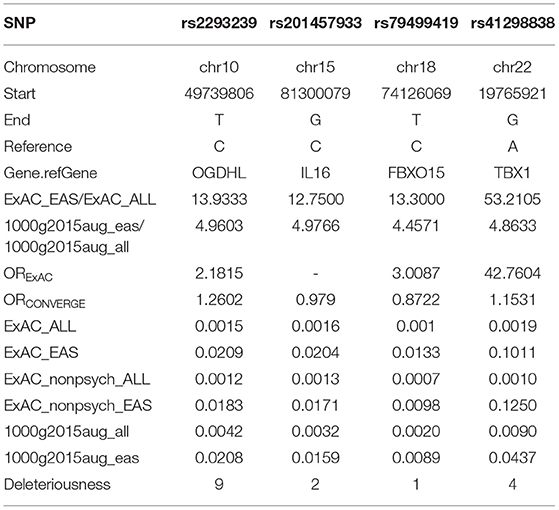
Table 3. Information and allele frequency for the four potential driving variants.
Of these four candidate variants, we speculated that OGDHL rs2293239 was most likely the driving genetic force behind depression in this family. This speculation was based on several pieces of evidence: (1) OGDHL rs2293239 was predicted as highly deleterious by 9/13 algorithms; (2) this variant had a slightly higher frequency in the CONVERGE Chinese depressive women cohort (14) than in the non-psychotic controls (OR = 1.2602); (3) a literature search revealed that OGDHL is related to psychological diseases such as Alzheimer's disease (53), childhood disintegrative disorder (54), and cerebral atrophy (55); and (4) OGDHL is highly expressed in all regions of the human brain according to the Tissue Atlas database (56, 57). Together, these findings suggest that OGDHL rs2293239 is connected with depression. The genetic status of OGDHL rs2293239 in the present family is illustrated in Figure 3A, and the genotypes of this allele were further confirmed by additional Sanger sequencing (Figure 3B). Of the 17 family members, all depressive members carried this variant in a heterozygous genotype. However, we must note that four healthy third-generations also carried this heterozygous mutation but had not yet exhibited depressive or other psychotic disorders (at the time of writing).
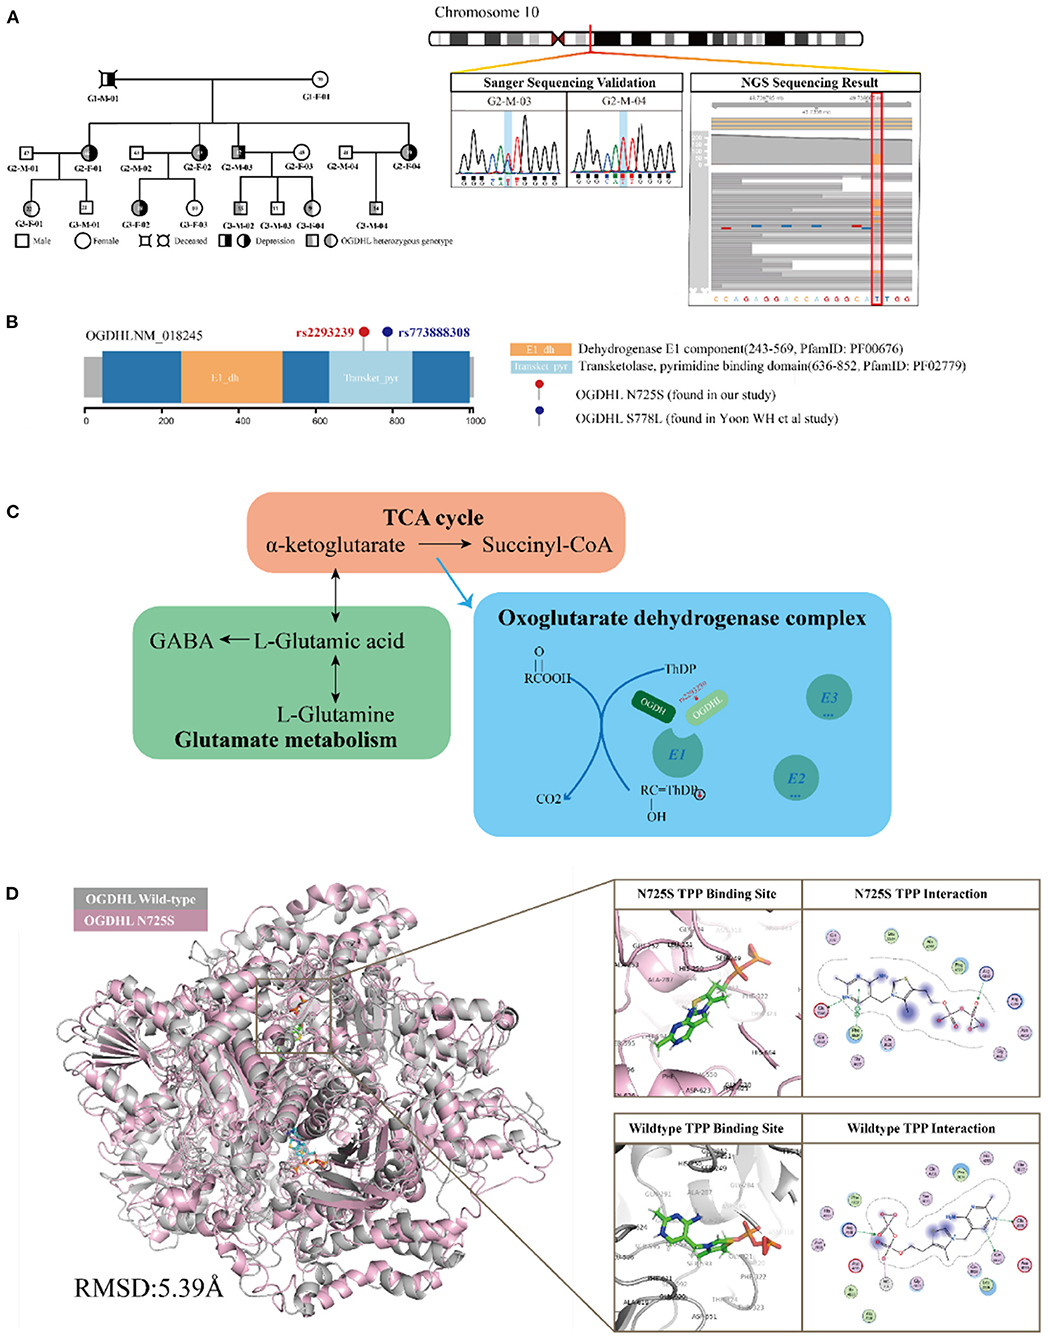
Figure 3. Functional annotation of the oxoglutarate dehydrogenase-like (OGDHL) rs2293239 variant. (A) OGDHL rs2293239 genotypes of the family members are highlighted in gray. The OGDHL rs2293239 genotype was validated by both whole-exome and Sanger sequencing. (B) The rs2293239 variant (N725S) was located at the transketolase pyrimidine binding domain of OGDHL, near the rs773888308 (S778L) variant that was identified in the study by Yoon. (C) The function of OGDHL in glutamate metabolism. (D) The conformation of OGDHL was altered by the rs2293239 mutation, and the binding affinity with cofactor thiamine pyrophosphate (TPP) was weakened by the mutation.
Mutations in OGDHL May Cause Impaired Glutamate Metabolism
OGDHL is known compete with oxoglutarate dehydrogenase (OGDH) in forming the complex E1 subunit, which is essential for catalyzing the conversion of 2-oxoglutarate (α-ketoglutarate) to succinyl-coenzyme A and CO2 in the citric acid cycle. According to Sen et al. (58) and Bunik et al. (53, 59), OGDH and OGDHL are isozymes that are located in different organs. OGDHL is mainly located at the mitochondrial matrix in the brain, and uses TPP as a cofactor (Figure 3C).
OGDHL has two functional domains: the E1 dehydrogenase component (PfamID: PF00676) and the transketolase pyrimidine binding domain (PfamID: PF02779) (Figure 3B). The OGDHL rs2293239 variant that was identified in the family was located in the transketolase pyrimidine binding domain, and resulted in a non-synonymous translation from arginine to serine at position 725 (N725S). Because there are currently no OGDHL structures available in the PDB database, we constructed one using homology modeling. The OGDHL was found to work as a dimer, and cofactor TPP binding occurred at the site between two monomers. We simulated the homodimer of OGDHL coupled with TPP as well as with Ca2+ and Mg2+ (Figure 3D). The binding pattern was analyzed and the critical residues within are illustrated in Figure 3D.
To evaluate the impact of the rs2293239 mutation on protein activity, we also simulated the structure of the OGDHL N725S variant. Compared with the wild-type protein, the N725S mutation induced a 5.39 Å conformational change (Figure 3D), which caused the binding affinity of the TPP–OGDHL dimer to decrease from −12.94 kcal/mol (wild-type) to −8.75 kcal/mol (N725S variant). It was speculated that this change in OGDHL activity may eventually impair glutamate metabolism and raise glutamate concentrations in the brain. Therefore, we measured glutamate levels in the peripheral blood (because of the difficulty in obtaining cerebrospinal fluid) of the family members. The depressive family members had higher blood glutamate levels than the healthy family members (analysis of variance). This result supported our hypothesis that the rs2293239 variant may impair OGDHL function and increase intracellular glutamate.
Endophenotype of the OGDHL Variant
Brain imaging can provide helpful information for identifying endophenotypes in the central nervous system that are caused by genetic mutations. Previously, Yoon et al. reported that the homozygous mutation S778L in OGDHL, which is located at a domain near rs2293239, caused severe neurodegeneration in a 13-year-old patient (55). In the current study, we performed brain imaging analyses for the family members in as much detail as possible (Figure 1). The images were evaluated in three separate analyses. First, we compared the volumes of 15 distinct subcortical structures between five depressive family members and eight healthy family members. There was a significant (t-test, p = 0.03908) volume increase in the left amygdala in the depressive family members (Figure 4A). This result was consolidated by the permutation test, which randomized the depressive and healthy members 10,000 times (p < 0.05) for the differential volume analysis. This finding agreed with the results of previous studies, that MDD patients have comparatively larger amygdalae (60–62). However, there were no significant volume differences in the left amygdala between nine rs2293239 carriers and four family members with wild-type OGDHL. Interestingly, a slight but non-significant volume increase (t-test, p = 0.07) in the left cerebellum was also noted in the nine rs2293239 carriers (Figure 4B). In both comparative analyses, no changes in the shape of subcortical or cerebellar structures were observed.
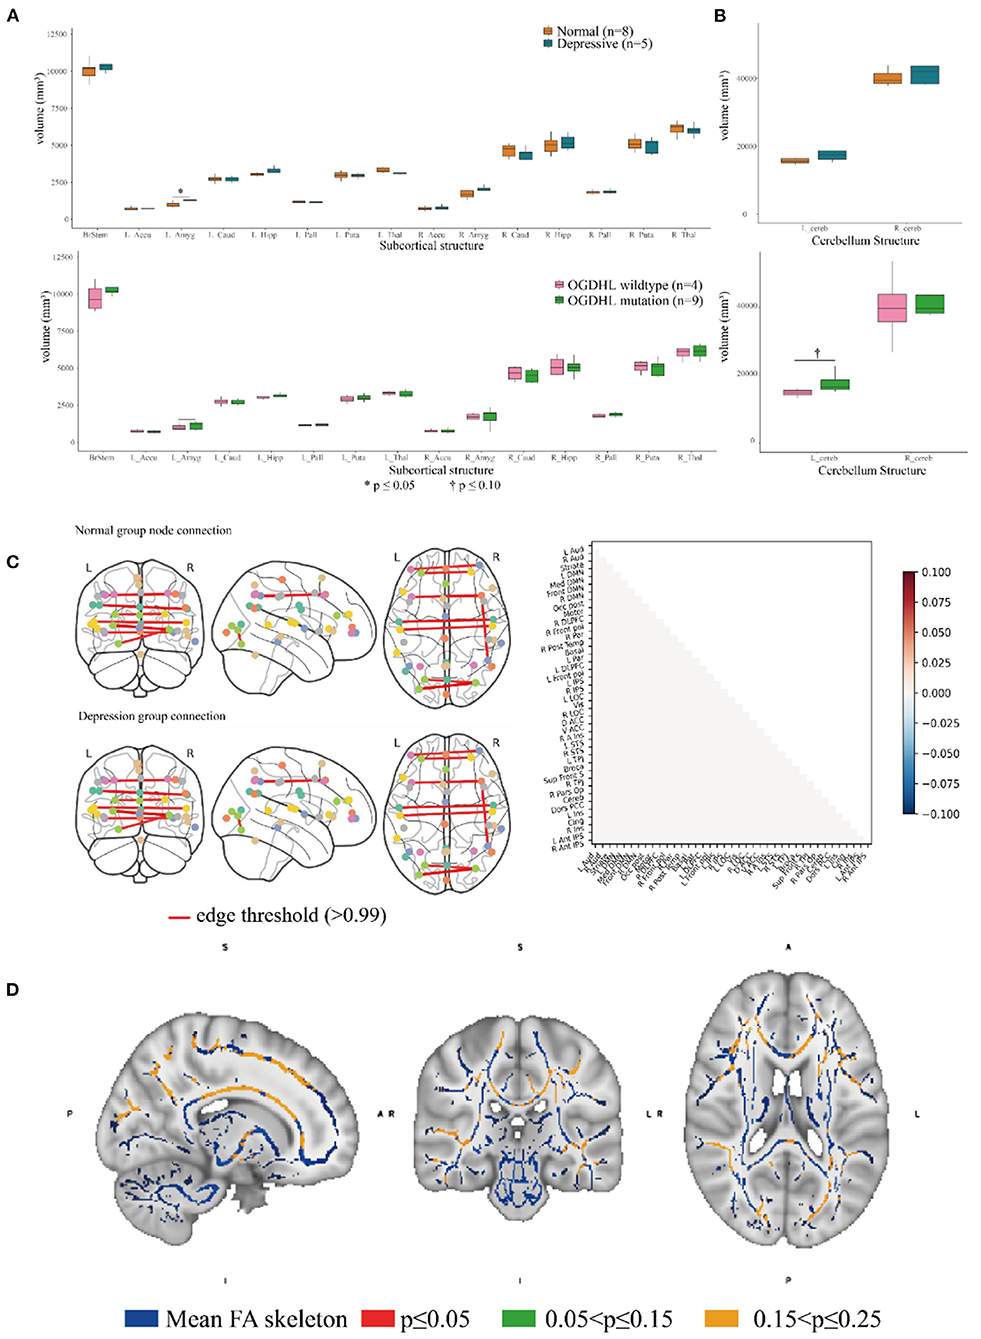
Figure 4. Association analysis of the brain endophenotype with the oxoglutarate dehydrogenase-like (OGDHL) rs2293239 variant. (A) Volume comparison of the subcortical brain structures. The depressive family members had a significantly enlarged left amygdala compared with the healthy family members (t-test, p = 0.0391); however, this volume difference was not significant between rs2293239 carriers and non-carriers. (B) The rs2293239 carriers had a comparatively larger left cerebellum compared with the non-carriers, but this difference was not significant (t-test, p = 0.07). (C) Comparison of brain activity between rs2293239 carriers and non-carriers based on the connectome of 39 distinct brain regions, via an analysis of the time-series of blood oxygen level changes determined by functional magnetic resonance imaging (MRI). (D) Neural tract skeleton integrity analysis based on diffusion MRI. No significant skeleton defects were detected.
Second, we examined the integrity of neural tract skeletons by analyzing dMRI images using a TBSS method. MRI data did not reveal any significant differences among the five patients diagnosed with depression, including structural, functional, and DTI alterations. No significant skeleton defects or structural differences were identified between either the rs2293239 carriers or the depressive family members and the controls (Figure 4C). Finally, we attempted to evaluate changes in brain activity. However, in our fMRI analysis of a time-series of blood oxygen level changes, we did not detect any significant differences in activity in the connections between 39 distinct brain regions (Figure 4D). Therefore, it was considered that the OGDHL rs2293239 variant was unlikely to induce depression by interfering with cerebral cortex activity in this family.
Discussion
OGDHL Variant May Be One of the Major Genetic Factors of Depression Onset
Depressive disorders are heterogeneous in their pathophysiology. To date, identifying the major pathological factors for depression onset in each individual has been something of a “mission impossible,” and the development of precise therapeutic regimens for individuals has also been challenging. Genetic mutations are estimated to account for approximately one-third of all depressive disorders (5, 6, 63, 64). Because genetic factors are inherited from generation to generation, they are the most likely common pathological factors to be identified for depressive disorders. Many studies of twin, pedigree, and case–control cohorts have been performed worldwide, and have identified a variety of depression susceptibility genes, such as SLC6A4, APOE, DRD4, GNB3, HTR1A, MTHFR, and SLC6A3 (11). Unfortunately, however, many of these susceptibility genes have not been be repeated in larger populations or in other cohorts (16). GWAS studies have complemented the population gap, but the common somatic variants identified by these studies mostly have low penetrance for depressive disorders. The poor interpretation and repetition of GWAS results have also meant that such findings have been questioned (11, 16). Notably, using low-coverage whole-genome sequencing, a 2015 case–control study of 5,303 Chinese women with recurrent MDD and 5,337 controls identified two risk loci, at noncoding regions in SIRT1 and LHPP (14). A similar result was obtained in a large Japanese cohort study, which identified that the SIRT1 rs10997875 variant was associated with MDD (65). Furthermore, a mouse study suggested that hippocampal SIRT1 signaling can mediate depression-like behaviors (66), and a clinical trial also observed significantly reduced peripheral blood SIRT1 mRNA in depressive patients compared with healthy controls (67). Together, these findings indicate that SIRT1 is highly susceptible to depression and may be a good therapy target. However, opposing findings have also been reported; in one study, mice with global SIRT1 overexpression had elevated anxiety and increased susceptibility to depression (68). In the current study, we also evaluated SIRT1 variants and their penetrance in the family. Of three distinct susceptible variants (an exonic variant, rs2273773, and two novel intronic variants) that were identified in and near SIRT1, none showed a significant association with depression. In fact, none of the common variants identified in this family were associated with depression.
Instead of seeking common somatic variants, we discovered rare germline variants with high penetrance for depression in the present study. Via a series of bioinformatic analyses, we mined four potential driver variants: OGDHL rs2293239, TBX1 rs41298838, IL16 rs201457933, and FBXO15 rs79499419 (Table 3). These variants satisfied multiple criteria: a strong association with depression, low frequency in the population (less than or nearly equal to the depression incidence rate in Chinese), high deleteriousness, and fit a Mendelian inheritance model.
T-box transcription factor (TBX1) is a probable transcriptional regulator that is involved in development. TBX1 is responsible for most of the physical malformations present in 22q11.2 deletion syndrome, or DiGeorge syndrome, which is a congenital disease that has been implicated in various behavioral abnormalities including schizophrenia and other neuropsychiatric/behavioral disorders (69–71). A recent study also reported that TBX1 in the mouse hippocampus might be linked to monosaccharides–D-ribose-induced depressive-like behavior (72). In the present study, the rare variant rs41298838 was predicted to be highly deleterious to TBX1 function, which made it a potential driving variant for familial depression. However, a close review of this variant in the general population revealed that it has a comparatively high allele frequency (more than 10%) in non-psychotic Asians, according to the ExAC database. In addition, WES analysis and karyotyping did not identify 22q11.2 deletions or other chromosomal arrangements in the family members. These data challenge the idea that TBX1 rs41298838 might be a good candidate for familial depression. Interleukin (IL)-16 is the ligand of cluster of differentiation (CD)4, and can stimulate a migratory response in CD4+ lymphocytes, monocytes, and eosinophils. Several studies have used IL-6, as well as other cytokines, as indicators for monitoring the immune response in the treatment and pathogenesis of affective disorders (73, 74). However, no substantial evidence indicates that IL-6 is directly involved in the development of depressive or other affective disorders. F-box only protein 15 (FBXO15) is the substrate-recognition component of the E3 ubiquitin ligase complex, which is involved in ubiquitin–proteasome-mediated protein degradation. To date, knowledge of the function of FBXO15 remains very limited, and its association with affective disorders or nerve diseases has not yet been well studied. Nonetheless, considering the uncertain relevance of IL-16 and FBXO15 for depressive disorders, we did not prioritize them in the functional investigation.
Compared with TBX1, IL-16, and FBXO15, we found that OGDHL was strongly associated with depressive disorders in a range of different aspects. First, a series of bioinformatic analyses indicated that the OGDHL rs2293239 variant had a strong association with depression onset in the present family. The rs2293239 variant is a very rare mutation in global population (about 0.1%); it is comparatively more frequent in Asian populations (about 2%), and its allele frequency is nearly equal to the incidence rate of depression in Asian populations (75). A previous case–control cohort study (14) reported that the rs2293239 variant occurs more frequently in Chinese depressive women than in nonpsychotic controls (OR = 1.2602). These data suggest that rs2293239 may not be a common driving genetic force for all cases of depressive disorders. However, the rs2293239 mutation in the transketolase pyrimidine binding domain is likely very deleterious, as predicted by nine algorithms in the present study. Via a structure–activity relationship analysis, we revealed that the mutation may cause an important conformational change (about 5.39 Å) in the protein, which would decrease the binding affinity of OGDHL dimer with its cofactor TPP. OGDHL, which competes with the dominant player OGDH, is the rate-limiting component of the oxoglutarate dehydrogenase complex in glutamate metabolism. Inhibition of OGDH(L) results in a two- to three-fold increase in glutamate in neuronal cells (76). Glutamate is a major neurotransmitter in more than 80% of neurons (77), and abnormal glutamate production in neurons and glial cells can cause severe depressive symptoms (78). Thus, we measured serum glutamate levels in the depressive family members. An additional literature search also supported the relationship between OGDHL and psychological diseases. For example, an early study proposed that OGDHL might be linked to neurotransmitter synthesis and Alzheimer's disease (53). Furthermore, aberrant OGDHL copy number may be associated with childhood disintegrative disorder (54). In particular, the homozygous mutation rs773888308 (S778L) of OGDHL, which is a mutation at the transketolase pyrimidine binding domain near rs2293239 (N725S), was found to cause a severely hypoplastic corpus callosum and abnormal cerebellum in a 13-year-old patient (55). This previous work strongly supports our speculation that the rs2293239 mutation likely impairs OGDHL catalytic activity, thus resulting in increased intracellular glutamate and eventually inducing depression.
OGDHL Variant May Cause Brain Structural Changes
In 2017, Yoon et al. attributed the homozygous OGDHL mutation rs773888308 (S778L) to severe neurodegeneration and encephalatrophy in a girl (55). In the present study, we also measured brain structural changes using MRI techniques, and revealed that depressive family members had a significantly enlarged left amygdala compared with healthy family members. This finding agreed with the results of previous cohort studies, that MDD patients have a larger amygdala and smaller anterior cingulate compared with normal controls, with medium to large effect sizes (60–62). Notably, the endophenotype change in the amygdala was not observed in all carriers of OGDHL rs2293239 in the family; three third-generation young variant carriers did not exhibit changes in either the volume or the shape of the amygdala. MDD patients have been reported to have comparatively enlarged amygdalae (79), however this phenomenon may be related to long-term antidepressant use given that the enlargement is less reliably observed in non-medicated patients with MDD (80). It has been suggested that anti-depressive pharmacotherapy associated induction of brain-derived neurotrophic factor and other neuroprotective factors may have a volume-augmenting effect on the amygdala (81). However, these three variant carriers had a comparatively, although non-significantly (p = 0.07), enlarged left cerebellum compared with the non-carriers. In addition, no neural tract defects were identified in the depressive family members via dMRI examination. Moreover, a further case–control comparative analysis of the connectome of different cerebral cortex nodes (regions) did not identify any significant changes in cerebral activity, as indicated by a time-series of blood oxygen levels. It is therefore reasonable to suspect that the changes in cerebral substructures caused by OGDHL rs2293239 may account for the depressive disorders of this family. However, because this genetic alteration was heterozygotic, it may be that OGDHL protein function is only partially defective, and that brain structural changes progress so slowly that depressive symptoms are not apparent in teenagers. It will be necessary to perform animal experiments in the future to validate this hypothesis.
Taking all of our results and the evidence from previous literature together, we propose that OGDHL rs2293239 is likely one of the major genetic driving forces of depression onset in the present family, via the following mechanism (Figure 5). The rs2293239 variant decreases the binding affinity of the OGDHL dimer to its crucial catalytic cofactor TPP, thus weakening its transketolase activity. This alters the glutamate metabolism balance in cells, resulting in increased glutamate concentrations in the brain. As a result of long-term glutamate imbalance, brain structures may change, such as enlargement of the amygdala or cerebellum; furthermore, as a result of glutamate unbalance and brain structural changes, depressive symptoms appear. This hypothesis is partially supported by a recent study that demonstrated that glutamate concentrations in the amygdala may be related to depressive moods (82).
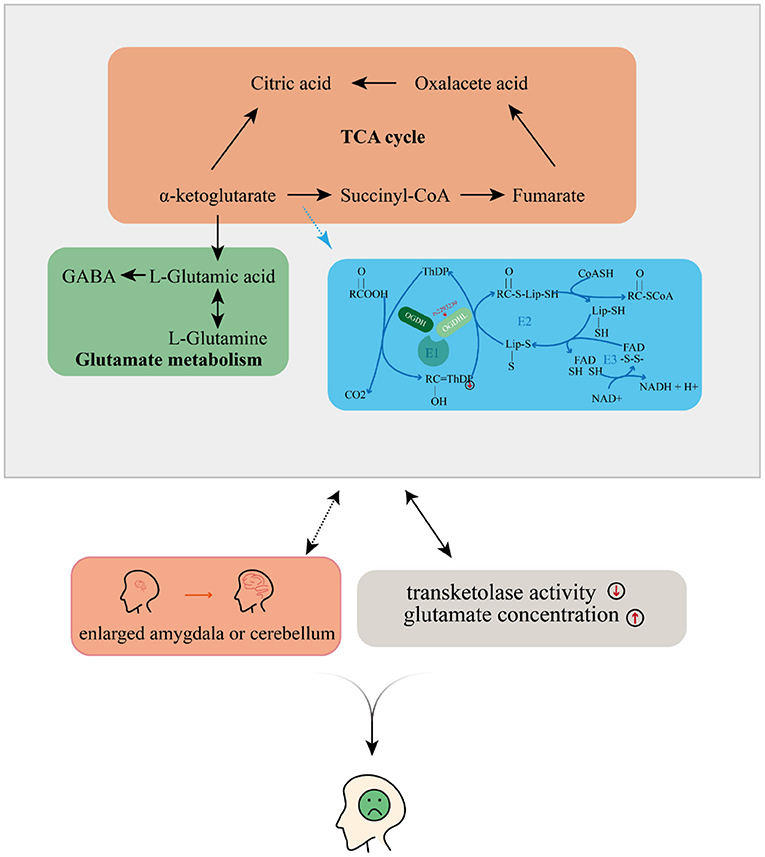
Figure 5. Possible mechanism by which depressive disorders may be induced by the oxoglutarate dehydrogenase-like (OGDHL) mutation.
Nevertheless, there are several uncertainties in the aforementioned hypothesis. The impact of the rs2293239 variant on glutamate metabolism has not yet been experimentally validated, although both computational simulations in the present study and previous work (76) suggest that an inhibition or defect of OGDHL can cause aberrant glutamate metabolism. In the family in the present study, the glutamate concentrations in the amygdala, cerebellum, and other brain structures are unknown because of the difficulty in obtaining cerebrospinal fluid. However, the relatively high peripheral serum glutamate concentration in this family partially supports our hypothesis because rs2293239 is a germline mutation, and should therefore take effect all over the body. Furthermore, causality has not yet been confirmed between brain structural changes and this variant. Although a study by Yoon et al. (55) suggested a strong association between an OGDHL homozygotic mutation and neurodegeneration, the penetrance of heterozygotic mutations for brain structural changes requires further verification by animal experiments. Notably, the rs2293239 variant was the most likely driving mutation mined from hundreds of thousands of germlines SNVs, Indels, and CNVs via a series of conditions. It is not the only genetic factor in familial depression, but it might be the most dominant one. Indeed, the relatively weak association (OR = 1.2602) of this variant with Chinese depressive women (14) suggests that it may not be a common driving genetic force for all cases of depressive disorders.
Conclusion
We identified a novel rare variant of OGDHL, rs2293239, that may serve as the driving force for depression onset in a Chinese pedigree. Combining multi-omics integration and multimodal imaging analysis, or imaging genetics, we revealed the possible mechanism underlying familial depression in this pedigree. This work enhances the current molecular understanding of the complex pathogenesis of depressive disorders. Furthermore, it provides new options for prioritizing better clinical therapeutic regimens and suggests a new protein target for the design of highly specific drugs to treat depressive disorders.
Data Availability Statement
The datasets generated and analyzed during the present study are available from the corresponding author upon reasonable request.
Ethics Statement
The studies involving human participants were reviewed and approved by Clinical Research Ethics Committee of the Xiamen Xianyue Hospital, Fujian, China. The patients/participants provided their written informed consent to participate in this study.
Author Contributions
CZ, ZZ, and HT conceived and designed research. ZP, ZZ, and WW collected data and conducted research. TF, ZL, XL, GD, and GH analyzed and interpreted data. WW and CZ wrote the initial paper. HT and GC revised the paper. WW and GC had primary responsibility for final content. All authors read and approved the final manuscript.
Funding
This study was supported by the National Natural Science Foundation of China (81871018 to WW).
Conflict of Interest
The authors declare that the research was conducted in the absence of any commercial or financial relationships that could be construed as a potential conflict of interest.
Publisher's Note
All claims expressed in this article are solely those of the authors and do not necessarily represent those of their affiliated organizations, or those of the publisher, the editors and the reviewers. Any product that may be evaluated in this article, or claim that may be made by its manufacturer, is not guaranteed or endorsed by the publisher.
Supplementary Material
The Supplementary Material for this article can be found online at: https://www.frontiersin.org/articles/10.3389/fpsyt.2022.771950/full#supplementary-material
Abbreviations
OGDHL, Oxoglutarate Dehydrogenase L; SLC6A4, Sodium-and-chloride-dependent solute carrier family 6 gene number 4; 5-HTTP, 5-Hydroxy Tryptamine Transporter Polymorphism; APOE, Apolipoprotein E; DRD4, Dopamine D4 receptor gene; GNB3, G protein subunit beta 3; HTR1A, 5-Hydroxytryptamine receptor 1A; MTHFR, Methylenetetrahydrofolate reductase; BICC1, BicC family RNA binding protein 1; SIRT1, Sirtuin 1; dbNSFP, database for Nonsynonymous SNPs’ functional predictions, ; SIFT, Sorts intolerant from tolerant; PolyPhen2 HDIV, Polymorphism Phenotyping v2 HumDiv; PolyPhen2 HVAR, Polymorphism phenotyping v2 HumVar; LRT, Likelihood ratio test; FATHMM, Functional analysis through hidden Markov models; PROVEAN, Protein variation effect analyzer; MetaSVM, Meta Support vector machine; MetaLR, Meta Logistic regression; GERP++, Genome evolutionary rate profiling ++; PhyloP, Phylogentic p-values; ff99SB-ILDN, Force field99; MOE, Molecular operating environment; LRRK2, Leucine rich repeat kinase 2; MUC19, Mucin 19; CNTN1, Contactin 1; TDRD9, Tudor domain containing 9; KIF26A, Kinesin family member 26A; C14orf180, Chromosome 14 open reading frame 180; TMEM179, Transmembrane protein 179; LRRK2, Leucine rich repeat kinase 2; CHSY1, Chondroitin sulfate synthase 1; SELENOS, Selenoprotein S; SNRPA1, Small nuclear ribonucleoprotein polypeptide A1; PCSK6, Proprotein convertase subtilisin/kexin type 6; TM2D3, TM2 domain containing 3; TARS3, Threonyl-TRNA synthetase 3; OR4F6, Olfactory receptor family 4 subfamily F member 6; OR4F15, Olfactory receptor family 4 subfamily F member 15; OR4F4, Olfactory receptor family 4 subfamily F member 4; TBX1, T-Box transcription factor 1; IL16, Interleukin 16; FBXO15, F-Box protein 15; LHPP, Phospholysine phosphohistidine inorganic pyrophosphate phosphatase; ExAC, Exome aggregation consortium; WES, Whole exome sequencing.
References
1. GBD 2017 Disease and Injury Incidence and Prevalence Collaborators. Global, regional, and national incidence, prevalence, and years lived with disability for 354 diseases and injuries for 195 countries and territories, 1990-2017: a systematic analysis for the Global Burden of Disease Study 2017. Lancet. (2018) 392:1789–858. doi: 10.1016/S0140-6736(18)32279-7
2. Chisholm D, Sweeny K, Sheehan P, Rasmussen B, Smit F, Cuijpers P, et al. Scaling-up treatment of depression and anxiety: a global return on investment analysis. Lancet Psychiatry. (2016) 3:415–24. doi: 10.1016/S2215-0366(16)30024-4
3. Lynch CJ, Gunning FM, Liston C. Causes and consequences of diagnostic heterogeneity in depression: paths to discovering novel biological depression subtypes. Biol Psychiatry. (2020) 88:83–94. doi: 10.1016/j.biopsych.2020.01.012
4. Villas Boas GR, Boerngen de Lacerda R, Paes MM, Gubert P, Almeida W, Rescia VC, et al. Molecular aspects of depression: a review from neurobiology to treatment. Eur J Pharmacol. (2019) 851:99–121. doi: 10.1016/j.ejphar.2019.02.024
5. Middeldorp CM, Birley AJ, Cath DC, Gillespie NA, Willemsen G, Statham DJ, et al. Familial clustering of major depression and anxiety disorders in Australian and Dutch twins and siblings. Twin Res Hum Genet. (2005) 8:609–15. doi: 10.1375/twin.8.6.609
6. Sullivan PF, Neale MC, Kendler KS. Genetic epidemiology of major depression: review and meta-analysis. Am J Psychiatry. (2000) 157:1552–62. doi: 10.1176/appi.ajp.157.10.1552
7. Lubke GH, Hottenga JJ, Walters R, Laurin C, de Geus EJ, Willemsen G, et al. Estimating the genetic variance of major depressive disorder due to all single nucleotide polymorphisms. Biol Psychiatry. (2012) 72:707–9. doi: 10.1016/j.biopsych.2012.03.011
8. Hu XZ, Lipsky RH, Zhu G, Akhtar LA, Taubman J, Greenberg BD, et al. Serotonin transporter promoter gain-of-function genotypes are linked to obsessive-compulsive disorder. Am J Hum Genet. (2006) 78:815–26. doi: 10.1086/503850
9. Zubenko GS, Maher B, Hughes HB 3rd, Zubenko WN, Stiffler JS, et al. Genome-wide linkage survey for genetic loci that influence the development of depressive disorders in families with recurrent, early-onset, major depression. Am J Med Genet B Neuropsychiatr Genet. (2003) 123b:1–18. doi: 10.1002/ajmg.b.20073
10. Camp NJ, Lowry MR, Richards RL, Plenk AM, Carter C, Hensel CH, et al. Genome-wide linkage analyses of extended Utah pedigrees identifies loci that influence recurrent, early-onset major depression and anxiety disorders. Am J Med Genet B Neuropsychiatr Genet. (2005) 135b:85–93. doi: 10.1002/ajmg.b.30177
11. Flint J, Kendler KS. The genetics of major depression. Neuron. (2014) 81:484–503. doi: 10.1016/j.neuron.2014.01.027
12. Pu J, Liu Y, Zhang H, Tian L, Gui S, Yu Y, et al. An integrated meta-analysis of peripheral blood metabolites and biological functions in major depressive disorder. Mol Psychiatry. (2020) 26:4265–76. doi: 10.1038/s41380-020-0645-4
13. Lewis CM, Ng MY, Butler AW, Cohen-Woods S, Uher R, Pirlo K, et al. Genome-wide association study of major recurrent depression in the U.K. population. Am J Psychiatry. (2010) 167:949–57. doi: 10.1176/appi.ajp.2010.09091380
14. CONVERGE consortium. Sparse whole-genome sequencing identifies two loci for major depressive disorder. Nature. (2015) 523:588–91. doi: 10.1038/nature14659
15. Shyn SI, Shi J, Kraft JB, Potash JB, Knowles JA, Weissman MM, et al. Novel loci for major depression identified by genome-wide association study of Sequenced Treatment Alternatives to Relieve Depression and meta-analysis of three studies. Mol Psychiatry. (2011) 16:202–15. doi: 10.1038/mp.2009.125
16. Border R, Johnson EC, Evans LM, Smolen A, Berley N, Sullivan PF, et al. No support for historical candidate gene or candidate gene-by-interaction hypotheses for major depression across multiple large samples. Am J Psychiatry. (2019) 176:376–87. doi: 10.1176/appi.ajp.2018.18070881
17. Bolger AM, Lohse M, Usadel B. Trimmomatic: a flexible trimmer for Illumina sequence data. Bioinformatics. (2014) 30:2114–20. doi: 10.1093/bioinformatics/btu170
18. Wood DE, Salzberg SL. Kraken: ultrafast metagenomic sequence classification using exact alignments. Genome Biol. (2014) 15:R46. doi: 10.1186/gb-2014-15-3-r46
19. Li H, Handsaker B, Wysoker A, Fennell T, Ruan J, Homer N, et al. The sequence alignment/map format and SAMtools. Bioinformatics. (2009) 25:2078–9. doi: 10.1093/bioinformatics/btp352
20. Van der Auwera GA, Carneiro MO, Hartl C, Poplin R, Del Angel G, Levy-Moonshine A, et al. From FastQ data to high confidence variant calls: the Genome Analysis Toolkit best practices pipeline. Curr Protoc Bioinformatics. (2013) 43:e164. doi: 10.1002/0471250953.bi1110s43
21. Li H, Durbin R. Fast and accurate short read alignment with Burrows-Wheeler transform. Bioinformatics. (2009) 25:1754–60. doi: 10.1093/bioinformatics/btp324
22. Wang K, Li M, Hakonarson H. ANNOVAR: functional annotation of genetic variants from high-throughput sequencing data. Nucleic Acids Res. (2010) 38:e164. doi: 10.1093/nar/gkq603
23. Fromer M, Moran JL, Chambert K, Banks E, Bergen SE, Ruderfer DM, et al. Discovery and statistical genotyping of copy-number variation from whole-exome sequencing depth. Am J Hum Genet. (2012) 91:597–607. doi: 10.1016/j.ajhg.2012.08.005
24. Gurbich TA, Ilinsky VV. ClassifyCNV: a tool for clinical annotation of copy-number variants. Sci Rep. (2020) 10:20375. doi: 10.1038/s41598-020-76425-3
25. Zeegers MP. Statistical methods in genetic epidemiology. J Med Genetics. (2004) 41:958. doi: 10.1136/jmg.2004.021113
26. Karczewski KJ, Weisburd B, Thomas B, Solomonson M, Ruderfer DM, Kavanagh D, et al. The ExAC browser: displaying reference data information from over 60 000 exomes. Nucleic Acids Res. (2017) 45:D840–5. doi: 10.1093/nar/gkw971
27. Auton A, Brooks LD, Durbin RM, Garrison EP, Kang HM, Korbel JO, et al. A global reference for human genetic variation. Nature. (2015) 526:68–74.
28. Sudmant PH, Rausch T, Gardner EJ, Handsaker RE, Abyzov A, Huddleston J, et al. An integrated map of structural variation in 2,504 human genomes. Nature. (2015) 526:75–81. doi: 10.1038/nature15394
29. Liu X, Jian X, Boerwinkle E. dbNSFP: a lightweight database of human nonsynonymous SNPs and their functional predictions. Hum Mutat. (2011) 32:894–9. doi: 10.1002/humu.21517
30. Ng PC, Henikoff S. Predicting deleterious amino acid substitutions. Genome Res. (2001) 11:863–74. doi: 10.1101/gr.176601
31. Adzhubei IA, Schmidt S, Peshkin L, Ramensky VE, Gerasimova A, Bork P, et al. A method and server for predicting damaging missense mutations. Nat Methods. (2010) 7:248–9. doi: 10.1038/nmeth0410-248
32. Chun S, Fay JC. Identification of deleterious mutations within three human genomes. Genome Res. (2009) 19:1553–61. doi: 10.1101/gr.092619.109
33. Schwarz JM, Rödelsperger C, Schuelke M, Seelow D. MutationTaster evaluates disease-causing potential of sequence alterations. Nat Methods. (2010) 7:575–6. doi: 10.1038/nmeth0810-575
34. Reva B, Antipin Y, Sander C. Predicting the functional impact of protein mutations: application to cancer genomics. Nucleic Acids Res. (2011) 39:e118. doi: 10.1093/nar/gkr407
35. Shihab HA, Gough J, Cooper DN, Stenson PD, Barker GL, Edwards KJ, et al. Predicting the functional, molecular, and phenotypic consequences of amino acid substitutions using hidden Markov models. Hum Mutat. (2013) 34:57–65. doi: 10.1002/humu.22225
36. Choi Y, Sims GE, Murphy S, Miller JR, Chan AP. Predicting the functional effect of amino acid substitutions and indels. PLoS ONE. (2012) 7:e46688. doi: 10.1371/journal.pone.0046688
37. Dong C, Wei P, Jian X, Gibbs R, Boerwinkle E, Wang K, et al. Comparison and integration of deleteriousness prediction methods for nonsynonymous SNVs in whole exome sequencing studies. Hum Mol Genet. (2015) 24:2125–37. doi: 10.1093/hmg/ddu733
38. Davydov EV, Goode DL, Sirota M, Cooper GM, Sidow A, Batzoglou S. Identifying a high fraction of the human genome to be under selective constraint using GERP++. PLoS Comput Biol. (2010) 6:e1001025. doi: 10.1371/journal.pcbi.1001025
39. Siepel A, Pollard KS, Haussler D. New methods for detecting lineage-specific selection. In: Apostolico A, Guerra C, Istrail S, Pevzner PA, Waterman M, editors. Research in Computational Molecular Biology. Berlin; Heidelberg: Springer (2006). p. 190–205.
40. Abraham MJ, Murtola T, Schulz R, Páll S, Smith JC, Hess B, et al. GROMACS: high performance molecular simulations through multi-level parallelism from laptops to supercomputers. SoftwareX. (2005) 1–2:19–25. doi: 10.1016/j.softx.2015.06.001
41. Wang J, Wolf RM, Caldwell JW, Kollman PA, Case DA. Development and testing of a general amber force field. J Comput Chem. (2004) 25:1157–74. doi: 10.1002/jcc.20035
42. Lindorff-Larsen K, Piana S, Palmo K, Maragakis P, Klepeis JL, Dror RO, et al. Improved side-chain torsion potentials for the Amber ff99SB protein force field. Proteins. (2010) 78:1950–8. doi: 10.1002/prot.22711
43. Li X, Morgan PS, Ashburner J, Smith J, Rorden C. The first step for neuroimaging data analysis: DICOM to NIfTI conversion. J Neurosci Methods. (2016) 264:47–56. doi: 10.1016/j.jneumeth.2016.03.001
44. Patenaude B, Smith SM, Kennedy DN, Jenkinson M. A Bayesian model of shape and appearance for subcortical brain segmentation. Neuroimage. (2011) 56:907–22. doi: 10.1016/j.neuroimage.2011.02.046
45. Jenkinson M, Beckmann CF, Behrens TE, Woolrich MW, Smith SM. FSL. Neuroimage. (2012) 62:782–90. doi: 10.1016/j.neuroimage.2011.09.015
46. Esteban O, Markiewicz CJ, Blair RW, Moodie CA, Isik AI, Erramuzpe A, et al. fMRIPrep: a robust preprocessing pipeline for functional MRI. Nat Methods. (2019) 16:111–6. doi: 10.1038/s41592-018-0235-4
47. Abraham A, Pedregosa F, Eickenberg M, Gervais P, Mueller A, Kossaifi J, et al. Machine learning for neuroimaging with scikit-learn. Front Neuroinform. (2014) 8:14. doi: 10.3389/fninf.2014.00014
48. Varoquaux G, Gramfort A, Pedregosa F, Michel V, Thirion B. Multi-subject dictionary learning to segment an atlas of brain spontaneous activity. Inf Process Med Imaging. (2011) 22:562–73. doi: 10.1007/978-3-642-22092-0_46
49. Varoquaux G, Baronnet F, Kleinschmidt A, Fillard P, Thirion B. Detection of brain functional-connectivity difference in post-stroke patients using group-level covariance modeling. Med Image Comput Comput Assist Interv. (2010) 13:200–8. doi: 10.1007/978-3-642-15705-9_25
50. Winkler AM, Ridgway GR, Webster MA, Smith SM, Nichols TE. Permutation inference for the general linear model. Neuroimage. (2014) 92:381–97. doi: 10.1016/j.neuroimage.2014.01.060
51. Smith SM, Jenkinson M, Johansen-Berg H, Rueckert D, Nichols TE, Mackay CE, et al. Tract-based spatial statistics: voxelwise analysis of multi-subject diffusion data. Neuroimage. (2006) 31:1487–505. doi: 10.1016/j.neuroimage.2006.02.024
52. Ritchie H, Roser M, Mental Health. Our World in Data (2018). Available online at: https://ourworldindata.org/mental-health
53. Bunik V, Kaehne T, Degtyarev D, Shcherbakova T, Reiser G. Novel isoenzyme of 2-oxoglutarate dehydrogenase is identified in brain, but not in heart. FEBS J. (2008) 275:4990–5006. doi: 10.1111/j.1742-4658.2008.06632.x
54. Gupta AR, Westphal A, Yang DYJ, Sullivan CAW, Eilbott J, Zaidi S, et al. Neurogenetic analysis of childhood disintegrative disorder. Mol Autism. (2017) 8:19. doi: 10.1186/s13229-017-0133-0
55. Yoon WH, Sandoval H, Nagarkar-Jaiswal S, Jaiswal M, Yamamoto S, Haelterman NA, et al. Loss of Nardilysin, a mitochondrial co-chaperone for α-ketoglutarate dehydrogenase, promotes mTORC1 activation and neurodegeneration. Neuron. (2017) 93:115–31. doi: 10.1016/j.neuron.2016.11.038
56. Sjöstedt E, Zhong W, Fagerberg L, Karlsson M, Mitsios N, Adori C, et al. An atlas of the protein-coding genes in the human, pig, and mouse brain. Science. (2020) 367:eaay5947. doi: 10.1126/science.aay5947
57. Uhlén M, Fagerberg L, Hallström BM, Lindskog C, Oksvold P, Mardinoglu A, et al. Proteomics tissue-based map of the human proteome. Science. (2015) 347:1260419. doi: 10.1126/science.1260419
58. Sen T, Sen N, Noordhuis MG, Ravi R, Wu TC, Ha PK, et al. OGDHL is a modifier of AKT-dependent signaling and NF-κB function. PLoS ONE. (2012) 7:e48770. doi: 10.1371/journal.pone.0048770
59. Bunik VI, Degtyarev D. Structure-function relationships in the 2-oxo acid dehydrogenase family: substrate-specific signatures and functional predictions for the 2-oxoglutarate dehydrogenase-like proteins. Proteins. (2008) 71:874–90. doi: 10.1002/prot.21766
60. Hamilton JP, Siemer M, Gotlib IH. Amygdala volume in major depressive disorder: a meta-analysis of magnetic resonance imaging studies. Mol Psychiatry. (2008) 13:993–1000. doi: 10.1038/mp.2008.57
61. Romanczuk-Seiferth N, Pöhland L, Mohnke S, Garbusow M, Erk S, Haddad L, et al. Larger amygdala volume in first-degree relatives of patients with major depression. Neuroimage Clin. (2014) 5:62–8. doi: 10.1016/j.nicl.2014.05.015
62. Vassilopoulou K, Papathanasiou M, Michopoulos I, Boufidou F, Oulis P, Kelekis N, et al. A magnetic resonance imaging study of hippocampal, amygdala and subgenual prefrontal cortex volumes in major depression subtypes: melancholic versus psychotic depression. J Affect Disord. (2013) 146:197–204. doi: 10.1016/j.jad.2012.09.003
63. Geschwind DH, Flint J. Genetics and genomics of psychiatric disease. Science. (2015) 349:1489–94. doi: 10.1126/science.aaa8954
64. Gandal MJ, Leppa V, Won H, Parikshak NN, Geschwind DH. The road to precision psychiatry: translating genetics into disease mechanisms. Nat Neurosci. (2016) 19:1397–407. doi: 10.1038/nn.4409
65. Kishi T, Yoshimura R, Kitajima T, Okochi T, Okumura T, Tsunoka T, et al. SIRT1 gene is associated with major depressive disorder in the Japanese population. J Affect Disord. (2010) 126:167–73. doi: 10.1016/j.jad.2010.04.003
66. Abe-Higuchi N, Uchida S, Yamagata H, Higuchi F, Hobara T, Hara K, et al. Hippocampal Sirtuin 1 signaling mediates depression-like behavior. Biol Psychiatry. (2016) 80:815–26. doi: 10.1016/j.biopsych.2016.01.009
67. McGrory CL, Ryan KM, Kolshus E, Finnegan M, McLoughlin DM. Peripheral blood SIRT1 mRNA levels in depression and treatment with electroconvulsive therapy. Eur Neuropsychopharmacol. (2018) 28:1015–23. doi: 10.1016/j.euroneuro.2018.06.007
68. Libert S, Pointer K, Bell EL, Das A, Cohen DE, Asara JM, et al. SIRT1 activates MAO-A in the brain to mediate anxiety and exploratory drive. Cell. (2011) 147:1459–72. doi: 10.1016/j.cell.2011.10.054
69. Weisfeld-Adams JD, Edelmann L, Gadi IK, Mehta L. Phenotypic heterogeneity in a family with a small atypical microduplication of chromosome 22q11.2 involving TBX1. Eur J Med Genet. (2012) 55:732–6. doi: 10.1016/j.ejmg.2012.08.011
70. Funke BH, Lencz T, Finn CT, DeRosse P, Poznik GD, Plocik AM, et al. Analysis of TBX1 variation in patients with psychotic and affective disorders. Mol Med. (2007) 13:407–14. doi: 10.2119/2006-00119.Funke
71. Chung JH, Cai J, Suskin BG, Zhang Z, Coleman K, Morrow BE. Whole-genome sequencing and integrative genomic analysis approach on two 22q11.2 deletion syndrome family trios for genotype to phenotype correlations. Hum Mutat. (2015) 36:797–807. doi: 10.1002/humu.22814
72. Xu K, Wang M, Zhou W, Pu J, Wang H, Xie P. Chronic D-ribose and D-mannose overload induce depressive/anxiety-like behavior and spatial memory impairment in mice. Transl Psychiatry. (2021) 11:90. doi: 10.1038/s41398-020-01126-4
73. Rotter A, Biermann T, Stark C, Decker A, Demling J, Zimmermann R, et al. Changes of cytokine profiles during electroconvulsive therapy in patients with major depression. J ECT. (2013) 29:162–9. doi: 10.1097/YCT.0b013e3182843942
74. Shinko Y, Otsuka I, Okazaki S, Horai T, Boku S, Takahashi M, et al. Chemokine alterations in the postmortem brains of suicide completers. J Psychiatr Res. (2020) 120:29–33. doi: 10.1016/j.jpsychires.2019.10.008
75. Chiu E. Epidemiology of depression in the Asia Pacific region. Australas Psychiatry. (2004) 12 Suppl:S4-10. doi: 10.1080/j.1039-8562.2004.02099.x-1
76. Bunik VI, Tylicki A, Lukashev NV. Thiamin diphosphate-dependent enzymes: from enzymology to metabolic regulation, drug design and disease models. FEBS J. (2013) 280:6412–42. doi: 10.1111/febs.12512
77. Mathew SJ, Keegan K, Smith L. Glutamate modulators as novel interventions for mood disorders. Braz J Psychiatry. (2005) 27:243–8. doi: 10.1590/S1516-44462005000300016
78. Murrough JW, Abdallah CG, Mathew SJ. Targeting glutamate signalling in depression: progress and prospects. Nat Rev Drug Discov. (2017) 16:472–86. doi: 10.1038/nrd.2017.16
79. Lupien SJ, Parent S, Evans AC, Tremblay RE, Zelazo PD, Corbo V, et al. Larger amygdala but no change in hippocampal volume in 10-year-old children exposed to maternal depressive symptomatology since birth. Proc Natl Acad Sci USA. (2011) 108:14324–9. doi: 10.1073/pnas.1105371108
80. Lorenzetti V, Allen NB, Whittle S, Yücel M. Amygdala volumes in a sample of current depressed and remitted depressed patients and healthy controls. J Affect Disord. (2010) 120:112–9. doi: 10.1016/j.jad.2009.04.021
81. Porter GA, O'Connor JC. Brain-derived neurotrophic factor and inflammation in depression: pathogenic partners in crime? World J Psychiatry. (2022) 12:77–97. doi: 10.5498/wjp.v12.i1.77
Keywords: OGDHL, rs2293239, depressive disorder, Chinese, genetic driver
Citation: Pan Z, Tian H, Fang T, Liu Z, Liu X, Dou G, Huang G, Zhang Z, Chen G, Wang W and Zhuo C (2022) OGDHL Variant rs2293239: A Potential Genetic Driver of Chinese Familial Depressive Disorder. Front. Psychiatry 13:771950. doi: 10.3389/fpsyt.2022.771950
Received: 07 September 2021; Accepted: 21 February 2022;
Published: 18 March 2022.
Edited by:
Federica Galli, Sapienza University of Rome, ItalyReviewed by:
Jacopo Lisoni, Ospedale Civile di Brescia, ItalyWeihua Yue, Peking University Sixth Hospital, China
Copyright © 2022 Pan, Tian, Fang, Liu, Liu, Dou, Huang, Zhang, Chen, Wang and Zhuo. This is an open-access article distributed under the terms of the Creative Commons Attribution License (CC BY). The use, distribution or reproduction in other forums is permitted, provided the original author(s) and the copyright owner(s) are credited and that the original publication in this journal is cited, in accordance with accepted academic practice. No use, distribution or reproduction is permitted which does not comply with these terms.
*Correspondence: Guangdong Chen, cgd936658@163.com; Wenqiang Wang, wwq5392616@sina.com; Chuanjun Zhuo, chuanjunzhuotjmh@163.com; chuanjunzhuo@nandkai.edu.cn
†These authors share first authorship