 Tiantian Pang
 Chengcheng Chen
 Ronghao Fu
 Xianchang Wang
 Helong Yu5*
- 1College of Computer Science and Technology, Jilin University, Changchun, China
- 2Key Laboratory of Symbolic Computation and Knowledge Engineering of Ministry of Education, Jlin University, Changchun, China
- 3School of Computer Science, Shenyang Aerospace University, Shenyang, China
- 4Chengdu Kestrel Artificial Intelligence Institute, Chengdu, China
- 5College of Information Technology, Jilin Agricultural University, Changchun, China
Hyperspectral imaging is a key technology for non-destructive detection of seed vigor presently due to its capability to capture variations of optical properties in seeds. As the seed vigor data depends on the actual germination rate, it inevitably results in an imbalance between positive and negative samples. Additionally, hyperspectral image (HSI) suffers from feature redundancy and collinearity due to its inclusion of hundreds of wavelengths. It also creates a challenge to extract effective wavelength information in feature selection, however, which limits the ability of deep learning to extract features from HSI and accurately predict seed vigor. Accordingly, in this paper, we proposed a Focal-WAResNet network to predict seed vigor end-to-end, which improves the network performance and feature representation capability, and improves the accuracy of seed vigor prediction. Firstly, the focal loss function is utilized to adjust the loss weights of different sample categories to solve the problem of sample imbalance. Secondly, a WAResNet network is proposed to select characteristic wavelengths and predict seed vigor end-to-end, focusing on wavelengths with higher network weights, which enhance the ability of seed vigor prediction. To validate the effectiveness of this method, this study collected HSI of maize seeds for experimental verification, providing a reference for plant breeding. The experimental results demonstrate a significant improvement in classification performance compared to other state-of-the-art methods, with an accuracy up to 98.48% and an F1 score of 95.9%.
1 Introduction
The seed is a vital component of the plant life cycle, containing genetic information and nutrients. It supports plant propagation, survival, adaptability, and dispersal. Healthy and viable seeds are crucial for plant growth and reproduction, increasing plant yields, enhancing plants adaptation to environmental changes, reducing susceptibility to diseases, and contributing to the maintenance of population stability and diversity. By protecting and managing seeds, humanity can preserve and improve plant resources, ensuring food production and ecosystem stability. However, unfavorable conditions such as improper temperature and humidity will lead to the aging and deterioration of seed vigor during storage (Van De Looverbosch et al., 2022). Rapid and accurate identification of seed vigor is essential for improving seed germination rate, increasing plant yield, ensuring product quality and promoting agricultural development. Currently, seed vigor prediction relies on traditional manual inspection, which is non-automated, time-consuming and destructive, requiring specialized training and experienced experts for assessment.
The variations of seed vigor caused by long-term storage, artificial aging and other factors are usually accompanied by changes in the internal physiological and metabolic characteristics of the seeds (Sutton and Punja, 2017). These subtle changes affect the optical properties of the seeds. Hyperspectral imaging technology is used to detect imperceptible internal variations that are not visible to the naked eyes by capturing detailed spectral and spatial information in the visible and near-infrared spectra regions (Yu et al., 2018; Barbedo, 2023). Hyperspectral imaging is a promising technique for rapidly and non-destructive assessment seed vigor. Numerous studies have introduced HSI to capture changes in the optical properties of seeds for predicting seed vigor.
Analyzing the large amount of data generated by hyperspectral imaging presents numerous challenges. With the rapid advancement of computer vision, significant progress has been made in automating seed prediction (Nie et al., 2019; de Medeiros et al., 2020; Wang et al., 2023). Nevertheless, there are still a few urgent issues need to be addressed in predicting seed vigor using HSI.
Firstly, there is an issue of imbalanced seed vigor samples. The collection of seed vigor data relies on the actual germination rate, which inevitably leads to an imbalance between positive and negative samples during the collection process. Sample imbalance will result in difficulties in extracting regular features from the classes with fewer samples due to the limited number of training samples, which will easily lead to overfitting problems. Sample imbalances should be addressed without hesitation in seed vigor prediction with HSI.
Secondly, there are differences in the wavelength extraction of HSI. HSI typically contains hundreds of wavelengths, characterized by feature redundancy, collinearity and so on. Although more spectral features could achieve high accuracy, it might cause information redundancy and complexity. In HSI analysis, traditional machine learning algorithms have focused on improving extraction of characteristic wavelengths. Many algorithms for extracting characteristic wavelengths have been applied to HSI classification in recent years. For example, Cheng et al. (2023) used HSI in the spectral range of 400 to 1000nm to predict seed vigor of broad beans and hyacinth beans. Firstly, they conducted preprocessing on the data, followed by principal component analysis (PCA) and uninformative variable elimination (UVE) to select the optimal wavelengths. Simultaneously, image features were extracted from the RGB images of the three channels. Finally, random forest (RF) and support vector machine (SVM) were employed to construct classification models based on spectral data, image data, and a combination of spectral and image data. The results demonstrated that when spectral data selected by UVE was combined with image data, the SVM model achieved prediction accuracies of 91.67% and 88.89% for broad beans and hyacinth beans. However, the prediction accuracy of most traditional machine learning models based on characteristic wavelengths relies on spectral preprocessing and the selection of characteristic wavelengths, which vary with changes in the dataset and algorithm. When the dataset changes, multiple wavelength selection algorithms and analysis models need to be retried to select the most effective combination, increasing the difficulty of establishing a robust model. Deep learning has excellent self-learning capabilities, automatically extracting and learning relevant features from raw images. However, deep learning models either use all wavelengths for training or adopt non-end-to-end network structures which first employ wavelength extraction algorithms to extract characteristic wavelengths and then train deep learning. These structures limit the ability of deep learning in feature extraction and accurate classification.
Based on the aforementioned, in order to address the issue of imbalanced sample classes and extract more effective characteristic wavelengths, this research introduces the focal loss function and WAResNet network to construct an end-to-end seed vigor prediction model called Focal-WAResNet. The Focal-WAResNet model could effectively extract the effective features among different vigor seeds and solve the problem caused by sample imbalance, thereby effectively improve the ability of seed vigor identification.
To summarize, the main contributions of this paper are as follows:
● This study uses the focal loss function to address the problem of imbalanced seed vigor and improve network performance.
● An end-to-end deep learning model called WAResNet based on HSI is constructed, which can end-to-end extract the characteristic wavelengths of HSI and perform batch and non-destructive vigor prediction for seeds.
● The recognized and state-of-the-art machine learning algorithms are compared with the proposed Focal-WAResNet. The optimal preprocessing algorithm, characteristic wavelengths extraction algorithm and classification algorithm were picked.
● The proposed Focal-WAResNet compares with advanced deep learning algorithms in seed vigor prediction. The effectiveness of Focal-WAResNet is validate through ablation experiments and visualizations using t-SNE and Grad-CAM.
2 Related work
Numerous studies have demonstrated that the combination of machine learning with HSI has achieved significant success in seed vigor classification. Machine learning algorithms applied to HSI classification general are divided into two categories. The first category is traditional machine learning classification algorithms, including linear discriminant analysis (LDA), partial least squares-discriminant analysis (PLS-DA), K nearest neighbors (KNN), decision trees (DT), logistic regression (LR), extreme learning machine (ELM), SVM, RF and so on (Yu et al., 2021; Long et al., 2022; Xu et al., 2022; Zhang et al., 2023). The second category is deep learning which is the subset of machine learning. Deep learning has been successful applied in many smart agricultural fields, which provides potential opportunities for its application in seed vigor prediction (Tu et al., 2021; Thakur et al., 2022; Zhang et al., 2022).
Dimensionality reduction is an essential step in traditional HSI classification. The algorithms commonly used for extracting characteristic wavelengths include competitive adaptive reweighted sampling (CARS), successive projections algorithm (SPA), PCA and UVE (Wakholi et al., 2018; Pang et al., 2021a; He et al., 2022; Jin S. et al., 2022). The swarm intelligence optimization algorithms exhibit strong search capabilities in addressing practical problems. Many studies have successfully applied swarm intelligence optimization algorithms to extract characteristic wavelengths of HSI (Chu et al., 2022). Yang et al. (2021) used traditional machine learning algorithms with HSI to predict the vigor of sugar beet seeds. They applied five preprocessing algorithms: multiplicative scatter correction (MSC), savitzky-golay (SG), standard normal variate (SNV), detrend correction (DET) and second derivative (SD), followed by SPA to extract characteristic wavelengths. The SVM model was established to predict the vigor of sugar beet seeds with full spectra or characteristic wavelengths, and the accuracy of SVM-SPA-SD was 92.32%. Fan et al. (2020) conducted preprocessing using SG, SD and SNV, followed by PCA and SPA to select the most effective wavelengths. Four machine learning methods: adaptive boosting (AdaBoost), SVM, ELM and RF were used to predict the vigor of wheat seeds. The optimal ELM-PCA model achieved a classification accuracy of 88.9%.
Deep learning effectively utilizes the spatial and spectral information of HSI and have exhibited excellent performance in seed vigor prediction (Jia et al., 2023). Jin B. et al. (2022) utilized convolutional neural network (CNN) and traditional machine learning (SVM and LR) with full spectra or characteristic wavelengths selected by PCA to identify the vigor of rice seeds. The accuracy of the CNN network was 96.88%. Pang et al. (2021b) employed 2D convolutional neural network (2DCNN) with HSI to predict the seed vigor of sophora japonica. They used particle swarm optimization (PSO) to optimize network hyperparameters. The optimal PSO-2DCNN model achieved an accuracy of 99.73%.
Table 1 summarizes the relevant researches on predicting seed vigor by combining machine learning with HSI. It is worth noting that the models in the table either utilize full spectra for training or employ non-end-to-end network structures for seed vigor prediction.
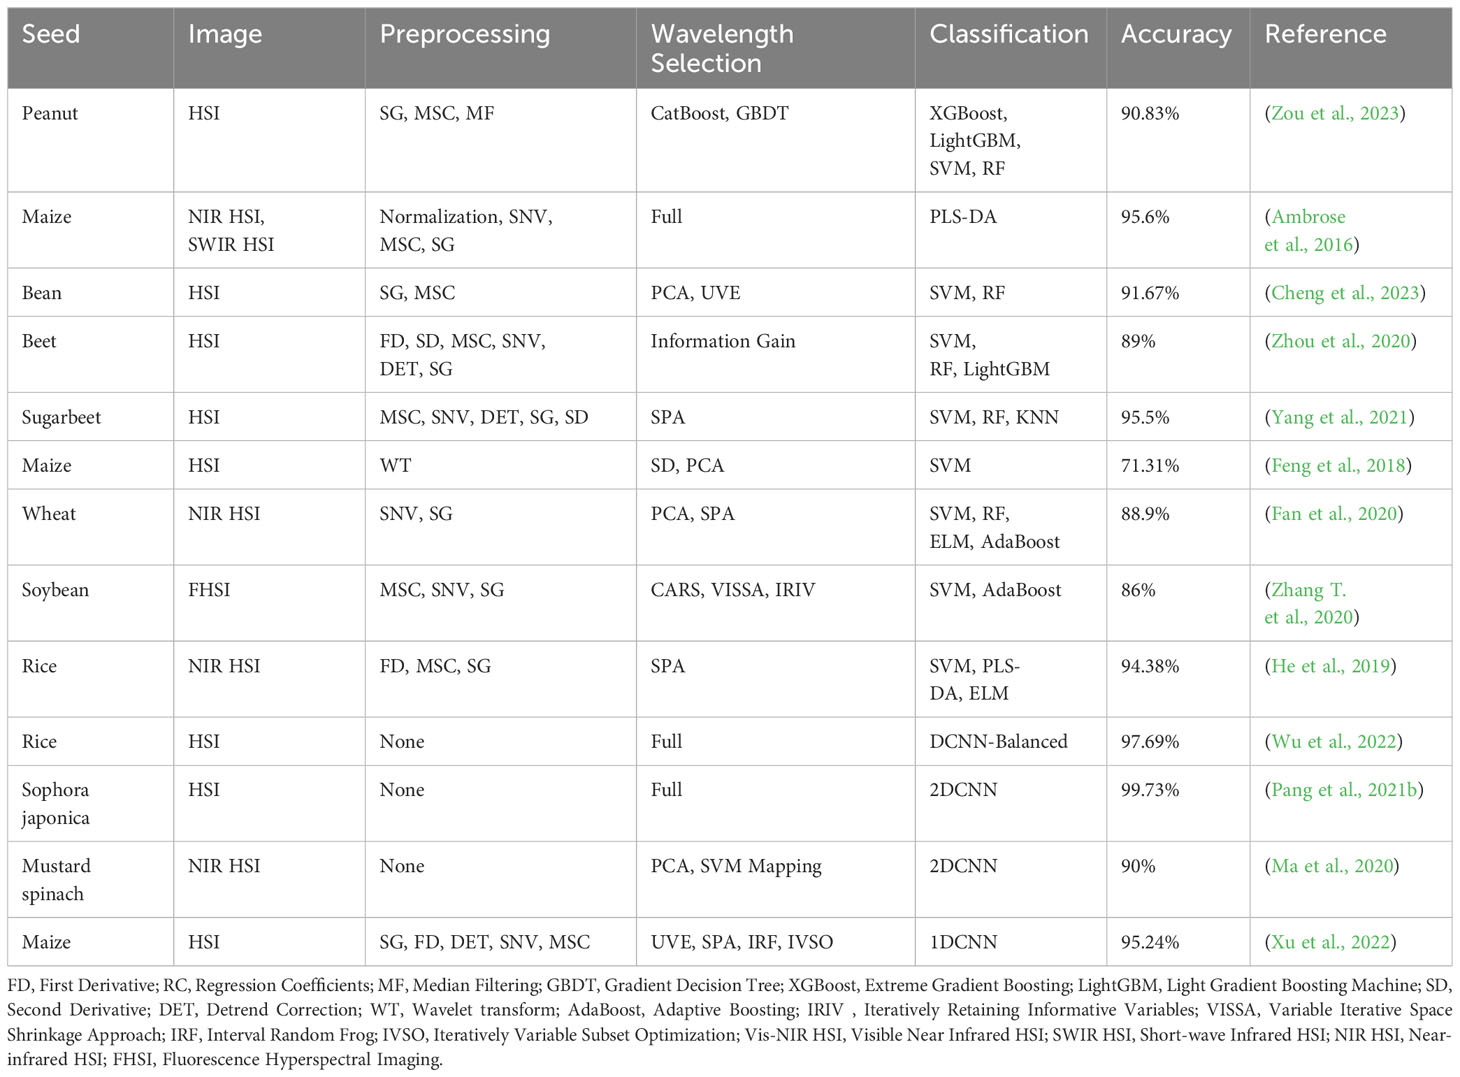
Table 1 Current major methods on seed vigor prediction with HSI.
3 Materials and methods
3.1 Methods
3.1.1 ResNet
The ResNet network proposed by Microsoft Labs is champion network in both the classification and object detection tasks of the 2015 ImageNet Large Scale Visual Recognition Challenge (ILSVRC-2015) (He et al., 2016). ResNet adopts the residual structures to construct network structures. According to the number of layers, ResNet is categorized into ResNet18, ResNet34, ResNet50, ResNet101 and ResNet152. Figure 1A is the residual structure for ResNet with fewer layers: ResNet18 and ResNet34. Figure 1B depicts the residual structure for deeper network like ResNet50, ResNet101 and ResNet152. To avoid overfitting caused by high similarity among seed samples of the same variety, this study utilizes a light network architecture: ResNet18. The network architecture is depicted in Figure 1C. The ResNet18 consists of one stem layer, two pooling layers, eight ResBlocks and one fully-connected layer. The stem layer is a convolutional layer which kernel size is 7×7 with a stride of 2 and 64 convolutional kernels. The two pooling layers are max pooling and average pooling which kernel size is 3 with a stride of 2.
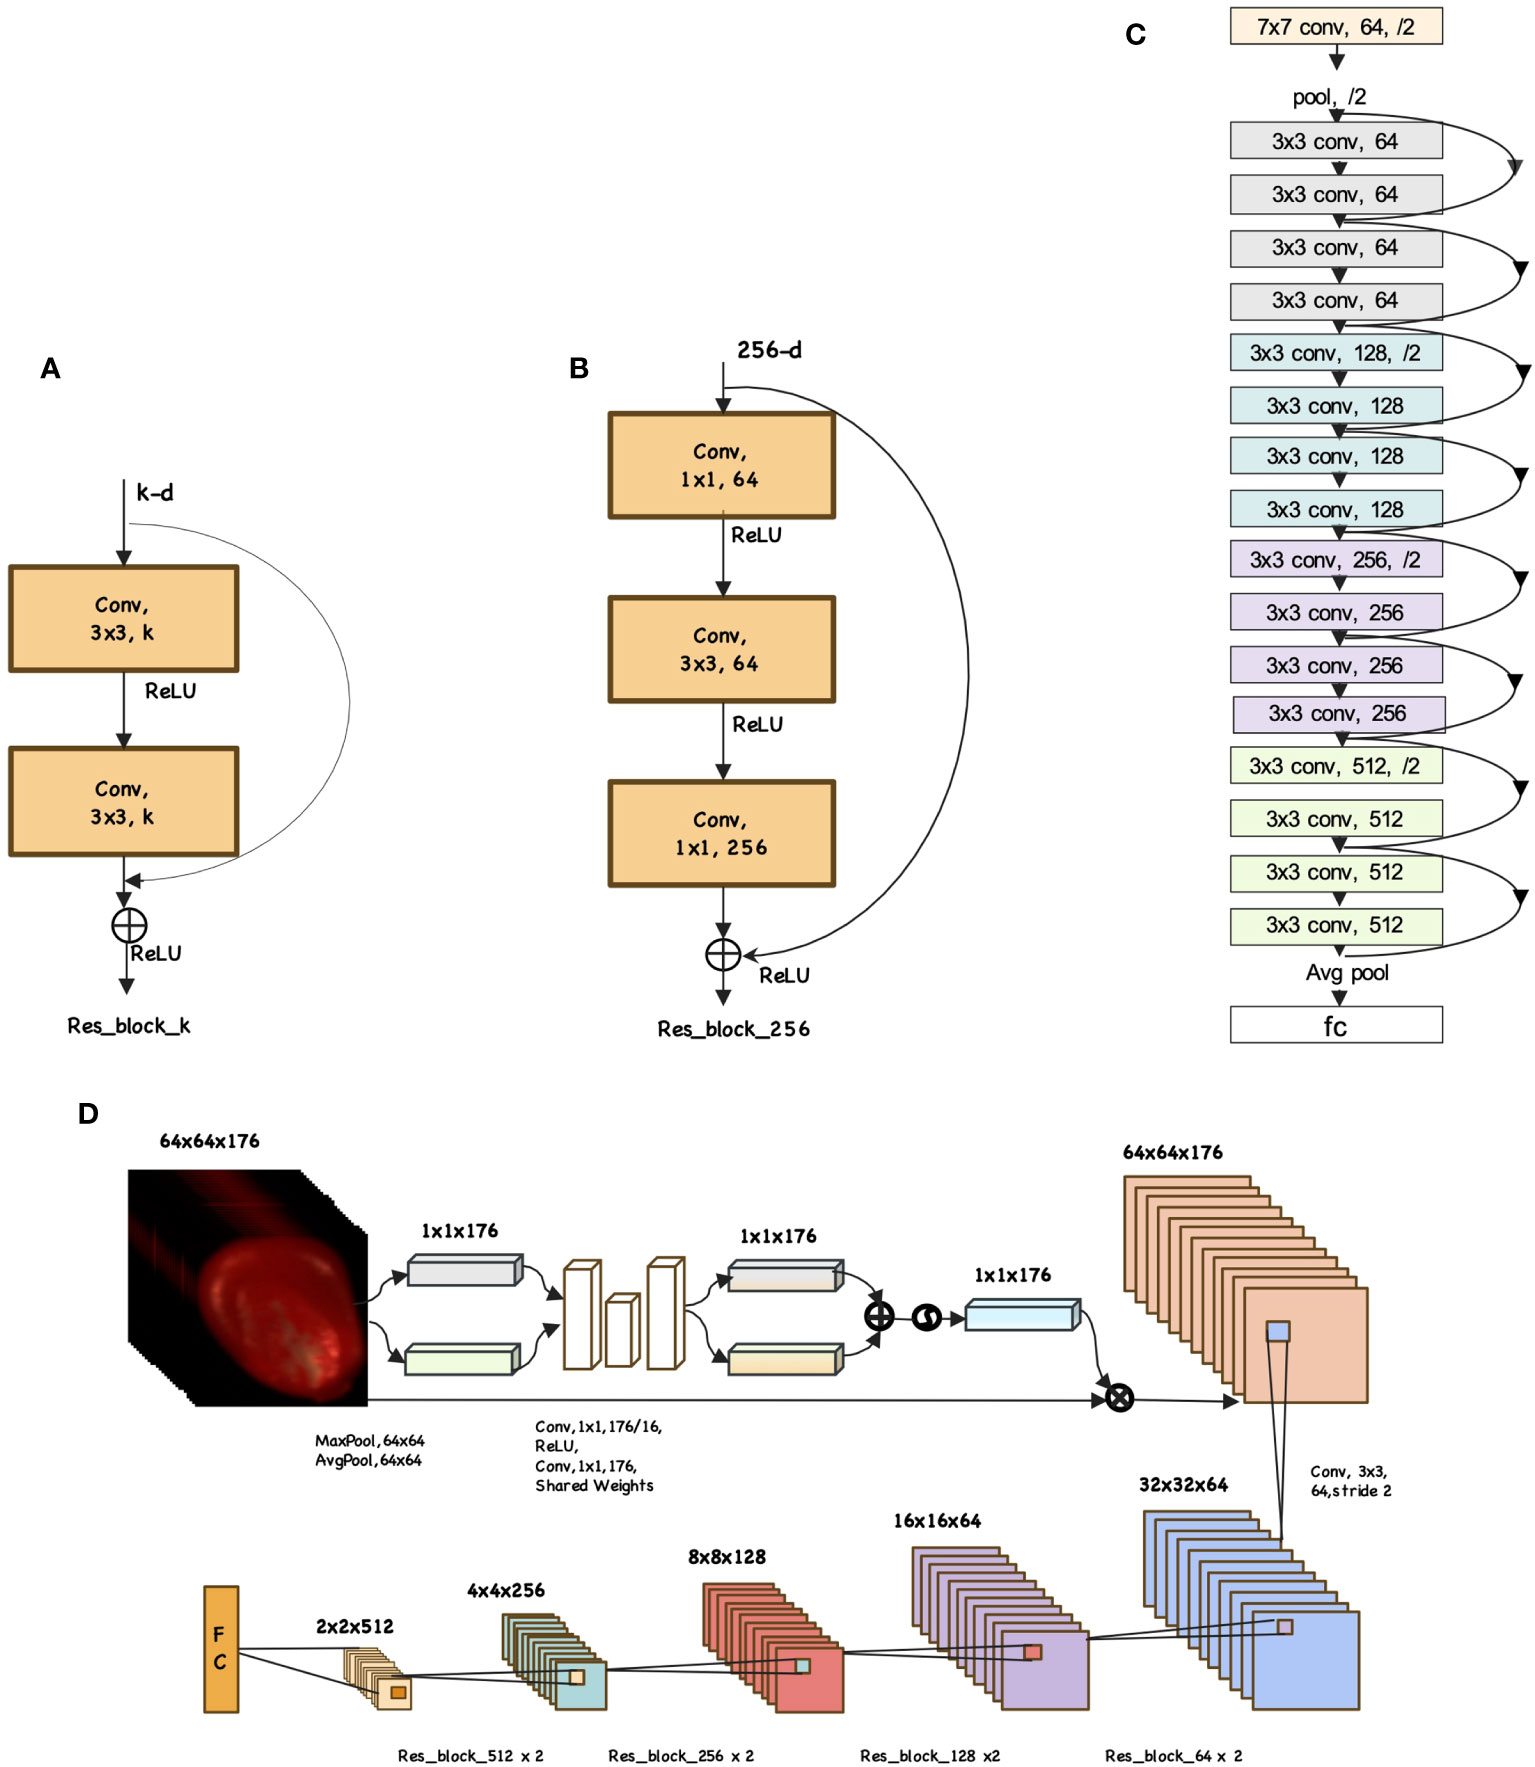
Figure 1 Example network architectures for mazie seed. (A) ResBlock. (B) ResBlockDeep. (C) ResNet18 model. (D) Focal-WAResNet model.
3.1.2 Focal loss
Focal loss is a variant of binary cross entropy loss, which is a common loss function (Lin et al., 2017). Its formula is as follows:
where y of Equation 1 is the ground-truth class of sample, and pt is the model’s estimated probability for the class. The definition of parameter pt is as indicated in Equation 2.
Incorporate weight factor αt into Equation 1 to address the issue of class imbalance. The cross entropy loss could be expressed as Equation 3.
where αt is defined as Equation 4.
While the Equation 3 could address the class imbalance problem, it does not distinguish between difficult and easy samples. A factor (1−pt)γ is introduced to the cross entropy loss. The focal loss function is defined as:
Thus, Equation 5 could adjust the weights of classes and control the weights of easy and hard samples.
3.1.3 Structure of Focal-WAResNet
According to the characteristic of seed HSI, we improve the ResNet18 model and propose an end-to-end model called Focal-WAResNet (wavelength attention ResNet with focal loss) for seed vigor prediction. Figure 1D shows the network structure of Focal-WAResNet. The network consists of two pooling layers, two 2D convolutional layers and ResNet18. The two pooling layers are max pooling and average pooling with a pooling size of 64×64 and a stride of 1. The convolutional kernel size of the two convolutional layers is 1×1, with 11 and 176 convolutional kernels respectively. The first convolution layer is followed by a ReLU activation function. Since the size of the convolutional kernel is 1×1, it only affects calculation between channels without changing the spatial resolution of the feature maps. The resolution of the HSI is normalized to 64×64 in the experiment. Given the relatively small image resolution, the stem layer of ResNet18 is replaced with a 3×3 convolutional layer with a stride of 2. At the end of this network, focal loss function is set as the loss function to measure the errors between the predicted outputs and the actual targets.
The propagation process of Focal-WAResNet network is depicted in Figure 1D. The input X ∈ RW×H×C passes through max pooling and average pooling layers respectively to capture the maximum feature of the channel Xmax ∈ R1×1×C and the mean feature Xavg ∈ R1×1×C. These processes could be characterized by Equations 6 and 7.
The features Xmax and Xavg separately pass through 1×1 convolution layer to reduce dimension to 11. Then, the results go through a ReLU activation function and increase the dimension to the original channel dimension C using another 1×1 convolution layer. These two convolutional layers share weights to reduce the number of model parameters, which can reduce model complexity and the risk of overfitting, and improve model generalization capability. These operations achieve two feature matrices and rescaling in the channel dimension. The addition of the two feature matrices passes through the sigmoid activation function to scale the output value to the range of 0 to 1, obtaining the wavelength attention weights Xwa ∈ R1×1×C. The formula is as Equation 8.
where W0 ∈ RC/r×C and W1 ∈RC×C/r are the weights of the two convolutional layers separately.
Finally, the wavelength attention weights are applied to each channel of the original input using Equation 9. Then the result feeds into the modified ResNet18 network to strengthen or suppress feature representations of different channels to improve the model performance.
where ⊗ is element-wise multiplication.
4 Results and analysis
4.1 Data collection
4.1.1 The seed aging experiment
Since the natural aging of seeds is a prolonged process, and according to the different environments in which the seeds are located, the uncertainty of natural aging is comparatively higher. Artificial aging tests enable to artificially control the aging conditions and degree of the seeds, and get more diversified data for reference. To avoid the influence of human subjective factors on the test results, 1200 maize seeds of the same batch “Meiyu 817” were randomly selected from the seed repository before the collection of HSI. Then 600 seeds were randomly selected and divided into three groups with 200 seeds in each group. These three groups were stored at a constant temperature of 20°C, 0°C and -20°C respectively to obtain maize seeds with different degrees of aging: 20°C, 0°C and -20°C. The remaining 600 seeds were vacuum-sealed in plastic bags and placed in a water bath maintained at a temperature of 45°C and a relative humidity of 100% for aging. On the 3rd day, 6th day, and 9th day after the beginning of aging, 200 seeds were separately taken out to obtain maize seeds with different degrees of aging: 3d, 6d, 9d. After the accelerated aging process, HSI collection and standard germination tests were conducted.
4.1.2 The collection of HSI
Obtaining high-quality HSI is the crucial step in HSI analysis. HSI combines traditional imaging with spectral information to obtain both spectral and spatial information in a single scan. In this study, the HSI system included a hyperspectral imager, lighting equipment, a conveyor belt, an electronic transmission control system, and a computer, as shown in Figure 2. The Gaiasky-mini2VN hyperspectral imager with the wavelength range of 393.7-1001.4nm, 176 spectral channels, and the single image resolution of 960 * 1040 from Dualix Spectral Imaging Technology Co., Ltd. was used in the experiment. The other parameters are shown in Table 2. The GaiaSky-mini2-VN constructed high-resolution images I(X, Y, λ) by scanning, where X and Y represented spatial dimensions, and λ represented spectral dimensions. Each pixel of HSI reflected a spectral curve, and each grayscale image corresponded to a spectral band. The lighting system consisted of four 50W halogen lamps, which needed to be adjusted to the appropriate position and warmed up for 30 minutes before the collection of HSI. During the process of capturing HSI, multiple maize seeds were placed on a blackboard. They were transported through the electronic transmission control system and conveyor belt, and photographed by Gaiasky-mini2-VN. To eliminate the effects of uneven illumination and dark current, the HSI was rectified using white and black reference images after obtaining the HSI of maize seeds. The correction formula is depicted in Equation 10.
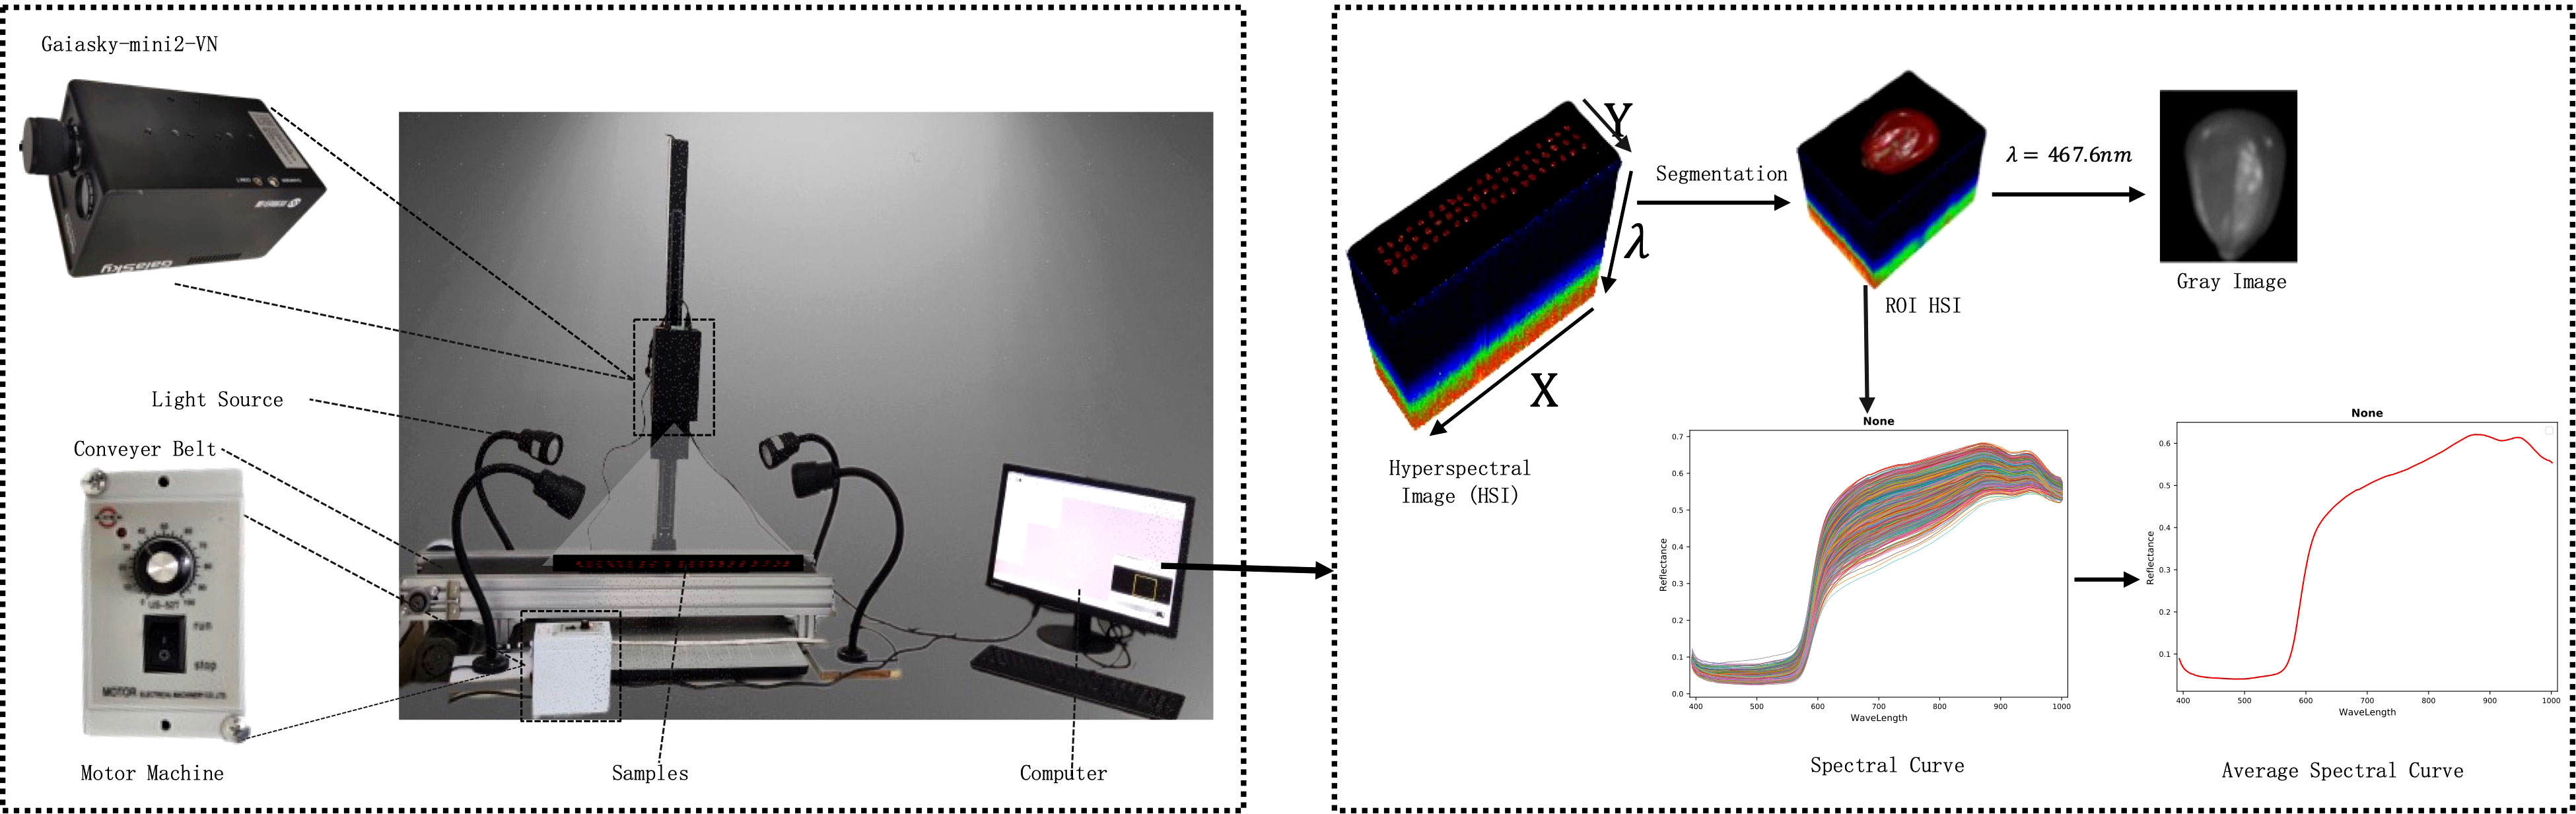
Figure 2 The system and process of HSI acquisition.
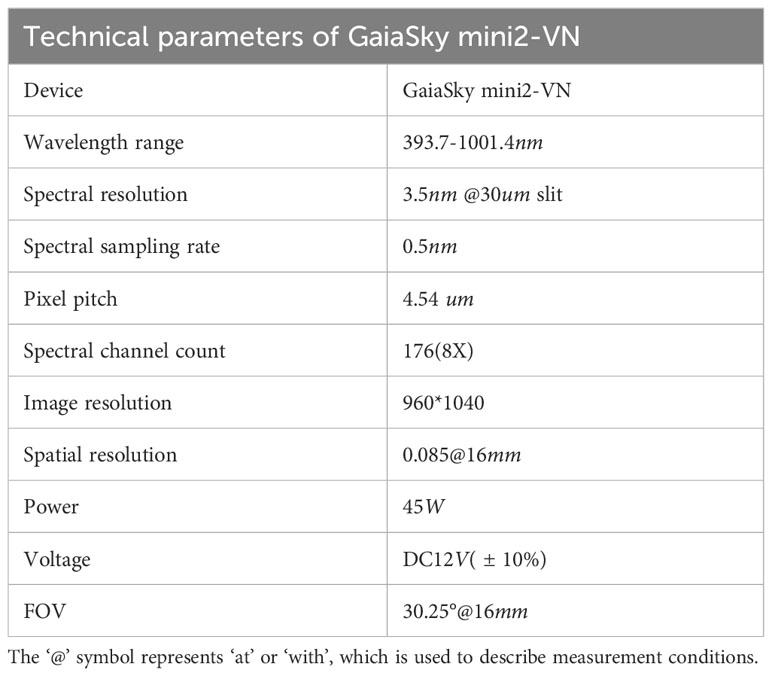
Table 2 Technical parameters of GaiaSky mini2-VN.
where I and Io respectively represented HSI before and after correction. Ib and Iw represented black and white reference images.
Finally, the region of interest which was the HSI of a single maize seed was segmented from the black background. The average spectral curve of each maize seed was extracted as shown in Figure 2.
4.1.3 The standard germination test
Seed vigor refers to the potential germination capacity of seeds or the vitality possessed by seed embryos, representing the potential capacity of seeds to develop into healthy seedlings. In this study, we assess the vigor of maize seeds through standard germination test.
According to the International Rules for Seed Testing, transparent, moisturizing and non-toxic circular petri dishes with a diameter of 120mm were used in the standard germination test (ISTA, 2018). Germination papers which were moistened and drain off surplus water were placed in the sterilized petri dishes. Ten seeds were evenly placed in each petri dish to ensure that each seed had a germination space with a distance of 1-2 times the seed own size, as shown in Figure 3. Put those petri dishes in the germination chamber. The optimum oxygen, moisture, temperature, and lighting conditions for maize seeds were provided and the germination beds remained moist throughout the germination period. According to the technical regulations for crop seed germination (GB/T 3543.4-1995), maize seeds can germinate normally and well under the optimum temperature 20-30°C. In this experiment, the thermostatic germination chamber which temperature was set at 25°C was used to ensure that the temperature variation did not exceed ±2°C.
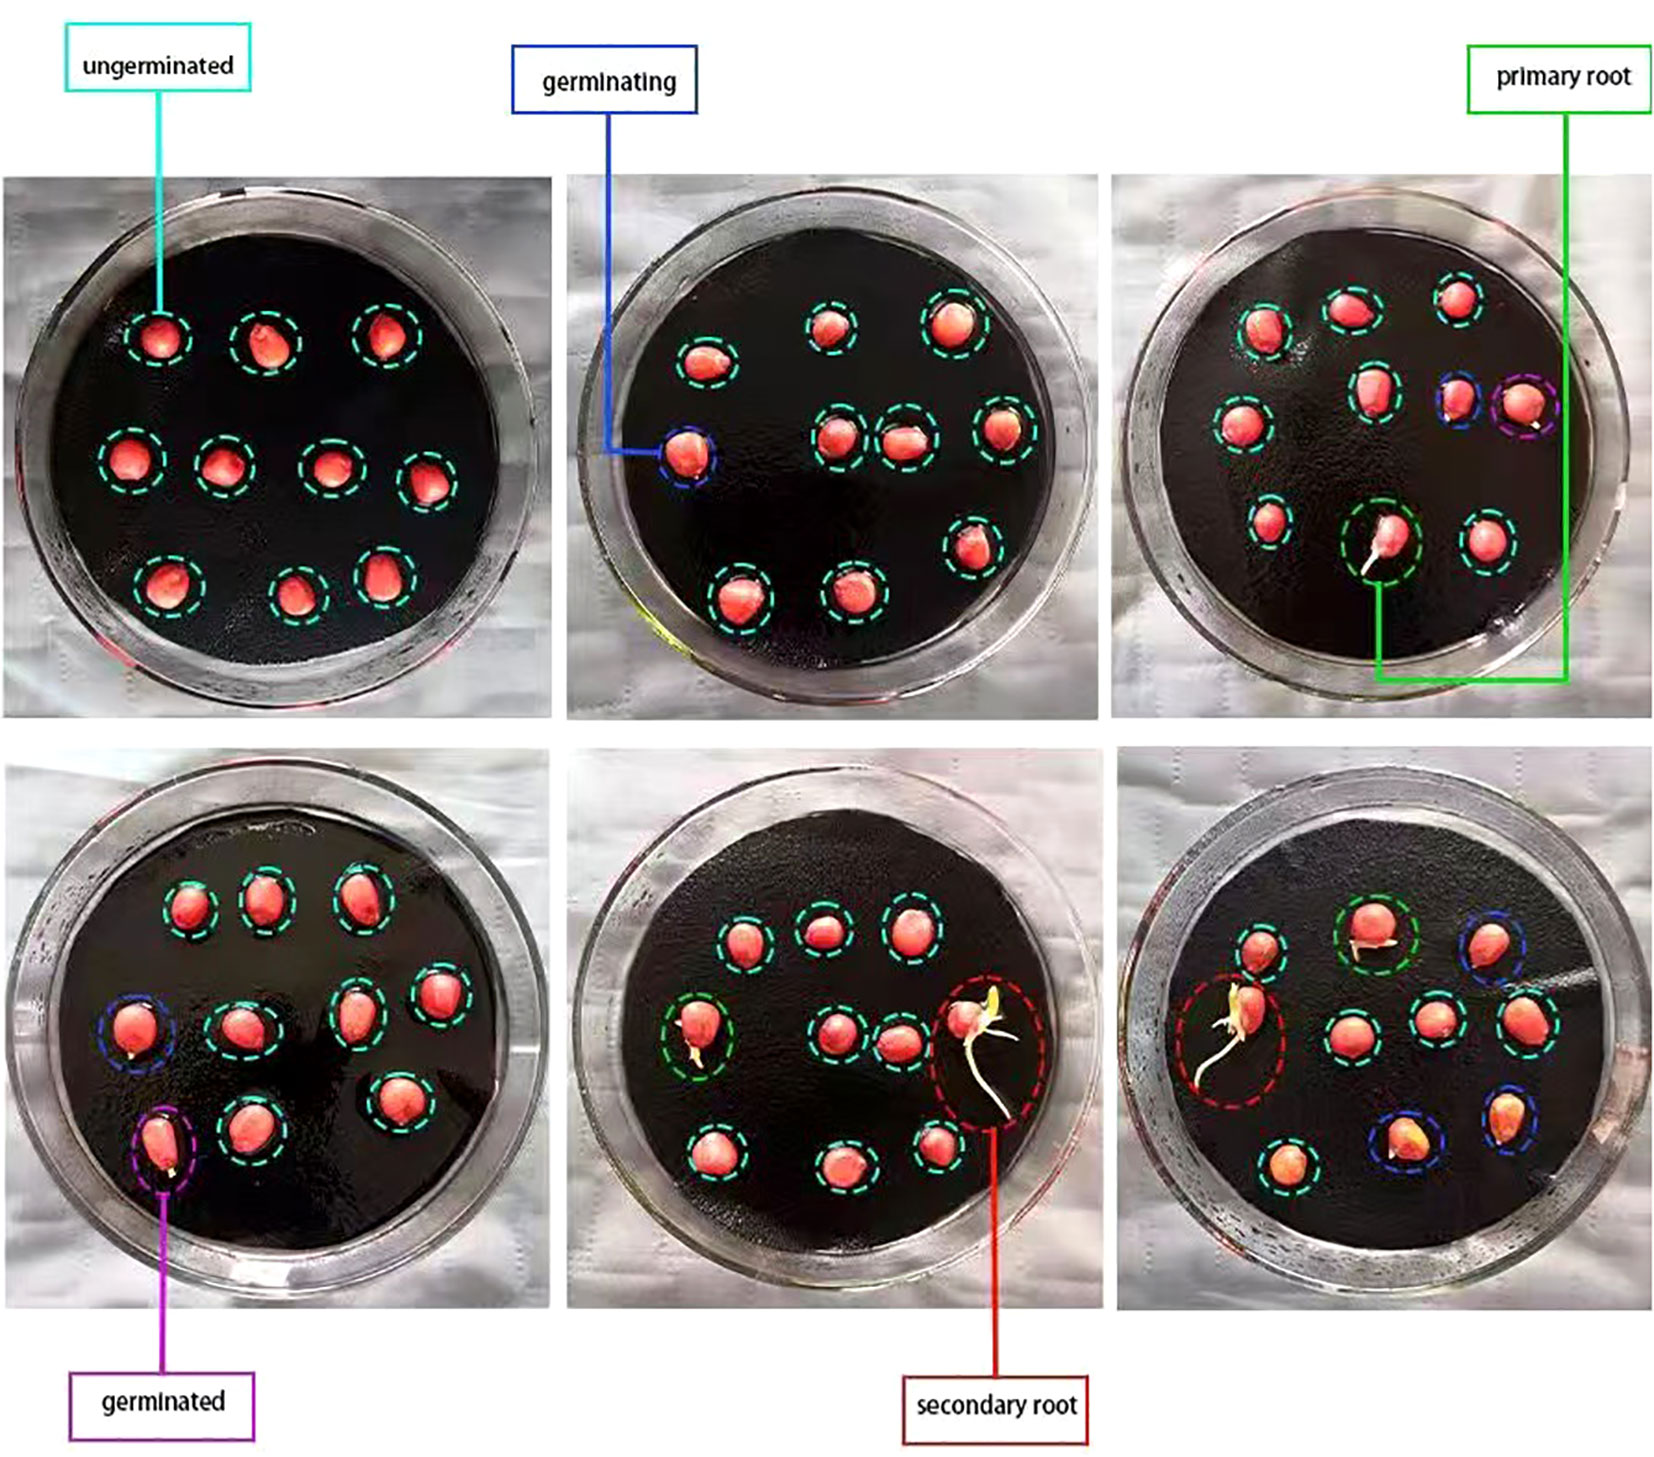
Figure 3 The different stages of seed germination.
Damaged, cracked, malformed, or uneven seeds, as well as the dead seeds which were severely decayed or moldy were promptly removed from the bud beds during the germination process and culled for counting. In the experiment, germinating seeds, germinated seeds, seeds with primary root, seeds with secondary root were defined as viable seeds, and ungerminated seeds, dead seeds and fresh ungerminated seeds were defined as non-viable seeds. As depicted in Figure 3 that the phase in which the radicle of the seed elongates between 0-2mm is characterized as ‘germinating’, whereas the phase with elongation exceeding 2mm is characterized as ‘germinated’. The phase of generating the primary root, derived from the radicle, is termed as the ‘primary root’. The phase in which generates more than one secondary root in addition to the primary root is termed as the ‘secondary root’. On the 7th day of the standard germination test, the germination statuses of six groups of maize seeds with different degrees of aging were recorded, which was referred to as seed vigor statistics. The removed maize seeds are deleted during the statistical process, and a total of 1133 seeds are recorded, of which 915 are viable and 218 non-viable. Lastly, the dataset was divided into training set, validation set and test set at a ratio of 8:1:1.
4.2 Data augmentation
The total number of samples in the dataset is insufficient due to the inability to obtain a sufficient number of hyperspectral images of maize seeds during hyperspectral image acquisition and standard germination tests, which could potentially impact the classification effect of the model. In this study, online augmentation technique was employed to expand the dataset and ensure data diversity. Randomly data augmentation techniques, such as rotation, horizontal flipping, scaling, and so on, were applied during each iteration to generate different training examples. It helps the model better adapt to various input variations without the need to explicitly increase storage space to store augmented examples, reducing the risk of overfitting and improving the model’s generalization and robustness.
4.3 Evaluation metrics
In this study, viable seeds were regarded as positive samples, while non-viable seeds were regarded as negative samples. Accuracy, precision, recall, F1 were used to evaluate the performance of the model. The calculation formula of each metric was shown in Table 3B, where TP, TN, FP, and FN represent the numbers of true positive samples, true negative samples, false positive samples, and false negative samples, respectively. The corresponding confusion matrix is presented in Table 3A. Precision reflects the model’s ability to distinguish negative samples. A higher precision indicates a stronger ability of the model to discriminate negative samples. Recall, on the other hand, reflects the model’s ability to distinguish positive samples. A higher recall indicates a stronger ability of the model to discriminate positive samples. F1 is a combination of both precision and recall, and a higher F1 indicates a more robust model.
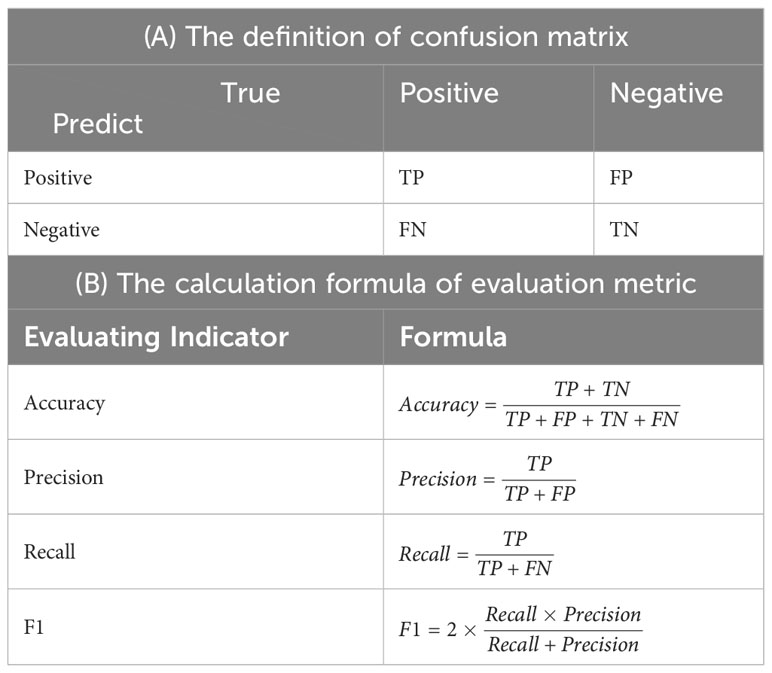
Table 3 Evaluation metrics.
4.4 Analysis of results
4.4.1 Germination and vigor statistics
Figure 4 is the frequency histogram representing the germination of maize seeds at different aging stages. It shows that the germination rates of maize seeds stored at 20°C, 0°C and 3 days of aging are about 99%, and the germination rate of maize seeds stored at -20°C is 100%. The germination rates of maize seeds are hardly affected in these four environments. However, the germination rate drops to 83.33% after 6 days of aging. The germination rate decreases to 6.53% after 9 days of aging. This indicates that aging for a sufficiently long period of time has a serious effect on germination and vigor.
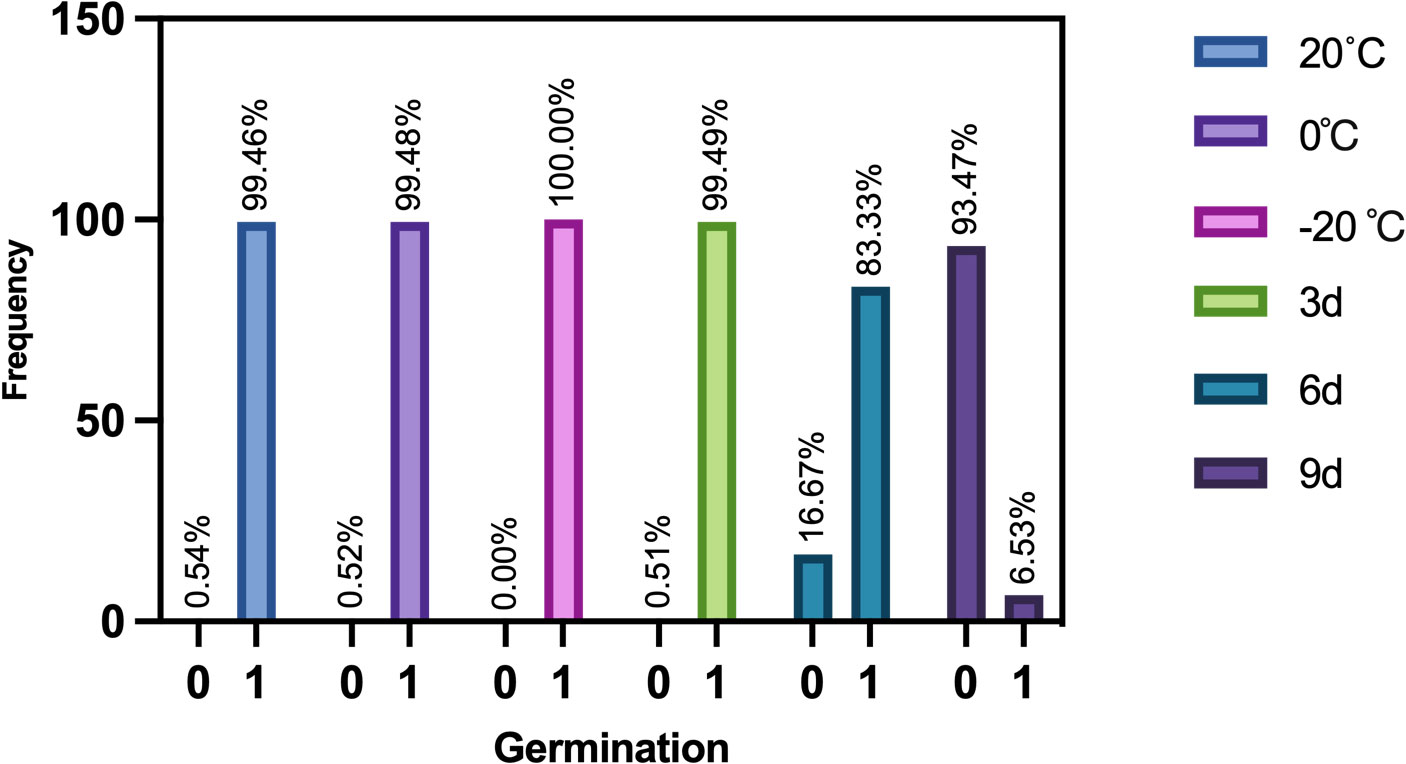
Figure 4 The maize seeds germination frequency at different ageing stages.
4.4.2 Spectral analysis
The variations of seed vigor caused by seed aging typically accompany with changes of seed cell structure, biochemical composition and metabolic characteristic.These tiny changes can affect the optical properties of the seeds. Hyperspectral imaging technology can detect tiny changes that are invisible to the naked eyes. Figure 5A is a box plot of the spectral reflectance of maize seeds at different aging degrees in different bands in the experiment. Given the distinct variations in spectral reflectance across different bands, Figure 5A evenly divides the 176 wavelengths into eight bands to assess the impact of different degrees of aging on the spectral reflectance in different bands. Different colors in the figure represent different bands, and the values from 1 to 6 in the horizontal axis represent different aging degrees: 20°C, 0°C, -20°C, 3d, 6d, and 9d. As indicated in Figure 5A that there are certain differences in the average spectral reflectance of maize seeds with different aging degrees. The spectral reflectance of seeds aged for 6 days and 9 days is higher than others in each band, indicating that the more severe the degree of aging, the higher the spectral reflectance of maize seeds. The spectral reflectance of maize seeds aged for 3 days did not increase, indicating that aging for 3 days did not significantly affect the vigor of maize seeds. Therefore, the germination rate of maize seeds was also not affected, which is consistent with the results of the statistical analysis of germination rate and vigor mentioned above.
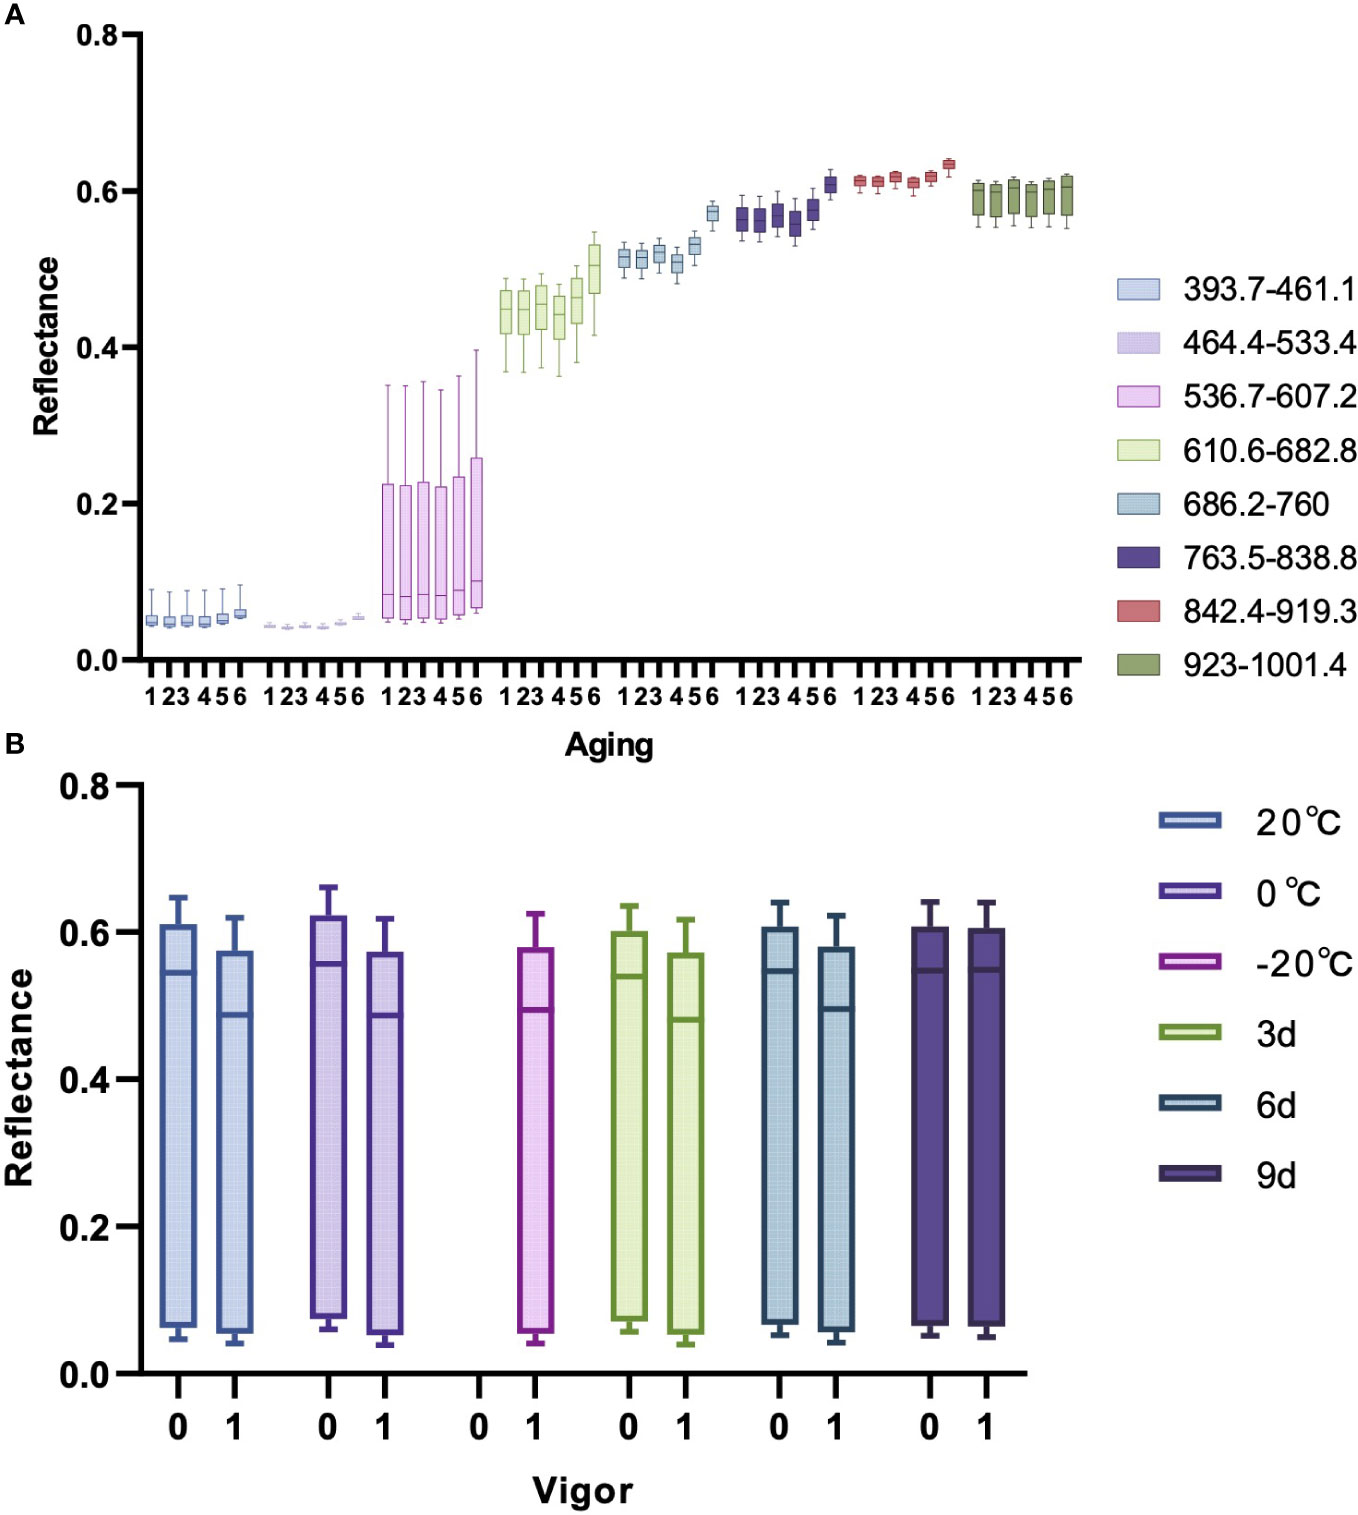
Figure 5 The box plots of spectral reflectance. (A) Box plot of spectral reflectance at different bands for maize seeds at various aging levels. (B) Box plot of spectral reflectance at different aging stages for seeds with different vigors.
Figure 5B is a box plot of the spectral reflectance of maize seeds with different vigor at different aging stages. Different colors in the figure represent different aging degrees, and the values of 0 and 1 in the horizontal axis represent non-viable and viable seeds. Since the seeds stored at -20°C were all viable seeds in the experiment, there is only one box at this aging stage. As observed from the Figure 5B that the spectral reflectance of viable seeds stored at 20°C and 0°C, as well as maize seeds aged for 3 days and 6 days is lower than the non-viable seeds. Since the loss of vigor in maize seeds aged for 9 days has already reached the peak and the seeds will be completely non-viable if the aging continues, the spectral reflectance of the viable maize seeds aged 9 days is almost as high as that of the non-viable maize seeds. This reveals that aging of maize seeds will lead to the wastage of seed vigor and increase the spectral reflectance of maize seeds.
4.4.3 Comparison with traditional machine learning
Currently, HSI classification primarily revolves around traditional machine learning algorithms. Therefore, this section provides a comparative analysis of traditional machine learning algorithms.
The HSI obtained by hyperspectral imaging system includes various noises, such as random high-frequency noise, sample background, baseline drift, scattered light and so on. Therefore, the HSI should be preprocessed to eliminate noises before extracting characteristic wavelengths and data modeling. This experiment compared various preprocessing algorithms based on full spectra, including mean centering (MC), moving average smoothing (MA), SNV, SG, MSC, FD, SD and WT. Figure 6 shows the comparisons of spectral curves between viable and non-viable seeds after different pretreatments with the full spectra. As depicted in Figure 6A that the spectral curves of viable and non-viable maize seeds exhibit similar wave patterns: peaks and valleys appear at similar band positions. This phenomenon may be attributed to the similar chemical composition within the seeds. There are significant spectral differences between viable and non-viable seeds in the wavelength ranges of 393.7-580nm and 620-950nm, which the spectral reflectance of viable maize seeds is lower than non-viable maize seeds. After MC preprocessing (Figure 6C), there are significant differences in spectral reflectance between viable and non-viable maize seeds in the 393.7- 580nm and 620-1001.4nm wavelength ranges. The spectral reflectance of viable seeds is higher than non-viable seeds in the 393.7-580nm and 880-1001.4nm wavelength ranges. The spectral reflectance of viable seeds is lower than non-viable seeds in the 580-880nm wavelength ranges. However, the spectral curves processed by MSC and SNV algorithms (Figures 6B, E) show an obvious overlap of spectral reflectance in the 393.7-580nm wavelength ranges between viable and non-viable seeds. The spectral curve processed by SD shows that the viable and non-viable seeds have more overlapping spectral reflectance. However, the spectral curves preprocessed by the SG, WT and MA algorithms do not show significant differences from the original spectral curves. Further modeling and analysis are needed to select the optimal preprocessing algorithm for predicting maize seed vigor.
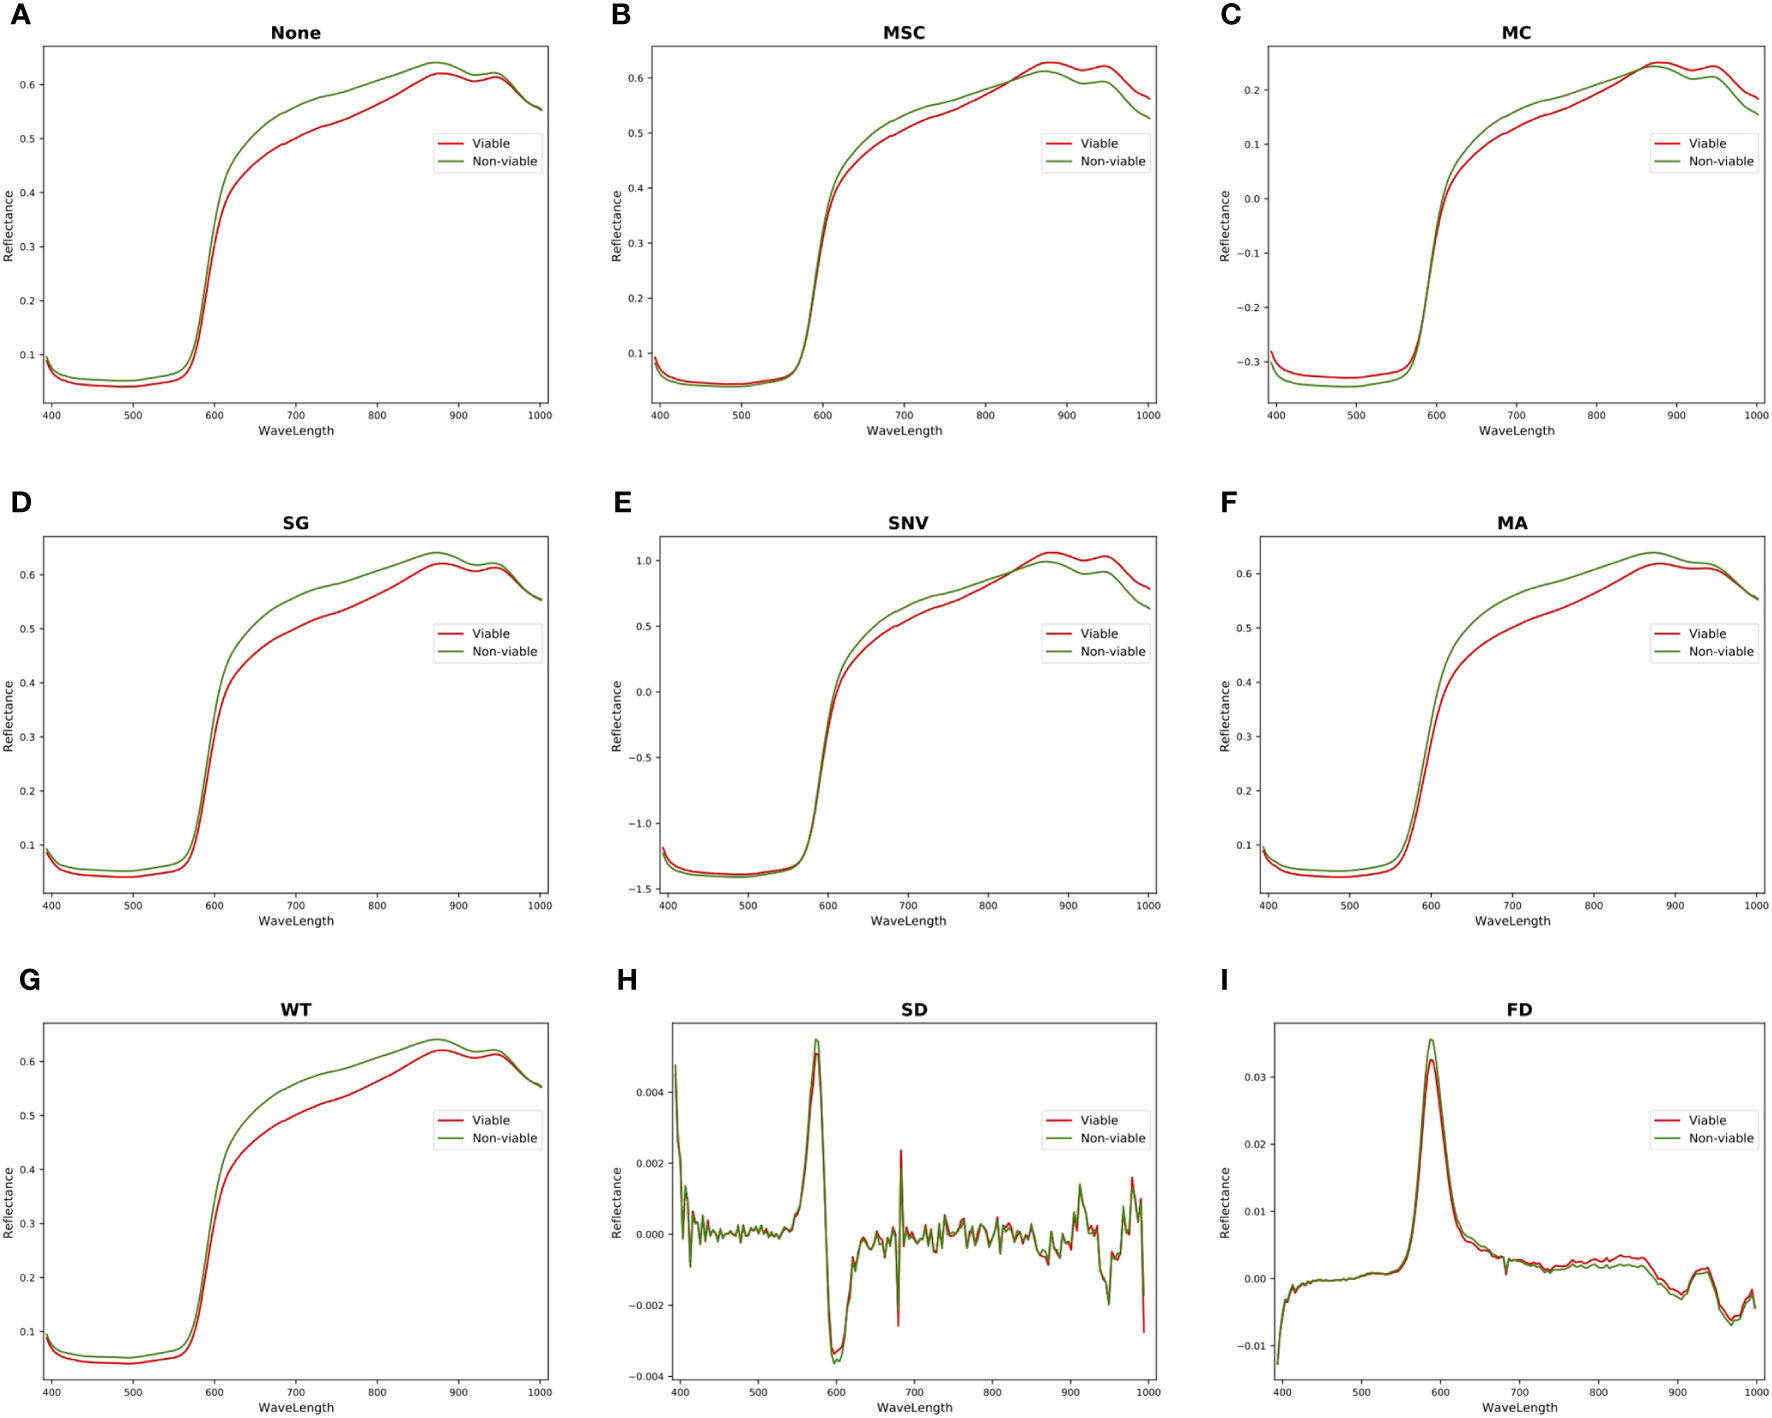
Figure 6 Comparison of spectral curves for viable and non-viable seeds by various preprocessing. (A) None. (B) MSC. (C) MC. (D) SG. (E) SNV. (F) MA. (G) WT. (H) SD. (I) FD.
Table 4 is a statistical table of accuracy for predicting maize seed vigor using different classifiers on HSI processed by different preprocessing algorithms within the full spectra, which noticed that the MC algorithm performs the best on HSI by applying different classifiers, resulting in achieving the optimal classification accuracy of the five classification algorithms: DT, Ridge Regression, KNN, RF and PLS-DA. This is consistent with the analysis results in Figure 6. Because MC preprocessing increases the spectra differences between different classes, it improves the robustness and recognition ability of the model.
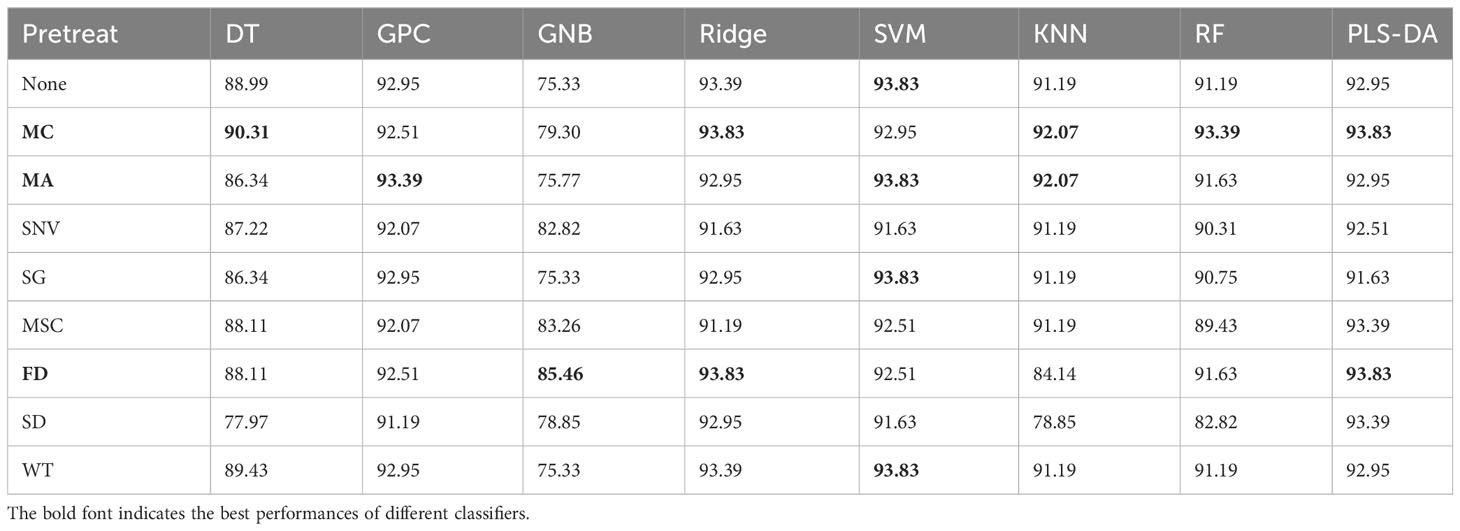
Table 4 Comparison of classification accuracy of different classifiers for seed vigor prediction (%).
To ensure the fairness of the experiment, this study adopted the three optimal preprocessing algorithms to preprocess HSI which was used for wavelength extraction and classification analysis. As can be observed from Table 4, MC, MA and FD algorithms have the prominent preprocessing performance. CARS, SPA, least angel regression (LARS), UVE, PCA as well as various swarm intelligence optimization algorithms which are recognized and advanced algorithms for extracting characteristic wavelengths of HSI were used to extract characteristic wavelengths, including differential evolution (DE) (Storn and Price, 1997), grey wolf optimizer (GWO) (Mirjalili et al., 2014), PSO (Kennedy and Eberhart, 1995), whale optimization algorithm (WOA) (Mirjalili and Lewis, 2016), genetic algorithm (GA) (Holland, 1975) and bat algorithm (BA) (Yang, 2010). After characteristic wavelengths extraction, the optimal machine learning classifier is adopted for seed vigor prediction. In this study, classical machine learning classification models including gaussian process classification (GPC), gaussian naive bayes (GNB), ridge regression (Ridge), PLS-DA, SVM, KNN, RF and DT were compared. Table 5 presents the accuracy statistics of the combined application of MC, MA, FD algorithms with characteristic wavelengths extraction algorithms and classification algorithms for predicting the vigor of maize seeds. As we could identify from Table 5, SVM-UVE-MA and PLS-CARS-FD models predicted the vigor of maize seeds with the highest accuracy of 95.15%.
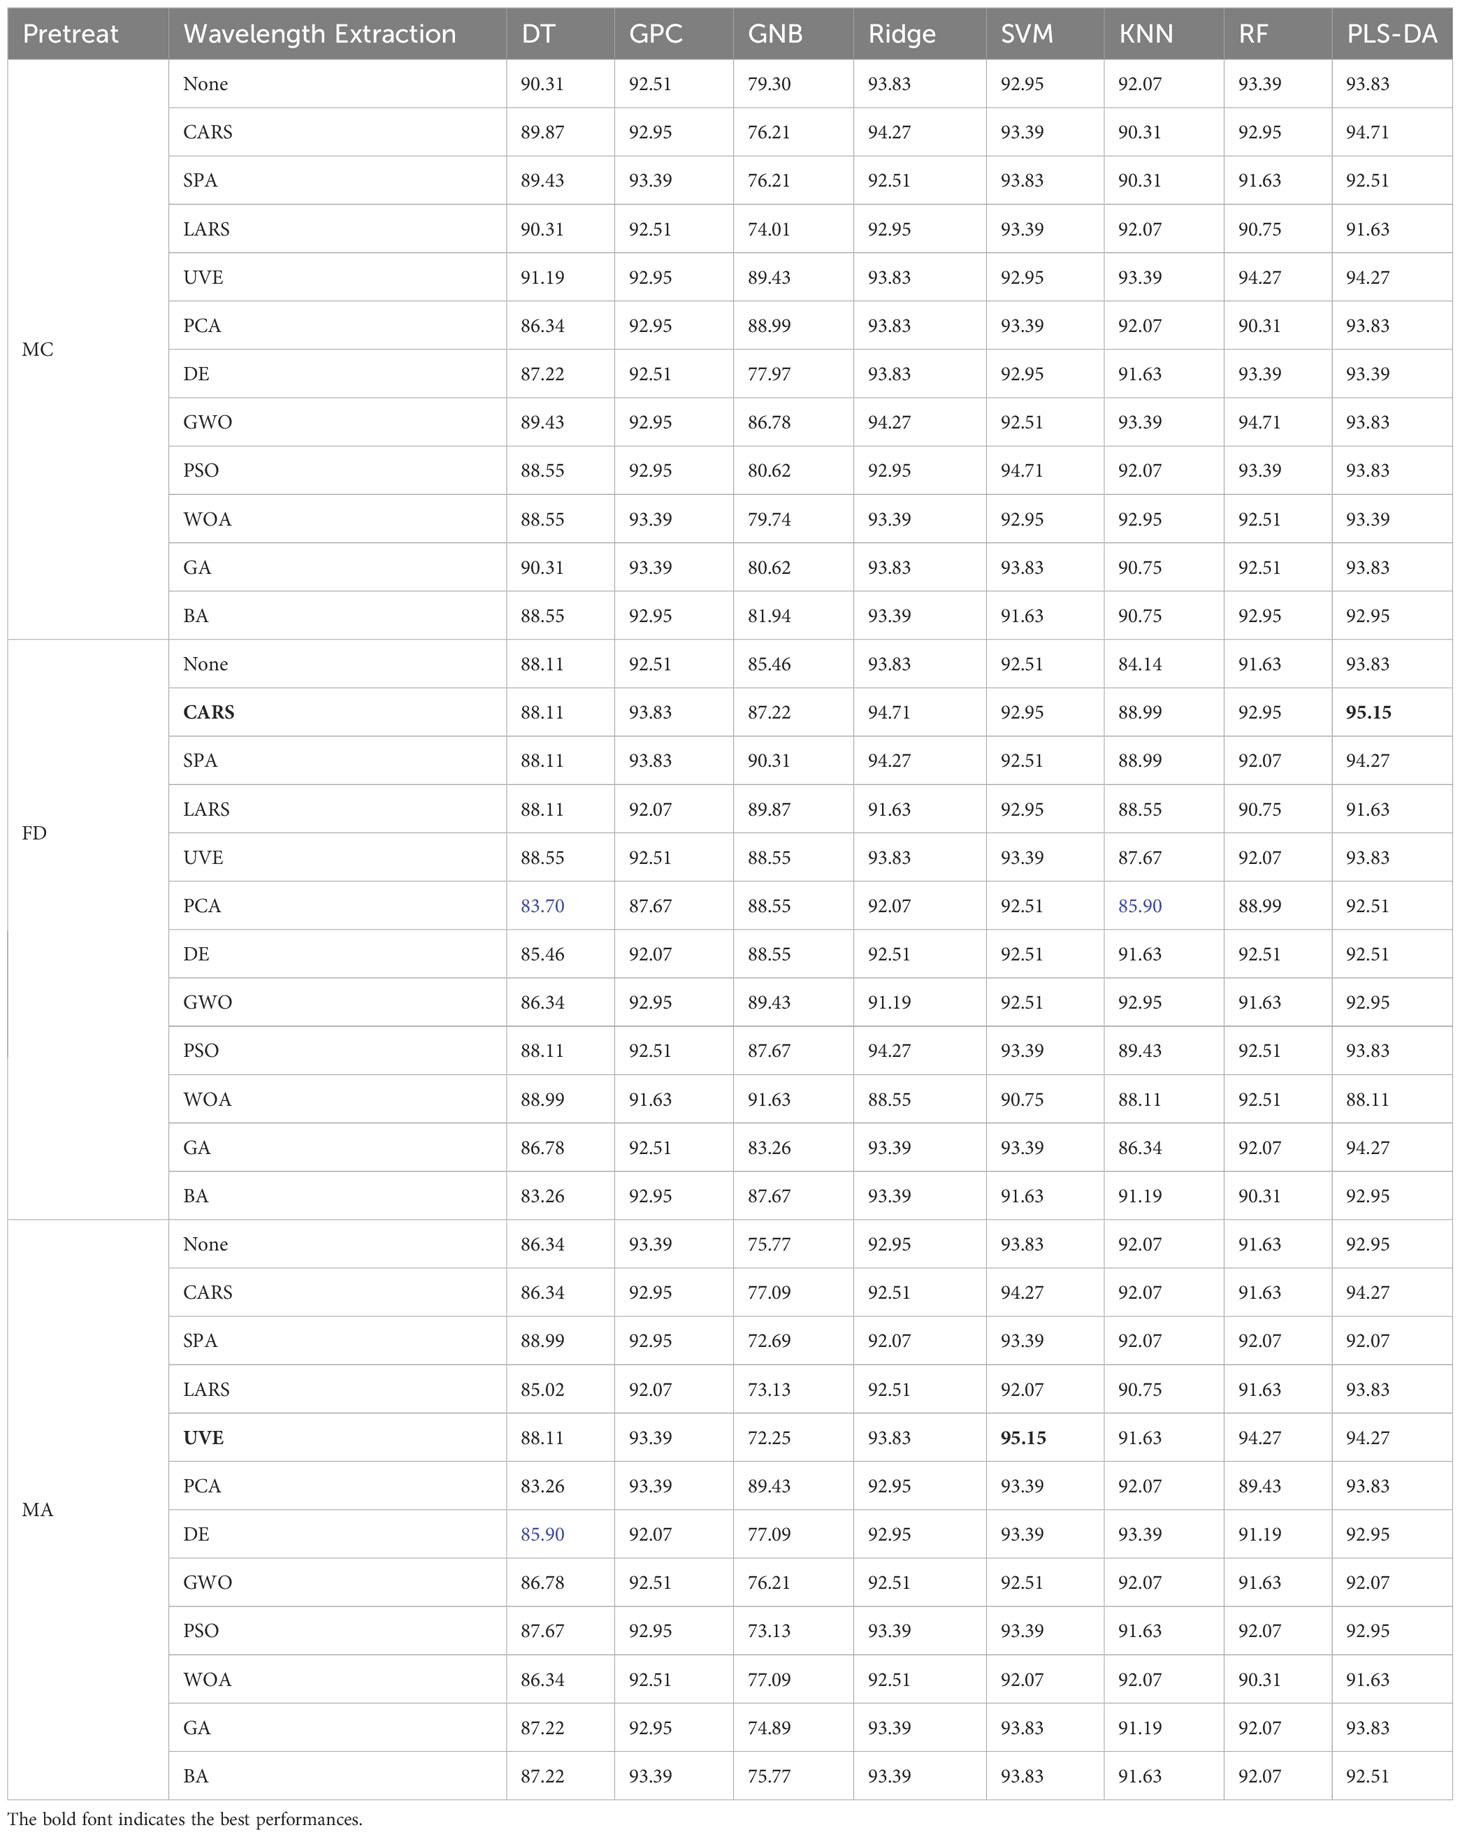
Table 5 Comparing state-of-the-art machine learning methods for predicting seed vigor (%).
4.4.4 Comparison with deep learning classifiers
The Focal-WAResNet proposed in this article was compared with advanced deep learning researches. The comparison primarily focused on two aspects: one is the comparison with nonend-to-end network architecture (NETE), the other is the comparison with end-to-end network architecture (ETE). As shown in Table 6, the Focal-WAResNet outperforms previous researches in performance. The accuracy of Focal-WAResNet surpasses the state-of-the-art non-end-to-end network PCA-1DCNN by 1.565%. Compared with end-to-end network architectures, it achieves an accuracy improvement of 1.044%.
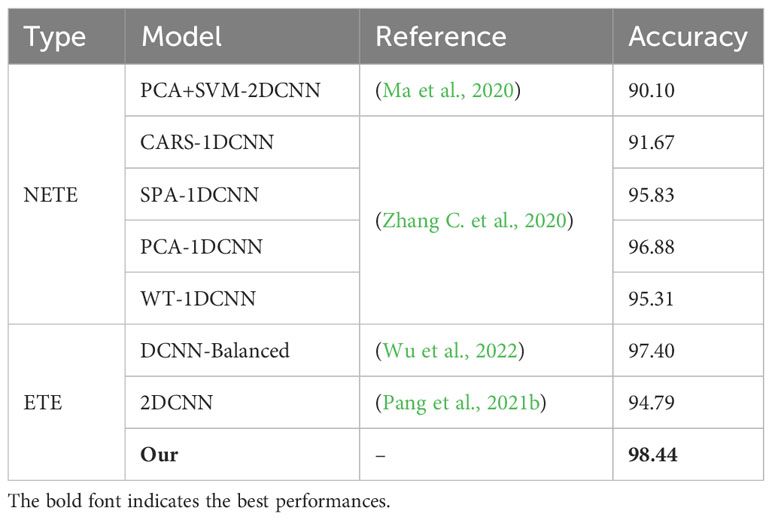
Table 6 Comparing with the deep learning model (%).
4.4.5 Ablation experiment
In this section, we conducted ablation experiments on the maize HSI to validate the effectiveness of the focal loss function and the WAResNet network, and better understand the proposed method. We utilize t-SNE (t-distributed stochastic neighbor embedding) and Grad-CAM visualization tools to enhance our comprehension of the proposed model. t-SNE serves as a technique for non-linear dimensionality reduction and visualization of high-dimensional data (Van der Maaten and Hinton, 2008). It calculates the similarity between samples in high-dimensional space through gaussian joint probabilities, and constructs a similar probability distribution in low-dimensional space. It employs KL divergence to measure the difference between these two probability distributions, and minimizes this difference through optimization algorithms like gradient descent. The relationships and clustering among data points after dimensionality reduction could be observed more straightforward. Grad-CAM generates a heatmap by computing the gradients of the output feature map of a convolutional layer with respect to a specific class (Selvaraju et al., 2017). The heatmap contributes to understanding the image regions of that the model focuses on, providing interpretability into the model’s decision-making process.
In the experiment, ResNet18 was used as the baseline. Firstly, the loss function of ResNet was replaced with focal loss function, which was expressed as Focal-ResNet. As shown in Table 7, although the accuracy of Focal-ResNet is only 1.05% higher than ResNet18 network, the precision improves by 31.38%, recall increases by 14.63%, and F1 score increases by 20.9%. It can be concluded that focal loss effectively addresses the issue of imbalanced samples. To better observe the impact of the focal loss function on model performance, this study utilized t-SNE technique to visualize the features from the last layer of the deep learning models in two-dimensional space. As depicted in Figures 7A, B that the feature distribution between viable and non-viable seeds of the last layer of the ResNet18 is relatively scattered and with no obvious distinction. However, the Focal-ResNet network is able to distinguish between viable and non-viable seeds.
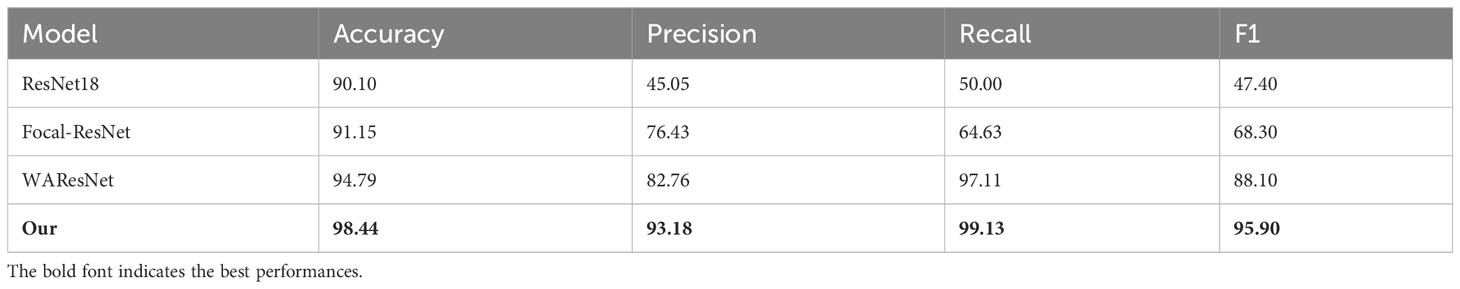
Table 7 Ablation experiments for the Focal-WAResNet model (%).
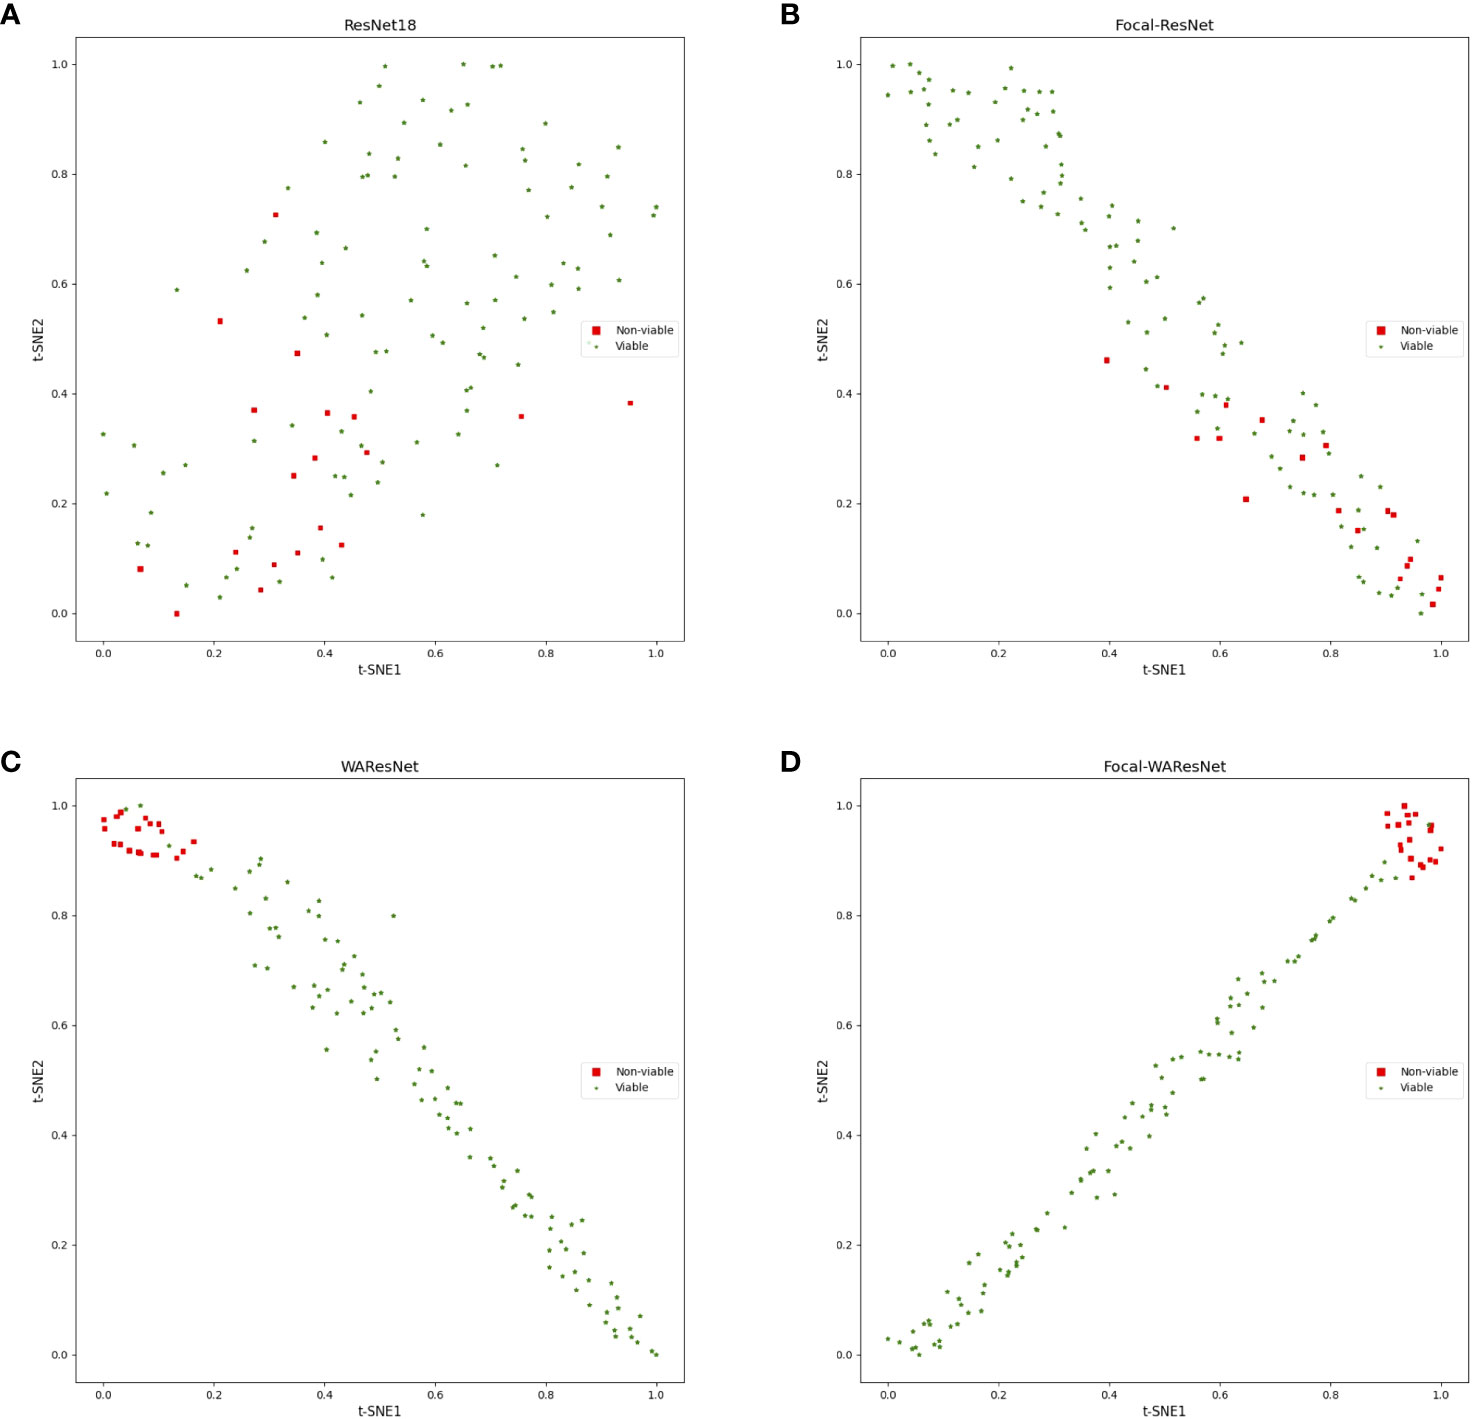
Figure 7 t-SNE visualization of the last layer of features of models. (A) ResNet18. (B) Focal-ResNet. (C) WAResNet. (D) Focal-WAResNet.
Then, the performance of the WAResNet network has been evaluated. As shown in Table 7, the accuracy, precision, recall and F1 score increase by 4.69%, 37.71%, 47.11% and 40.7% respectively. Figure 8 displays three-channel heatmaps of different models. The red regions in the heatmap represent strongly activated regions of the network model, while the blue regions represent weakly activated regions of the network model. The steeper the gradient, the redder the region, indicating that the region has a greater impact on the classification results. It is evidenced from Figure 8C that the WAResNet network is able to significantly focus on the region associated with seed vigor in HSI and extract features compared to Focal-ResNet.
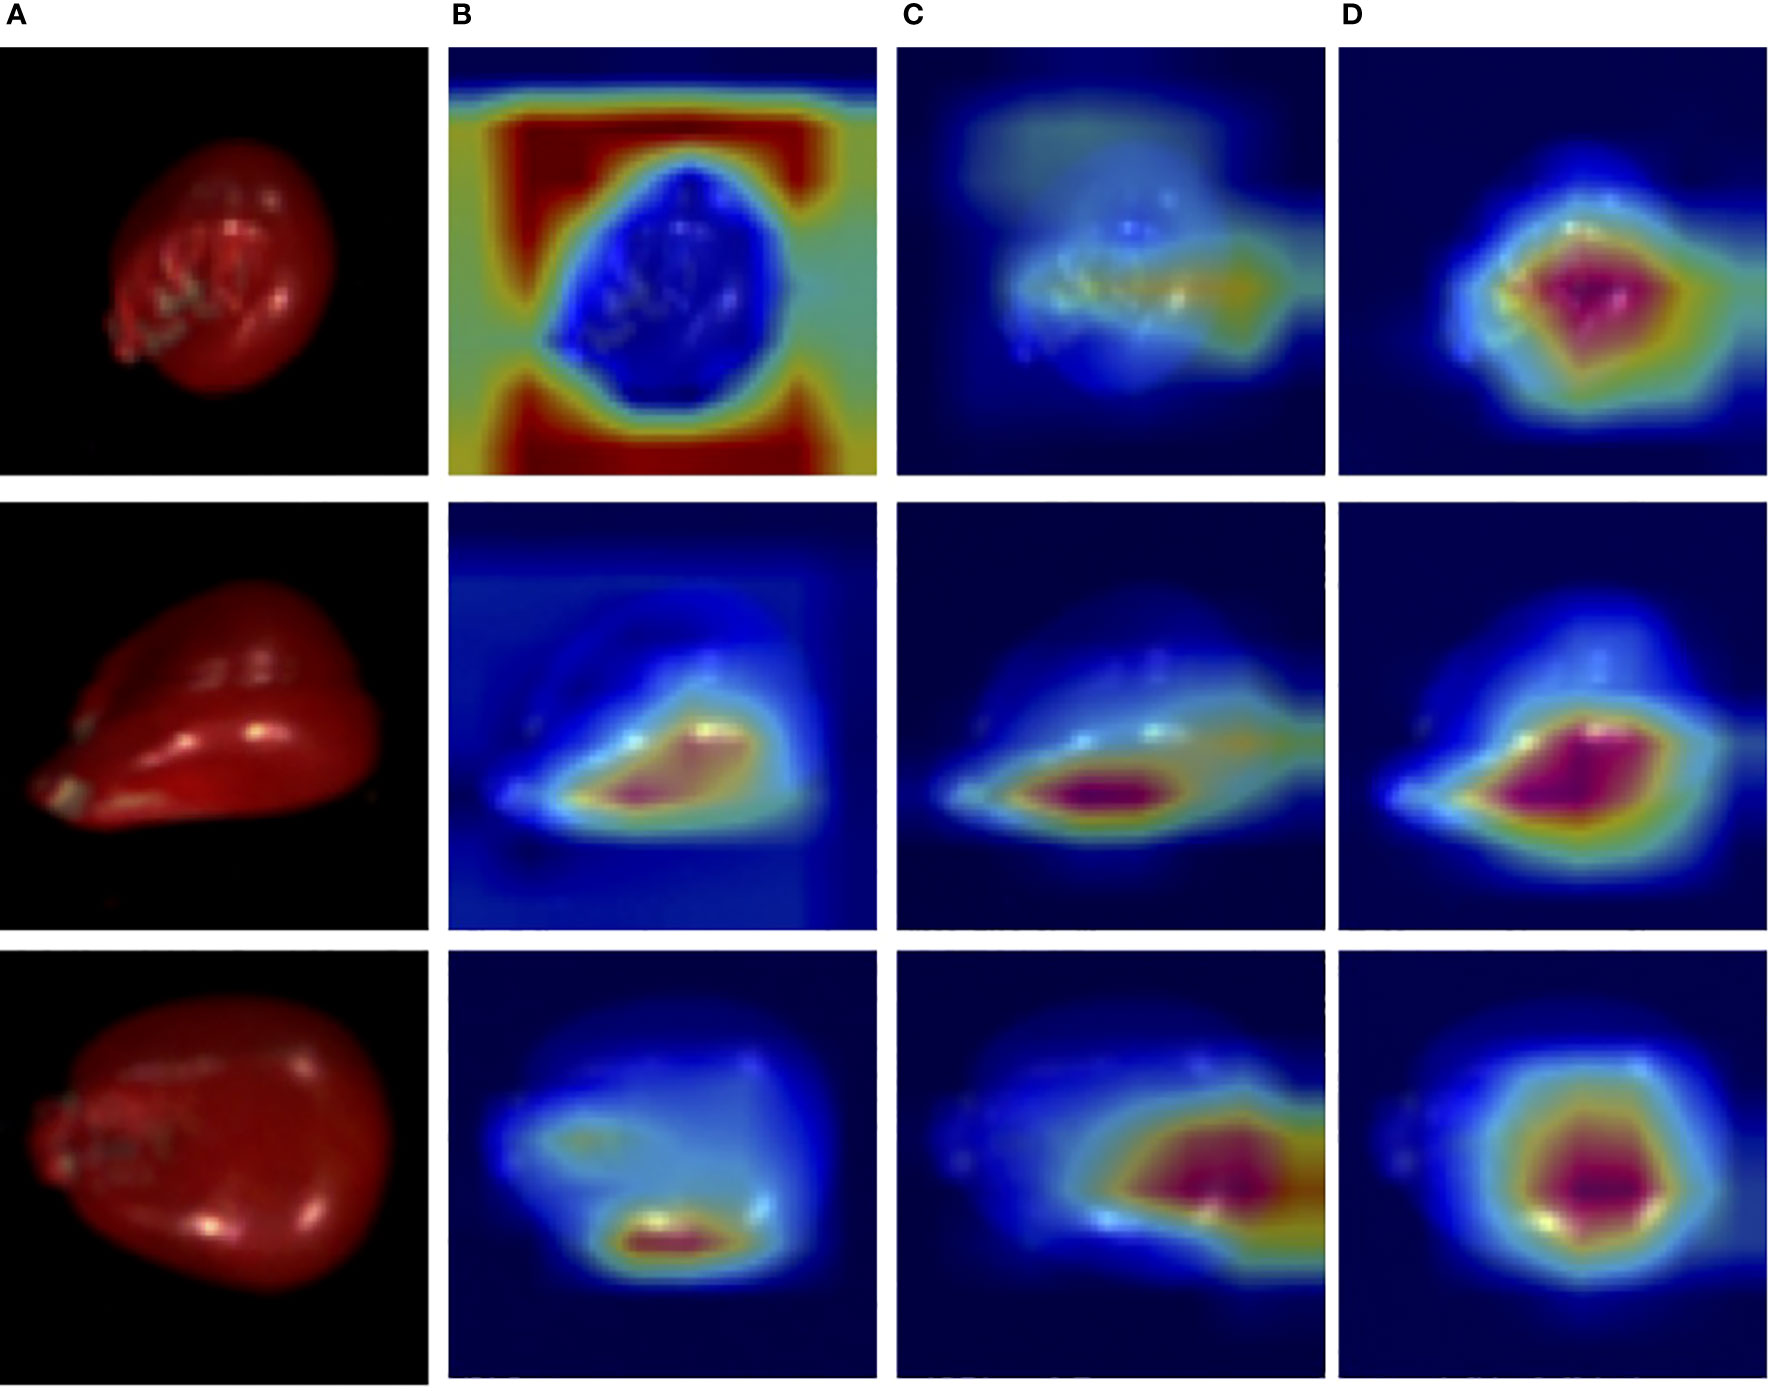
Figure 8 The three-channel heatmaps of maize seeds from Focal-WAResNet. (A) RGB. (B) Focal-ResNet. (C) WAResNet. (D) Focal-WAResNet.
Finally, WAResNet network is combined with the focal loss function to form the Focal-WAResNet network. The accuracy of the Focal-WAResNet network increases to 98.44%, precision to 93.18%, recall to 99.13%, and F1 to 95.90%. It can be observed from Figure 8D that Focal-WAResNet network can better extract features and locate the key locations which are related to seed vigor compared to Focal-ResNet and Focal-WAResNet. Meanwhile, as revealed in Figure 7 that Focal-WAResNet might gradually make the features of maize seeds distinguishable. Samples within the same category are closely clustered, while samples between different categories become discrete, making the samples from the original cross-mixed state into a more clearly discernible state. The experiments have demonstrated that Focal-WAResNet network could effectively end-to-end extract characteristic wavelengths from HSI, allowing it to learn subtle differences between different vigor seeds. This provides new insights for seed vigor prediction.
5 Conclusion
This paper proposes a deep learning network structure called Focal-WAResNet, which combines deep learning algorithms with HSI to predict seed vigor. The proposed method employed the focal loss function to adjust the loss weights for different classes, thereby resolving the problem of imbalanced seed vigor samples. WAResNet achieves characteristic wavelengths and classification in an end-to-end manner by adjusting the weights of different channels to enhance or suppress the feature representation of different channels in the channel dimension. Experimental results demonstrate that Focal-WAResNet can effectively locate the regions relevant to seed vigor to achieve characteristic wavelengths of HSI and non-destructive seed vigor prediction under imbalanced sample conditions. The model could also be utilized to predict the vigor of other plant seeds. In future research, we will acquire more informative and multidimensional data to further enable seed vigor classification into no vigor, low vigor, medium vigor, and high vigor. In addition, we will explore solutions for labeling noise, multiscale and multimodal data fusion in seed vigor prediction to further improve the performance of model.
Data availability statement
The datasets presented in this article are not readily available because the dataset is private. Requests to access the datasets should be directed to Pangtt18@mails.jlu.edu.cn.
Author contributions
TP: Data curation, Investigation, Software, Visualization, Writing – original draft, Writing – review & editing. CC: Data curation, Formal analysis, Methodology, Writing – review & editing. RF: Methodology, Writing – review & editing. XW: Funding acquisition, Supervision, Writing – review & editing. HY: Conceptualization, Formal analysis, Methodology, Writing – review & editing.
Funding
The author(s) declare financial support was received for the research, authorship, and/or publication of this article. This work was supports by Shenyang Aerospace University Talent Research Initiation Fund Project (23YB05) and National Natural Science Foundation Joint Fund Project (U19A2061).
Conflict of interest
The authors declare that the research was conducted in the absence of any commercial or financial relationships that could be construed as a potential conflict of interest.
Publisher’s note
All claims expressed in this article are solely those of the authors and do not necessarily represent those of their affiliated organizations, or those of the publisher, the editors and the reviewers. Any product that may be evaluated in this article, or claim that may be made by its manufacturer, is not guaranteed or endorsed by the publisher.
References
Ambrose, A., Kandpal, L. M., Kim, M. S., Lee, W.-H., Cho, B.-K. (2016). High speed measurement of corn seed viability using hyperspectral imaging. Infrared Phys. Technol. 75, 173–179. doi: 10.1016/j.infrared.2015.12.008
Barbedo, J. G. A. (2023). A review on the combination of deep learning techniques with proximal hyperspectral images in agriculture. Comput. Electron. Agric. 210, 107920. doi: 10.1016/j.compag.2023.107920
Cheng, T., Chen, G., Wang, Z., Hu, R., She, B., Pan, Z., et al. (2023). Hyperspectral and imagery integrated analysis for vegetable seed vigor detection. Infrared Phys. Technol. 131, 104605. doi: 10.1016/j.infrared.2023.104605
Chu, X., Huang, Y., Yun, Y.-H., Bian, X. (2022). Chemometric methods in analytical spectroscopy technology. Tiergartenstrasse (Heidelberg. Germany: Springer) 17, D-69121.
de Medeiros, A. D., da Silva, L. J., da Silva, J. M., dos Santos Dias, D. C. F., Pereira, M. D. (2020). Ijcropseed: An open-access tool for high-throughput analysis of crop seed radiographs. Comput. Electron. Agric. 175, 105555. doi: 10.1016/j.compag.2020.105555
Fan, Y., Ma, S., Wu, T. (2020). Individual wheat kernels vigor assessment based on nir spectroscopy coupled with machine learning methodologies. Infrared Phys. Technol. 105, 103213. doi: 10.1016/j.infrared.2020.103213
Feng, L., Zhu, S., Zhang, C., Bao, Y., Feng, X., He, Y. (2018). Identification of maize kernel vigor under different accelerated aging times using hyperspectral imaging. Molecules 23, 3078. doi: 10.3390/molecules23123078
He, X., Feng, X., Sun, D., Liu, F., Bao, Y., He, Y. (2019). Rapid and nondestructive measurement of rice seed vitality of different years using near-infrared hyperspectral imaging. Molecules 24, 2227. doi: 10.3390/molecules24122227
He, X., Liu, L., Liu, C., Li, W., Sun, J., Li, H., et al. (2022). Discriminant analysis of maize haploid seeds using near-infrared hyperspectral imaging integrated with multivariate methods. Biosyst. Eng. 222, 142–155. doi: 10.1016/j.biosystemseng.2022.08.003
He, K., Zhang, X., Ren, S., Sun, J. (2016). “Deep residual learning for image recognition,” in Proceedings of the IEEE conference on computer vision and pattern recognition (345 E 47TH ST,450 NEW YORK, NY 10017 USA: IEEE), 770–778.
Holland, J. H. (1975). Adaptation in natural and artificial systems: an introductory analysis with applications to biology, control, and artificial intelligence (Cambridge: MIT press).
ISTA (2018). International rules for seed testing 2018. Zürichstr (Bassersdorf, Switzerland: The International Seed Testing Association (ISTA)) 50, CH-8303.
Jia, Z., Ou, C., Sun, S., Wang, J., Liu, J., Li, M., et al. (2023). A novel approach using multispectral imaging for rapid development of seed pellet formulations to mitigate drought stress in alfalfa. Comput. Electron. Agric. 212, 108136. doi: 10.1016/j.compag.2023.108136
Jin, B., Qi, H., Jia, L., Tang, Q., Gao, L., Li, Z., et al. (2022). Determination of viability and vigor of naturally-aged rice seeds using hyperspectral imaging with machine learning. Infrared Phys. Technol. 122, 104097. doi: 10.1016/j.infrared.2022.104097
Jin, S., Zhang, W., Yang, P., Zheng, Y., An, J., Zhang, Z., et al. (2022). Spatial-spectral feature extraction of hyperspectral images for wheat seed identification. Comput. Electrical Eng. 101, 108077. doi: 10.1016/j.compeleceng.2022.108077
Kennedy, J., Eberhart, R. (1995). “Particle swarm optimization,” in Proceedings of ICNN’95international conference on neural networks (IEEE), Vol. 4. 1942–1948. doi: 10.1109/ICNN.1995.488968
Lin, T.-Y., Goyal, P., Girshick, R., He, K., Dollár, P. (2017). Focal loss for dense object detection. 2017 IEEE INTERNATIONAL CONFERENCE ON COMPUTER VISION (ICCV) (345 E 47TH ST, NEW YORK, NY 10017 USA: IEEE). doi: 10.48550/arXiv.1708.02002. arXiv:1708.02002.
Long, Y., Wang, Q., Tang, X., Tian, X., Huang, W., Zhang, B. (2022). Label-free detection of maize kernels aging based on raman hyperspcectral imaging techinique. Comput. Electron. Agric. 200, 107229. doi: 10.1016/j.compag.2022.107229
Ma, T., Tsuchikawa, S., Inagaki, T. (2020). Rapid and non-destructive seed viability prediction using near-infrared hyperspectral imaging coupled with a deep learning approach. Comput. Electron. Agric. 177, 105683. doi: 10.1016/j.compag.2020.105683
Mirjalili, S., Lewis, A. (2016). The whale optimization algorithm. Adv. Eng. Softw. 95, 51–67. doi: 10.1016/j.advengsoft.2016.01.008
Mirjalili, S., Mirjalili, S. M., Lewis, A. (2014). Grey wolf optimizer. Adv. Eng. Softw. 69, 46–61. doi: 10.1016/j.advengsoft.2013.12.007
Nie, P., Zhang, J., Feng, X., Yu, C., He, Y. (2019). Classification of hybrid seeds using nearinfrared hyperspectral imaging technology combined with deep learning. Sens. Actuators B: Chem. 296, 126630. doi: 10.1016/j.snb.2019.126630
Pang, L., Wang, J., Men, S., Yan, L., Xiao, J. (2021a). Hyperspectral imaging coupled with multivariate methods for seed vitality estimation and forecast for quercus variabilis. Spectrochimica Acta Part A: Mol. Biomol. Spectrosc. 245, 118888. doi: 10.1016/j.saa.2020.118888
Pang, L., Wang, L., Yuan, P., Yan, L., Yang, Q., Xiao, J. (2021b). Feasibility study on identifying seed viability of sophora japonica with optimized deep neural network and hyperspectral imaging. Comput. Electron. Agric. 190, 106426. doi: 10.1016/j.compag.2021.106426
Selvaraju, R. R., Cogswell, M., Das, A., Vedantam, R., Parikh, D., Batra, D. (2017). Gradcam: Visual explanations from deep networks via gradient-based localization. In 2017 IEEE INTERNATIONAL CONFERENCE ON COMPUTER VISION (ICCV) (345 E 47TH ST, NEW YORK, NY 10017 USA: IEEE), 618–626.
Storn, R., Price, K. (1997). Differential evolution–a simple and efficient heuristic for global optimization over continuous spaces. J. Global Optimization 11, 341–359. doi: 10.1023/A:1008202821328
Sutton, D. B., Punja, Z. K. (2017). Investigating biospeckle laser analysis as a diagnostic method to assess sprouting damage in wheat seeds. Comput. Electron. Agric. 141, 238–247. doi: 10.1016/j.compag.2017.07.027
Thakur, P. S., Tiwari, B., Kumar, A., Gedam, B., Bhatia, V., Krejcar, O., et al. (2022). Deep transfer learning based photonics sensor for assessment of seed-quality. Comput. Electron. Agric. 196, 106891. doi: 10.1016/j.compag.2022.106891
Tu, K., Wen, S., Cheng, Y., Zhang, T., Pan, T., Wang, J., et al. (2021). A non-destructive and highly efficient model for detecting the genuineness of maize variety’jingke 968 using machine vision combined with deep learning. Comput. Electron. Agric. 182, 106002. doi: 10.1016/j.compag.2021.106002
Van De Looverbosch, T., Vandenbussche, B., Verboven, P., Nicolaï, B. (2022). Nondestructive high-throughput sugar beet fruit analysis using x-ray ct and deep learning. Comput. Electron. Agric. 200, 107228. doi: 10.1016/j.compag.2022.107228
Van der Maaten, L., Hinton, G. (2008). Visualizing data using t-sne. J. Mach. Learn. Res. 9, 2579–2605.
Wakholi, C., Kandpal, L. M., Lee, H., Bae, H., Park, E., Kim, M. S., et al. (2018). Rapid assessment of corn seed viability using short wave infrared line-scan hyperspectral imaging and chemometrics. Sens. Actuators B: Chem. 255, 498–507. doi: 10.1016/j.snb.2017.08.036
Wang, Y., Xiong, F., Zhang, Y., Wang, S., Yuan, Y., Lu, C., et al. (2023). Application of hyperspectral imaging assisted with integrated deep learning approaches in identifying geographical origins and predicting nutrient contents of coix seeds. Food Chem. 404, 134503. doi: 10.1016/j.foodchem.2022.134503
Wu, N., Weng, S., Chen, J., Xiao, Q., Zhang, C., He, Y. (2022). Deep convolution neural network with weighted loss to detect rice seeds vigor based on hyperspectral imaging under the sample-imbalanced condition. Comput. Electron. Agric. 196, 106850. doi: 10.1016/j.compag.2022.106850
Xu, P., Zhang, Y., Tan, Q., Xu, K., Sun, W., Xing, J., et al. (2022). Vigor identification of maize seeds by using hyperspectral imaging combined with multivariate data analysis. Infrared Phys. Technol. 126, 104361. doi: 10.1016/j.infrared.2022.104361
Yang, X.-S. (2010). “A new metaheuristic bat-inspired algorithm,” in Nature inspired cooperative strategies for optimization (NICSO 2010) (HEIDELBERGER PLATZ 3, D-14197 BERLIN, GERMANY: Springer), 65–74.
Yang, J., Sun, L., Xing, W., Feng, G., Bai, H., Wang, J. (2021). Hyperspectral prediction of sugarbeet seed germination based on gauss kernel svm. Spectrochimica Acta Part A: Mol. Biomol. Spectrosc. 253, 119585. doi: 10.1016/j.saa.2021.119585
Yu, Z., Fang, H., Zhangjin, Q., Mi, C., Feng, X., He, Y. (2021). Hyperspectral imaging technology combined with deep learning for hybrid okra seed identification. Biosyst. Eng. 212, 46–61. doi: 10.1016/j.biosystemseng.2021.09.010
Yu, X., Lu, H., Wu, D. (2018). Development of deep learning method for predicting firmness and soluble solid content of postharvest korla fragrant pear using vis/nir hyperspectral reflectance imaging. Postharvest Biol. Technol. 141, 39–49. doi: 10.1016/j.postharvbio.2018.02.013
Zhang, T., Fan, S., Xiang, Y., Zhang, S., Wang, J., Sun, Q. (2020). Non-destructive analysis of germination percentage, germination energy and simple vigour index on wheat seeds during storage by vis/nir and swir hyperspectral imaging. Spectrochimica Acta Part A: Mol. Biomol. Spectrosc. 239, 118488. doi: 10.1016/j.saa.2020.118488
Zhang, T., Lu, L., Yang, N., Fisk, I. D., Wei, W., Wang, L., et al. (2023). Integration of hyperspectral imaging, non-targeted metabolomics and machine learning for vigour prediction of naturally and accelerated aged sweetcorn seeds. Food Control 153, 109930. doi: 10.1016/j.foodcont.2023.109930
Zhang, Y., Lv, C., Wang, D., Mao, W., Li, J. (2022). A novel image detection method for internal cracks in corn seeds in an industrial inspection line. Comput. Electron. Agric. 197, 106930. doi: 10.1016/j.compag.2022.106930
Zhang, C., Wu, W., Zhou, L., Cheng, H., Ye, X., He, Y. (2020). Developing deep learning based regression approaches for determination of chemical compositions in dry black goji berries (lycium ruthenicum murr.) using near-infrared hyperspectral imaging. Food Chem. 319, 126536. doi: 10.1016/j.foodchem.2020.126536
Zhou, S., Sun, L., Xing, W., Feng, G., Ji, Y., Yang, J., et al. (2020). Hyperspectral imaging of beet seed germination prediction. Infrared Phys. Technol. 108, 103363. doi: 10.1016/j.infrared.2020.103363
Keywords: hyperspectral image, seed vigor prediction, sample imbalance, focal loss, WAResNet, Focal-WAResNet
Citation: Pang T, Chen C, Fu R, Wang X and Yu H (2023) An end-to-end seed vigor prediction model for imbalanced samples using hyperspectral image. Front. Plant Sci. 14:1322391. doi: 10.3389/fpls.2023.1322391
Received: 16 October 2023; Accepted: 24 November 2023;
Published: 15 December 2023.
Edited by:
Yongliang Qiao, University of Adelaide, AustraliaReviewed by:
Huibin Li, Chinese Academy of Agricultural Sciences (CAAS), ChinaGuo-Fei Tan, Guizhou Academy of Agricultural Sciences (CAAS), China
Dong Huang, South China Agricultural University, China
Copyright © 2023 Pang, Chen, Fu, Wang and Yu. This is an open-access article distributed under the terms of the Creative Commons Attribution License (CC BY). The use, distribution or reproduction in other forums is permitted, provided the original author(s) and the copyright owner(s) are credited and that the original publication in this journal is cited, in accordance with accepted academic practice. No use, distribution or reproduction is permitted which does not comply with these terms.
*Correspondence: Chengcheng Chen, chenccj18@gmail.com; Xianchang Wang, xcwang89@jlu.edu.cn; Helong Yu, yuhelong@jlau.edu.cn