 Yi Xiong
 Yanli Xiong
 Xin Shu1
 Xiong Lei
 Xiao Ma
- 1College of Grassland Science and Technology, Sichuan Agricultural University, Chengdu, China
- 2Sichuan Academy of Grassland Science, Chengdu, China
A detailed understanding of the distribution and degree of genetic variation within a species is important for determining their evolutionary potential, which in return facilitates the development of efficient conservation strategies aimed at preserving adaptive genetic variation. As an important perennial, cool-season grass in temperate Eurasia, increasing attention has been paid to Siberian wildrye (Elymus sibiricus) due to its excellent ecological utilization value and forage production potential in China, particularly in the Qinghai–Tibet Plateau (QTP) regions. In this study, we applied two chloroplast (cp) genes (matK and rbcL), three cp spacer regions (trnY-GUA∼trnD-GUC, atpH∼atpF, and rps4∼trnT-UGU), and six cpSSR markers to the genetic and phylogenetic analysis of 137 wild E. sibiricus accessions from 23 natural populations that represent the main distribution regions in China. The results show the highest genetic diversity (h = 0.913) and haplotype richness (10 haplotypes) for the QTP population, which indicates QTP as the probable diversity center and geographic origin of E. sibiricus in China. Population divergence was high, indicating a significant phylogeographic structure together with a significantly higher Nst value (Nst > Gst, P < 0.05) at the species level, QTP+XJ (combined populations from QTP and Xinjiang), QTP+NC (combined populations from QTP and North China), and XJ+NC (combined populations from Xinjiang and North China) group levels, respectively. An expansion was revealed in the distributional range of E. sibiricus in China from paleo times up to the recent past, while a dramatic range of contraction was predicted for the near future. The predicted main limiting factor for the further spread of E. sibiricus is an increasing global mean temperature. We recommend that the combination of Es-cpDNA1 and Es-cpDNA3+4+5 can be used as effective markers for phylogenetic analysis and phylogeographical history analysis of E. sibiricus. These findings shed new light on the historical population dynamics of cold-season herbs in the QTP region and the north of China and are of great significance for the future establishment of protection and collection strategies for wild E. sibiricus germplasm.
Introduction
Geographical events and global climate oscillations have led to repeated and drastic changes in the environment, something that has had a great impact on the distribution and genetic structure of plants in different ecological distribution areas (Hewitt, 2000). Phylogeography focuses on the evolution of species and different populations within species, as well as the relationship between modern distribution patterns and climate, geological, and historical events (Avise, 2000). After decades of development, phylogeographic studies have been carried out in almost every biogeographic region of the planet (Garrick et al., 2015). Ecological niche models (ENMs) can provide insights into the geographical distribution of a species and can predict distributional changes by using species occurrence data and the suites of environmental conditions experienced at each occurrence point (Araújo and Peterson, 2012). The ENM is then used to predict the potential distribution areas of different periods based on the environmental data of different historical/future periods (climatic data) (Araújo and Peterson, 2012). Combined with molecular phylogeography, ENMs can evaluate the impact of climate change on a species distribution pattern and can help to reveal the process that has shaped the current distribution patterns of a species (Mellick et al., 2012).
Considering genetic processes, mutation, and the recombination rate, variations maintained within the molecular markers retain the genetic imprint of lineage evolution to varying degrees, and thus can be used as an effective and reliable method to detect the population dynamics of a species during past historical periods (ancient or recent) (Arbogast, 2015). Such genetic information on genetic structures, combined with geological movement, climate change, and fossil data, can be effective in helping find the refugia of organisms during ice ages and in inferring expansion and migration routes after the ice age (Petit et al., 2008). Given the features of uniparental inheritance, chloroplast genetic markers (chloroplast DNA sequences and chloroplast SSR) are more sensitive to population genetic effects, such as genetic drift, and are thus widely recognized in population genetics, biogeographic studies, and phylogeography (Petit et al., 2008). Though matK and rbcL genes have contributed significantly to the study of phylogeography (Garrick et al., 2015), more than two-thirds of the published studies about phylogeography have been carried out using non-coding regions of the chloroplast genome or combined with nuclear simple sequence repeats (nSSRs) (Garrick et al., 2015). However, the most frequently used non-coding regions, such as psbA-trnH, trnL-trnF, and trnL introns, possess lower variability (Morris and Shaw, 2018). Another polymorphic marker of particular interest is the chloroplast SSR, hereafter referred to as “cpSSRs,” which are usually located in the non-coding regions of the chloroplast genome and show higher intraspecific variations when present in repeated numbers (Wang et al., 2017). The combination of haplotype variation in the population analyzed by chloroplast DNA and phylogenetic analysis carried out by cpSSR helps to examine whether the structure of phylogeography exists.
The Qinghai–Tibet Plateau (QTP) once acted as a refuge for plants in the north temperate region during the Quaternary glacial period and has been recognized as one of the important places of origin and radiation of modern north temperate plants after the glacial period (Liu J. et al., 2017). As a model species of the Elymus genus (Triticeae and Poaceae) and an ancient wild grass species, Elymus sibiricus is widely distributed in the Eurasian continent. Its distribution areas in China include Northwest and North China, particularly in the QTP regions (Xiong et al., 2021). The germplasms of E. sibiricus located in high-altitude regions may exhibit a more significant response to climate change. Under the influence of global climatic shock during the Quaternary ice age, there may have been clear changes in the population size and distribution range of E. sibiricus. The variable climatic factors in different distribution areas of E. sibiricus make it worth exploring whether phylogeography differentiation is present in different regions. We have obtained some hotspot regions, including two chloroplast genes (matK and rbcL) and three cp spacer regions (trnY-GUA∼trnD-GUC, atpH∼atpF, and rps4∼trnT-UGU), by blasting the chloroplast genomes of E. sibiricus and its related species Elymus nutans. These hotspot regions, combined with six polymorphic cpSSRs, were applied in the present study to explore the genetic diversity and phylogeographic structure of 23 natural populations composed of 137 wild accessions. Further, the ENM prediction based on the records of the occurrence of E. sibiricus germplasms was used to detect the environmental factors involved in shaping current and future distribution patterns.
Results
Genetic Diversity of Elymus sibiricus in China
Genetic Diversity Estimated by cpSSR
The polymorphism information content (PIC) values of six cpSSR markers varied from 0.8945 (Es-cpSSR6) to 0.9555 (Es-cpSSR2) with an average of 0.9288 (Table 1). The detected alleles of six primer pairs ranged from 18 (Es-cpSSR6) to 37 (Es-cpSSR2), with an average of 28.5 alleles per primer. High genetic diversity ( = 0.933) and Shannon’s information ( = 2.9629) index values were detected based on these cpSSR markers. All the above-mentioned results demonstrated the high polymorphism and good potential for the utilization of these cpSSRs for the genetic diversity studies of E. sibiricus. We detected a high genetic diversity of E. sibiricus at the species level, in which the QTP group had the highest diversity, which was reflected by the highest Na, Ne, I, and h values (Table 2).
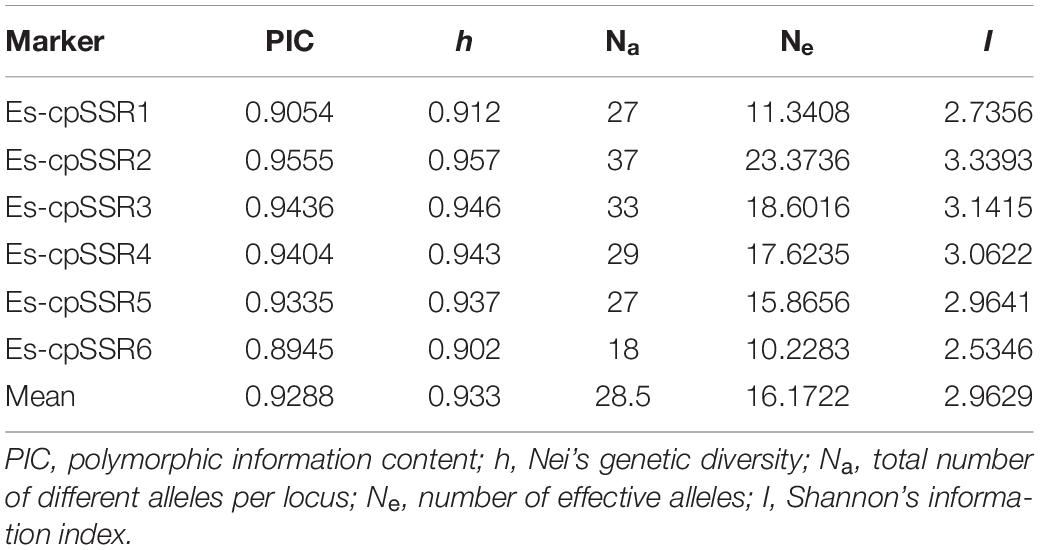
Table 1. Polymorphism assessment of six cpSSR primers.
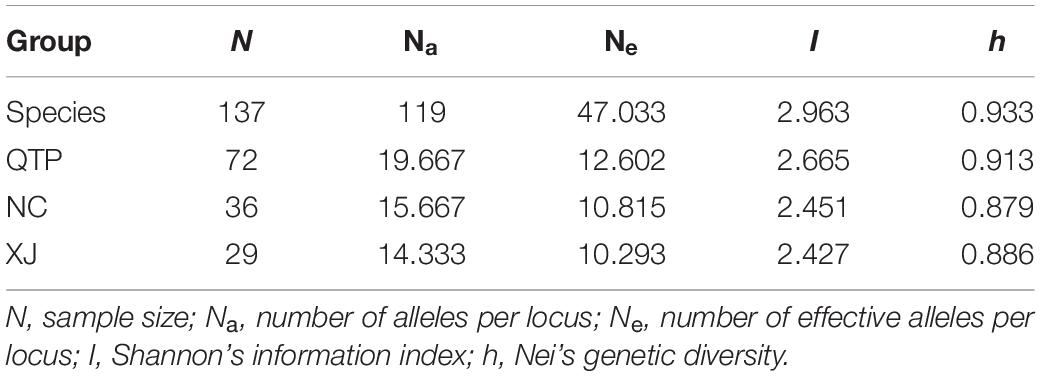
Table 2. Genetic diversity of Elymus sibiricus estimated by cpSSR.
Genetic Diversity Estimated by cpDNA
There were 14, 2, and 35 haplotypes detected from cpDNA regions matK, rbcL, and “Es-cpDNA3+4+5,” respectively (Table 3). The QTP group had the highest haplotype number and Hd value based on all these cpDNA markers. In addition, the QTP group was also characterized by the highest nucleotide diversity (π).
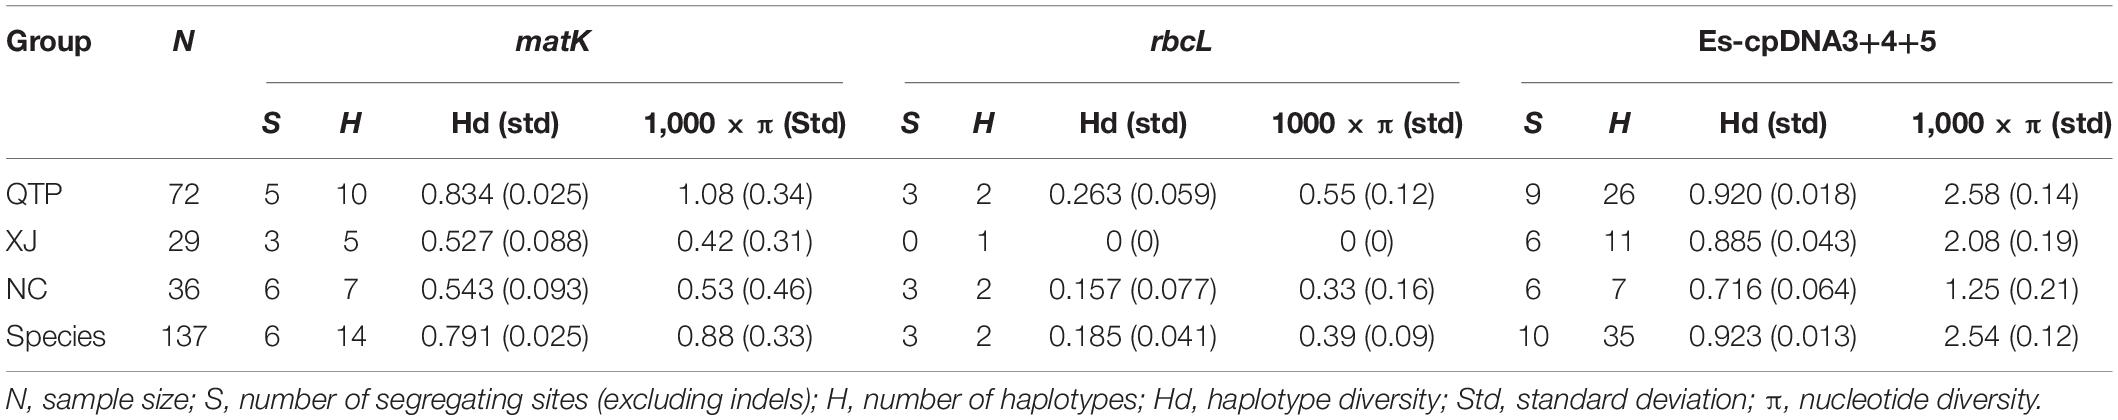
Table 3. Genetic diversity of Elymus sibiricus estimated by cpDNA.
Clustering Analysis and Genetic Structure
Cluster Analysis for cpSSRs
Based on the principal component analysis (PCA), we divided all the individuals into three obvious clusters (Figure 1). Cluster III consisted of all NC individuals, while Cluster I and Cluster II were heterogeneous. QTP individuals were divided into two groups, namely, Cluster I-Pop QTP and Cluster II-Pop QTP, in which Cluster II-Pop QTP included all individuals from Tibet (XZ). Bayesian clustering analysis was further applied to clarify the genetic components of E. sibiricus. The results suggest that the optimal K value (the number of genetic clusters) for E. sibiricus was 2, based on ΔK estimation (Supplementary Figure 1). Individuals in Cluster III had an identical and pure genetic background, which were all from the NC group. However, some individuals from QTP were detected with two genetic backgrounds, in which Cluster I-Pop QTP had a similar genetic constitution to the XJ group, while Cluster II-Pop QTP was more similar to the NC group. Accordingly, the geographical origin of E. sibiricus in China could be attributed to the “NC” and “QTP + XJ” groups.
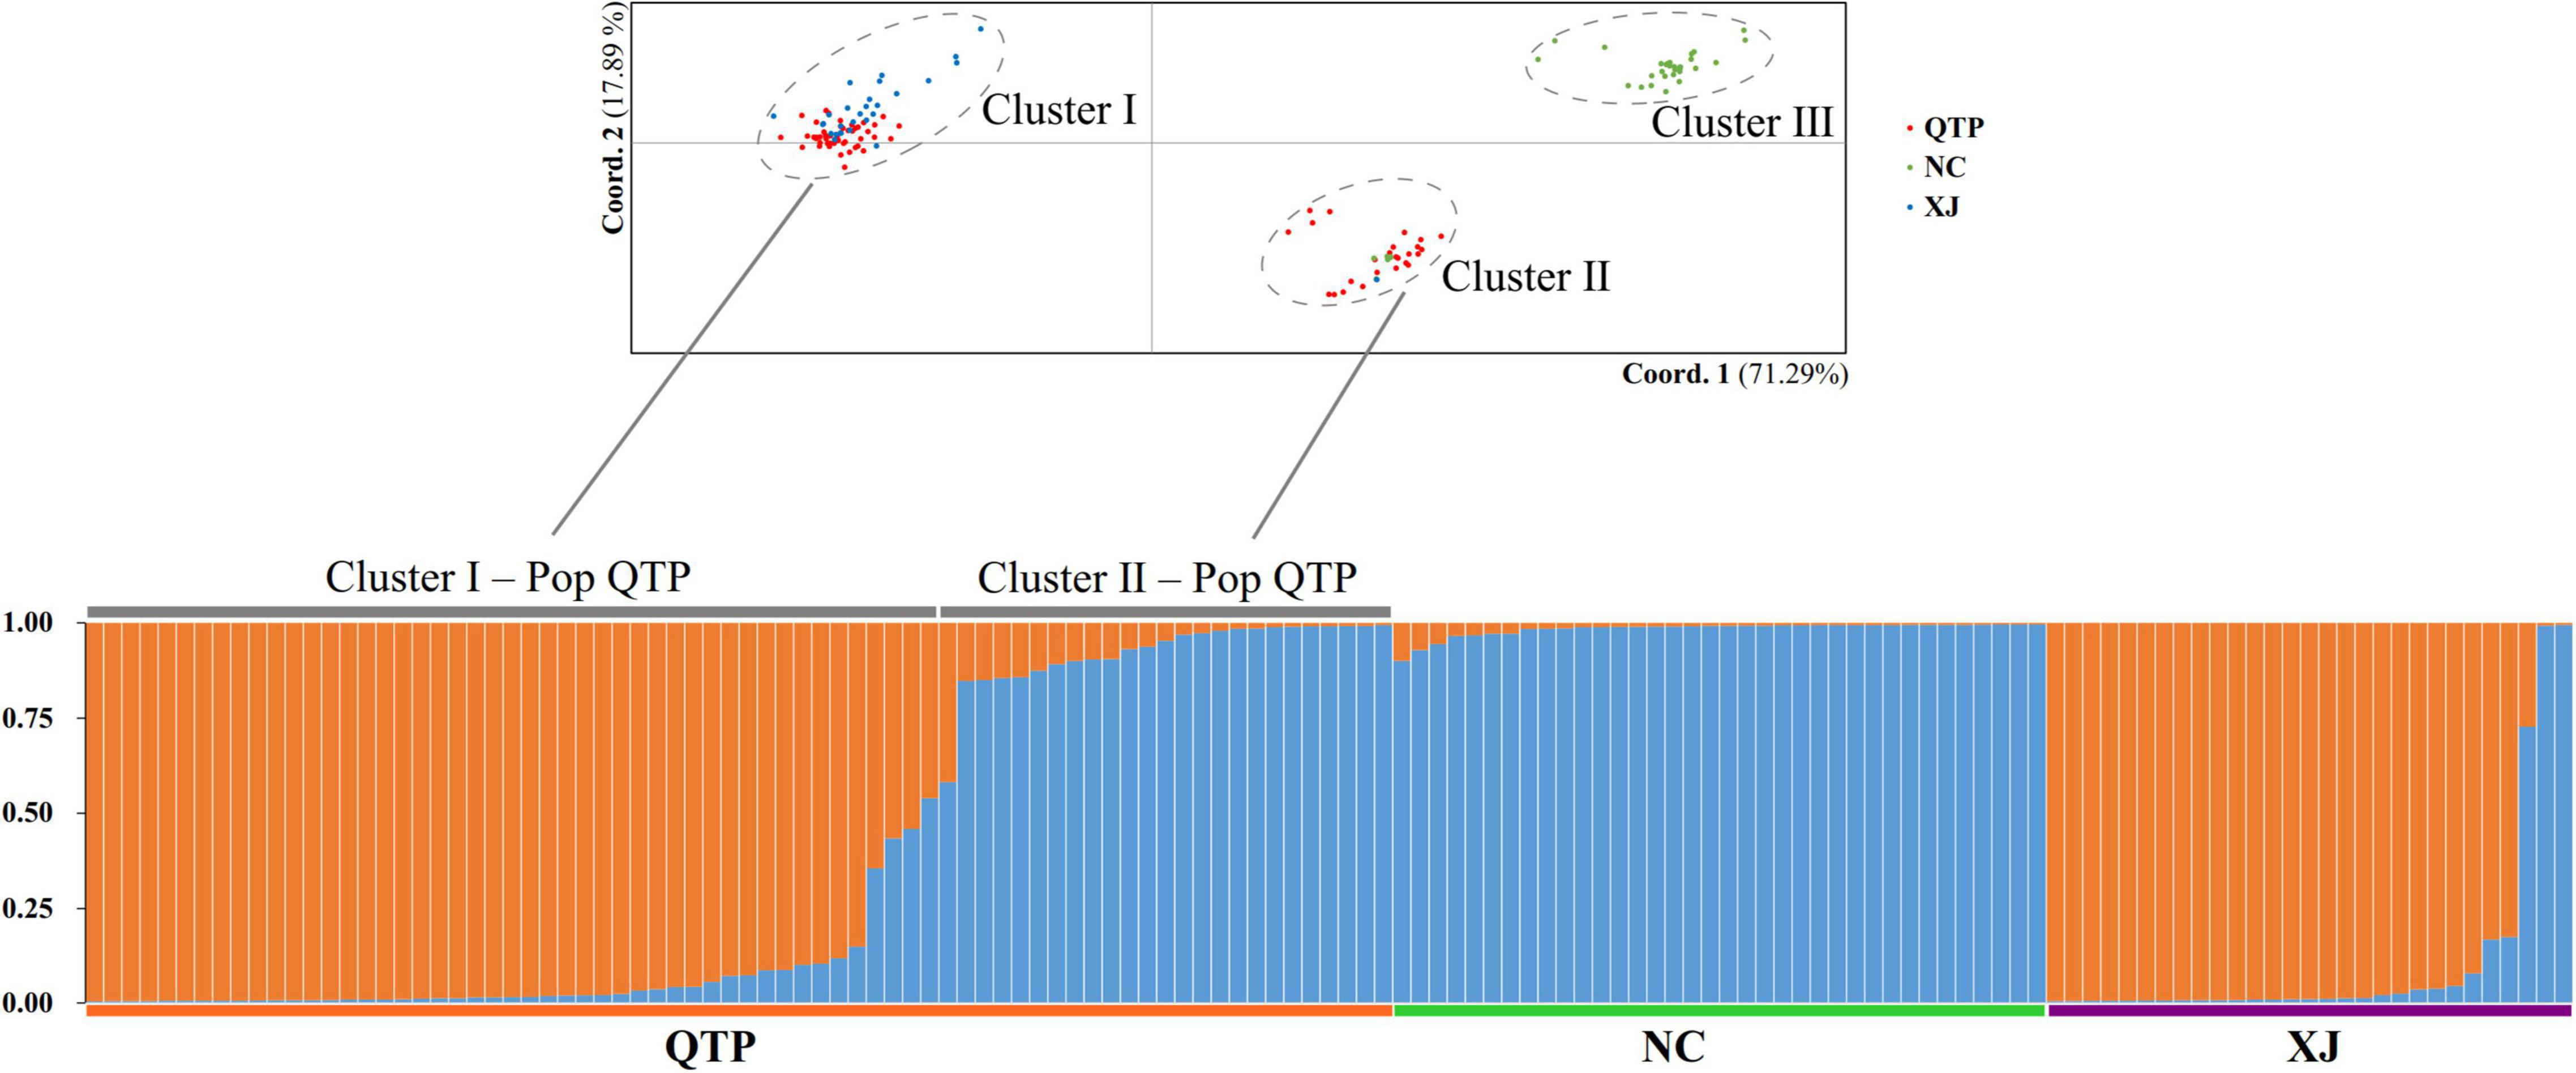
Figure 1. cpSSR genetic structure and principal component cluster results.
cpDNA Haplotype and Phylogenetics
Three cpDNA regions were applied to connect a haplotype network based on their nucleotide substitutions. The phylogenetic tree was also constructed to reveal the inter-haplotype relationships. As shown in Figure 2, QTP individuals possessed the largest haplotype variation. In addition, the dendrogram indicated the most ancient divergence time of QTP haplotypes.
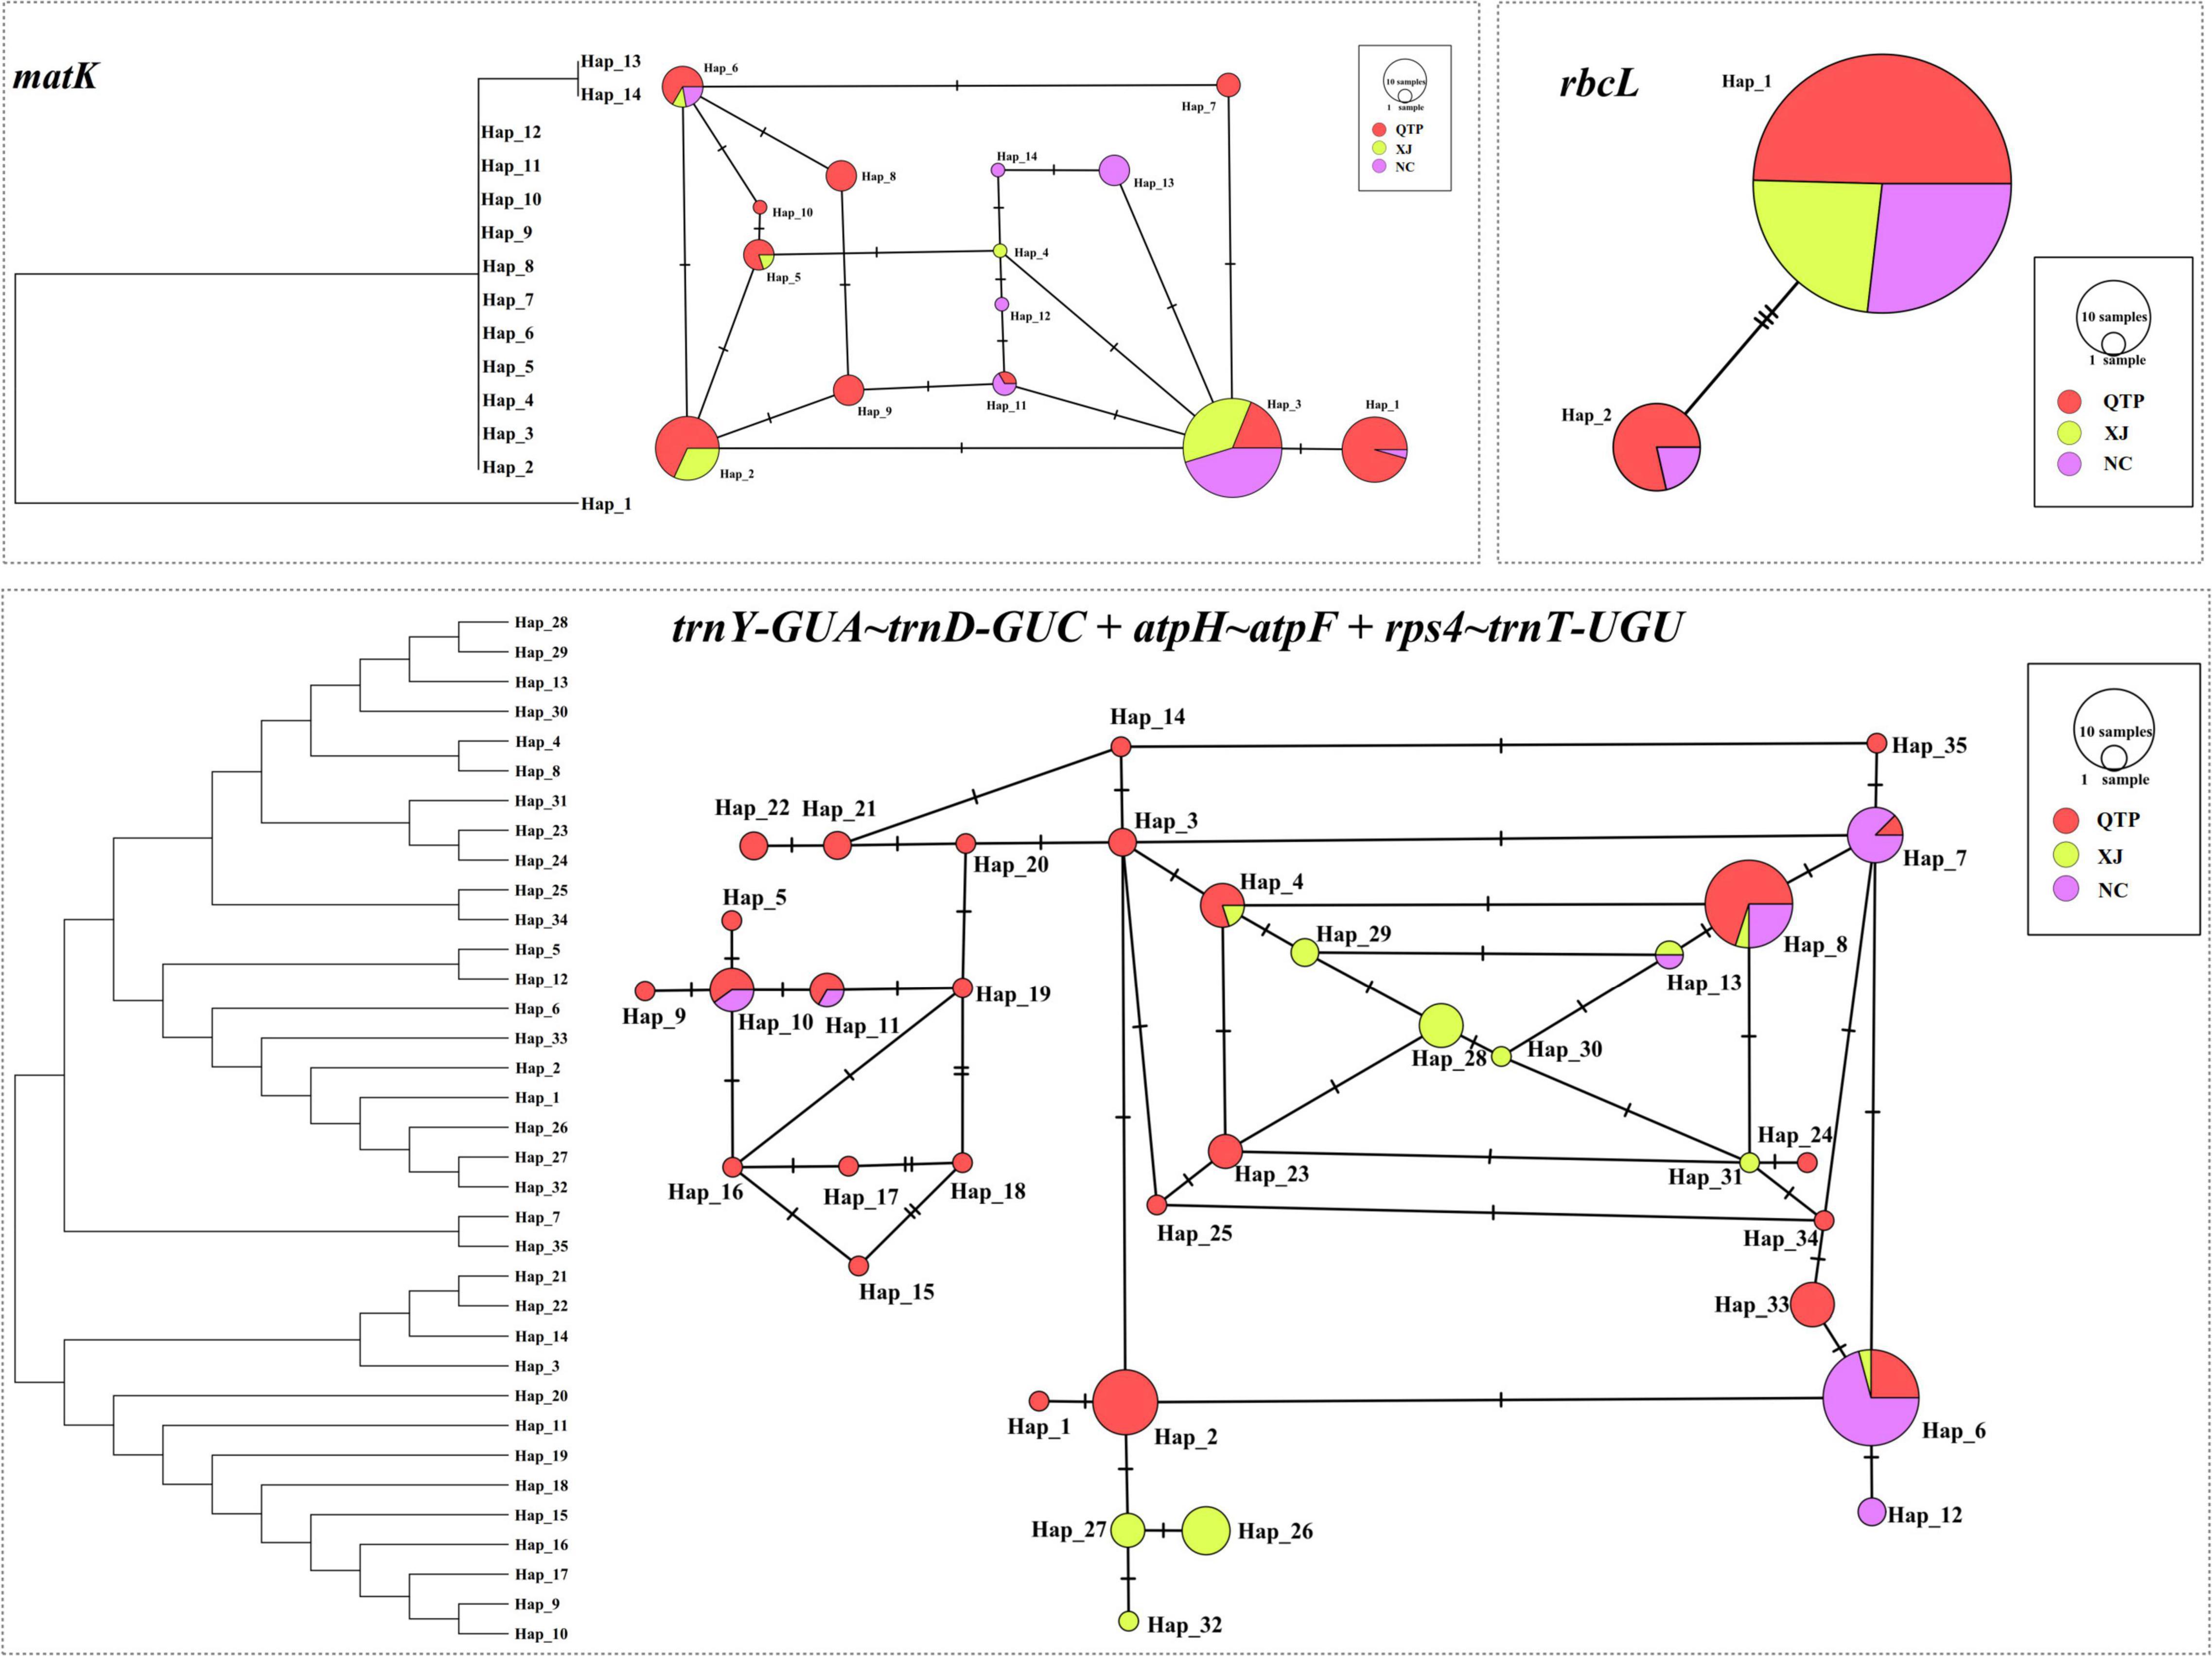
Figure 2. Haplotype network and the phylogenetic tree constructed based on cpDNA datasets.
Genetic Differentiation and Historical Gene Flow
Analysis of molecular variance (AMOVA) indicated a significant genetic differentiation among the populations based on cpSSRs and cpDNA (Table 4). The pairwise Fst value further revealed the largest divergence between the NC and XJ groups based on non-functional cp regions (cpSSRs and intergenic cpDNA regions) and the maximum differentiation between QTP and NC or XJ based on functional cp genes (Table 5). Gst and Nst values were calculated based on seven levels, namely, species, QTP, XJ, NC, QTP+XJ, QTP+NC, and XJ+NC. The permutation results showed that Nst was significantly higher than Gst (P < 0.05) when assuming species, QTP+XJ, QTP+NC, and XJ+NC, which indicates a clear phylogeographical structure between pairwise populations (Table 6). Bidirectional historical gene flow was estimated among three groups. It revealed an extensive cp genomic exchange. It is particularly worth noting the obviously higher monodirectional gene flow from the QTP to the non-QTP group and from XJ to NC (Figure 3).
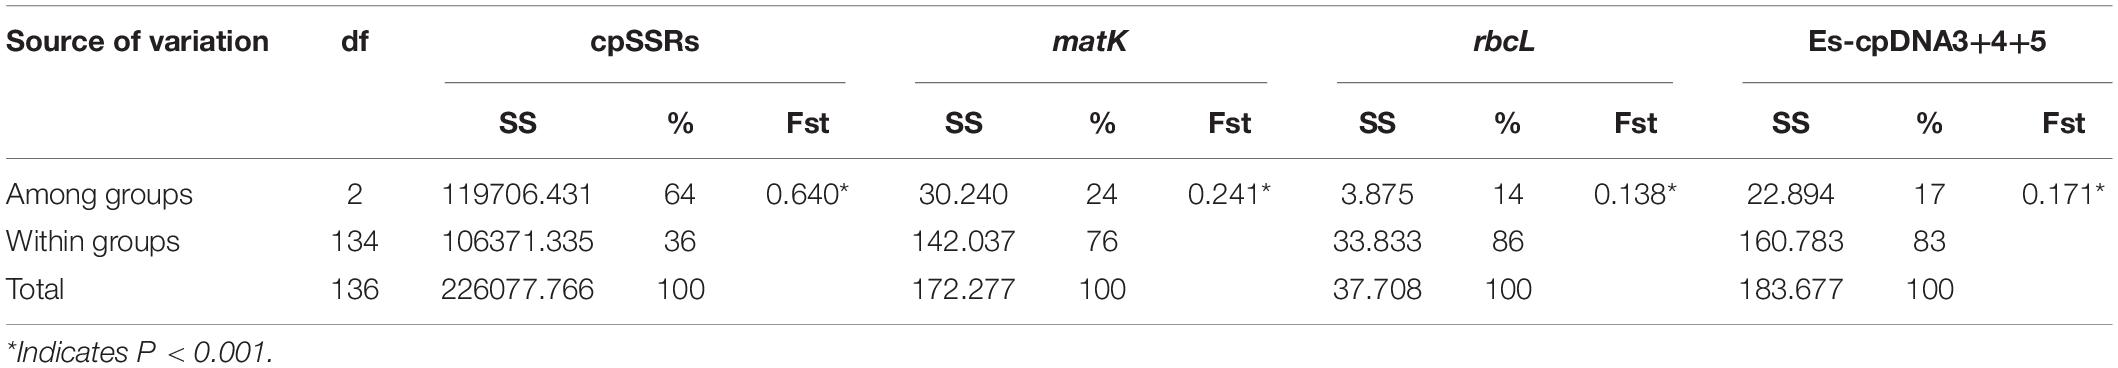
Table 4. AMOVA analysis inferred by cpDNA and cpSSRs.
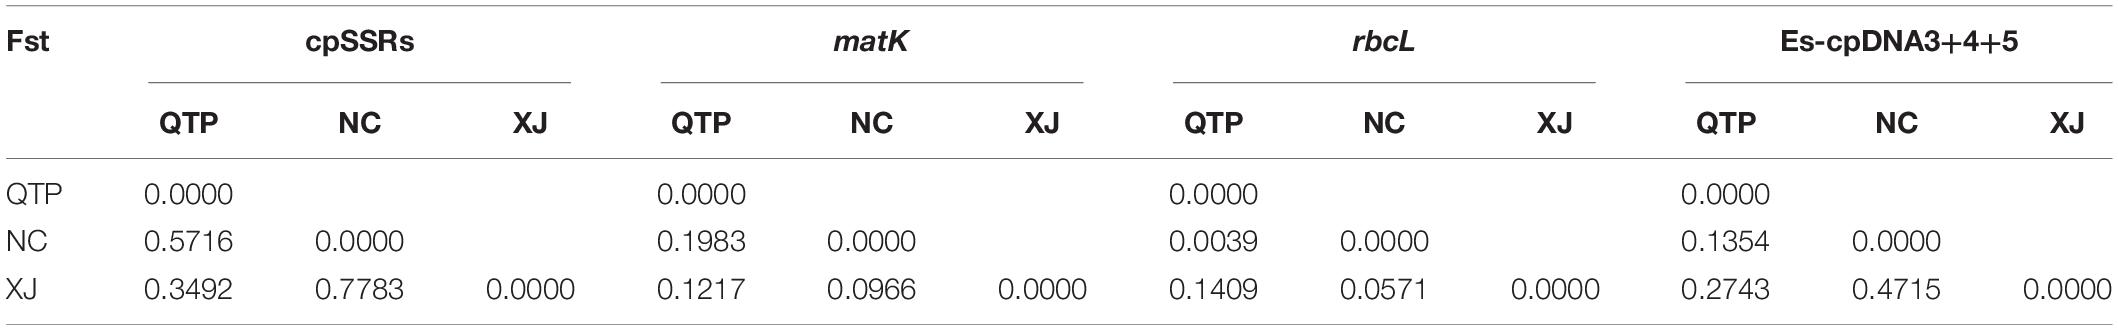
Table 5. Pairwise matrix of population genetic divergence.
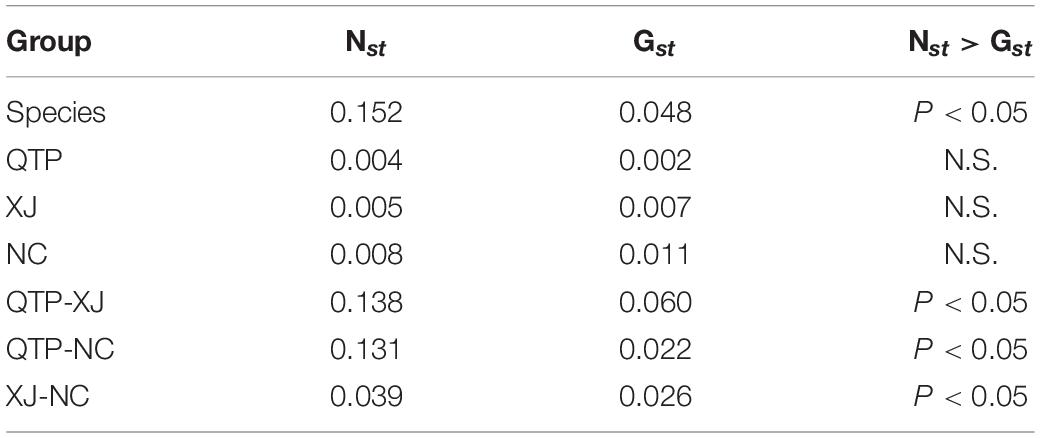
Table 6. Detection of a phylogeographic structure based on Nst and Gstvalues.
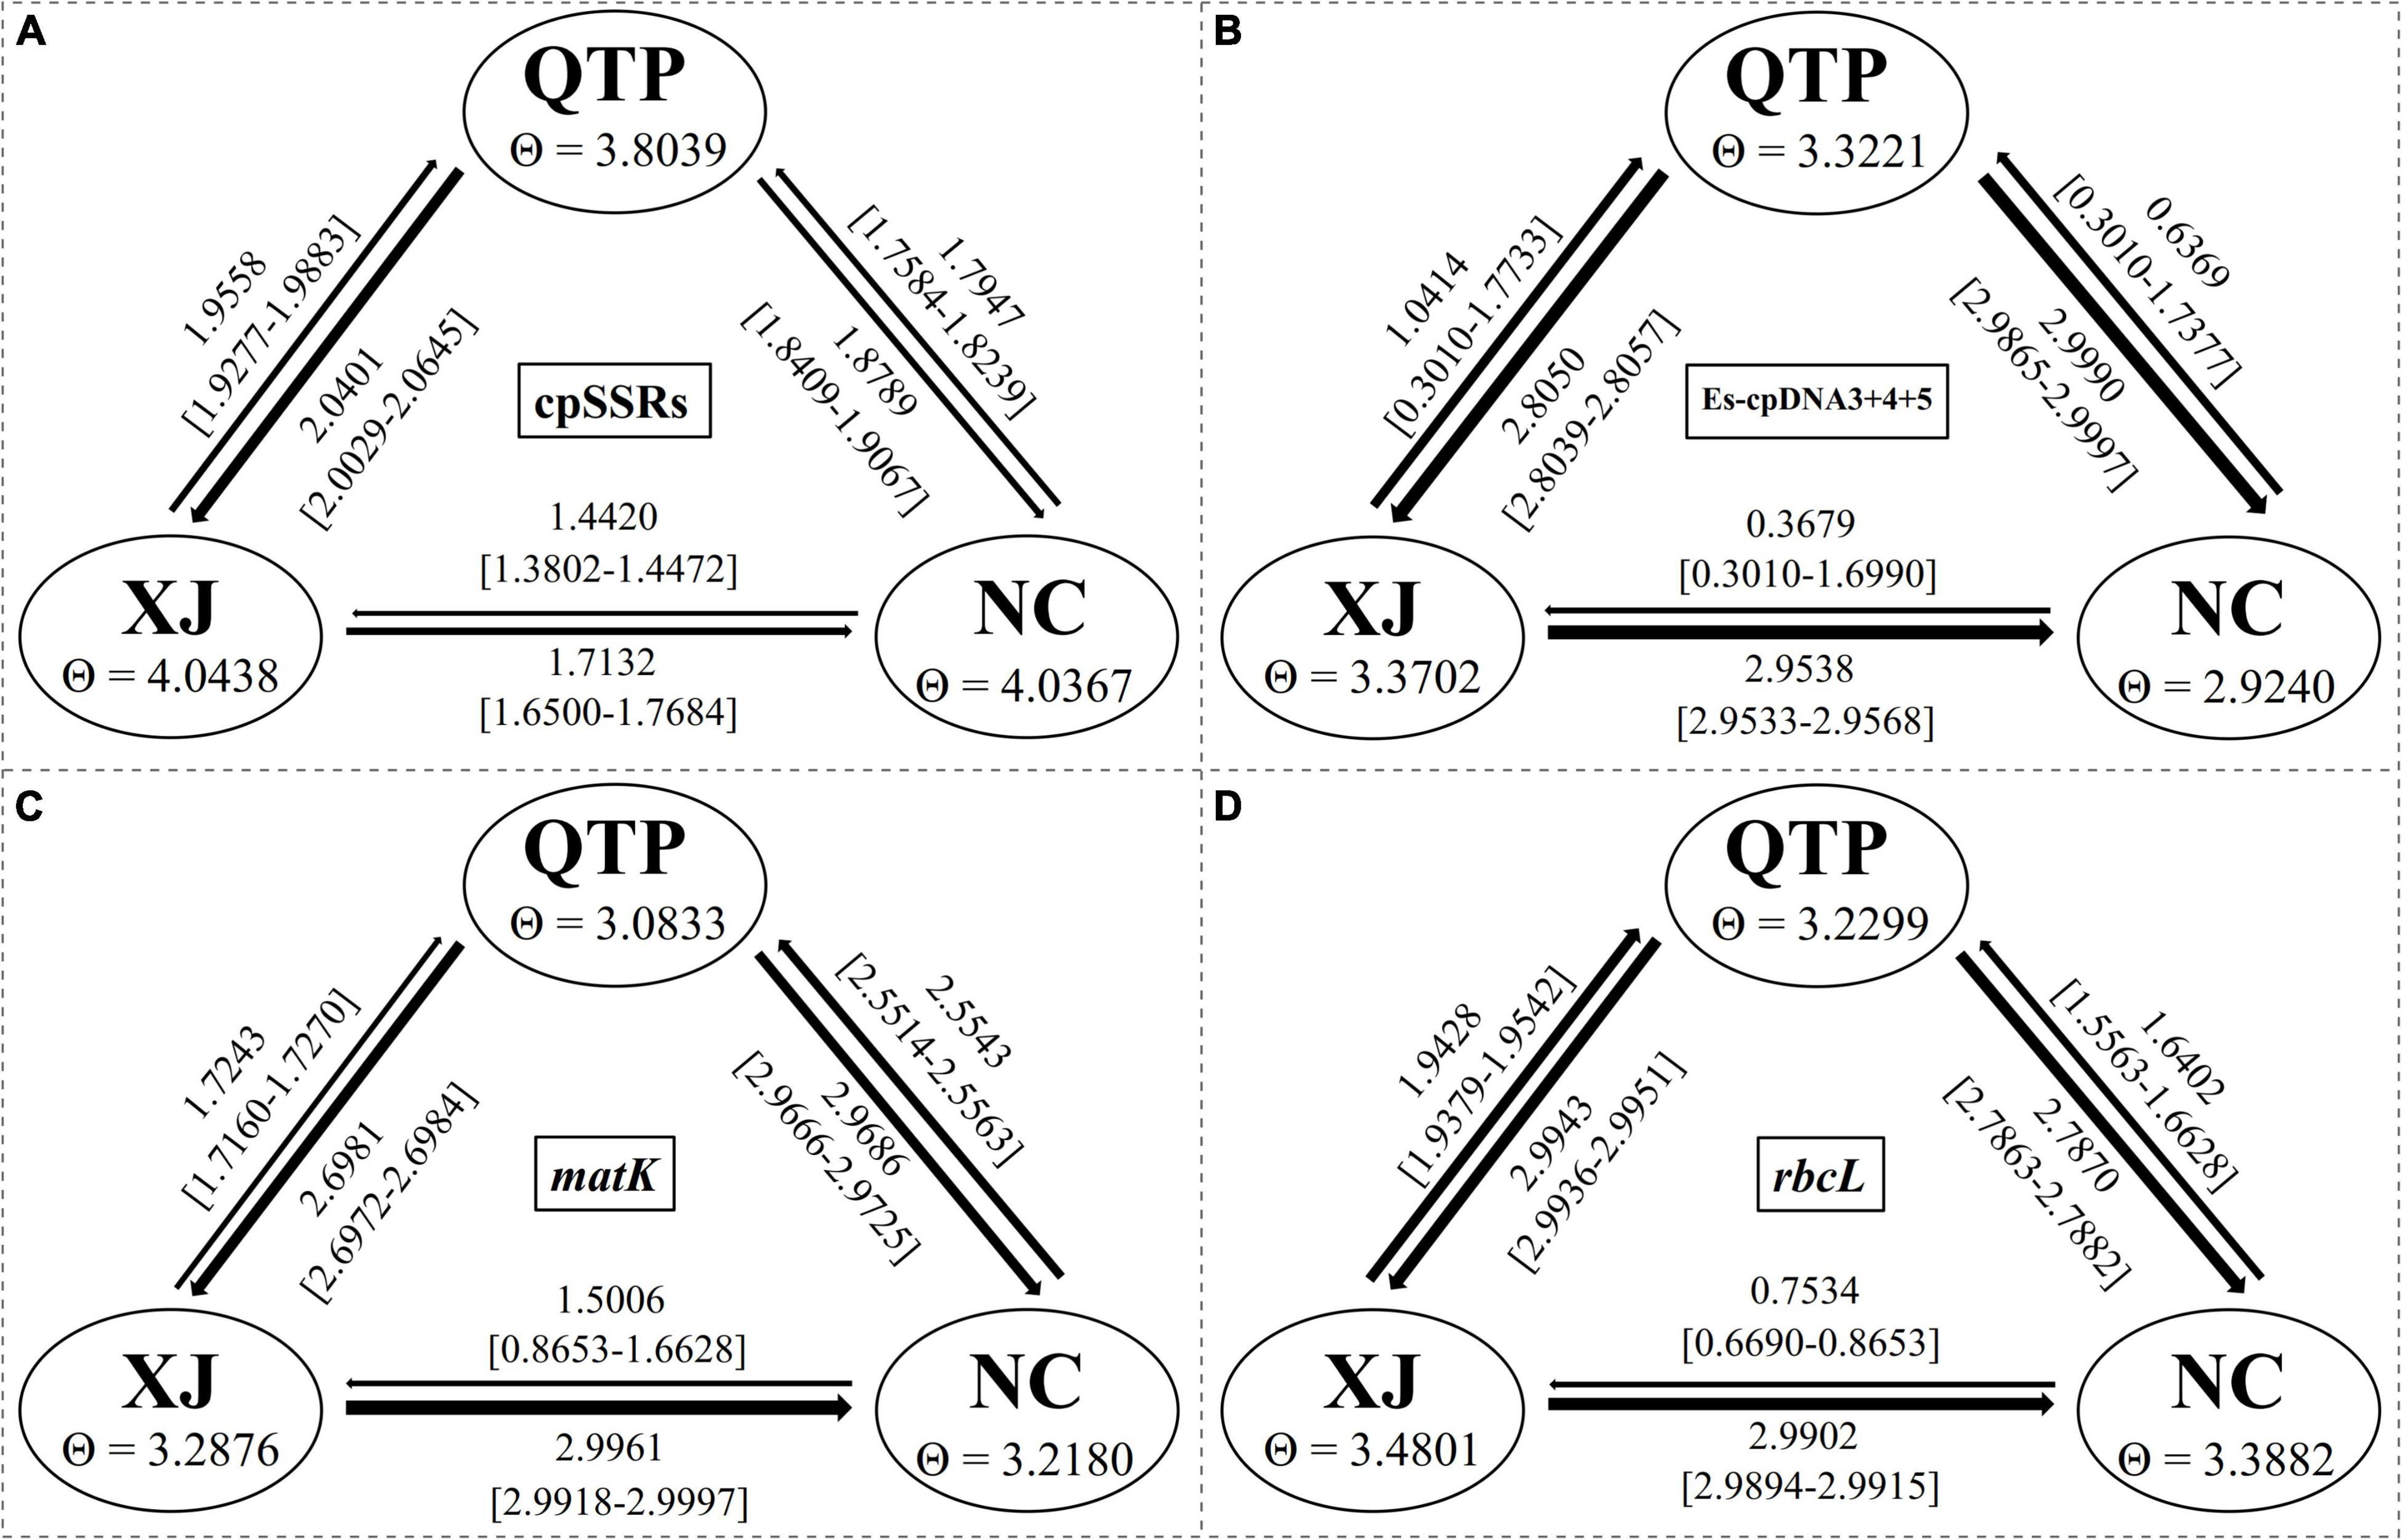
Figure 3. Bidirectional historical gene flow among three groups calculated by Migrate-n. (A–D) The results generated by cpSSRs, Es-cpDNA3+4+5, matK, and rbcL respectively.
Divergence Pattern Driven by Isolation by Distance and Isolation by Environment
The Mantel test was applied to model the correlation between pairwise genetic differentiation (Fst) and geographical or environmental distance. The longitude, latitude, bio-climates, and geographical distance all predicted a significant relationship with Fst based on cpDNA and cpSSR (Table 7). A significant correlation was also detected between altitude and Fst based on cpDNA. A generalized linear mixed modeling (GLMM) approach further confirmed a significant correlation between Fst and bio-climate distance (F = 914.566, P < 0.01 for cpSSR; F = 303.804, P < 0.01 for cpDNA) and geographical distance (F = 947.372, P < 0.01 for cpSSR; F = 312.604, P < 0.01 for cpDNA) (Table 7). Among the assumed GLMM models for cpDNA, the altitude model (F = 278.665, P < 0.01) best explained the genetic difference (DIC = −51.576). However, for cpSSR, there was no obvious difference among these models.
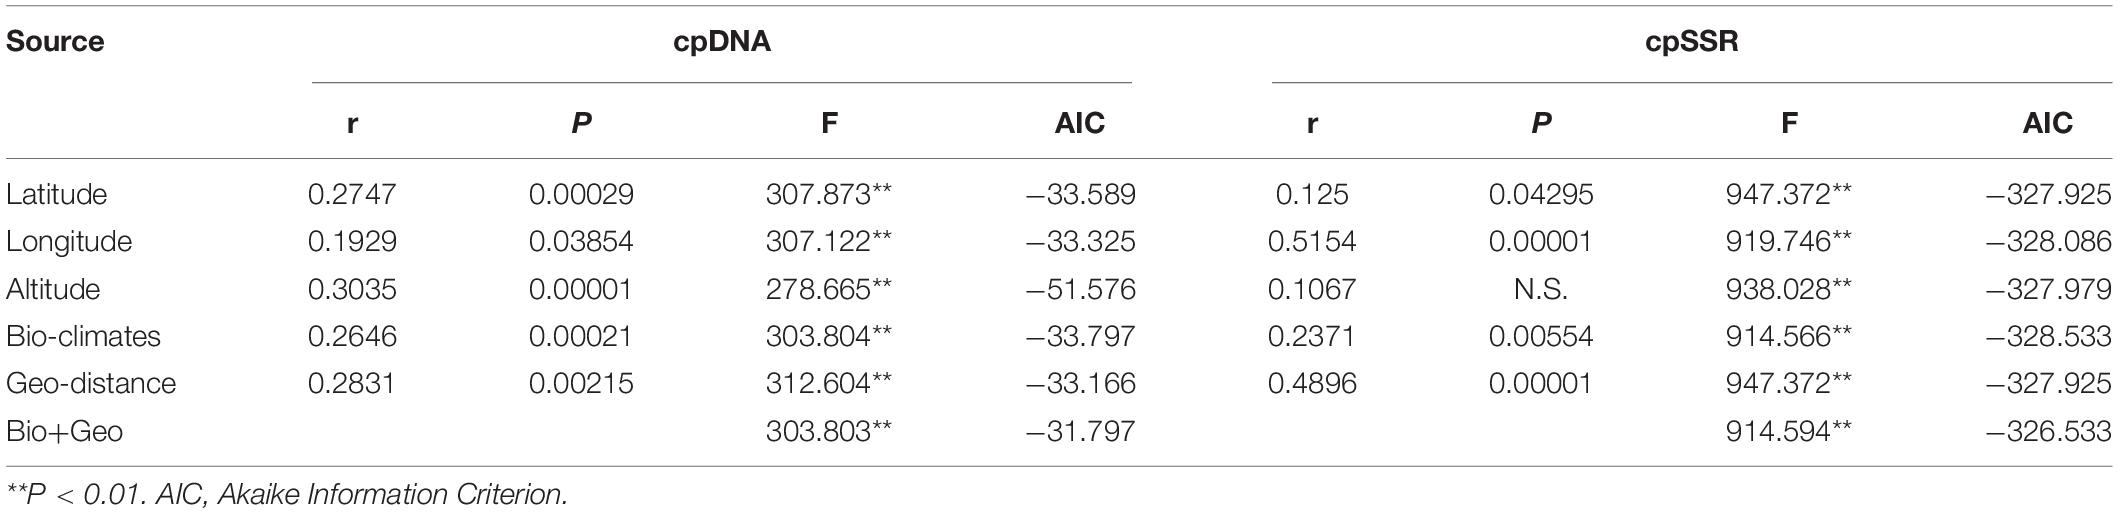
Table 7. Mantel test and the generalized linear mixed modeling (GLMM) between Fst and geographical (IBD) and bio-climate (IBE) differences.
Recent Demographic Change of Elymus sibiricus
The significantly negative Fs values at the species, QTP, XJ, and NC levels (Table 8) indicated an excess of rare alleles and thus a recent regional expansion, something that was also proven by the non-significant SSD and HRag values.
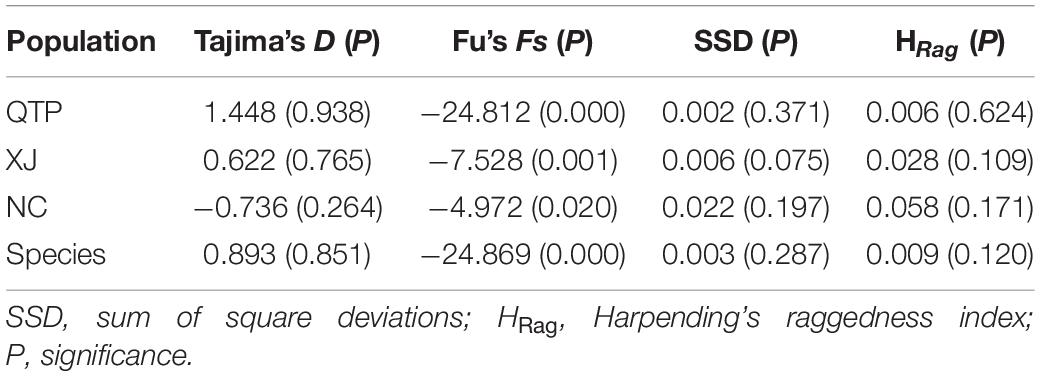
Table 8. Analysis of neutrality and mismatch distribution.
Ecological Niche Modeling of Elymus sibiricus
A total of 218 referable location records were applied to model the ecological distribution of E. sibiricus in China. The results show that the Qinghai–Tibet Plateau is the dominant suitable distribution area of E. sibiricus, followed by Xinjiang (Figure 4). There was a clear ecological niche expansion from the LGM to the MID scenario, with subsequent further expansion from MID to the recent past (1970–2000), and an expected distribution area reduction in the near future (2021–2040) (Figure 4 and Supplementary Table 1). As presented in Supplementary Table 2, Bio 1 (annual mean temperature) was estimated to be the most contributing bio-climatic variable to the MaxEnt modeling approach of all the four above-mentioned scenarios, followed by Bio 8 (mean temperature of the wettest quarter) in LGM, 1970–2000 and 2021–2040, and Bio 10 (mean temperature of the warmest quarter) in MID. It is worth noting that Bio 1, Bio 8, and Bio 10 are all temperature-related environmental factors.
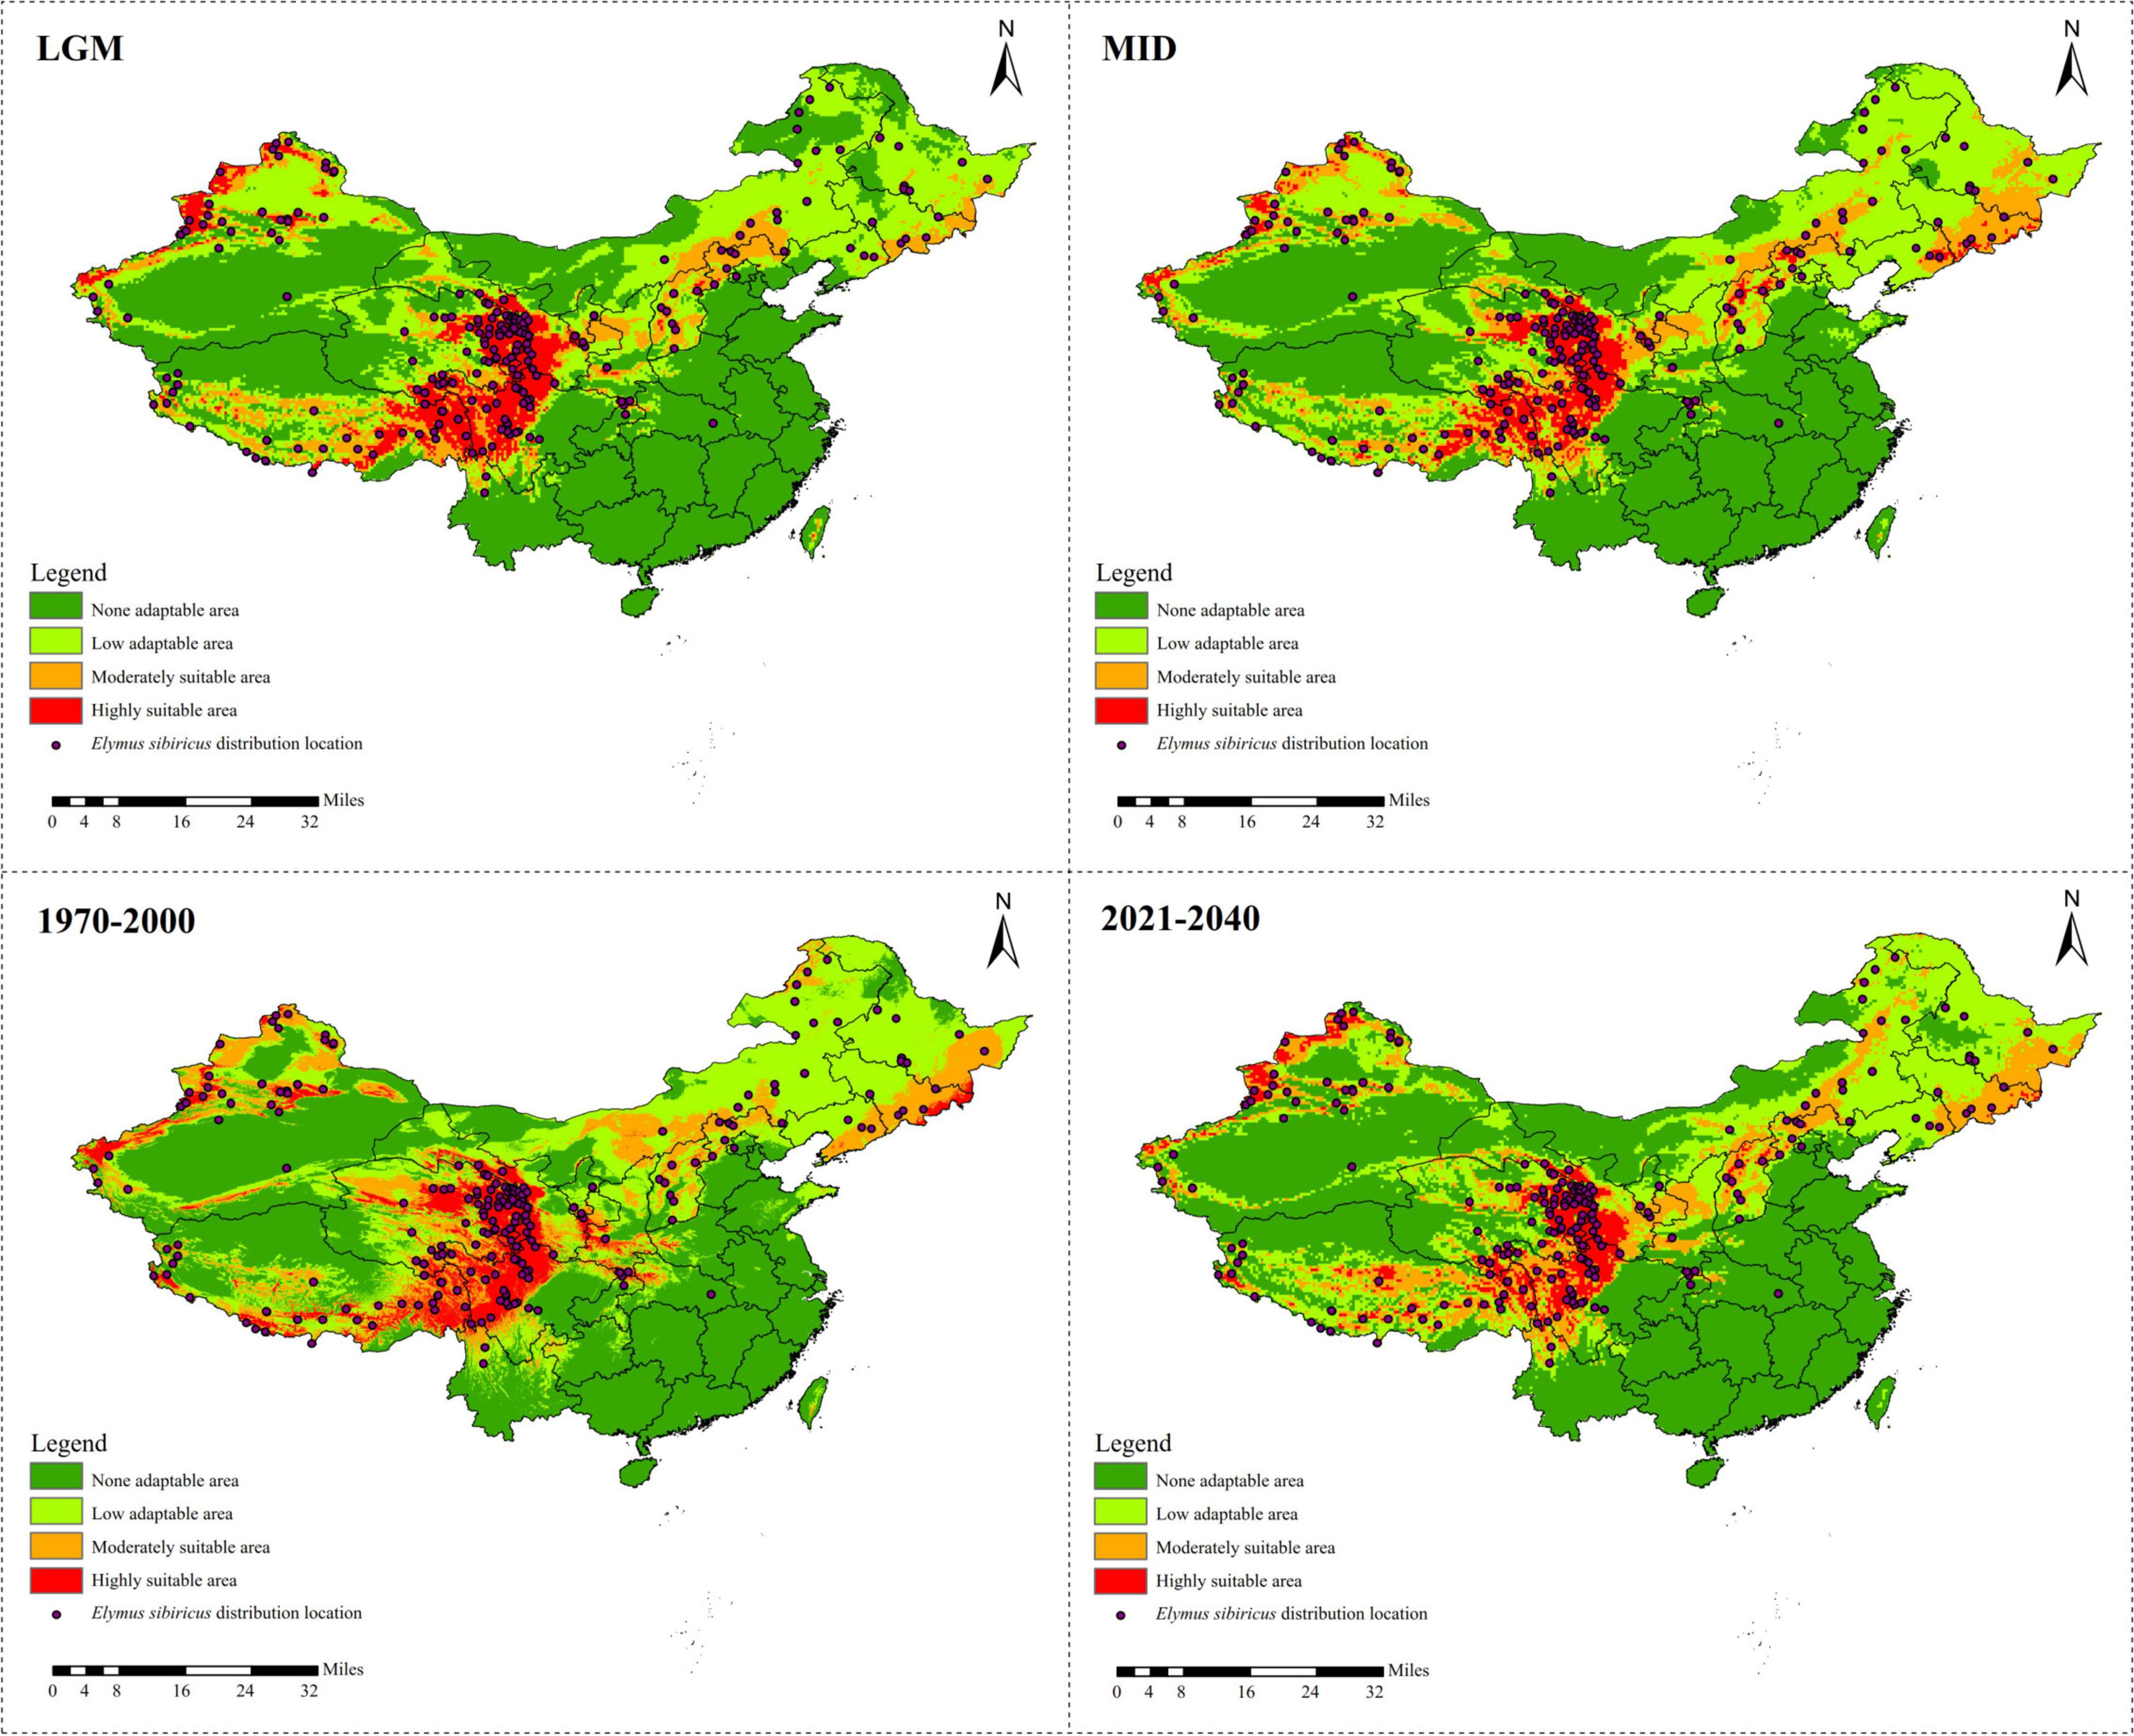
Figure 4. Ecological niche modeling of Elymus sibiricus in China showing its distribution dynamics based on MaxEnt model.
The Population History of Elymus sibiricus in China
Genetic diversity, population structure, gene flow pattern, and ecological niche dynamics suggest the QTP as the diversity center of E. sibiricus in China. Four possible scenarios were assumed to examine the population history of E. sibiricus based on the ABC modeling approach. The best-fitting scenario (namely, Scenario 2), which assumed QTP as the common ancestor and then the separation of NC and XJ, was adopted based on its maximal posterior probability (0.9761 ± 0.0929, Figure 5). This suggests QTP is the common ancestor population of E. sibiricus in China.
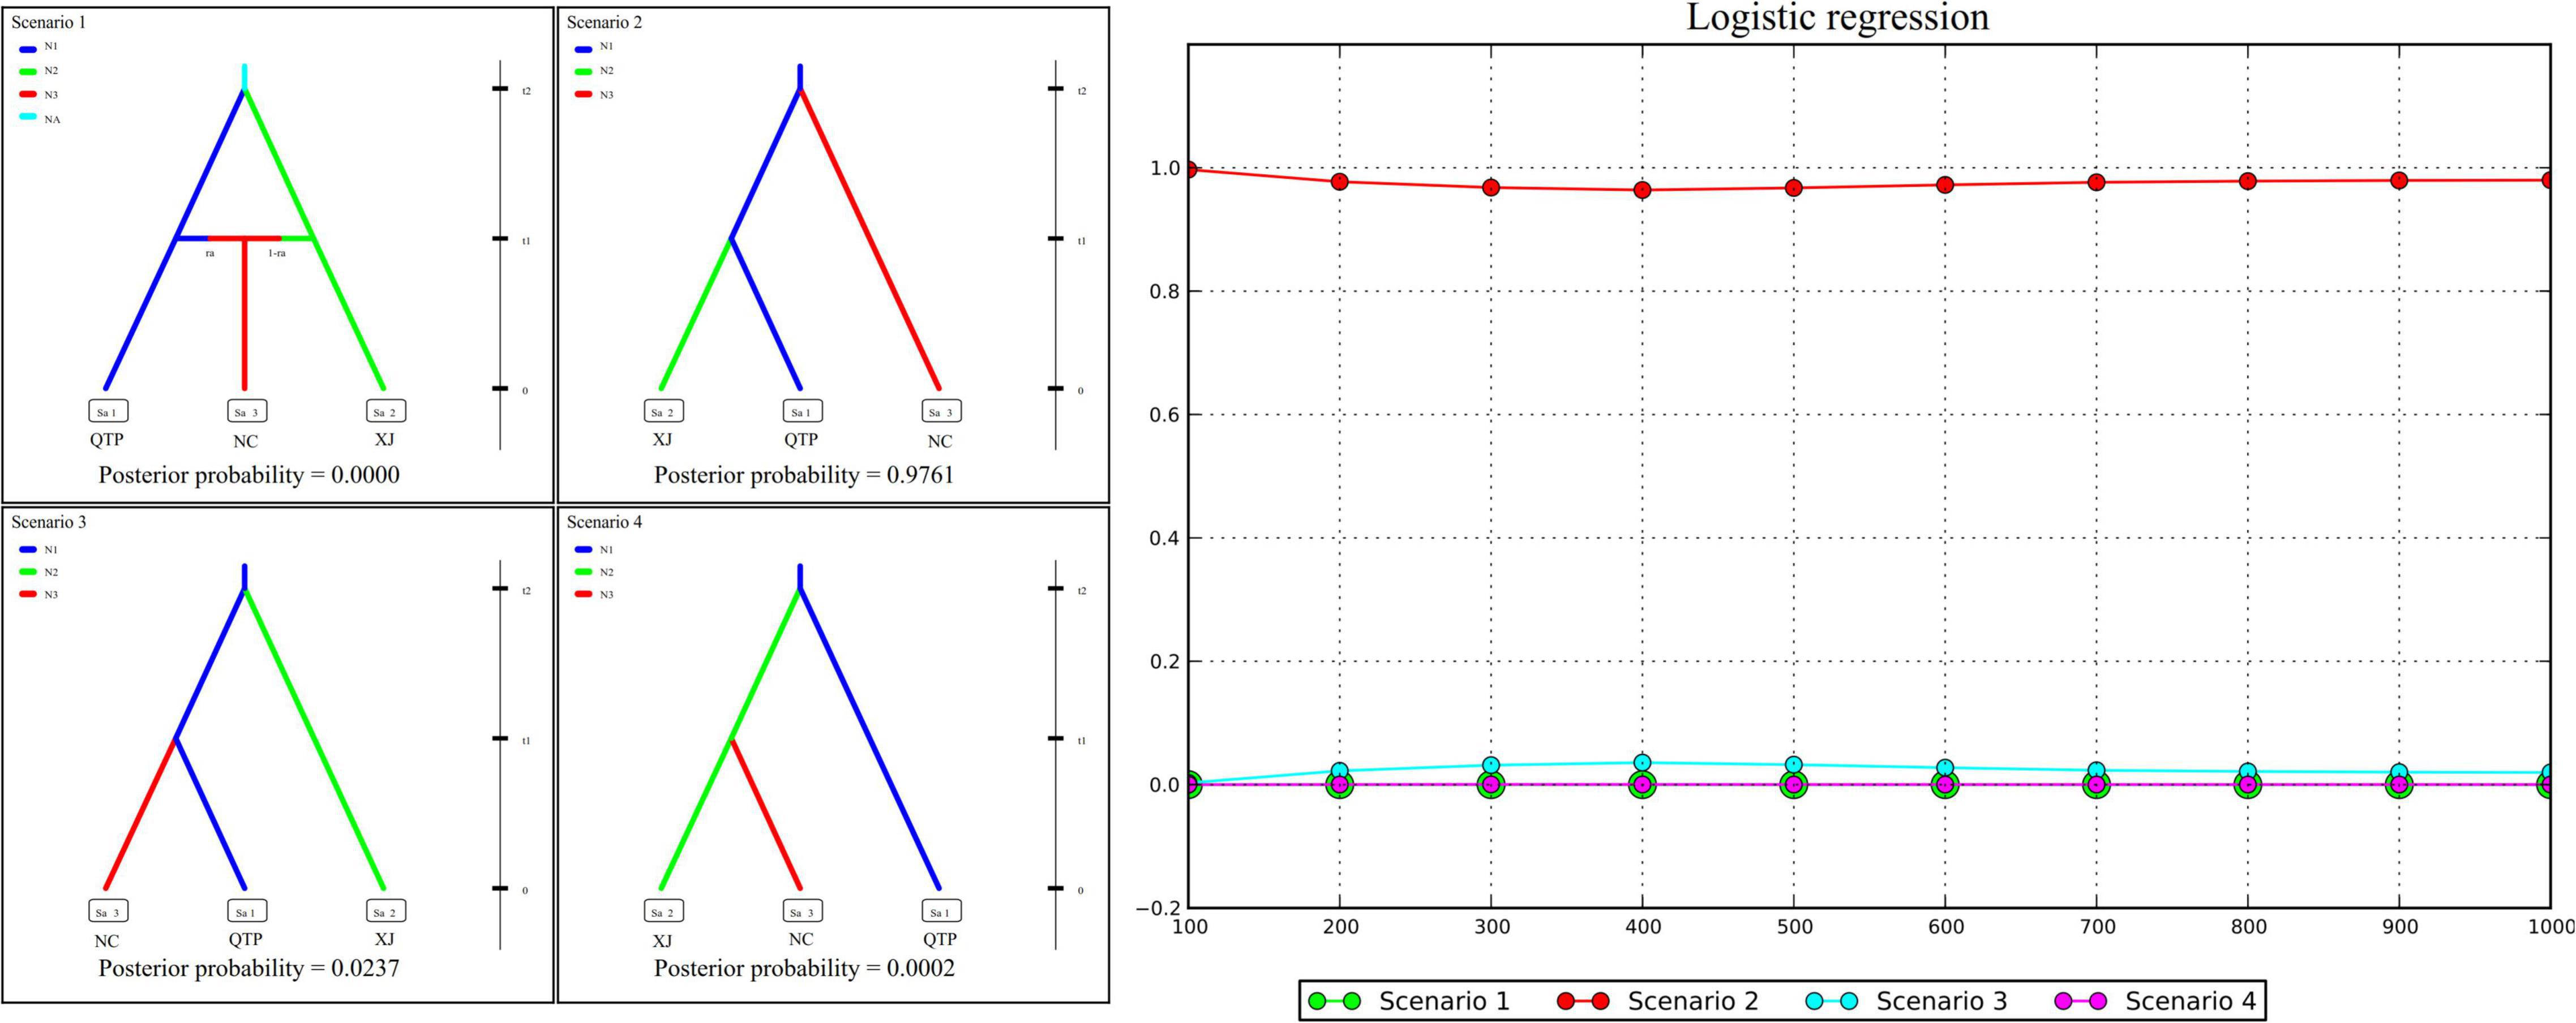
Figure 5. Approximate Bayesian computation (ABC) modeling results of four assumed scenarios and their corresponding posterior probabilities.
Discussion
Qinghai-Tibet Plateau Represents the Potential Diversity Center of Elymus sibiricus in China
As the largest and highest plateau in the world, the unique geological history and rich natural environmental variation of the QTP have bred numerous unique and rare animal and plant species. The area is thus considered an important alpine biodiversity hotspot and ecological shelter. Most species or genera endemic to the QTP are believed to have originated in situ or in adjacent areas (Wang et al., 2007; Zhang et al., 2011; Zhou et al., 2013). Species diversity has been widely explored across the QTP to reveal specific phylogenetic patterns or to find out corresponding diversity hotspots. Yu et al. (2019) characterized the Hengduan Mountains as a genetic diversity center and identified nine evolutionary hotspots across the QTP based on published plastid DNA sequences from 60 plant species occurring in the QTP. In this study, 137 E. sibiricus accessions covering the main distribution areas in China were used for the analysis. The QTP group was characterized as having the most abundant haplotype number and diversity based on cpDNA (Table 3) and the highest genetic diversity (Na, Ne, I, and h) based on cpSSR (Table 2). Similar results for E. sibiricus were also obtained using nuclear SSR by Xiong et al. (2021), which revealed the highest genetic diversity in the QTP population. In addition, the QTP-based haplotypes had a more ancient divergence time (Figure 2), and there was a obviously higher monodirectional gene flow from the QTP group to the non-QTP group (Figure 3). The ecological niche modeling results also indicate the QTP as the dominant suitable distribution area of E. sibiricus (Figure 4). Furthermore, the ABC modeling results reconfirmed the ancestor population status of the QTP (Figure 5). All the above-mentioned results suggest that the QTP is the potential genetic founder and diversity center of E. sibiricus in China.
Divergence Pattern of Elymus sibiricus May Be Attributed to Isolation by Distance and Isolation by Environment
Genetic differentiation (Fst) represents the allele frequency differences between the populations. On the one hand, isolation by distance (IBD), which is caused by remote geographical distances or genetic geographic barriers, such as rivers, mountains, and deserts, is known to weaken intrapopulation migration, mating, and gene flow (Nm), thus resulting in a significant phylogenetic structure. On the other hand, isolation by environment (IBE), which relates to habitat heterogeneity, is also believed to be responsible for population divergence. In previous studies, IBD or IBE patterns were found in several Elymus species, such as E. tangutorum (r = 0.312, P = 0.001) (Wu et al., 2019), E. nutans (r = 0.433, P = 0.010) (Chen et al., 2013), E. excelsus (r = 0.202, P < 0.01) (Xiong et al., 2019), and E. athericus (r = 0.095, P = 0.04) (Bockelmann et al., 2003). Considering the self-pollination and vegetative propagation character of E. sibiricus, as well as the matrilineal inheritance of chloroplast DNA, there is expected to be no difference between QTP and its propagated population, namely, XJ and NC. Due to the large geographical distance and huge changes in environmental conditions between populations, however, a certain degree of genetic drift and local adaption is foreseeable. This is confirmed by the high Fst values (Table 4), obvious phylogeographical structures (Table 6), and significant IBD and IBE patterns (Table 7).
Ecological Niche and Genetic Diversity Dynamics of Elymus sibiricus Point to Its Conservation Applications in China
Genetic diversity is the basis of species survival and evolution (Hughes et al., 2008). Adequate genetic diversity levels help species withstand the negative effects of climate change, inbreeding, habitat fragmentation, and loss, thereby maintaining fitness and providing the ability to evolve, thus contributing to the persistence of the species (Matesanz et al., 2017). The main factors affecting the diversity level include climatic conditions, breeding system, life type, human activity, and others (Sun et al., 2011). Therefore, understanding the genetic diversity patterns of a species and their relationship to ecological characteristics can help us better utilize and conserve genetic resources (Bockelmann et al., 2003). Our results show the highest diversity level of the QTP group (Tables 2, 3) and point to its crucial status as a natural germplasm gene bank. However, efforts are also necessary to protect the populations of XJ and NC.
Elymus sibiricus, a cool-season perennial grass species with excellent cold adaptability, is believed to be able to endure −40°C temperatures in winter (De et al., 2011). However, high temperature prevents its further spreading (Figure 4). As a result, the main distribution region of E. sibiricus is restricted to certain temperate or cold zones or to high mountains, for example, the QTP, XJ, and NC regions in China (Figure 4; Xin, 2018). The significant negative Fs (Table 8) value indicates the rapid population expansion of E. sibiricus after a bottleneck, which is also proven by the continuous ecological niche expansion from the LGM (about 22,000 years ago) to the recent past (1970–2000). However, the ecological niche distribution in the near future (2021–2040) is predicted to undergo a dramatic shrinkage (Figure 4 and Supplementary Table 1). This tendency is consistent with the global temperature changes, namely, the temperature decreasing from the LGM to the late nineteenth century, followed by the well-known warming occurring in the past 40 years (Westerhold et al., 2020). To cope with the unprecedented recovery from warming (You et al., 2020), steps must be taken to improve the heat tolerance of E. sibiricus through in situ conservation and breeding measures, such as molecular marker-assisted selective breeding, crossbreeding, genomic selection breeding, and others.
Conclusion
The QTP was identified as the diversity center of E. sibiricus in China due to its high diversity, obvious monodirectional gene flow (from QTP to non-QTP populations), strongly concentrated ecological niche distribution, and ancient phylogenetic pattern. In spite of the confused genetic structure and haplotype network, significant population divergence was found in this study, which could be attributed to IBD and IBE patterns. The predicted ecological niche shrinkage of E. sibiricus in the near future indicates that measures must be undertaken to deal with its intolerance to high temperatures, particularly continued exposure to warmer temperatures.
Materials and Methods
Sampling and DNA Extraction
Matured spike samples from a single plant were collected from 23 natural populations, covering the main geographical distribution of E. sibiricus in China (Supplementary Table 3 and Supplementary Figure 3). Fresh leaves were sampled from 5 to 6 greenhouse-grown seedlings for each population, with a total of 137 accessions. The sampled leaves were immediately dried with silica gel until DNA extraction was carried out. To avoid collecting the same individual repeatedly due to the clonal reproduction character of E. sibiricus, all the samples within a population were spaced at least 50 m apart (Ma et al., 2008; Zhang et al., 2017). The geographical information, including latitude, longitude, and altitude, was collected with a GPS at each population site (Supplementary Table 3). The total genomic DNA of each sample was extracted by applying a modified CTAB procedure (Doyle, 1991). The DNA quality was detected by running the DNA samples on 0.8% agarose gel. Template DNA was diluted to 20 ng/μl and then stored at −20°C until further use.
cpSSR Procedure
Six polymorphic cpSSR primer pairs (Es-cpSSR1–Es-cpSSR6, Supplementary Table 4) that were developed based on the chloroplast (cp) genome sequences of E. sibiricus (NCBI accession numbers: MH732740.1 and NC058919.1) and its related species Pseudoroegneria libanoticus (NCBI accession number: KX822019.1) were adopted for population amplification. Polymerase chain reaction (PCR) was carried out in a 15-μl reaction mixture that consisted of 3 μl of template DNA, 7.5 μl of dye-free Taq Mix, 0.4 μl each of forward and reverse primers, 0.2 μl of Taq DNA polymerase, and 3.5 μl of ddH2O. The PCR reaction conditions followed those of Ma et al. (2008) with minor modifications. The concentration of PCR products was adjusted to 100 ng/μl, with a minimum sample volume of 24 μl. The adjusted PCR products were then separated on an AATI Fragment Analyzer (Advanced Analytical Technologies, Ames, IA, United States) using DNF-900-K0500 (35–500 bp) as the internal marker. For genotyping, alleles were sized using the PROSize 3.0 software. The genotyping data are presented in Supplementary Table 5.
cpDNA Procedure
Five cpDNA sequences (matK, rbcL, trnY-GUA∼trnD-GUC, atpH∼atpF, and trnT-UGU∼rps4, Supplementary Table 4), which were identified as hotspot regions by mVISTA blasting (Supplementary Figure 2) based on the above-mentioned cp genomes, were chosen for amplification and sequencing. The PCR reaction conditions during the entire experiment were set to be consistent with the cpSSR procedure. PCR products were visualized on 1% agarose gels and then purified using a TIANquick Midi Purification Kit (Tiangen Biotech, Beijing, China). DNA sequencing was performed on the ABI 3100 Genetic Analyzer (Applied Biosystems, Waltham, CA, United States) with both upstream and downstream primers. The sequences were edited and aligned manually using the BioEdit software (Hall, 1999). The obtained sequences were uploaded as mentioned in Supplementary Table 6.
Genetic Diversity Calculation
We artificially divided all the tested accessions into three new groups, namely, Qinghai–Tibet Plateau (QTP), Xinjiang (XJ), and North China (NC), according to the ecological niche prediction results and corresponding geographic features (Supplementary Table 3). All further analyses were performed based on these three groups. For the diversity analysis of cpSSR, GenAlEx 6.5 (Peakall and Smouse, 2006) was used for the calculation of the number of alleles per locus (Na), the number of effective alleles per locus (Ne), Shannon’s information index (I), and Nei’s genetic diversity (h) of both the populations and primers. At the same time, the PIC index was calculated using PICcalc (Nagy et al., 2012) to reflect the effectiveness of each primer. For cpDNA, DnaSP v5 (Librado and Rozas, 2009) was used for the estimation of the number of segregating sites (S), the number of haplotypes (H), haplotype diversity (Hd), and nucleotide diversity (π). WinArl35 (Excoffier and Lischer, 2010) was used to detect if there was a demographic change by the calculation of Tajima’s D, Fu’s Fs, sum of square deviations (SSD), and Harpending’s raggedness index (HRag). Typically, the significantly negative Tajima’s D or Fu’s Fs, as well as the non-significant mismatch parameters SSD and HRag, indicate potentially historical demographic expansions (Liu L. et al., 2017). We combined three non-coding cpDNA fragments into a single dataset, that is, Es-cpDNA3+4+5. All further analyses of cpDNA were performed based on the three cpDNA regions: matK, rbcL, and Es-cpDNA3+4+5.
Population Structure
The STRUCTURE (Evanno et al., 2005) software was applied to determine the genetic membership coefficient of all the individuals for the cpSSR dataset assuming a cluster number from 1 to 4 (K = 1–4). All the other parameters were similar to those of Ma et al. (2008) with minor adjustments. The optimal K value was obtained based on the STRUCTURE HARVESTER (Earl and Vonholdt, 2012) online program via ΔK estimation. Principal component analysis (PCA) was conducted in GenAlEx 6.5 (Peakall and Smouse, 2006). Analysis of molecular variance (AMOVA) and calculation of pairwise Fst value were conducted in WinArl35 (Excoffier and Lischer, 2010) to examine the genetic differentiation between populations for both the cpSSR and the cpDNA datasets. After haplotype distribution was estimated as described earlier, haplotype networks were constructed via POPART (Leigh and Bryant, 2013) for the detection of genealogical relationships. The phylogenetic tree of haplotypes was constructed using MEGA 5 (Tamura et al., 2011). To test if there exists a phylogeographic structure, Nst and Gst values were calculated using PERMUT (Petit and Grivet, 2002) based on 10,000 permutations. Differences between Gst and Nst were estimated using u-statistic, a significantly higher Nst represents the existence of a phylogeographical structure (Petit and Grivet, 2002). In addition to Fst, gene flow (Nm) is another determinant of population genetic structure (Sexton et al., 2014). Historic pairwise population Nm and effective population size (Θ) were calculated using the software Migrate-n with parameters described by Zeng et al. (2018).
Isolation by Distance and Isolation by Environment
Genetic drift usually results in more differentiated populations at greater distances assuming no dispersal and selection, namely the so-called IBD. However, the IBD pattern neglects the possibility of environment-driven or hindered gene flow, that is, IBE. Thus, the combination of IBD and IBE could better explain the general patterns of gene flow across environments versus geographic distance (Sexton et al., 2014). In this study, IBD and IBE were detected based on the Mantel test (Diniz-Filho et al., 2013). Specifically, the genetic distance matrix and environment distance matrix were applied for the calculation of the correlation coefficient and P-value. The environmental data (19 bio-climate parameters, Supplementary Table 3) were extracted by DIVA-GIS (Hijmans et al., 2004) from a climate dataset downloaded from the WorldClim online website1 based on the latitude and longitude of the samples. In addition, the generalized linear mixed modeling (GLMM) approach was also used to reconfirm whether the population’s genetic structure was driven by environmental variables. The analysis was implemented using the R package MCMCGLMM (Hadfield, 2010) following the scripts available in Lexer et al. (2014). In total, five models, including Latitude, Longitude, Altitude, Bio-distance (Bio-climate distance), Geo-distance (geographical distance), and “Bio + Geo,” were tested. The Akaike Information Criterion (AIC) was calculated to compare the models and determine the role of IBD versus IBE in the population structure of E. sibiricus.
Ecological Niche Prediction
MaxEnt (Merow et al., 2013) model was applied to predict the ecological niche distribution of E. sibiricus in China under the maximum entropy model. Besides our own 137 locations, another 81 records sourced from the Chinese Virtual Herbarium2 were also considered, thus totaling to 218 records (Supplementary Table 7). Environmental variables (19 bios) under four scenarios were collected from the WorldClim TIF layer, that is, the Last Glacial Maximum (LGM, about 22,000 years ago), Mid-Holocene (MID, about 6,000 years ago), 1970–2000 (recent past), and 2021–2040 (the near future). To avoid multicollinearity, variance inflation factors (VIFs) were calculated. Bio-variables having a high VIF value (VIFs > 10) were excluded from further analysis. During modeling, a maximum of 10,000 iterations and a bootstrap value of 10 were set. Of the records, 75% were randomly selected for modeling and another 25% were used for validation. Response curves and Jackknife measures were applied to analyze the environmental factors affecting the distribution of E. sibiricus. For more detailed setting parameters, we referred to Liu L. et al. (2017). ArcGIS (Scott and Janikas, 2010) was used for the reclassification and visualization of potential distributions. We classified the suitable degree into four levels based on the predicted possibility: 0–5% is a non-adaptable area, 6–50% is a low adaptable area, 51–95% is a moderately suitable area, and 96–100% is a highly suitable area. In addition, the distribution proportion of the above-mentioned four types of suitable areas was calculated based on the corresponding picture element number.
Demographic History Inferred From Approximate Bayesian Computation Modeling
Four hypothesized scenarios of population history were assumed and tested based on the combined cpDNA and cpSSR datasets. Analysis was performed using approximate Bayesian computation (ABC) with the software DIYABC v. 2.1 (Cornuet et al., 2014). In our assumption, Scenario 1 described the lineage divergence of population QTP (with the effective population size of N1) and XJ (N2) from the common ancestor (NA) at time t2, and the subsequent admixture event between QTP (ra) and XJ (1-ra) which gives birth to population NC (N3) at t1. Scenario 2 assumes that the NC and XJ separated from an ancestor population QTP at t2 and t1 successively. In Scenario 3, XJ and NC separated from ancestor QTP at t2 and t1 successively. In Scenario 4, XJ first separated from ancestor QTP at t2, followed by the separation of NC from XJ at t1 (Figure 5). In reference to Zhang et al. (2019) and Garg et al. (2020), 1% of simulated datasets were chosen for optimal scenario selection by logistic regression. In addition, 1% of the simulated datasets closest to the observed data set were also set to determine the best model and to estimate posterior parameter distributions.
Data Availability Statement
The datasets presented in this study can be found in online repositories. The names of the repository/repositories and accession number(s) can be found in the article/Supplementary Material.
Author Contributions
XM, SB, DL, and JY conceived the ideas. XL, YLX, and QY contributed to the sampling procedure. YX, XL, and XS conducted the data analyses. YX and YLX wrote the manuscript. All authors have read and approved the final manuscript.
Funding
This study was supported by the National Natural Science Foundation of China (3177131276), the Key Laboratory of Superior Forage Germplasmin the Qinghai-Tibetan plateau (2020-ZJ-Y03), Sichuan provincial key science and technology program (2019YFN0170) and Biological genetic resources management project of National Forestry and Grassland Administration (KJZXSA202102). These funding bodies did not conduct the design of the study and collection, analysis, and interpretation of data and writing the manuscript.
Conflict of Interest
The authors declare that the research was conducted in the absence of any commercial or financial relationships that could be construed as a potential conflict of interest.
Publisher’s Note
All claims expressed in this article are solely those of the authors and do not necessarily represent those of their affiliated organizations, or those of the publisher, the editors and the reviewers. Any product that may be evaluated in this article, or claim that may be made by its manufacturer, is not guaranteed or endorsed by the publisher.
Supplementary Material
The Supplementary Material for this article can be found online at: https://www.frontiersin.org/articles/10.3389/fpls.2022.862759/full#supplementary-material
Supplementary Figure 1 | ΔK estimation based on the structure harvester of cpSSR.
Supplementary Figure 2 | Hotspot regions identified by mVISTA blasting based on chloroplast genome sequences of Elymus sibiricus and Elymus nutans.
Supplementary Figure 3 | Geographic distribution map of Elymus sibiricus accessions used in this study.
Supplementary Table 1 | Proportion statistics of ecological niche distribution of Elymus sibiricus.
Supplementary Table 2 | Statistics of the contribution rate of 19 bio-climatic variables to the ecological niche distribution of Elymus sibiricus.
Supplementary Table 3 | Sampling sites, sample size, and bio-climate information of 137 Elymus sibiricus accessions.
Supplementary Table 4 | Basic information of studied primers.
Supplementary Table 5 | cpSSR genotype records.
Supplementary Table 6 | cpDNA sequences of matK, rbcL, and Es-cpDNA3+4+5.
Supplementary Table 7 | Elymus sibiricus records used for ecological niche modeling.
Footnotes
References
Araújo, M. B., and Peterson, A. T. (2012). Uses and misuses of bioclimatic envelope modeling. Ecology 93, 1527–1539. doi: 10.1890/11-1930.1
Arbogast, B. S. (2015). Phylogeography: the history and formation of species. Am. Zool. 41, 134–135. doi: 10.1093/icb/41.1.134
Avise, J. C. (2000). Phylogeography: the History and Formation of Species. Cambridge, MA: Harvard University Press. doi: 10.5860/choice.37-5647
Bockelmann, A. C., Reusch, T. B. H., Bijlsma, R., and Bakker, J. P. (2003). Habitat differentiation vs. isolation-by-distance: the genetic population structure of Elymus athericus in European salt marshes. Mol. Ecol. 12, 505–515. doi: 10.1046/j.1365-294X.2003.01706.x
Chen, S. Y., Zhang, X. Q., Ma, X., and Huang, L. K. (2013). Assessment of genetic diversity and differentiation of Elymus nutans indigenous to qinghai-tibet plateau using simple sequence repeats markers. Can. J. Plant Sci. 93, 1089–1096. doi: 10.4141/cjps2013-062
Cornuet, J. M., Pudlo, P., Veyssier, J., Dehne-Garcia, A., Gautier, M., Leblois, R., et al. (2014). DIYABC v2. 0: a software to make approximate Bayesian computation inferences about population history using single nucleotide polymorphism, DNA sequence and microsatellite data. Bioinformatics 30, 1187–1189. doi: 10.1093/bioinformatics/btt763
De, Y., Zhao, L. X., and Mu, H. B. (2011). Winter hardiness of 30 accessions of Elymus sibiricus germplasms. Pratac. Sci. 28, 90–93.
Diniz-Filho, J. A. F., Soares, T. N., Lima, J. S., Dobrovolski, R., Landeiro, V. L., Telles, M. P. D. C., et al. (2013). Mantel test in population genetics. Genet. Mol. Biol. 36, 475–485. doi: 10.1590/S1415-47572013000400002
Doyle, J. (1991). “Dna protocols for plants-ctab total dna isolation,” in Molecular Techniques in Taxonomy, eds G. M. Hewitt, A. W. B. Johnston, and J. P. W. Young (Berlin: Springer).
Earl, D. A., and Vonholdt, B. M. (2012). Structure harvester: a website and program for visualizing Structure output and implementing the Evanno method. Cons. genet. res. 4, 359–361. doi: 10.1007/s12686-011-9548-7
Evanno, G. S., Regnaut, S. J., and Goudet, J. (2005). Detecting the number of clusters of individuals using the software structure: a simulation study. Mol. Ecol. 14, 2611–2620. doi: 10.1111/j.1365-294X.2005.02553.x
Excoffier, L., and Lischer, H. E. L. (2010). Arlequin suite ver 3.5: a new series of programs to perform population genetics analyses under linux and windows. Mol. Ecol. Resour. 10, 564–567. doi: 10.1111/j.1755-0998.2010.02847.x
Garg, K. M., Chattopadhyay, B., Koane, B., Sam, K., and Rheindt, F. E. (2020). Last Glacial maximum led to community-wide population expansion in a montane songbird radiation in highland papua new guinea. BMC Evol. Biol. 20:82. doi: 10.1186/s12862-020-01646-z
Garrick, R. C., Bonatelli, I. A. S., Hyseni, C., Morales, A., Pelletier, T. A., Perez, M. F., et al. (2015). The evolution of phylogeographic datasets. Mol. Ecol. 24, 1164–1171. doi: 10.1111/mec.13108
Hadfield, J. D. (2010). MCMC methods for multi-response generalized linear mixed models: the MCMCglmm R package. J. Stat. Softw. 33, 1–22. doi: 10.18637/jss.v033.i02
Hall, T. A. (1999). BioEdit: a user-friendly biological sequence alignment editor and analysis program for Windows 95/98/NT. Nucleic Acids Symp. Ser. 41, 95–98.
Hewitt, G. (2000). The genetic legacy of the quaternary ice ages. Nature 405, 907–913. doi: 10.1038/35016000
Hijmans, R. J., Guarino, L., Bussink, C., Mathur, P., Cruz, M., Barrentes, I., et al. (2004). Diva-gis ver. 4.0. A geographic information system for the analysis of species distribution data. Hum. Sci. Res. 19, 49–63. doi: 10.1044/lle19.1.4
Hughes, A. R., Inouye, B. D., Johnson, M. T. J., Underwood, N., and Vellend, M. (2008). Ecological consequences of genetic diversity. Ecol. Lett. 11, 609–623. doi: 10.1111/j.1461-0248.2008.01179.x
Leigh, J. W., and Bryant, D. (2013). Popart: full-feature software for haplotype network construction. Methods Ecol. Evol. 6, 1110–1116. doi: 10.1111/2041-210x.12410
Lexer, C., Wüest, R. O., Mangili, S., Heuertz, M., Stölting, K. N., Pearman, P. B., et al. (2014). Genomics of the divergence continuum in an African plant biodiversity hotspot, I: drivers of population divergence in Restio capensis (Restionaceae). Mol. Ecol. 23, 4373–4386. doi: 10.1111/mec.12870
Librado, P., and Rozas, J. (2009). Dnasp v5: a software for comprehensive analysis of dna polymorphism data. Bioinformatics 25, 1451–1452. doi: 10.1093/bioinformatics/btp187
Liu, J., Luo, Y. H., Li, D. Z., and Gao, L. M. (2017). Evolution and maintenance mechanisms of plant diversity in the Qinghai-Tibet Plateau and adjacent regions: retrospect and prospect. Biodiv. Sci. 25, 41–45. doi: 10.17520/biods.2016293
Liu, L., Chen, W., Yan, D. T., Li, J., Liu, L., and Wang, Y. L. (2017). Molecular phylogeography and paleodistribution modeling of the boreal tree species Ulmus lamellosa (T.Wang et S. L. Chang) (Ulmaceae) in China. Tree Genet. Genomes 13:11. doi: 10.1007/s11295-016-1095-7
Ma, X., Zhang, X. Q., Zhou, Y. H., Bai, S. Q., and Liu, W. (2008). Assessing genetic diversity of Elymus sibiricus (Poaceae: Triticeae) populations from Qinghai-Tibet Plateau by ISSR markers. Biochem. Syst. Ecol. 36, 514–522. doi: 10.1016/j.bse.2008.03.003
Matesanz, S., Rubio Teso, M. L., García-Fernández, A., and Escudero, A. (2017). Habitat fragmentation differentially affects genetic variation, phenotypic plasticity and survival in populations of a gypsum endemic. Front. Plant Sci. 8:843. doi: 10.3389/fpls.2017.00843
Mellick, R., Lowe, A., Allen, C., Hill, R. S., and Rossetto, M. (2012). Palaeodistribution modelling and genetic evidence highlight differential post-glacial range shifts of a rain forest conifer distributed across a latitudinal gradient. J. Biogeogr. 39, 2292–2302. doi: 10.1111/j.1365-2699.2012.02747.x
Merow, C., Smith, M. J., and Silander, J. A. (2013). A practical guide to MaxEnt for modeling species’ distributions: what it does, and why inputs and settings matter. Ecography 36, 1–12. doi: 10.1111/j.1600-0587.2013.07872.x
Morris, A. B., and Shaw, J. (2018). Markers in time and space: A review of the last decade of plant phylogeographic approaches. Mol. Ecol. 27, 2317–2333. doi: 10.1111/mec.14695
Nagy, S., Poczai, P., Cernák, I., Gorji, A. M., Hegedûs, G., and Taller, J. (2012). Piccalc: an online program to calculate polymorphic information content for molecular genetic studies. Biochem. Genet. 50, 670–672. doi: 10.1007/s10528-012-9509-1
Peakall, R., and Smouse, P. E. (2006). Genalex 6: genetic analysis in excel. Population genetic software for teaching and research. Mol. Ecol. Notes 6, 288–295. doi: 10.1111/j.1471-8286.2005.01155.x
Petit, R. J., and Grivet, D. (2002). Optimal randomization strategies when testing the existence of a phylogeographic structure. Genetics 161, 469–471. doi: 10.1093/genetics/161.1.469
Petit, R., Duminil, J., Fineschi, S., Hampe, A., and Vendramin, G. G. (2008). Comparative organization of chloroplast, mitochondrial and nuclear diversity in plant populations. Mol. Ecol. 14, 689–701. doi: 10.1111/j.1365-294X.2004.02410.x
Sexton, J. P., Hangartner, S. B., and Hoffmann, A. A. (2014). Genetic isolation by environment or distance: which pattern of gene flow is most common? Evolution 68, 1–15. doi: 10.1111/evo.12258
Sun, Y., Wen, X. Y., and Huang, H. W. (2011). Genetic diversity and differentiation of Michelia maudiae (Magnoliaceae) revealed by nuclear and chloroplast microsatellite markers. Genetica 139, 1439–1447. doi: 10.1007/s10709-012-9642-0
Tamura, K., Peterson, D., Peterson, N., Stecher, G., Nei, M., and Kumar, S. (2011). MEGA5: molecular evolutionary genetics analysis using maximum likelihood, evolutionary distance, and maximum parsimony methods. Mol. Biol. Evol. 28, 2731–2739. doi: 10.1093/molbev/msr121
Wang, Y. J., Liu, J. Q., and Miehe, G. (2007). Phylogenetic origins of the Himalayan endemic Dolomiaea, Diplazoptilon and Xanthopappus (Asteraceae: Cardueae) based on three DNA regions. Ann. Bot. 99, 311–322. doi: 10.1093/aob/mcl259
Wang, Z., Zeng, Y., Zhang, Z., Sheng, S., Tian, J., Wu, R., et al. (2017). Phylogeography study of the Siberian apricot (Prunus sibirica L.) in Northern China assessed by chloroplast microsatellite and DNA makers. Front. Plant Sci. 8:1989. doi: 10.3389/fpls.2017.01989
Westerhold, T., Marwan, N., Drury, A. J., Liebrand, D., Agnini, C., Anagnostou, E., et al. (2020). An astronomically dated record of Earth’s climate and its predictability over the last 66 million years. Science 369, 1383–1387. doi: 10.1126/science.aba6853
Wu, W. D., Liu, W. H., Sun, M., Zhou, J. Q., Liu, W., Zhang, C. L., et al. (2019). Genetic diversity and structure of Elymus tangutorum accessions from western China as unraveled by AFLP markers. Hereditas 156:8. doi: 10.1186/s41065-019-0082-z
Xin, Y. R. (2018). Genetic Diversity Analysis Of Elymus Sibiricus L. Based On Chloroplast TRNL-F And PSBA-TRNH Sequences. Chengdu: Sichuan Agricultural University.
Xiong, Y. L., Liu, W. H., Xiong, Y., Yu, Q. Q., Ma, X., Lei, X., et al. (2019). Revelation of genetic diversity and structure of wild Elymus excelsus (Poaceae: Triticeae) collection from western China by SSR markers. PeerJ 7:e8038. doi: 10.7717/peerj.8038
Xiong, Y., Lei, X., Bai, S. Q., Xiong, Y. L., Liu, W. H., Wu, W. D., et al. (2021). Genomic survey sequencing, development and characterization of single- and multi-locus genomic SSR markers of Elymus sibiricus L. BMC Plant Biol. 21:3. doi: 10.1186/s12870-020-02770-0
You, Q. L., Wu, F. Y., Shen, L. C., Pepin, N., Jiang, Z. H., and Kang, S. C. (2020). Tibetan Plateau amplification of climate extremes under global warming of 1.5 °C, 2 °C and 3 °C. Glob. Planet. Change 192:103261. doi: 10.1016/j.gloplacha.2020.103261
Yu, H. B., Favre, A., Sui, X. H., Chen, Z., Qi, W., and Xie, G. W. (2019). Mapping the genetic patterns of plants in the region of the Qinghai-Tibet Plateau: implications for conservation strategies. Divers. Distrib. 25, 310–324. doi: 10.1111/ddi.12847
Zeng, Y., Zhang, J., Abuduhamiti, B., Wang, W., and Jia, Z. (2018). Phylogeographic patterns of the desert poplar in Northwest China shaped by both geology and climatic oscillations. BMC Evol. Biol. 18:75. doi: 10.1186/s12862-018-1194-1
Zhang, B. W., Xu, L. L., Li, N., Yan, P. C., Jiang, X. H., Woeste, K. E., et al. (2019). Phylogenomics reveals an ancient hybrid origin of the Persian walnut. Mol. Biol. Evol. 36, 2451–2461. doi: 10.1093/molbev/msz112
Zhang, J. W., Nie, Z. L., Wen, J., and Sun, H. (2011). Molecular phylogeny and biogeography of three closely related genera, Soroseris, Stebbinsia, and Syncalathium (Asteraceae, Cichorieae), endemic to the Tibetan Plateau, SW China. Taxon 60, 15–26. doi: 10.1002/tax.601003
Zhang, Y., Yu, Q., Zhang, Q., Hu, X., Hu, J., and Fan, B. (2017). Regional-scale differentiation and phylogeography of a desert plant Allium mongolicum (Liliaceae) inferred from chloroplast DNA sequence variation. Plant Syst. Evol. 303, 451–466. doi: 10.1007/s00606-016-1383-6
Zhou, Z., Hong, D. Y., Niu, Y., Li, G. D., Nie, Z. L., Wen, J., et al. (2013). Phylogenetic and biogeographic analyses of the Sino-Himalayan endemic genus Cyananthus (Campanulaceae) and implications for the evolution of its sexual system. Mol. Phylogenet. Evol. 68, 482–497. doi: 10.1016/j.ympev.2013.04.027
Keywords: Elymus sibiricus, phylogenetics, ecological niche, genetic diversity, Qinghai-Tibet Plateau
Citation: Xiong Y, Xiong Y, Shu X, Yu Q, Lei X, Li D, Yan J, Bai S and Ma X (2022) Molecular Phylogeography and Intraspecific Divergences in Siberian Wildrye (Elymus sibiricus L.) Wild Populations in China, Inferred From Chloroplast DNA Sequence and cpSSR Markers. Front. Plant Sci. 13:862759. doi: 10.3389/fpls.2022.862759
Received: 26 January 2022; Accepted: 30 March 2022;
Published: 19 May 2022.
Edited by:
Devendra Ram Malaviya, Indian Grassland and Fodder Research Institute (ICAR), IndiaReviewed by:
Marcos Queiroz, Institute of Botany (ASCR), CzechiaAlexis Marchesini, Fondazione Edmund Mach, Italy
Copyright © 2022 Xiong, Xiong, Shu, Yu, Lei, Li, Yan, Bai and Ma. This is an open-access article distributed under the terms of the Creative Commons Attribution License (CC BY). The use, distribution or reproduction in other forums is permitted, provided the original author(s) and the copyright owner(s) are credited and that the original publication in this journal is cited, in accordance with accepted academic practice. No use, distribution or reproduction is permitted which does not comply with these terms.
*Correspondence: Shiqie Bai, baishiqie@126.com; Xiao Ma, maroar@126.com
†These authors have contributed equally to this work and share first authorship