 Qingqin Gan
 Mingbao Luan
 Maolong Hu
 Zhongsong Liu
 Zhenqian Zhang
- 1College of Agriculture, Hunan Agricultural University, Changsha, China
- 2Institute of Bast Fiber Crops, Chinese Academy of Agricultural Sciences/Key Laboratory of Stem-Fiber Biomass and Engineering Microbiology, Ministry of Agriculture, Changsha, China
- 3Institute of Industrial Crops, Jiangsu Academy of Agricultural Science, Nanjing, China
Sclerotinia disease and weeds of Brassica napus greatly reduce crop yields. However, brassinolides can improve the resistance of plants to sclerotinia diseases and herbicides. In this study, we investigated the effects of brassinolide on the occurrence, physiological indices, yield, and gene expression of Fanming No. 1 seeds under sclerotinia and glufosinate stress. The results showed that soaking of the seeds in 0.015% brassinolide for 6 h reduced the incidence of sclerotinia by 10%. Additionally, in response to glufosinate stress at the seedling stage, the enzyme activities of catalase and superoxide dismutase increased by 9.6 and 19.0 U/gFW/min, respectively, and the soluble sugar content increased by 9.4 mg/g, increasing the stress resistance of plants and yield by 2.4%. LHCB1, fabF, psbW, CYP90A1, ALDH3F1, ACOX1, petF, and ACSL were screened by transcriptome analysis. ALDH3F1 and CYP90A1 were identified as key genes. Following glufosinate treatment, transgenic plants overexpressing ALDH3F1 and CYP90A1 were found to be resistant to glufosinate, and the expression levels of the ALDH3F1 and CYP90A1 were 1.03–2.37-fold as high as those in the control. The expression level of ATG3, which is an antibacterial gene related to sclerotinia disease, in transgenic plants was 2.40–2.37-fold as high as that in the control. Our results indicate that these two key genes promote plant resistance to sclerotinia and glufosinate. Our study provides a foundation for further studies on the molecular mechanisms of rapeseed resistance breeding and selection of new resistant varieties.
1 Introduction
Rapeseed is the second-largest oilseed crop (Asaduzzaman et al., 2014). As one of the fastest growing global sources of edible oilseeds, rapeseed is among the few species with the potential for meeting the growing edible oil requirements of many countries in Asia, Africa, and America (Sharma et al., 2012).
Weed infestation during the rapeseed seedling stage is a major factor reducing yield (Krato and Petersen, 2012). Although chemical herbicides can effectively and easily control weeds, pesticide residues are extremely harmful to the growth of crops, particularly rapeseed (Gondo et al., 2021). Sclerotiorum is one of the main pathogens that causes serious stem rot disease in Brassica napus L. (Bolton et al., 2006). The serious stem rot disease in Brassica napus L. that is caused by sclerotiorum results in a yield loss of 10-70% in rapeseed cultivation (Del Río et al., 2007; Derbyshire and Denton-Giles, 2016). Disease control in rapeseed relies mainly on partially resistant lines which is resist sclerotiorum (Wang et al., 2018). The molecular mechanisms underlying the response of the rapeseed plant to this pathogen are poorly understood (Zhang et al., 2022).
Brassinolides improve plant adaptation to biotic and abiotic stresses, such as those caused by heavy metals, pesticides, herbicides, and organic pollutants (Rajewska et al., 2016; Yuan et al., 2017; Xia et al., 2018). Cytochrome P450 participates in the biosynthesis of endogenous lipophilic compounds, such as fatty acids, brassinolides, and gibberellins, and it enables the oxidative detoxification of many herbicides (Mary, 2010). CYP90A1 engages in the most important step in brassinolide biosynthesis (Szekeres et al., 1996). In wheat (Triticum aestivum), a series of P450s mediate the N-demethylation and cyclo-methylhydroxylation of phenylurea herbicides such as primosulfuron (Frear DS); in soybean, CYP71A10 N-demethylates a range of phenylurea herbicides and ring-methyl hydroxylates chlortoluron (Siminszky et al., 1999).
ALDH belongs to a family of NAD(P)+-dependent enzymes with broad substrate specificity and catalyzes the oxidation of various toxic aldehydes to carboxylic acids. Transgenic Arabidopsis plants overexpressing Ath-ALDH3 show improved tolerance to dehydration, NaCl, heavy metals, and methyl viologen (Sunkar et al., 2003). In contrast, deletion of ALDH affects photosynthesis in plants. The protective effects of ALDH3F1 are required to maintain membrane fluidity and support leaf gas exchange and photosynthesis (Zhao, J. Y. et al., 2017).
We previously showed that ATG3 can improve rapeseed resistance to Sclerotinia sclerotiorum (Wang et al., 2019). Treatment of Brassica napus seeds with brassinolides can improve resistance to herbicides (glufosinate-ammonium) at the seedling stage. Transcriptome analysis revealed that ALDH3F1 and CYP90A1 were involved in these effects. Overexpression of ALDH3F1 and CYP90A1 improved the tolerance of rapeseed to glufosinate-ammonium and enhanced ATG3 expression. In this study, we investigated the underlying mechanisms influencing stress resistance, which may help accelerate molecular breeding of herbicide-resistant rapeseed plants.
2 Materials and methods
2.1 Plant material
Fanming No. 1 was cultivated in an experimental field at the Yunyuan Experimental Base of Hunan Agricultural University (Changsha, Hunan Province) at a planting density of 30 × 30 cm. Experiments were performed in triplicate according to planned regular regional experiments for Fanming No. 1. The plot area was 10 m2, and the plants were planted in rows.
At the seedling stage, the control was soaked in water and sprayed with 88.8% ammonium glyphosate (dilution ratio 400×) and 200 g/L glufosinate (dilution ratio 400×). Young leaf tissue samples were collected on days 7, 10, and 13 after treatment, with five samples collected per treatment. The samples were divided into two parts: one part was immediately frozen at −80°C and the other was used to extract RNA. We performed physicochemical analysis of the frozen samples. For the samples evaluating using quantitative reverse transcription polymerase chain reaction (qRT-PCR), the first sampling time was October 28, 2021 and the last sampling time was November 3, 2021. The first sampling time for samples used to analyze physicochemical traits was November 3, 2021 and the last sampling time was April 27, 2022. Mature B. napus plants were harvested on May 3, 2022, and agronomic traits were determined.
2.2 Measurement items and methods
2.2.1 Effect of brassinolide on Fanming No. 1
2.2.1.1 Treatment methods
Fanming No. 1 seeds (n = 100) were soaked in water or 0.15% and 0.015% brassinolide solutions for 0, 2, 4, 6, 8, and 10 h. The germination rate was measured to determine the optimum concentration and soaking time.
2.2.1.2 Effects of brassinolide on the physiology, biochemistry, yield, and quality of Fanming No. 1
Leaf samples were taken from the third-to-last leaf of the plant to measure superoxide dismutase (SOD) (Gao, 2006), peroxidase (Bestwick et al., 1998), and catalase activities (Hayat et al., 2016). The contents of malondialdehyde (Vos et al., 1991), protein (Bradford, 1976), total sugar (Dubois et al., 1951), and total chlorophyll (Anis et al., 2020) were determined using a U 8000 spectrophotometer (METASH, Shanghai, China). All experiments included three biological replicates, each containing five plants.
To determine the agronomic traits, the field growth of Fanming No. 1 was investigated in January 2022. The agronomic traits, yield, and quality of rapeseed at maturity were investigated in May 2022. All experiments were performed in five biological replicates.
2.2.2 Field disease investigation
At 35 days after pollination of Fanming No. 1, the presence of disease (sclerotiorum) was evaluated on all plants of each line, as described by Wang et al. (2019).
2.2.3 Key differential gene screening
2.2.3.1 RNA extraction from plant samples
The third-to-last leaf at the 5–6 leaf stage of Fanming No. 1 was collected, and more than three leaves from the brassinolide soaking treatment and control groups were collected. One sample was frozen in liquid nitrogen (−80°C). The TransZol Up Plus RNA Kit reagent was used for RNA extraction (Beijing TransGen Biotech Co., Ltd., Beijing, China). RNA quality was evaluated using a Nanodrop2000 (Thermo Fisher Scientific, Waltham, MA, USA) and 2100 Bioanalyzer (Agilent Technologies, Santa Clara, CA, USA).
2.2.3.2 Transcriptome sequencing
Transcriptome sequencing analysis was performed by Nanjing Pesennuo Gene Technology Ltd. (Nanjing, China).
2.2.3.3 Sequencing result analysis
We focused on metabolic pathways related to herbicide resistance, such as photosynthesis (Song et al., 2020), pyruvate metabolism (Leslie and Baucom, 2014), aromatic amino acid synthesis (Zhao N. et al., 2017), and screened key differential genes combined with functional annotations provided by NCBI.
2.2.4 Functional gene screening
The third to last leaves of each treatment sample were collected at different stages from more than three plants. One sample was cryopreserved in liquid nitrogen at −80°C and RNA was extracted using a TransZol Up Plus RNA Kit (Beijing TransGen Biotech Co., Ltd., Beijing, China). RNA quality was detected using a Nanodrop 2000 (Thermo Fisher Scientific) and 2100 Bioanalyzer (Agilent Technologies). cDNA was synthesized using approximately 0.5 μg of RNA and PrimeScript RT Master Mix (Aidlab Biotechnologies Co., Ltd., Changsha, China). qRT-PCR was performed for each sample using a Bio-Rad CFX96 Touch Detection System (Hercules, CA, USA) and SYBR Green PCR Master Mix (Aidlab Biotechnologies Co., Ltd.). Primers for the qRT-PCR experiments (Table 1) were designed using NCBI, and eight glufosinate resistance-related genes were analyzed. We used a qRT-PCR system and procedure developed using the SYBR Green PCR Master Mix Kit (Aidlab Biotechnologies Co., Ltd.). After PCR amplification, quantitative changes in each gene were analyzed using the delta Ct method (Livak and Schmittgen, 2001).
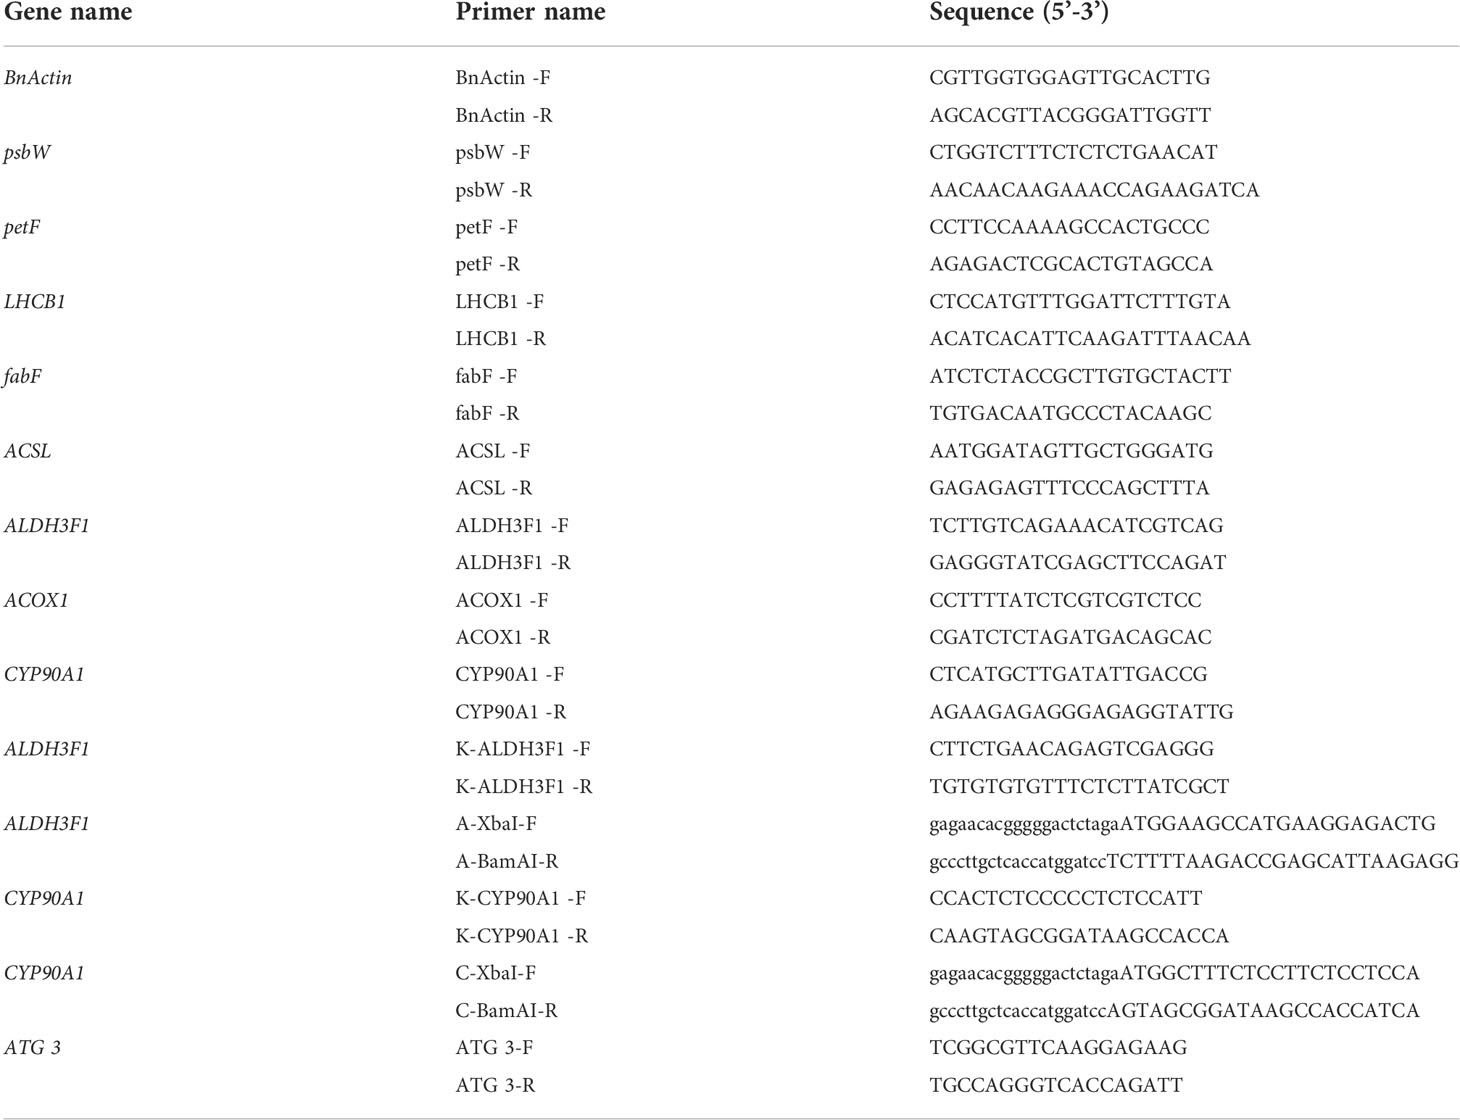
Table 1 Primer sequences.
2.2.5 Gene function verification
2.2.5.1 Gene cloning and construction of overexpression vector
RNA was extracted using the TransZol Up Plus RNA kit. First-strand cDNA was synthesized from 1 μg of RNA using a Maxima H Minus First-Strand cDNA Synthesis Mix Kit (Thermo Fisher Scientific) according to the manufacturer’s instructions. Synthetic cDNA was used to amplify the coding sequences of ALDH3F1 and CYP90A1 with the primers listed in Table 1. The amplified product was detected using 1% agarose gel electrophoresis and 0.1% GelRed nucleic acid gel staining, inserted into the PEASY vector (TransGen Biotech), and verified by sequencing. The ALDH3F1 and CYP90A1 sequences were inserted into the XbaI and BamHI restriction sites of the vector PBI121 to construct recombinant plasmids. The ALDH3F1-PBI121 and CYP90A1-PBI121 recombinant plasmids were introduced into Agrobacterium tumefaciens strain LBA4404 to overexpress Brassica napus (Zhongshuang 11).
2.2.5.2 Agrobacterium-mediated transformation of Zhongshuang 11
Rape hypocotyls were obtained and transformed as described by Eva et al. (2011). The explants were subcultured in the medium every 15 days. Selected green calli were transferred to induction medium. After two months, the selected shoots were transferred to the rooting medium. The medium formulation was prepared as described by Baskar et al. (2016).
2.2.5.3 Gene function verification
To verify ALDH3F1 and CYP90A1 genes function, glufosinate (2000× solution) was applied to the unfolded leaves of each rape seedling as described by Cui et al. (2016) with some modifications. Leaf performance was observed on day 7, after which the leaves were collected for qRT-PCR analysis.
2.3 Statistical analysis
Microsoft Excel 2010 software (Redmond, WA, USA) was used to sort data. All experimental data are presented as the average of three independent biological replicates. Data were analyzed by one-way analysis of variance using SPSS software (version 22.0; SPSS, Inc., Chicago, IL, USA). Different letters indicate significantly different means within the same group (p < 0.05, Duncan’s multiple range test).
3 Results
3.1 Optimum conditions for brassinolide processing
Seeds from B. napus (Fanming No. 1) were soaked in brassinolide solution or water indoors (approximately 25°C). The effect of the soaking time on the germination rate is shown in Table 2. Soaking in 0.015% brassinolide for 6 h showed the better than other treatments.
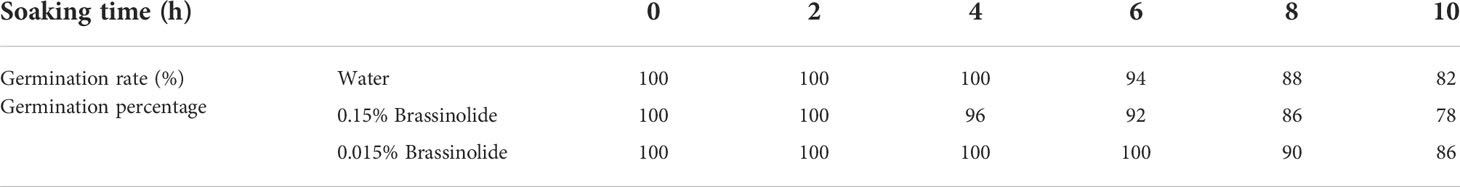
Table 2 The soaking time test of brassinolide.
Herbicide spraying was performed at the 4–5 leaf stage (early November) of Fanming No. 1. The plants showed similar growth under different treatments, namely, A (blank control) and B (brassinolide treatment). The growth of rapeseed in group C (brassinolide treatment and herbicide glufosinate-ammonium treatment) was strongly affected, with the leaves turning yellow and continuing to grow after 13 days (Figure 1). Group D plants (brassinolide and herbicide glyphosate treatments) withered on day 13 and died on the day after glyphosate treatment. In group E (herbicide glufosinate-ammonium treatment), after glufosinate treatment, the whole plant turned yellow on day 7 and died on this day. These results demonstrate that soaking of Fanming No. 1 seeds in brassinolide improved the resistance of seedlings to glufosinate.
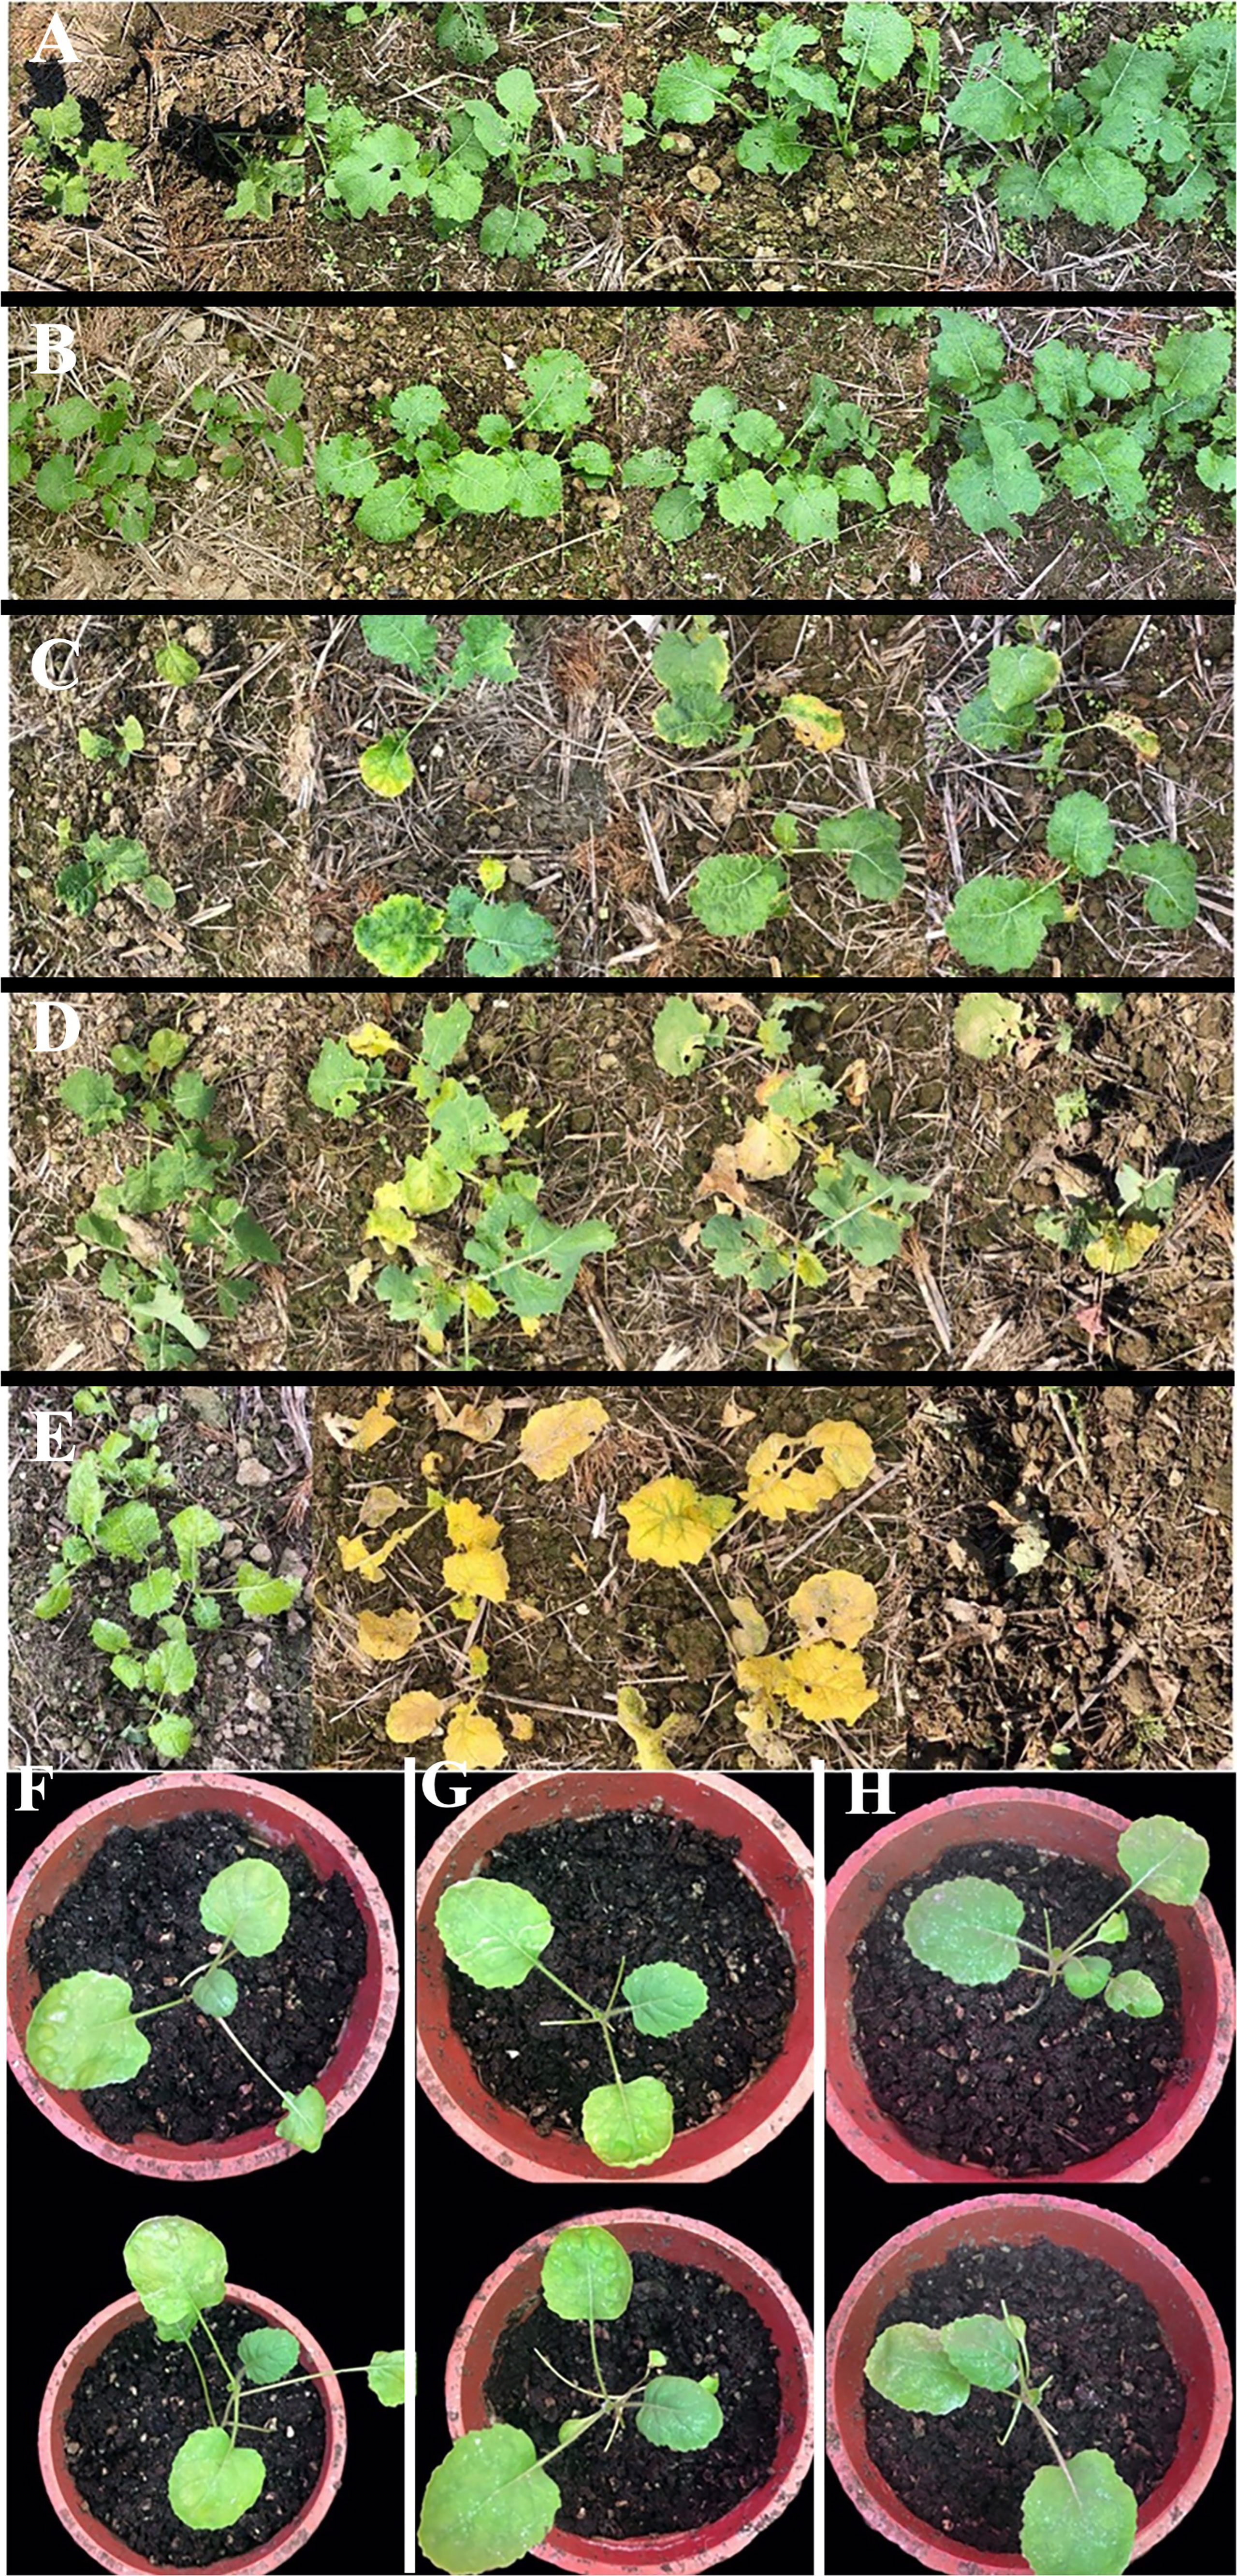
Figure 1 Brassica napus under different treatments. (A) water treatment, (B) 0.015% brassinolide treatment, (C) 0.015% brassinolide treatment and glufosinate-ammonium dilution ratio of 400× treatment, (D) 0.015% brassinolide treatment and glyphosate dilution ratio of 400× treatment, and (E) water treatment and dilution ratio of 400× glufosinate-ammonium treatment. (A–E) Performance of Fanming No. 1 under different treatments at 0, 7, 10, and 13 days after herbicide treatment. (F–H) Brassica napus, ALDH3F1 transgenic B napus, and CYP90A1 transgenic B napus, respectively; day 7 after smearing the leaves with 2000X glufosinate solution.
3.2 Effect of brassinolide treatment on Fanming No. 1
3.2.1 Analysis of physiological and biochemical indices of Fanming No. 1
The physiological and biochemical indicators of CK1 (blank control), CK2 (brassinolide treatment only), and A2 (brassinolide treatment followed by glufosinate treatment) leaves at different growth stages were measured. The results showed that the catalase activity (Figure 2G), SOD activity (Figure 2E), soluble sugar content (Figure 2C), and malondialdehyde content (Figure 2A) after A2 treatment were significantly higher than those of the control at the seedling stage. After entering the 5–6 leaf period, the content of soluble substances in the A2 treatment group increased and was significantly higher than that in the control group. The contents of soluble sugar and soluble protein (Figure 2B) first increased and then decreased, and the content of soluble sugar in the A2 treatment group was highest in the initial bloom stage, whereas the highest soluble protein content was observed in the full bloom stage. Peroxidase activity (Figure 2F) and SOD activity in the A2 treatment group were highest at the bud stage and were significantly higher than those in the control group. The chlorophyll content (Figure 2D) was higher in the CK2 treatment group than in the other treatments, except for at the 5–6 leaf periods and at days 26 and 31 of pod growth.
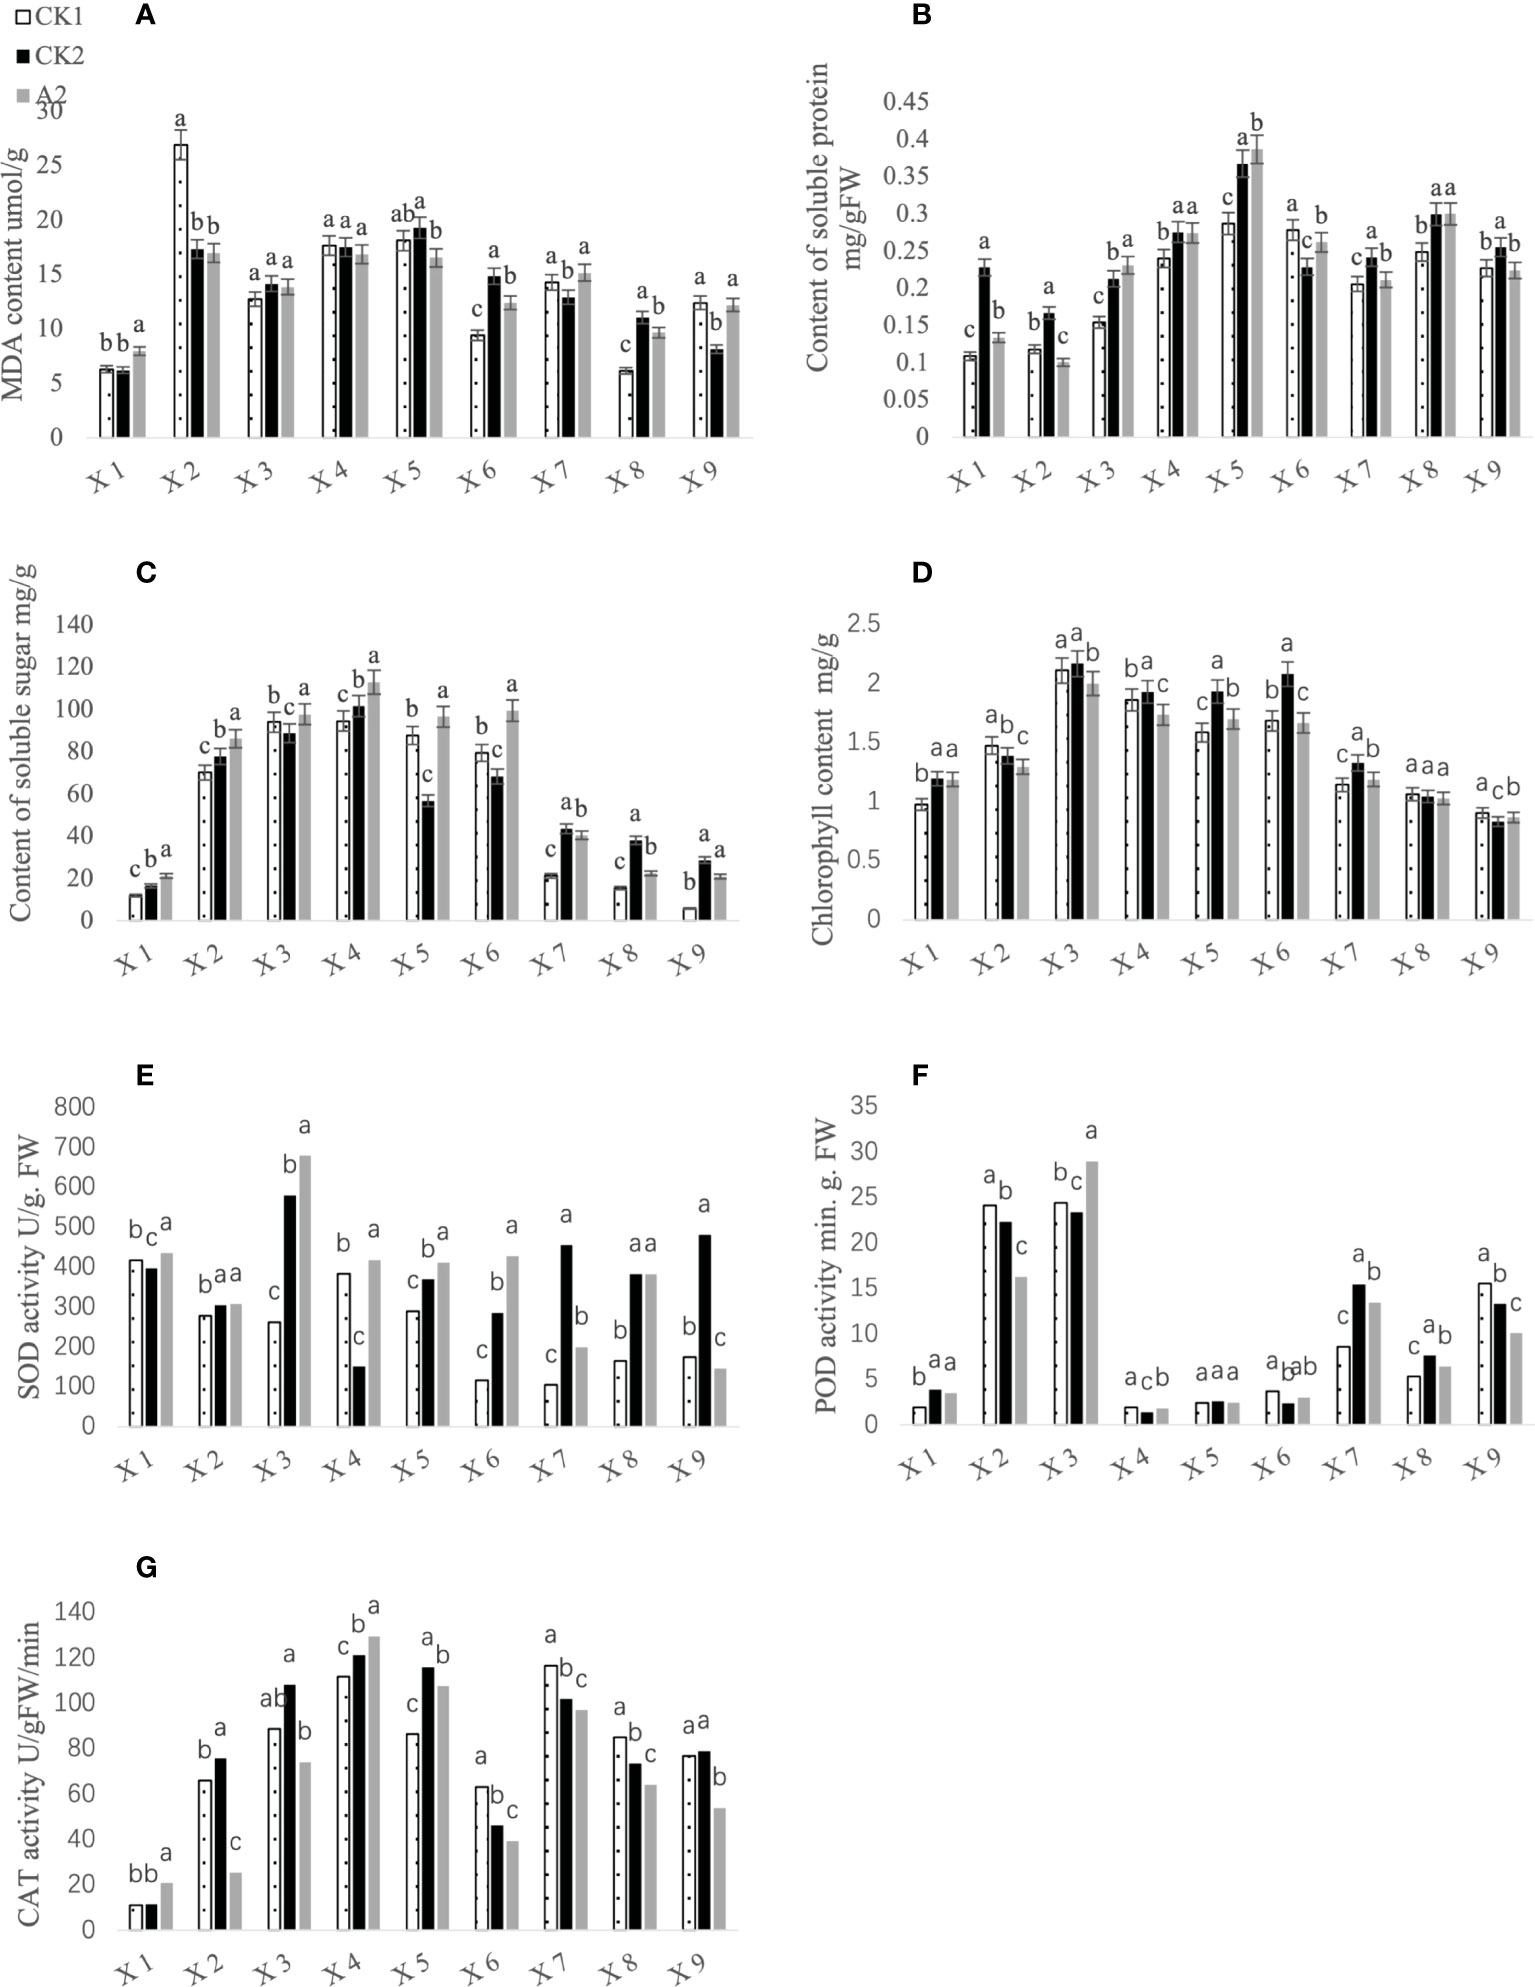
Figure 2 Effects of different treatments on physiological and biochemical indices of Fanming No. 1 leaves. X1–X9 represent the seedling period, 5–6-leaf period, bud stage, initial bloom stage, full bloom stage, final bloom stage, day 21 of pod growth, day 26 of pod growth, and day 31 of pod growth, respectively. (A–G) represents MDA content, Content of soluble protein, Content of soluble protein, Content of soluble sugar, Chlorophyll content, SOD activity, POD activity and CAT activity, respectively. Different letters indicate significant differences (p < 0.05).
3.2.2 Analysis of agronomic character index of Fanming No. 1
The results of the prewinter survey are shown in Table 3. Except for the largest leaf length, the growth of Fanming No. 1 under A2 treatment was poor, followed by CK2 and CK1 treatments. These results indicate that brassinolide treatment alleviated the effects of glufosinate. Table 4 shows the growth status of Fanming No. 1 at the maturity stage of different treatments, CK2 outperforms both CK1 and A2 treatments in terms of plant height (cm), primary effective branch site (cm), effective length of the main inflorescence (cm), number of effective branches at a time, number of effective pods on the main inflorescence, and grain weight per plant (g). The number of effective pods in the whole plant of the A2 treatment group was higher than that in the CK1 and CK2 groups, and the pod length and seed number per plant of the CK1 treatment pods were larger than those in the CK2 and A2 groups.
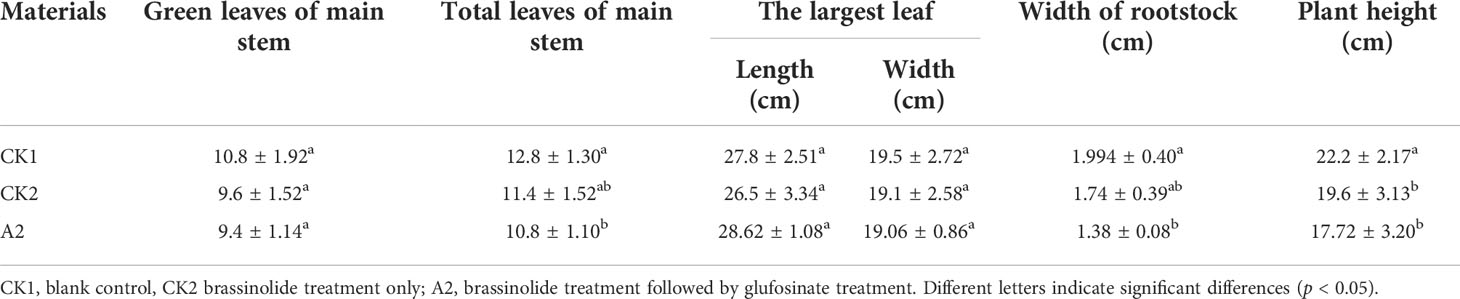
Table 3 The growth status of rapeseed seedlings under different treatments before winter.
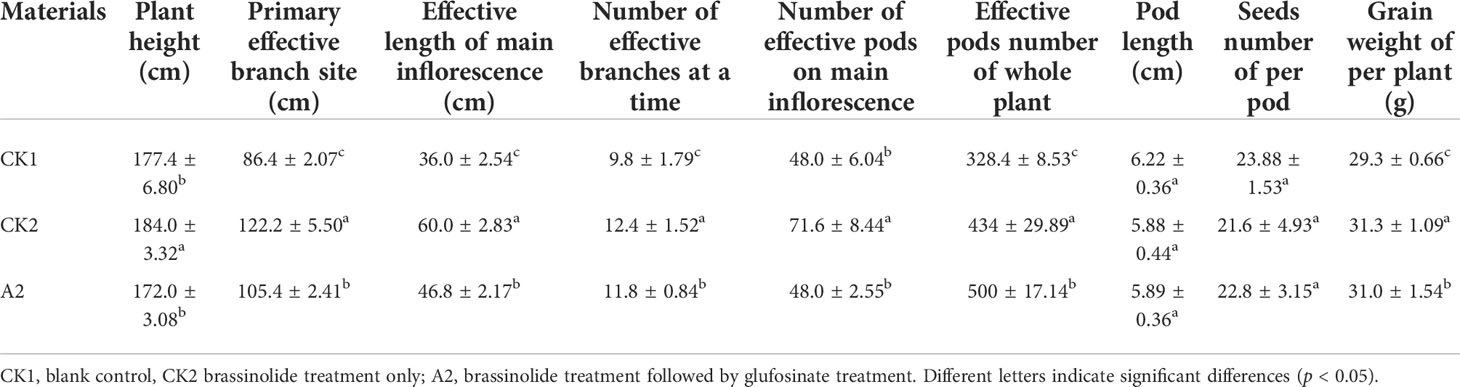
Table 4 Analysis of agronomic characters of Fanming No. 1 under different treatments.
3.2.3 Analysis of disease resistance of Fanming No. 1
The disease survey results; disease index. As shown in Table 5, CK2 had the lowest disease index (<7.5) and incidence (<15%), followed by A2, whereas CK1 had the highest. These results indicate that CK2 had stronger resistance to sclerotinia and that brassinolide improves the disease resistance of Fanming No. 1.
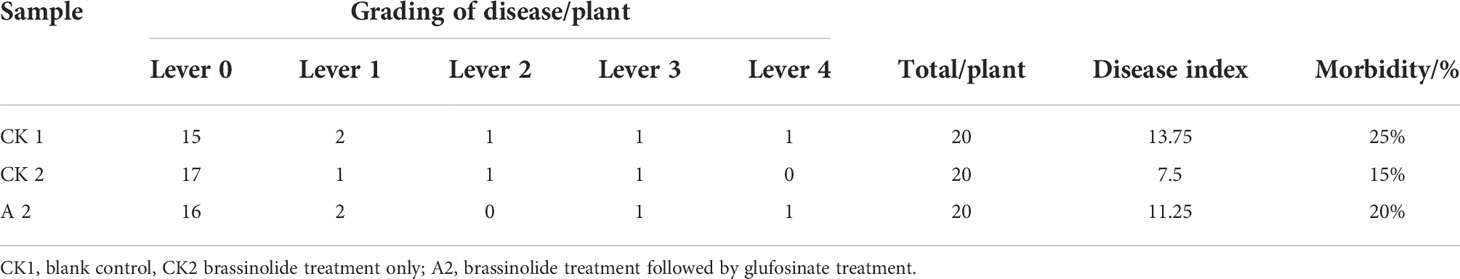
Table 5 Disease survey results.
3.2.4 ATG3 expression analysis
The expression level of ATG3 in Fanming No. 1 different treatment groups and at different periods was measured. As shown in Figure 3A, both CK2 and A2 treatments showed upregulated ATG3 expression 7, 10, and 13 days after herbicide treatment, with the highest ATG3 expression observed after CK 2 and A2 treatment in the first period. These results indicate that brassinolide treatment improved the resistance of Fanming No. 1 to sclerotinia disease. Furthermore, in transgenic seedlings overexpressing ALDH3F1 and CYP90A1, the expression of ATG3 was 3.39–6.11- and 2.29–3.13-fold higher than that in the control (Figure 3B), respectively.
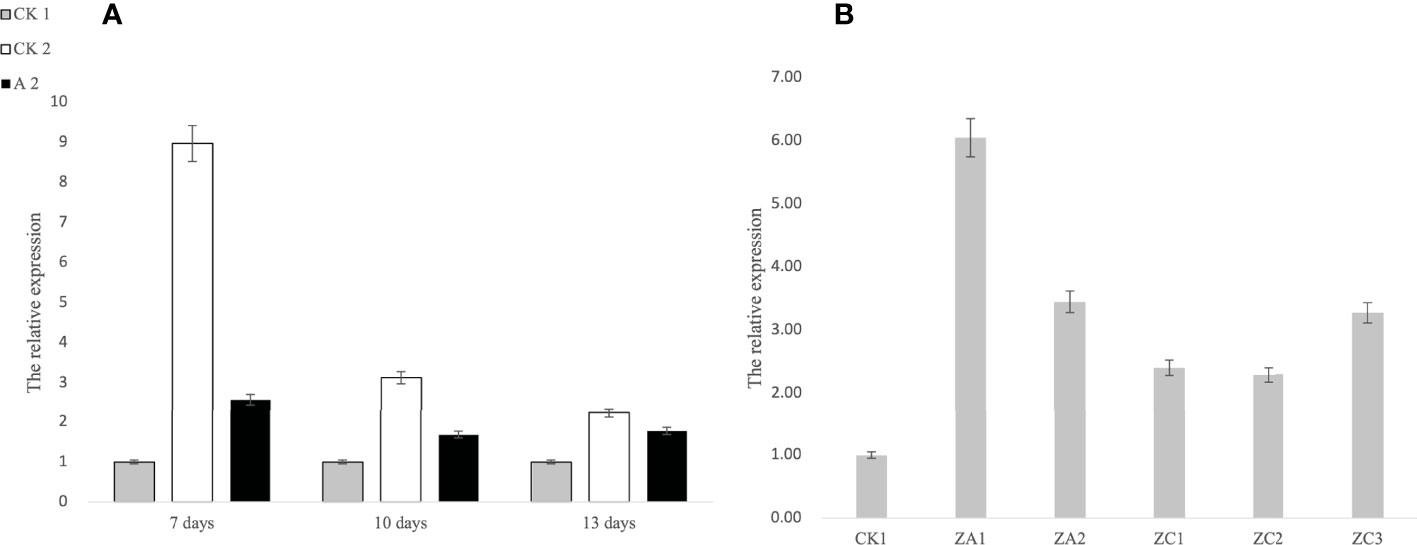
Figure 3 Expression levels of ATG3 at different stages under different treatments in Brassica napus. (A) 1–3 correspond to 7, 10, and 13 days after herbicide treatment, respectively; (B) CK1 is the control, ZA1 and ZA2 are the ALDH3F1 transgenic rape specimens, and ZC1–ZC3 are the CYP90A1 transgenic rape specimens.
3.3 Differential gene screening
3.3.1 Transcriptome analysis of seedlings
3.3.1.1 Sequencing quality statistics
The leaves of glufosinate-treated Fanming No. 1 plants on day 7 after treatment and leaves of control plants were collected to extract RNA and evaluate RNA quality. The RNA integrity number values of extracted RNA after each treatment were higher, with an OD260/280 and OD260/230 >2. The samples were sequenced and the sequencing data were further filtered. The contents of Q20, Q30, clean reads, and clean data were >90% (Table 6), indicating that the sequencing results were reliable. The upgraded version of HISAT2 (http://ccb.jhu.edu/software/hisat2/index.shtml) software of TopHat2 was used to align the filtered reads to the reference genome; >90% of the total reads were mapped (Table 6), indicating that the reference genome was selected appropriately and was free of contamination.
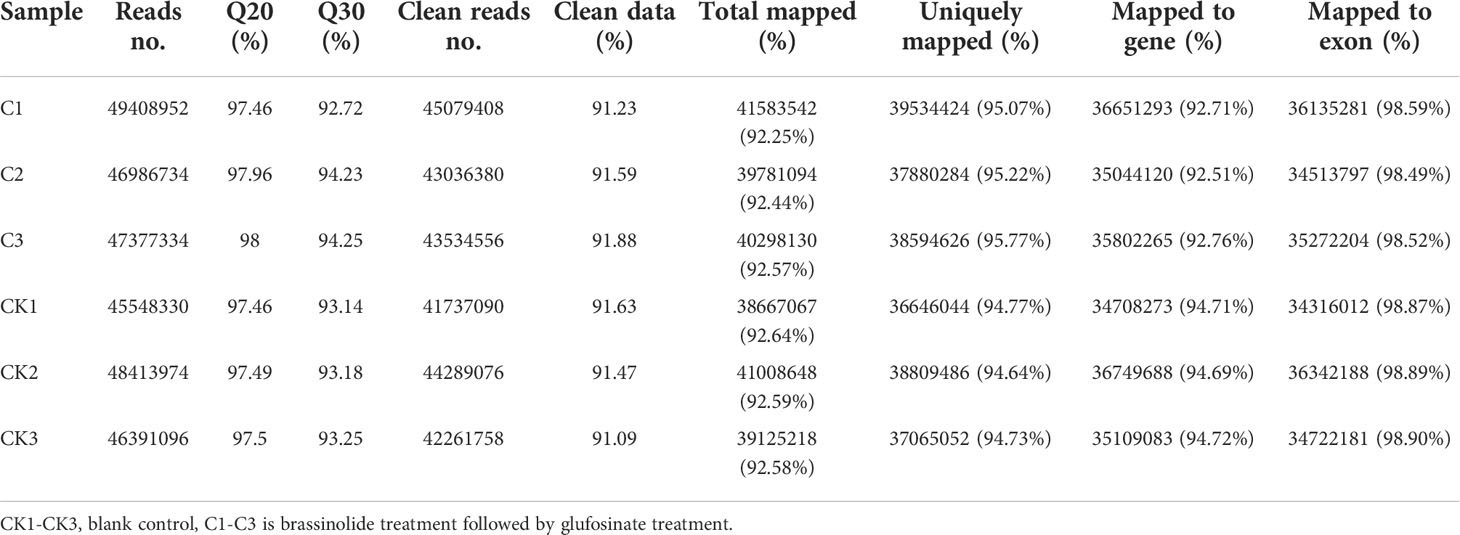
Table 6 Assessment of library quality and analysis of comparison results.
3.3.1.2 Analysis of expression differences
The R language Pheatmap software package was used to perform bidirectional clustering analysis on the union for cluster and samples with differentially expressed genes (DEGs) in each group. The expression of the evaluated genes differed, as shown in Figure 4.
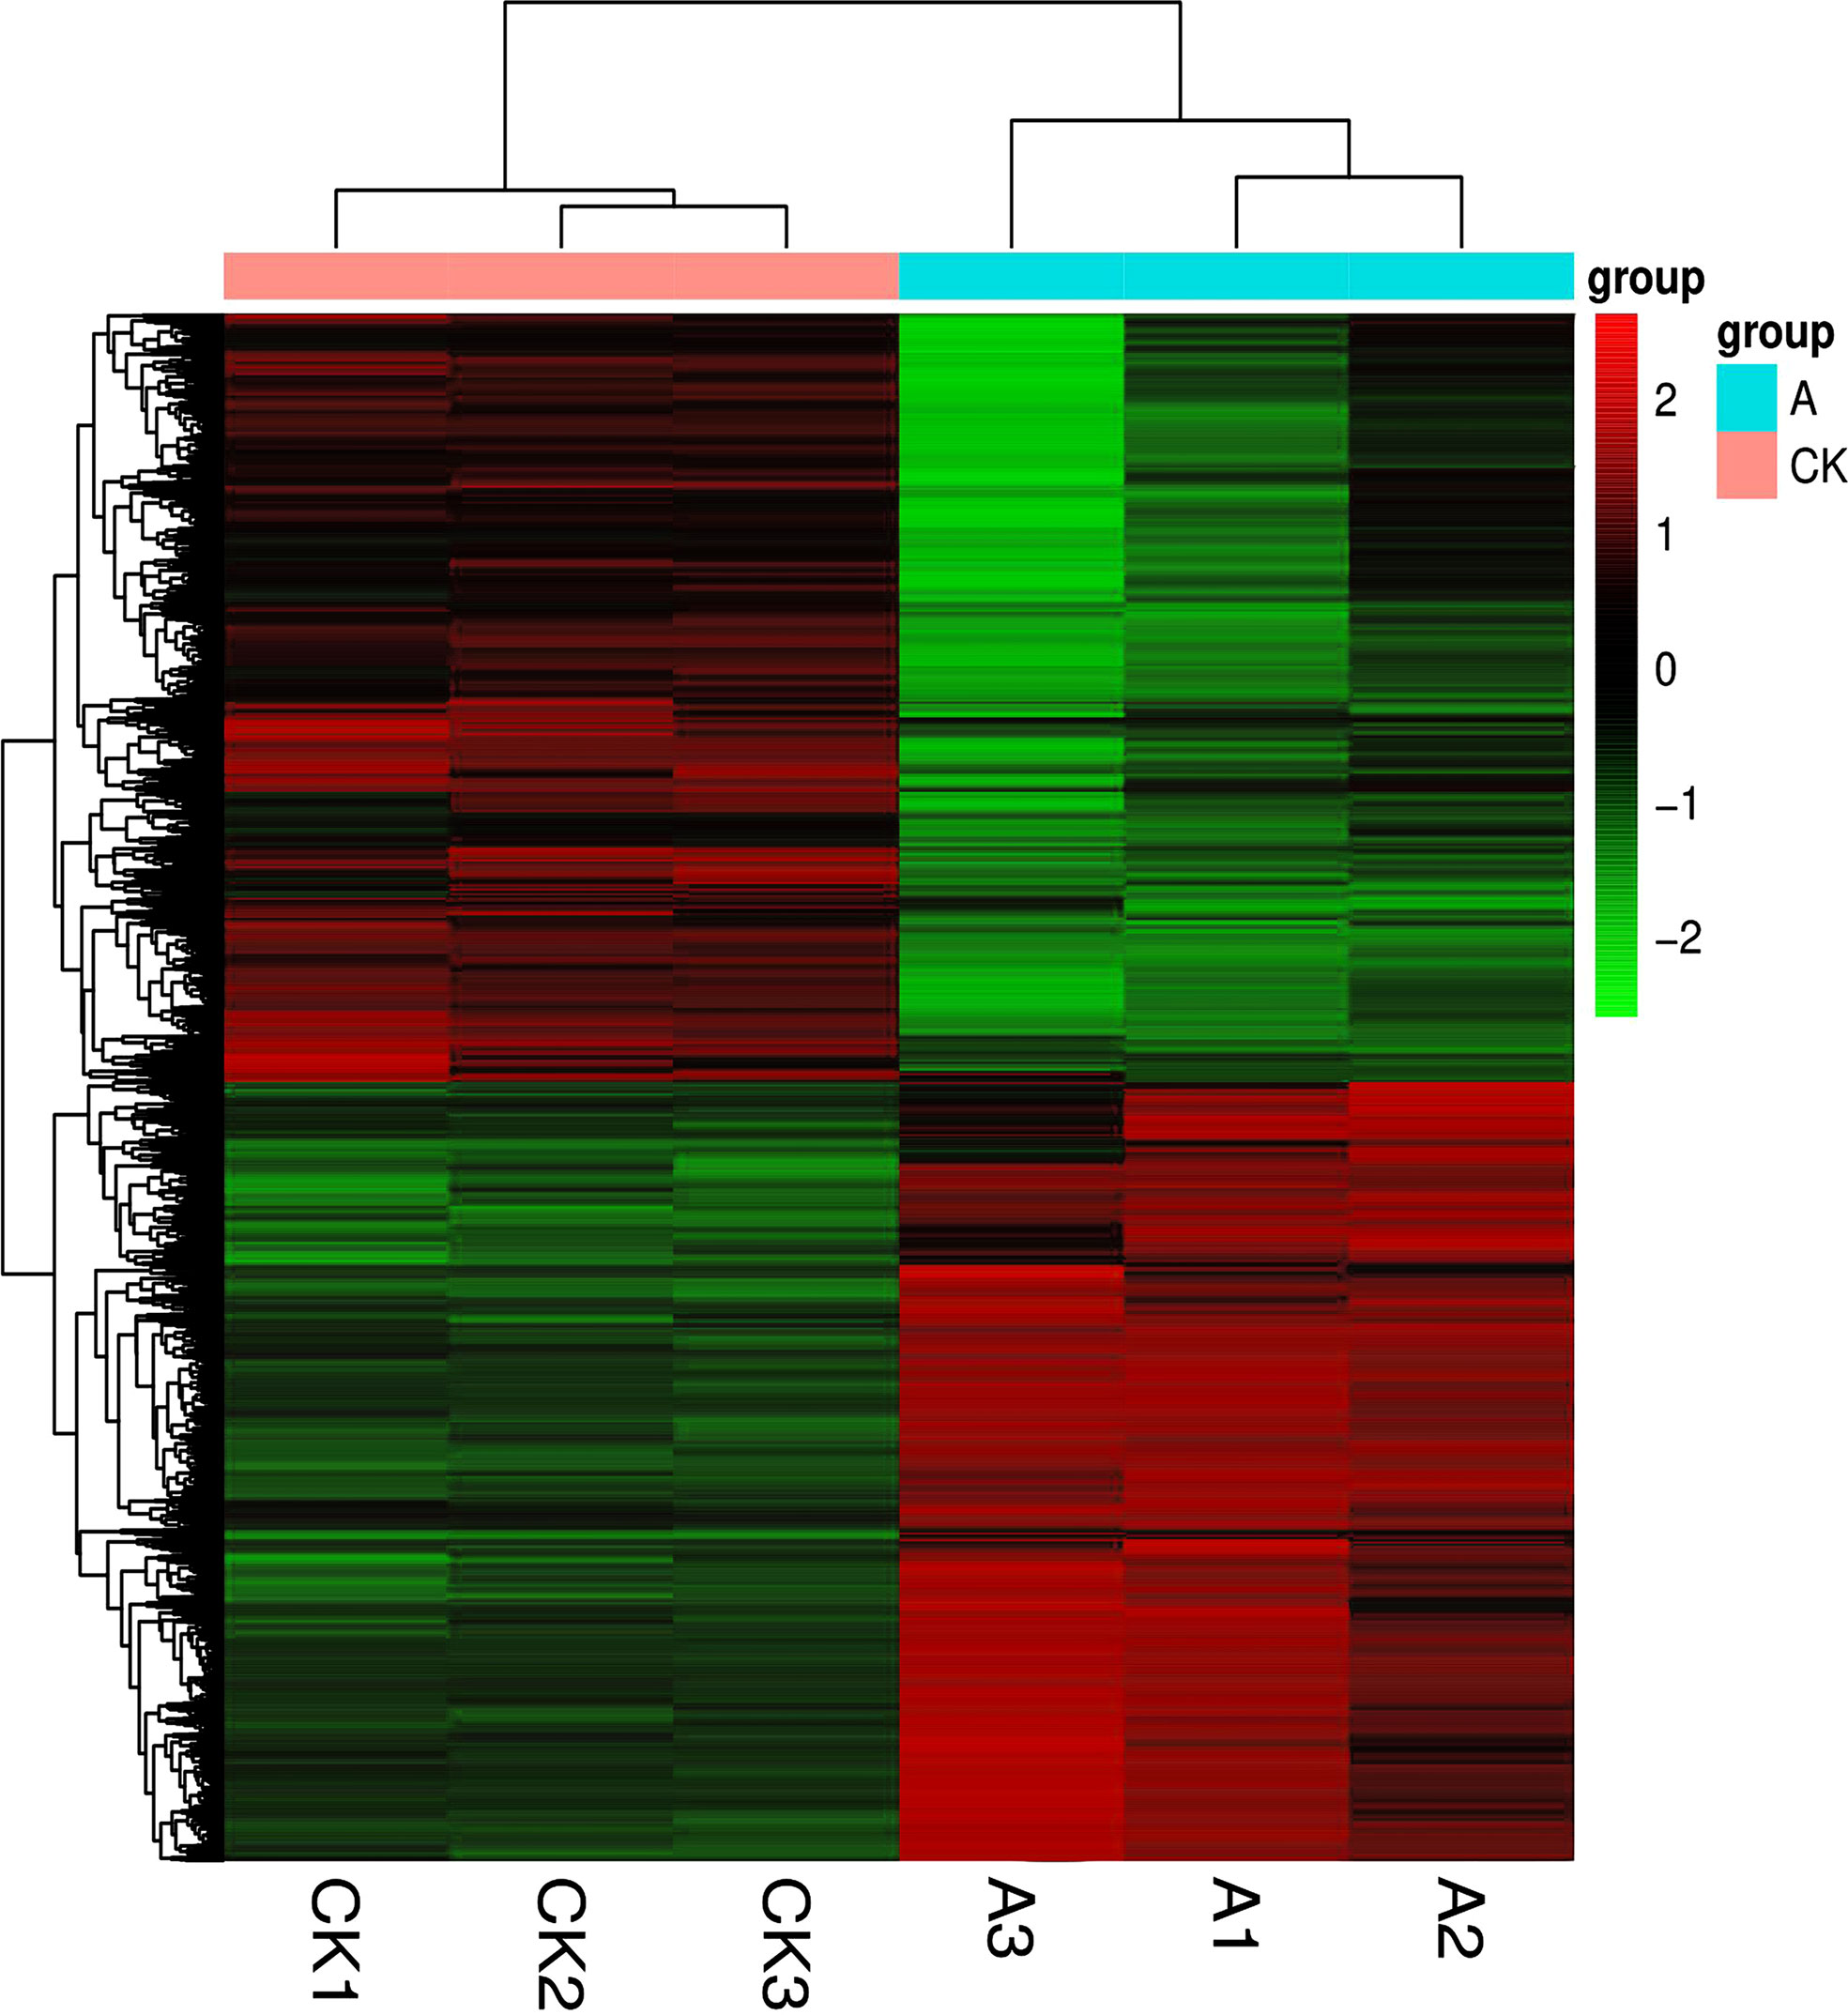
Figure 4 Clustering of differentially expressed genes. The horizontal direction represents genes; each column is a sample; red indicates highly expressed genes, and green indicates low gene expression.
3.3.2 Analysis of functional enrichment of DEGs
3.3.2.1 Gene Ontology enrichment analysis
Gene Ontology (GO) enrichment analysis showed that the DEGs were mainly enriched in metabolic pathways, such as the photosynthetic membrane (135 DEGs), photosystem (122 DEGs), thylakoid (137 DEGs), thylakoid part (137 DEGs), photosynthesis (146 DEGs), and cellular biosynthetic processe (1692 DEGs) (Figure 5). Glufosinate mainly affected the photosynthesis and cell growth of B. napus.

Figure 5 Histogram of Gene Ontology (GO) enrichment analysis (CC, cell components; MF, molecular functions; BP, biological processes). C1–C10 represent GO:0034357 photosynthetic membrane, GO:0009521 photosystem, GO:0009579 thylakoid, GO:0044436 thylakoid part, GO:0009523 photosystem II, GO:0042651 thylakoid membrane, GO:0009654 photosystem II evolving oxygen complex, GO:0005840 ribosome, GO:1990204 oxidoreductase complex and GO:0030529 intracellular ribonucleoprotein complex; M1–M10 respectively GO:0005198 structural molecule activity, GO:0003735 structural constituent of ribosome, GO:0003824 catalytic activity, GO:0036094 small molecule binding, GO:0004713 protein tyrosine kinase activity, GO:0000166 nucleotide binding, GO:1901265 nucleoside phosphate binding, GO:0043168 anion binding, GO:0004674 protein serine/threonine kinase activity and GO:0016740 transferase activity; B1–B10 represent GO:0015979 photosynthesis, GO:0044249 cellular biosynthetic process, GO:1901576 organic substance biosynthetic process, GO:0009058 biosynthetic process, GO:0044237 cellular metabolic process, GO:1901566 organonitrogen compound biosynthetic process, GO:0009987 cellular process, GO:0044271 cellular nitrogen compound biosynthetic process, GO:0008152 metabolic process, GO:0043043 peptide biosynthetic process.
3.3.2.2 Kyoto Encyclopedia of Genes and Genomes enrichment analysis
According to Kyoto Encyclopedia of Genes and Genomes enrichment analysis of the DEGs, 121 metabolic pathways showed differences, among which 40 showed the p-value below a specific threshold and false discovery rate <0.3. These pathways were mainly divided into lipid metabolism (9), amino acid metabolism (8), carbohydrate metabolism (5), cofactor and vitamin metabolism (4), other secondary metabolite synthesis (2), signaling (2), nucleotide metabolism (2), folding (2), transport and catabolism (2), energy metabolism (1), other amino acid metabolism (1), terpenoid and polyketide metabolism (1), and glycan biosynthesis and metabolism (1) (Table 7). Amino acid metabolism, secondary metabolite synthesis, energy metabolism, carbohydrate metabolism, lipid metabolism, other amino acid metabolism, and metabolism of terpenoids and polyketides are closely related to growth and development, indicating that soaking of Fanming No. 1 seedlings in brassinolide mainly affected growth and development.
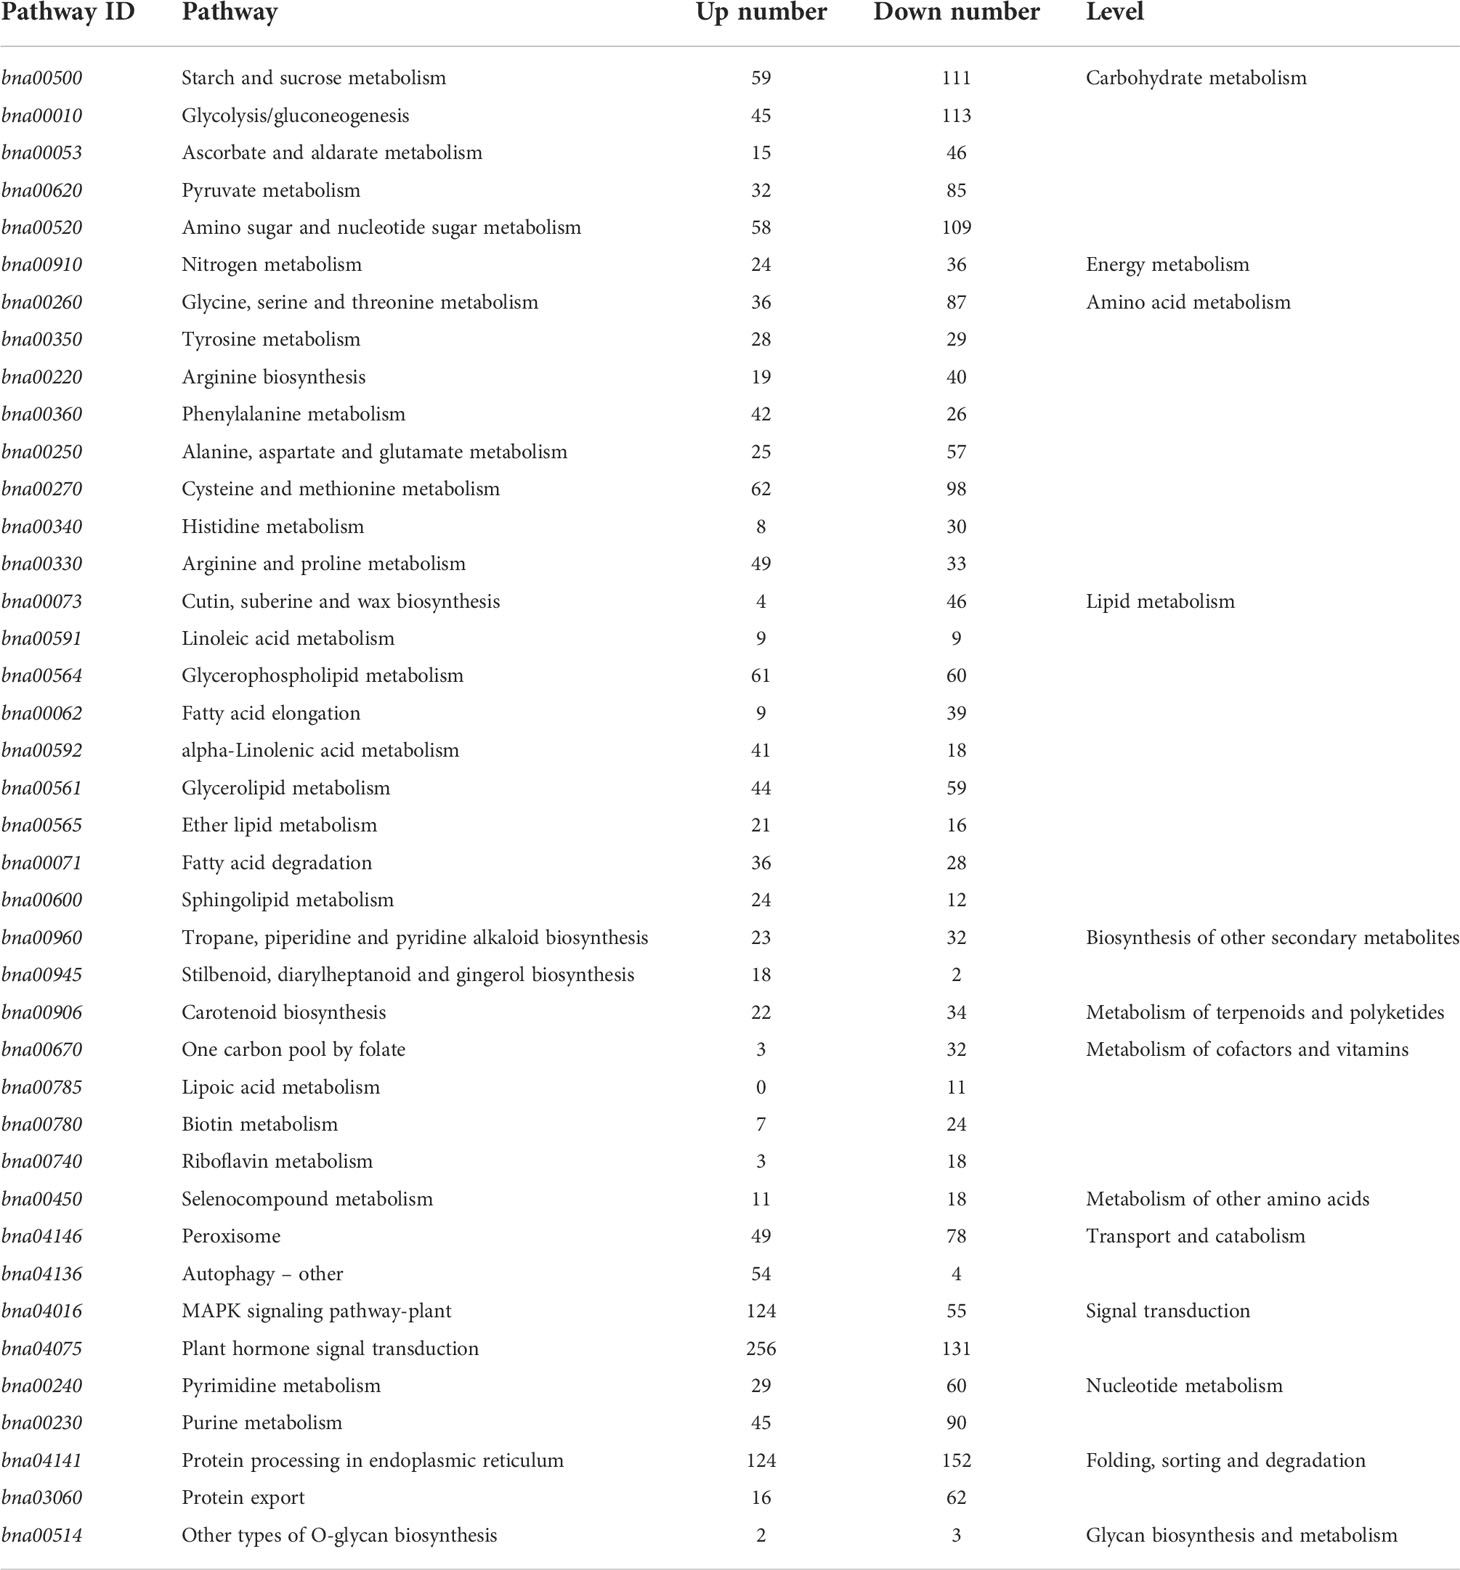
Table 7 Kyoto Encyclopedia of Genes and Genomes enrichment pathway analysis of DEGs.
3.3.3 Glufosinate-related metabolic pathway analysis
We performed GO and Kyoto Encyclopedia of Genes and Genomes pathway enrichment analyses, focusing on DEGs in herbicide-related pathways, including photosynthesis (Song et al., 2020), pyruvate metabolism (Leslie and Baucom, 2014), and amino acid metabolism (Zhao, N. et al., 2017).
3.3.3.1 Photosynthesis
After spraying with glufosinate, nine DEGs were identified in photosystem I, all of which were downregulated. Nine DEGs were identified in photosystem II, of which two genes were upregulated. Seven genes were downregulated in photosystem II. One DEG in the cytochrome b6/f complex was downregulated. There were four DEGs involved in photosynthetic electron transport, with one node gene that was upregulated and three genes that were downregulated. Three F-type ATPases were downregulated (Figure 6).
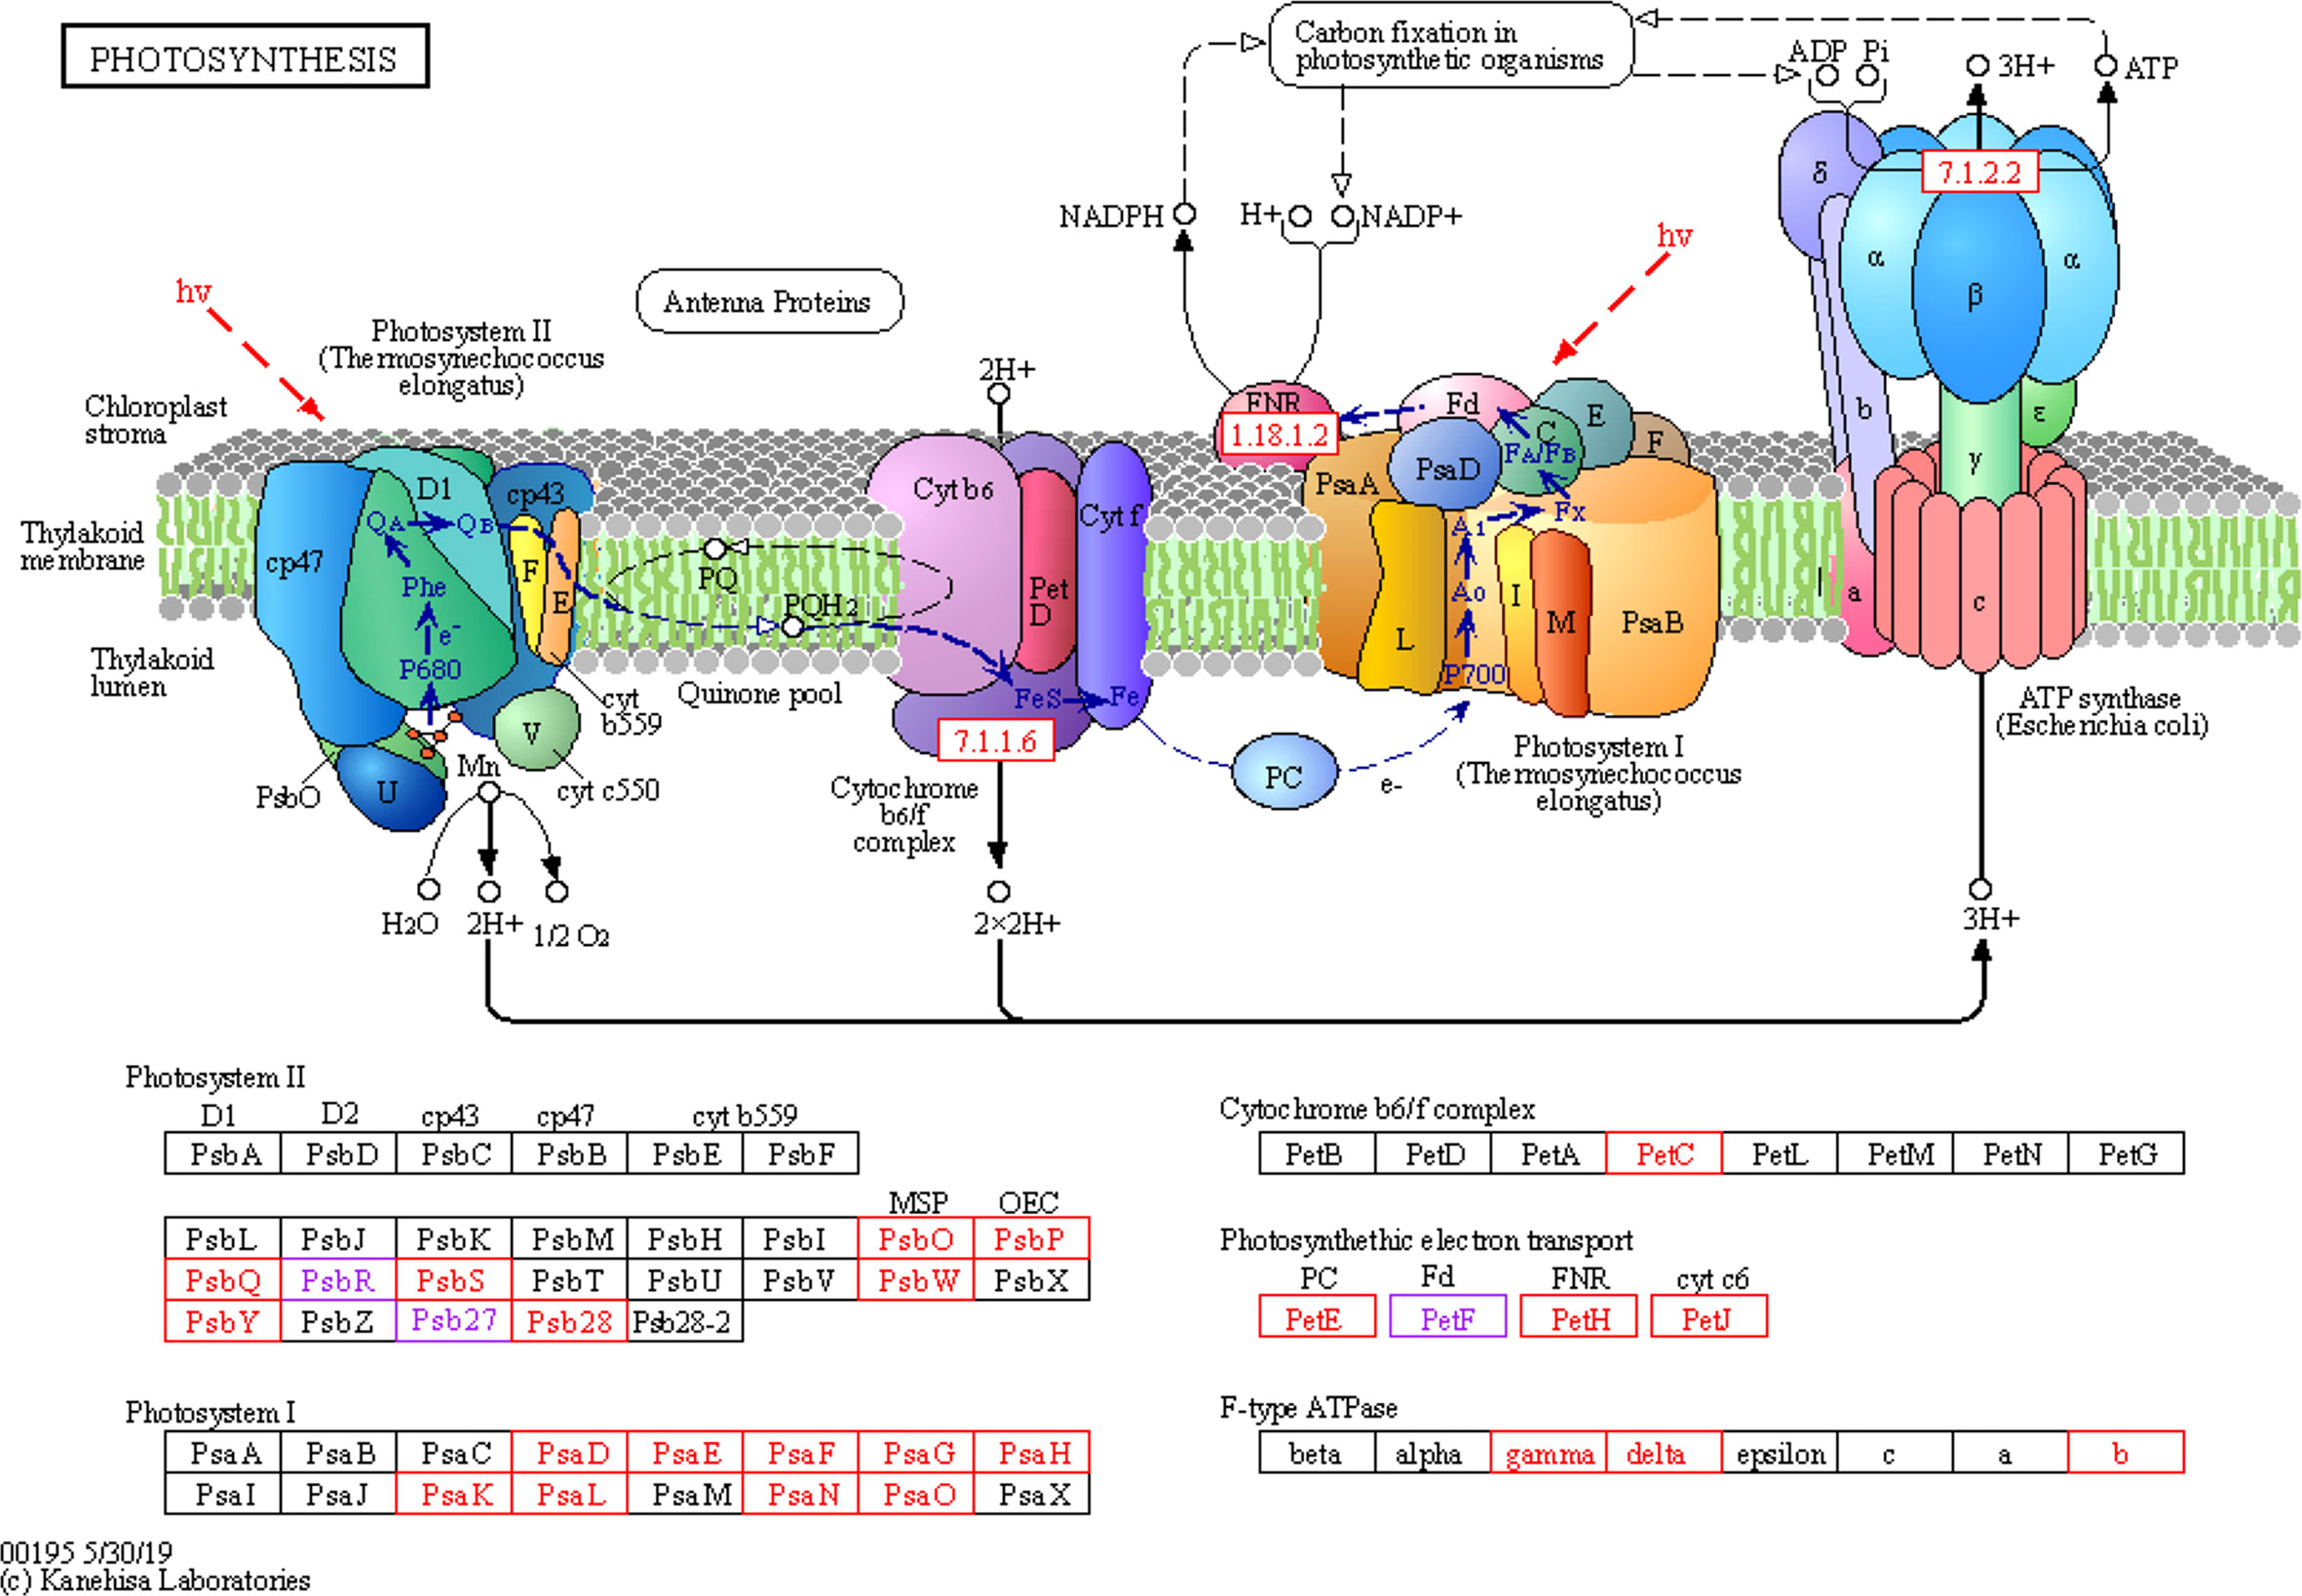
Figure 6 Photosynthesis metabolic pathways involving differentially expressed genes. Photosystem II, photosystem I, cytochrome b6/f complex, photosynthetic electron transport, F-type ATPase, carbon fixation in photosynthetic organisms, chloroplast stroma, thylakoid membrane, and thylakoid lumen.
3.3.3.2 Pyruvate metabolism
EPSP synthase is an enzyme involved in synthesizing aromatic amino acids by catalyzing the reaction of shikimate-3-phosphate and phosphoenolpyruvate to synthesize 5-enolpyruvylshikimate-3-phosphate. After spraying with pesticides, 114 genes in the pyruvate metabolic pathway showed differences in expression levels. Among them, three gene nodes were upregulated, five gene nodes were downregulated, and ten gene nodes were both upregulated and downregulated. Most of these genes are related to EPSP synthase, indicating that glufosinate affects the biosynthesis of pyruvate and leads to changes in EPSP synthase.
3.3.3.3 Amino acid metabolism
After spraying with glufosinate, 669 genes were differentially expressed in amino acid metabolism pathways, including in arginine biosynthesis; tyrosine metabolism; and glycine, serine, and threonine metabolism, of which 269 genes were downregulated and 400 genes were upregulated.
3.4 qRT-PCR analysis of glufosinate resistance-related genes
According to the sequencing results, numerous genes affected glufosinate resistance in Fanming No. 1, including LHCB1 (BnaA05g09410D, Figure 7A), fabF (BnaA06g36060D, Figure 7B), psbW (BnaA04g17660D, Figure 7C), CYP90A1 (BnaA10g24860D, Figure 7D), ALDH3F1 (BnaA03g59170D, Figure 7E), ACOX1 (BnaC08g23150D, Figure 7F), petF (BnaA03g22350D, Figure 7G), and ACSL (BnaC01g15670D, Figure 7H). We collected samples from the CK1 (Figure 1A) and CK2 (Figure 1B), glufosinate-only treatment (death on day 7; Figure 1E), A1 (glyphosate-only treatment, death on day 15, Figure 1D), A2 (survival, Figure 1C), 7 and 10 days after glufosinate treatment, and 13-day groups to determine the expression levels of each gene at different stages.
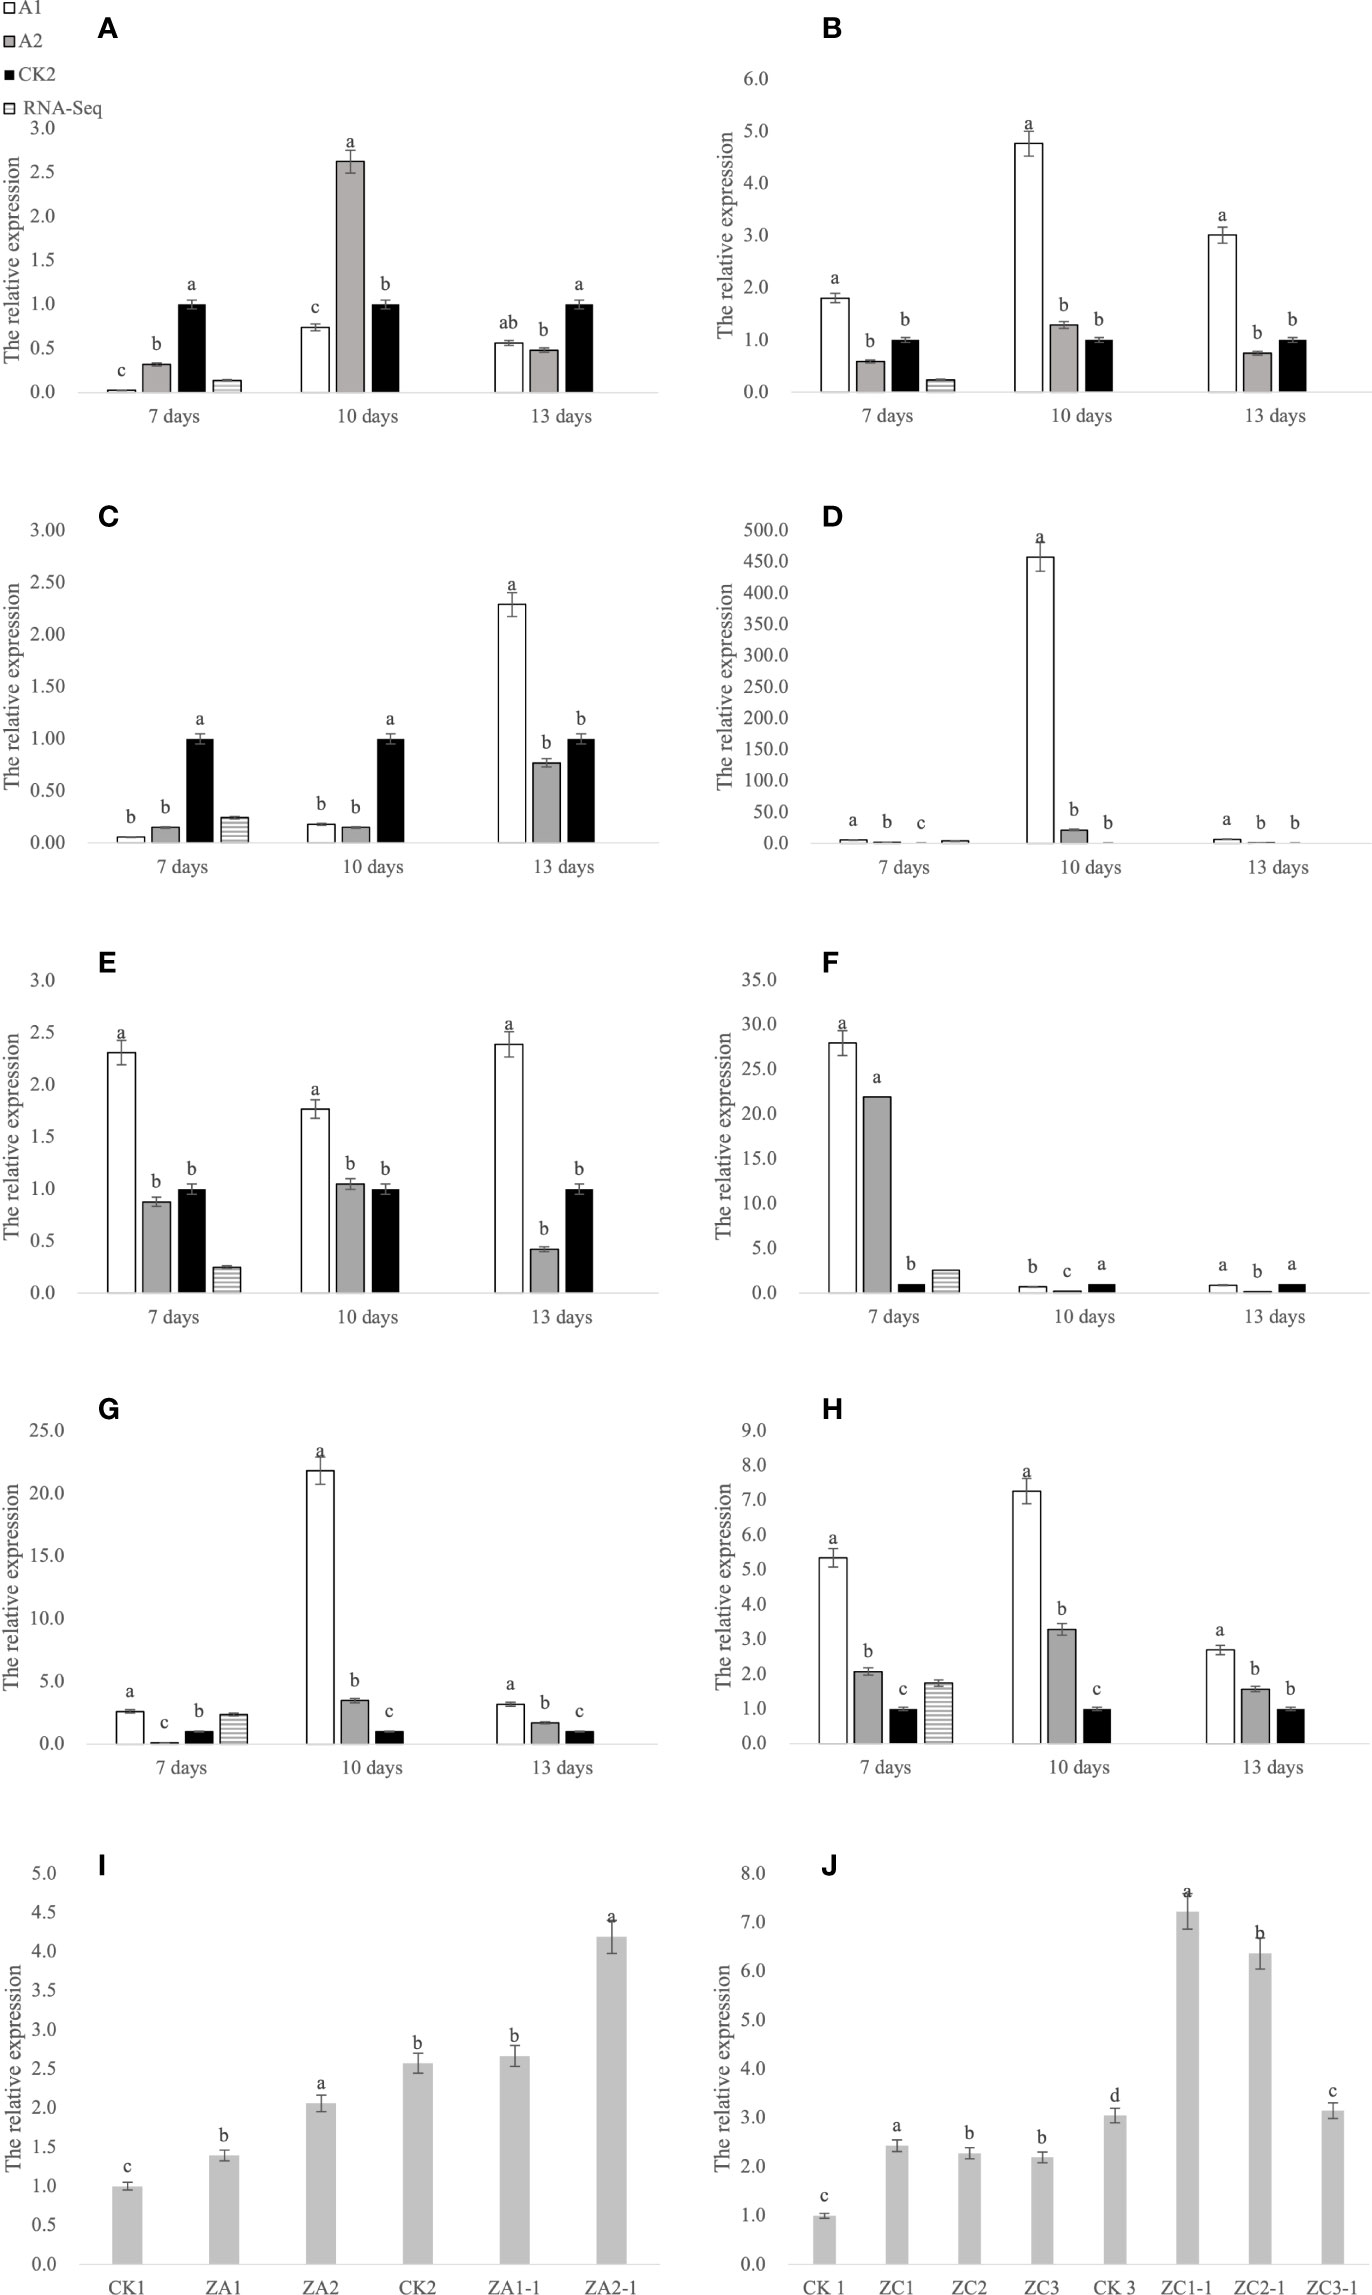
Figure 7 qRT-PCR analysis of genes. (A–H) Gene expression at 7, 10, and 13 days after glufosinate treatment. The relative expression levels of A1 and A2 in the same period were divided by the relative expression levels of CK2, and CK2 was set to 1. (I, J) CK1 is the blank control; CK2 and CK3 are the expression levels of ALDH3F1 and CYP90A1 at 7 days after non-transgenic Brassica napus seedlings were treated with glufosinate-ammonium, respectively; ZA1 and ZA2 are the expression levels of ALDH3F1 in the transgenic ALDH3F1 seedlings; ZC1–ZC3 denote the expression level of CYP90A1 in CYP90A1 transgenic seedlings; and ZA1-1, ZA2-1, and ZC1-1–ZC3-1 denote the expression levels of corresponding genes in transgenic seedlings treated with glufosinate. Different letters indicate significant differences (p < 0.05).
This eight key glufosinate resistance genes were evaluated using qRT-PCR. Figure 7 shows the expression levels of these genes at 7 days after glufosinate treatment. The first period of each graph revealed changes in the expression level of each gene according to qRT-PCR (A2) and RNA-Seq. Figure 6 shows that the trends in the expression levels determined in qRT-PCR and RNA-Seq were highly similar, indicating that the expression data obtained using RNA-Seq are reliable.
3.5 Functional validation of two key differential genes
3.5.1 Agrobacterium-mediated transformation of the hypocotyl of B. napus
Because B. napus died 13 days after treatment following A1 treatment and the specimen in the A2 group turned green 13 days after treatment, gene expression was compared in the two (herbicide) treatment groups. In gene-corresponding protein function analysis, two key genes were identified, CYP90A1 and ALDH3F1. Agrobacterium-mediated hypocotyl transformation was performed to transform the recombinant expression vectors pBI121-CYP90A1 and pBI121-ALDH3F1 into B. napus Zhongshuang 11 to obtain transgenic B. napus plants. DNA was extracted from the transgenic plants for PCR verification and pBI121 was obtained: pBI121-ALDH3F1 (Figure 8A) and pBI121-CYP90A1 (Figure 8B). Next, the expression levels of CYP90A1 and ALDH3F1 in the PCR positive plants were evaluated using qRT-PCR. Under the action of strong promoters, the CYP90A1 expression levels of positive plant ZC1, ZC2 and ZC3 increased by 1.43, 1.27- and 1.19-fold, respectively (Figure 7J). In the control, the ALDH3F1 expression levels of positive plant ZA1 and ZA2 were 1.40- and 2.06-fold as high as those in the control, respectively (Figure 7I).
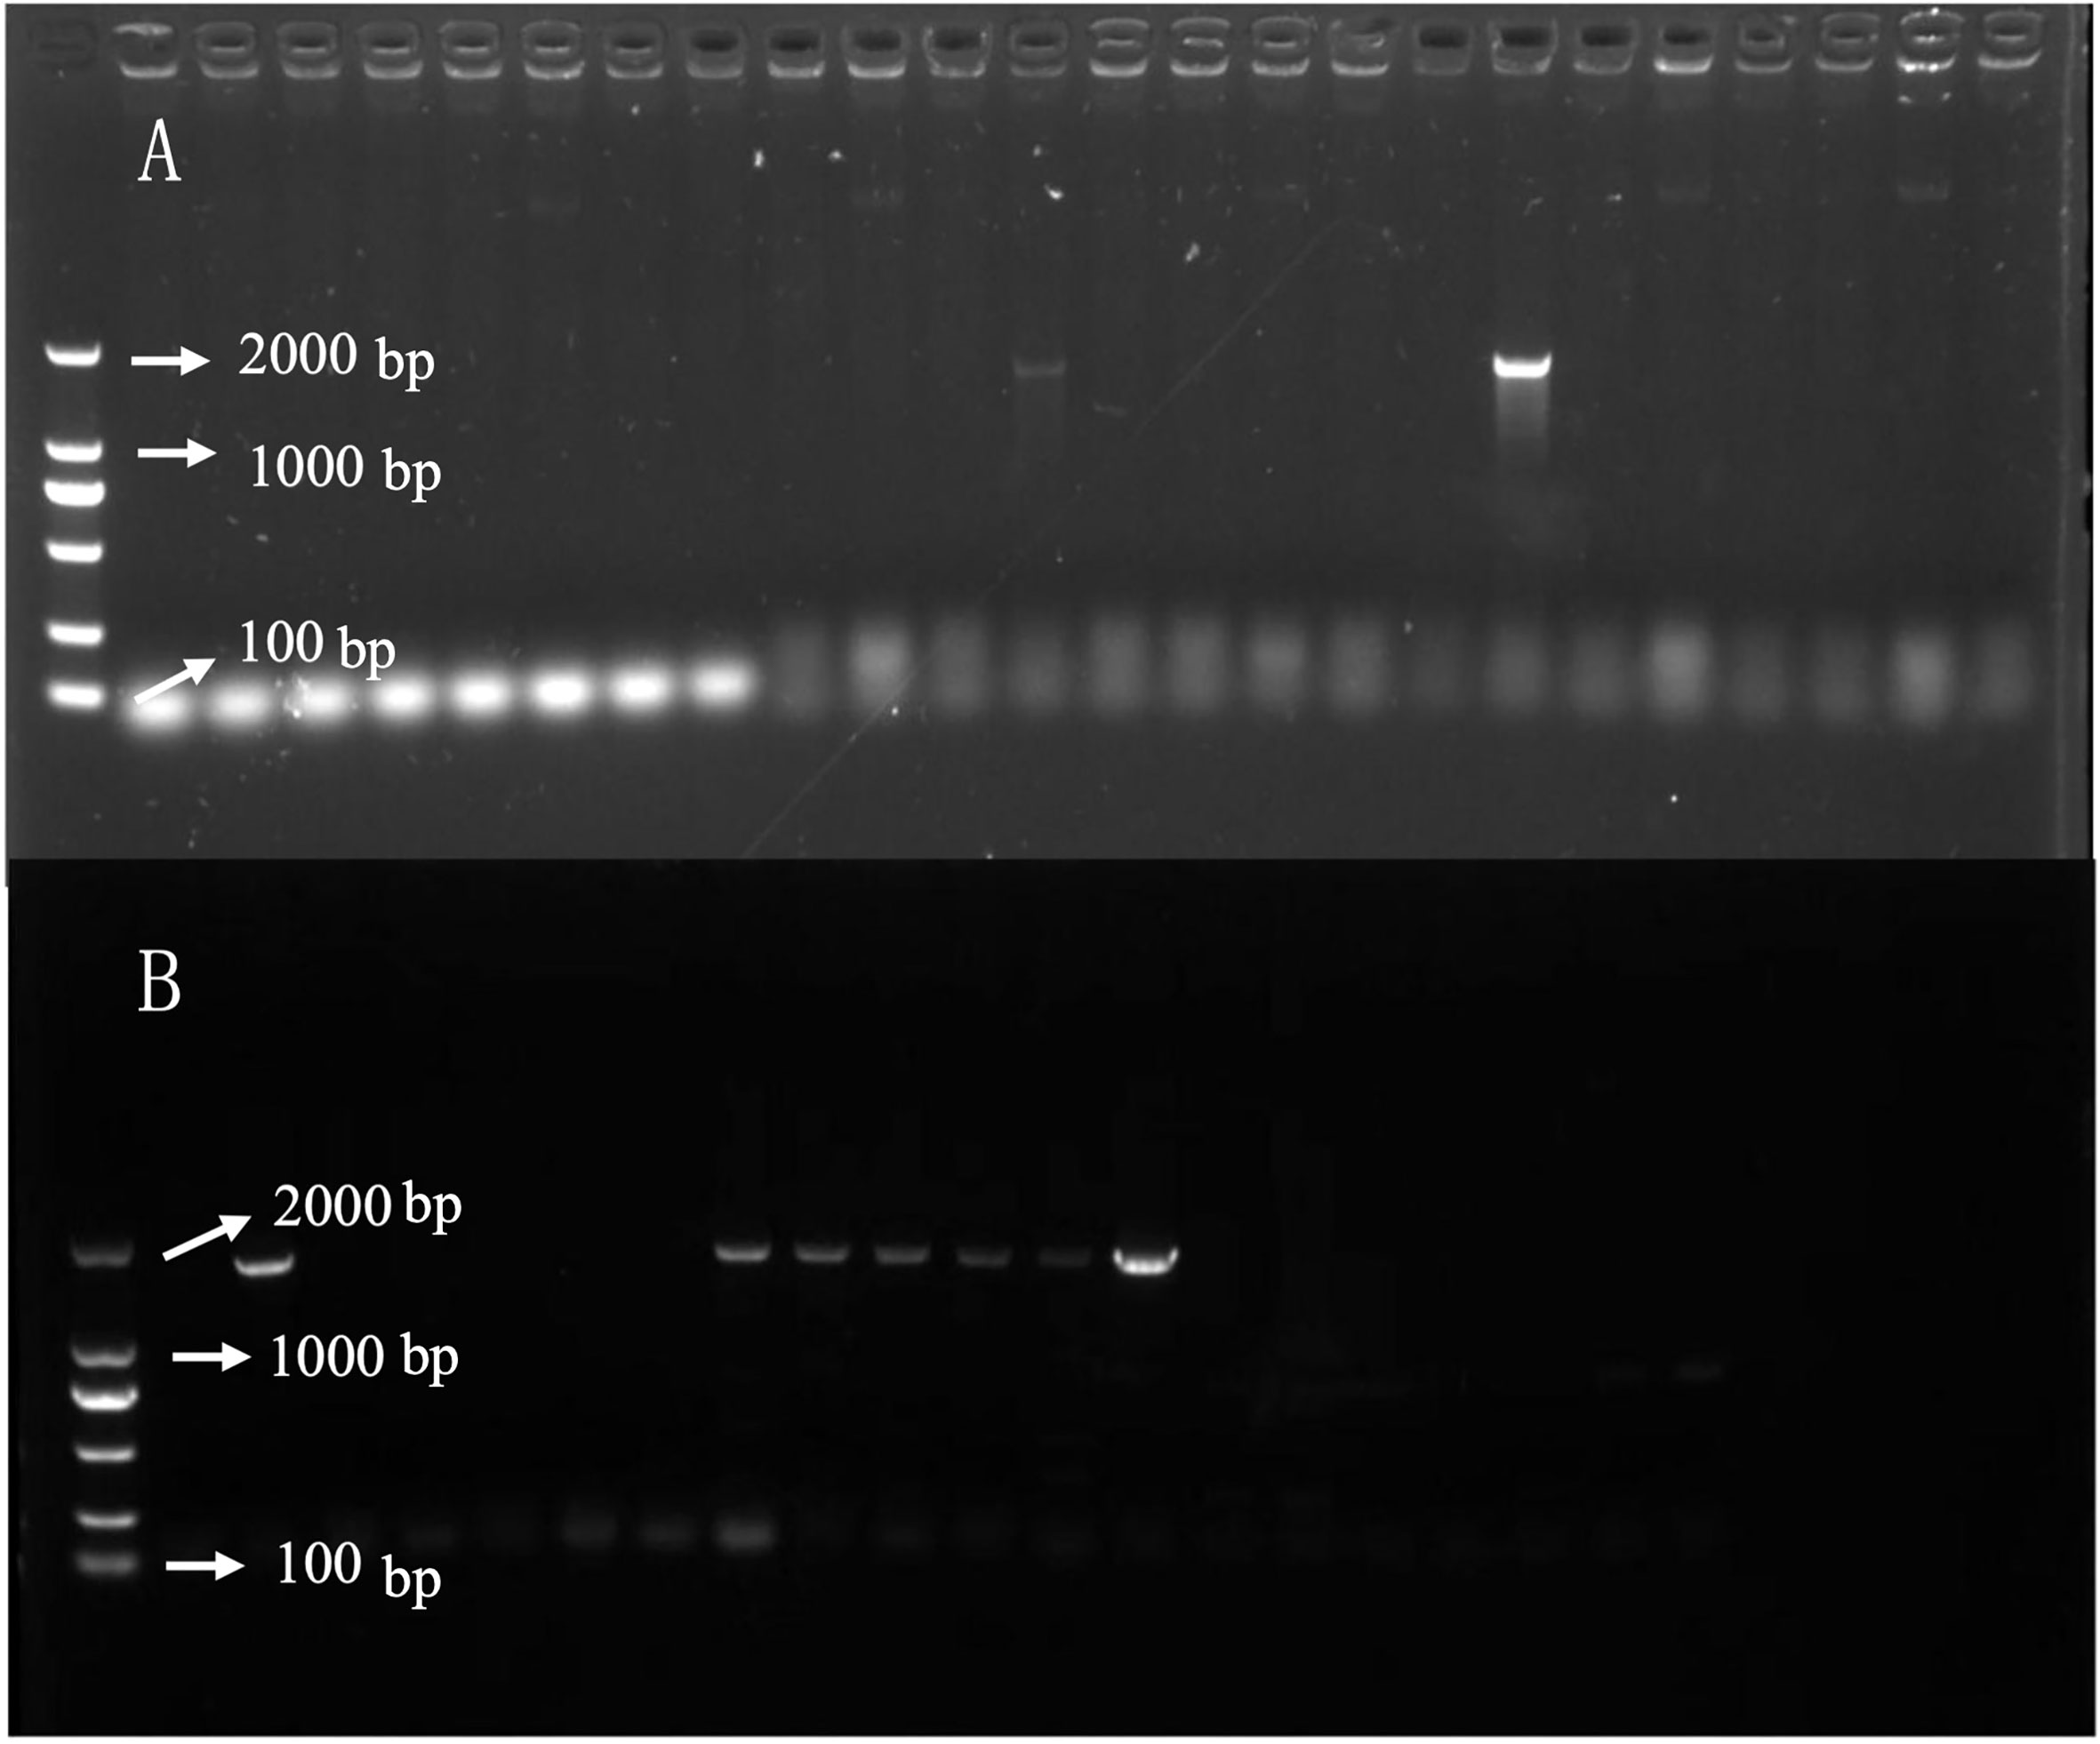
Figure 8 DNA detection of ALDH3F1 and CYP90A1 in transgenic plants. (A, B) are PCR detection of transgenic plants overexpression ALDH3F1 and CYP90A1 respectively.
3.5.2 Resistance identification of transgenic plants
After treatment of control and transgenic rape seedlings with glufosinate for 7 days, the leaves of plants in the blank control group showed yellowing and shrinkage. The leaves of ALDH3F1 transgenic rape seedlings shrank significantly, although no yellowing was observed (Figure 1G). CYP90A1 transgenic rape seedlings showed slight shrinkage without yellowing (Figure 1H). After 7 days of glufosinate treatment, samples were collected for qRT-PCR. In the overexpression lines ZA1-1 and ZA2-1, the relative expression levels of ALDH3F1 were 1.04- and 1.63-fold as high as that in the control, respectively (Figure 7I). In the overexpression lines ZC1-1,ZC2-1 and ZC3-1,the CYP90A1 expression was 2.37-, 2.09-, and 1.03-fold as high as that in the control (Figure 7J). The expression levels of ALDH3F1 and CYP90A1 were higher in the overexpression lines than in control plants.
4 Discussion
4.1 Key genes in response to glufosinate stress under brassinolide treatment
When plants are externally stimulated, their gene expression is altered to mitigate changes in the environment. We found that B. napus pre-treated with brassinolide developed resistance to sclerotinia and glufosinate. Following transcriptome analysis, the GO enrichment results were mainly concentrated in the photosynthetic membrane, photosystem, and photosynthesis. The Kyoto Encyclopedia of Genes and Genomes enrichment results were also concentrated in carbohydrate metabolism, energy metabolism, and amino acid metabolism, indicating that pre-treatment with brassinolide affected plant growth and development and alleviated glufosinate stress in Fanming No. 1.
During the plant stress response, we evaluated the expression of eight key glufosinate resistance genes. The expression levels of CYP90A1 and ALDH3F1 were significantly different compared to in the control, with the expression levels gradually decreasing as the plants recovered. These two genes were further analyzed.
4.2 Overexpression of CYP90A1 and ALDH3F1 contributes to resistance of B. napus to glufosinate
Aldehydes are intermediates in several fundamental metabolic pathways. Aldehyde dehydrogenase (ALDH) enzymes belong to a family of NAD(P)+-dependent enzymes, which exhibit substrate specificity and catalyze the oxidation of various aldehydes to the corresponding carboxylic acids, thereby reducing lipid peroxidation (Kirch et al., 2004). Plant family 2 ALDHs have been suggested to oxidize acetaldehyde generated via ethanolic fermentation, producing acetate for acetyl-CoA biosynthesis via acetyl-CoA synthetase, similar to the yeast pathway named as “pyruvate dehydrogenase bypass” (Wei et al., 2009). Transgenic Arabidopsis plants overexpressing ALDH3F1 are more tolerant to salt (NaCl and/or KCl), dehydration, and oxidative stress (Stiti et al., 2011). Activation of NADPH oxidase results in higher levels of H2O2, which triggers the relevant sensor to stimulate the mitogen-activated protein kinase cascade in plants under Cd stress. Mitogen-activated protein kinase activates the function of trans-regulatory elements in the nucleus to bind cis-regulatory elements and subsequently enhance the transcriptional levels of SOD and catalase to alleviate plant stress (Planas-Riverola et al., 2019), which is consistent with our results. We found that ALDH3F1 was highly expressed under the influence of glufosinate-ammonium stress; over time, the plants gradually recovered and ALDH3F1 expression decreased. These results suggest that high ALDH3F1 expression enhances the tolerance of Zhongshuang 11 plants to glufosinate.
The functions of cytochrome P450 monooxygenase CYP90A1/CPD (mutants identified in Arabidopsis) include constitutive photomorphogenesis and dwarfism (cpd; CYP90A1 deficiency). The expression levels of CYP90A1/CPD are correlated with the spatial allocation of the CYP90A1 substrate 6-deoxocatha-sterone, suggesting that CYP90 genes contribute to the regulation of brassinolide biosynthesis (Bancoş et al., 2002). Most herbicides such as prosulfuron, diclofop and chlortoluron can be converted into several metabolites by P450 (Danièle et al., 2000). P450 primarily catalyzes the monooxygenation of lipophilic xenobiotics, including herbicides, and plays a major role in the oxidation of most classes of herbicides (Frear, 1995). We found that CYP90A1 was highly expressed during glufosinate stress. Over time, the plants gradually recovered, and CYP90A1 expression decreased. These results suggest that high CYP90A1 expression enhances the tolerance of Zhongshuang 11 tolerance to glufosinate.
4.3 Overexpression of CYP90A1 and ALDH3F1 leads to upregulated ATG3 expression
ATG3 is crucial for responses to various biotic and abiotic stressors in animals and plants. A study of autophagy regulation in tomato showed that the heat shock transcription factor HsfA1a confers drought tolerance and induces autophagy by activating ATG (Wang et al., 2015). In this study, we found that the incidence of sclerotinia in samples treated with brassinolide and herbicides after brassinolide treatment was lower than that in the control, and the expression of ATG3 was upregulated at all three time points evaluated. These results indicate that upregulation of ATG3 expression can enhance the resistance of rape to sclerotiorum, which is consistent with the results of Wang et al. (2019).
ATG3 was highly expressed in plants overexpressing ALDH3F1 and CYP90A1. These results indicate that upregulated expression of ALDH3F1 and CYP90A1 leads to upregulated expression of ATG3, which may cause Zhongshuang 11 to be resistant to sclerotiorum. The incidence of sclerotinia in later stages will be verified in follow-up experiments.
5 Conclusion
Soaking of B. napus seeds in 0.015% brassinolide for 6 h resulted in the germination rate. Brassinolide treated plants started to turn green and continued to grow on day 7 of glufosinate application, indicating that the treatment conferred some resistance to glufosinate. The incidence of sclerotinia disease was reduced by 10% and the disease index was reduced by 6 points in the brassinolide-pre-treated group compared to in the control. Additionally, the activities of catalase and SOD increased under brassinolide pre-treatment, increasing the content of soluble substances. Transgenic seedlings overexpressing ALDH3F1 shrunk but did not show yellowing, whereas seedlings overexpressing CYP90A1 showed only slight shrinkage, suggesting that transgenic Zhongshuang No. 11 was strongly resistant to glufosinate. Moreover, the expression level of related genes in transgenic plants and expression level of the antibacterial S. sclerotiorum gene ATG3 in transgenic plants were higher than those in the control. These results indicate that ALDH3F1 and CYP90A1 are improve the resistance of B. napus to sclerotium disease. Our results provide a theoretical basis for the molecular breeding of B. napus to improve disease and glufosinate resistance, thereby promoting the development of the rapeseed industry.
Data availability statement
The datasets presented in this study can be found in online repositories. The names of the repository/repositories and accession number(s) can be found below: https://www.ncbi.nlm.nih.gov/, PRJNA877382.
Author contributions
ZZ developed the experimental plan. ZL designed the experiments. QG conducted the experiments. ML wrote the manuscript. MH analyzed the data. All authors have read and approved the manuscript.
Funding
This study was supported by the Natural Science Foundation of Changsha (kq2007015), National Transgenic Research Projects of China (2018ZX08020001), Agricultural Science, Technology Innovation Program (ASTIP) of CAAS (Grant No.2021IBFC), and Natural Science Foundation of China (31201240).
Conflict of interest
The authors declare that this research was conducted in the absence of any commercial or financial relationships that could be construed as potential conflicts of interest.
Publisher’s note
All claims expressed in this article are solely those of the authors and do not necessarily represent those of their affiliated organizations, or those of the publisher, the editors and the reviewers. Any product that may be evaluated in this article, or claim that may be made by its manufacturer, is not guaranteed or endorsed by the publisher.
References
Anis, A. S., Shakil, A., Muhammad, A., Nasim, A. Y. (2020). Seed priming with 3-epibrassinolide alleviates cadmium stress in cucumis sativus through modulation of antioxidative system and gene expression. Sci. Hortic. 265 (C), 109203. doi: 10.1016/j.scienta.2020.109203
Asaduzzaman, M., Pratley, J. E., An, M., Luckett, D. J., Lemerle, D. (2014). Canola interference for weed control. Springer Sci. Rev. 2 (1-2), 63–74. doi: 10.1007/s40362-014-0022-2
Bancoş, S., Nomura, T., Sato, T., Molnár, G., Bishop, G. J., Koncz, C., et al. (2002). Regulation of transcript levels of the arabidopsis cytochrome p450 genes involved in brassinosteroid biosynthesis. Plant Physiol. 130 (1), 504–513. doi: 10.1104/pp.005439
Baskar, V., Gangadhar, B. H., Park, S. W., Nile, S. H. (2016). A simple and efficient agrobacterium tumefaciens-mediated plant transformation of Brassica rapa ssp. pekinensis. 3 Biotech 6 (1), 88. doi: 10.1007/s13205-016-0402-1
Bestwick, C. S., Brown, I. R., Mansfield, J. W. (1998). Localized changes in peroxidase activity accompany hydrogen peroxide generation during the development of a nonhost hypersensitive reaction in lettuce. Plant Physiol. 118, 1067–1078. doi: 10.1104/pp.118.3.1067
Bolton, M. D., Thomma, B. P. H. J., Nelson, B. D. (2006). Sclerotinia sclerotiorum (Lib.) de bary: Biology and molecular traits of a cosmopolitan pathogen. Mol. Plant Pathol. 7, 1–16. doi: 10.1111/j.1364-3703.2005.00316.x
Bradford, M. M. (1976). A rapid and sensitive method for the quantitation of microgram quantities of protein utilizing the principle of protein-dye binding anal. Biochem 72, 248–254. doi: 10.1016/0003-2697(76)90527-3
Cui, Y., Huang, S. Q., Liu, Z. D., Yi, S. Y., Zhou, F., Chen, H., et al. (2016). Development of novel glyphosate-tolerant japonica rice lines: A step toward commercial release. Front. Plant Sci. 7. doi: 10.3389/fpls.2016.01218
Danièle, W. R., Alain, H., Luc, D. (2000). Cytochromes P450 for engineering herbicide tolerance. Trends Plant Sci. 5 (3), 116–123. doi: 10.1016/S1360-1385(00)01567-3
Del Río, L., Bradley, C., Henson, R., Endres, G., Hanson, B., Mckay, K., et al. (2007). Impact of sclerotinia stem rot on yield of canola. Plant Dis. 91, 191–194. doi: 10.1094/PDIS-91-2-0191
Derbyshire, M. C., Denton-Giles, M. (2016). The control of sclerotinia stem rot on oilseed rape (Brassica napus): Current practices and future opportunities. Plant Pathol. 65, 859–877. doi: 10.1111/ppa.12517
Dubois, M., Gilles, K., Hamilton, J. K., Rebers, P. A., Smith, F. (1951). A colorimetric method for the determination of sugars. Nature 168 (4265), 167. doi: 10.1038/168167a0
Eva, B., Jana, L., Ildiko, M., Zuzana, P., Martin, J., Maria, B., et al. (2011). Agrobacterium-mediated genetic transformation of economically important oilseed rape cultivars. Plant Cell Tissue Organ Culture (PCTOC) 107 (2), 317–323. doi: 10.1007/s11240-011-9982-y
Frear, D. S. (1995). Wheat microsomal cytochrome P450 monooxygenases: characterization and importance in the metabolic detoxification and selectivity of wheat herbicides. Drug Metabol Drug Interact. 12, (3–4). doi: 10.1515/dmdi.1995.12.3-4.329
Gao, J. (2006). “Photosynthesis: determination of chlorophyll content,” in Experimental guidance for plant physiology. Ed. Gao, J. (Beijing: Higher Education Press), 74–77.
Gondo, T. F., Kamakama, M., Oatametse, B., Samu, T., Bogopa, J., Keikotlhaile, B. M. (2021). Pesticide residues in fruits and vegetables from the southern part of Botswana. Food Addit. Contam. Part B Surveill. 14 (4), 271–280. doi: 10.1080/19393210.2021.1950845
Hayat, S., Cheng, Z., Ahmad, H., Ali, M., Chen, X., Wang, M. (2016). Garlic, from remedy to stimulant: evaluation of antifungal potential reveals diversity in phytoalexin allicin content among garlic cultivars; allicin containing aqueous garlic extracts trigger antioxidants in cucumber. Front. Plant Sci. 7. doi: 10.3389/fpls.2016.01235
Kirch, H., Bartels, D., Wei, Y. L., Schnable, S. P., Wood, A. J. (2004). The ALDH gene superfamily of arabidopsis. Trends Plant Sci. 9, 371–377. doi: 10.1016/j.tplants.2004.06.004
Krato, C., Petersen, J. (2012). Gene flow between imidazolinone‐tolerant and – susceptible winter oilseed rape varieties. Weed Res. 52 (2), 187–196. doi: 10.1111/j.1365-3180.2012.00907.x
Leslie, T., Baucom, R. S. (2014). De novo assembly and annotation of the transcriptome of the agricultural weed ipomoea purpurea uncovers gene expression changes associated with herbicide resistance. G3 (Bethesda) 4 (10), 2035–2047. doi: 10.1534/g3.114.013508
Livak, K. J., Schmittgen, T. D. (2001). Analysis of relative gene expression data using real-time quantitative PCR and the 2(-delta delta C(T)) method. Methods 25 (4), 402–408. doi: 10.1006/meth.2001.1262
Mary, A. (2010). Plant cytochrome P450 monooxygenases. Crit. Rev. Plant Sci. 15 (3), 235–284. doi: 10.1080/07352689609701942
Planas-Riverola, A., Gupta, A., Betegón-Putze, I., Bosch, N., Ibañes, M., and Caño-Delgado, A. T. (2019). Brassinosteroid signaling in plant development and adaptation to stress. Development 146 (5), dev151894. doi: 10.1242/dev.151894
Rajewska, I., Talarek, M., Bajguz, A. (2016). Brassinosteroids and response of plants to heavy metals action. Front. Plant Sci. 7. doi: 10.3389/fpls.2016.00629
Sharma, M., Gupta, S. K., Mondal, A. K. (2012). “Production and trade of major world oil crops,” in Technological innovations in major world oil crops, vol. 1. Ed. Gupta, S. (New York, NY: Springer). doi: 10.1007/978-1-4614-0356-2_1
Siminszky, B., Corbin, F. T., Ward, E. R., Fleischmann, T. J., Dewey, R. E. (1999). Expression of a soybean cytochrome P450 monooxygenase cDNA in yeast and tobacco enhances the metabolism of phenylurea herbicides. Proc. Natl. Acad. Sci. U. S. A. 96 (4), 1750–1755. doi: 10.1073/pnas.96.4.1750
Song, T., Chu, M., Zhang, J., Wen, R., Lee, J., Gossen, B. D., et al. (2020). Transcriptome analysis identified the mechanism of synergy between sethoxydim herbicide and a mycoherbicide on green foxtail. Sci. Rep. 10 (1), 21690. doi: 10.1038/s41598-020-78290-6
Stiti, N., Missihoun, T. D., Kotchoni, S. O., Kirch, H. (2011). Bartels dorothea. aldehyde dehydrogenases in arabidopsis thaliana: Biochemical requirements, metabolic pathways, and functional analysis. Front. Plant Sci. 2. doi: 10.3389/fpls.2011.00065
Sunkar, R., Bartels, D., Kirch, H. H. (2003). Overexpression of a stress-inducible aldehyde dehydrogenase gene from arabidopsis thaliana in transgenic plants improves stress tolerance. Plant J. 35 (4), 452–464. doi: 10.1046/j.1365-313x.2003.01819.x
Szekeres, M., Nemeth, K., Koncz-Kalman, Z., Mathur, J., Kauschmann, A., Altmann, T., et al. (1996). Brassinosteroids rescue the deficiency of CYP90, a cytochrome P450, controlling cell elongation and de-etiolation in arabidopsis. Cell 85, 171–182. doi: 10.1016/S0092-8674(00)81094-6
Vos, C. H. R. D., Schat, H., Waal, M. A. M. D., Vooijs, R., Ernst, W. H. O. (1991). Increased resistance to copper-induced damage of the root cell plasmalemma in copper tolerant silene cucubalus. Physiol. Plant 82, 523–528. doi: 10.1111/j.1399-3054.1991.tb02942.x
Wang, Y., Cai, S., Yin, L., Shi, K., Xia, X., Zhou, Y., et al. (2015). Tomato HsfA1a plays a critical role in plant drought tolerance by activating ATG genes and inducing autophagy. Autophagy 11, 2033–2047. doi: 10.1080/15548627.2015.1098798
Wang, X. D., Chen, H., Zhang, Z. Q., Guan, C. Y. (2019). Relationship between two resistance gene and diseases in high oleic acid rapeseed. J. Nucl. Agric. Sci. 33 (05), 894–901. doi: 10.11869/j.issn.100-8551.2019.05.0894
Wang, Z., Wan, L., Xin, Q., Chen, Y., Zhang, X., Dong, F., et al. (2018). Overexpression of OsPGIP2 confers sclerotinia sclerotiorum resistance in brassica napus through increased activation of defense mechanisms. J. Exp. Bot. 69, 3141–3155. doi: 10.1093/jxb/ery138
Wei, Y., Lin, M., Oliver, D. J., Schnable, P. S. (2009). The roles of aldehyde dehydrogenases (ALDHs) in the PDH bypass of arabidopsis. BMC Biochem. 25, 10:7. doi: 10.1186/1471-2091-10-7
Xia, X. J., Fang, P. P., Guo, X., Qian, X. J., Zhou, J., Shi, K., et al. (2018). Brassinosteroid-mediated apoplastic H2O2 -glutaredoxin 12/14 cascade regulates antioxidant capacity in response to chilling in tomato. Plant Cell Environ. 41 (5), 1052–1064. doi: 10.1111/pce.13052
Yuan, X. Y., Zhang, L. G., Huang, L., Yang, H. J., Zhong, Y. T., Ning, N, et al. (2017). Spraying Brassinolide improves Sigma Broad tolerance in foxtail millet (Setaria italica L.) through modulation of antioxidant activity and photosynthetic capacity. Sci. Rep. 7 (1), 11232. doi: 10.1038/s41598-017-11867-w
Zhang, K., Zhuo, C. J., Wang, Z. X., Liu, F., Wen, J., Yi, B., et al. (2022). BnaA03.MKK5-BnaA06.MPK3/BnaC03.MPK3 module positively contributes to sclerotinia sclerotiorum resistance in brassica napus. Plants 11 (5), 609–609. doi: 10.3390/plants11050609
Zhao, N., Li, W., Bai, S., Guo, W. L., Yuan, G. H., Wang, F., et al. (2017). Transcriptome profiling to identify genes involved in mesosulfuron-methyl resistance in alopecurus aequalis. Front. Plant Sci. 8, 1309. doi: 10.3389/fpls.2017.01391
Keywords: Sclerotinia, herbicide, Brassica napus, brassinolide, ALDH3F1, CYP90A1, overexpression
Citation: Gan Q, Luan M, Hu M, Liu Z and Zhang Z (2022) Functional study of CYP90A1 and ALDH3F1 gene obtained by transcriptome sequencing analysis of Brassica napus seedlings treated with brassinolide. Front. Plant Sci. 13:1040511. doi: 10.3389/fpls.2022.1040511
Received: 09 September 2022; Accepted: 05 October 2022;
Published: 03 November 2022.
Edited by:
Cunmin Qu, Southwest University, ChinaReviewed by:
Mingli Yan, Hunan Academy of Agricultural Sciences, ChinaLiezhao Liu, Southwest University, China
Zhiyong Hu, Oil Crops Research Institute, Chinese Academy of Agricultural Sciences, China
Copyright © 2022 Gan, Luan, Hu, Liu and Zhang. This is an open-access article distributed under the terms of the Creative Commons Attribution License (CC BY). The use, distribution or reproduction in other forums is permitted, provided the original author(s) and the copyright owner(s) are credited and that the original publication in this journal is cited, in accordance with accepted academic practice. No use, distribution or reproduction is permitted which does not comply with these terms.
*Correspondence: Zhongsong Liu, zsliu48@sohu.com; Zhenqian Zhang, zzq770204@163.com
†These authors have contributed equally to this work and share first authorship