 Liangrong Jiang1*†
 Hui Zhong1†
 Xianbin Jiang2†
 Jiaoping Zhang3
 Rongyu Huang1
 Furong Liao4
 Yaqin Deng1Qingqing Liu1Yumin Huang1Houcong Wang1
 Yi Tao1*
 Jingsheng Zheng1*
- 1Xiamen Plant Genetics Key Laboratory, School of Life Sciences, Xiamen University, Xiamen, China
- 2Guangxi Rice Genetics and Breeding Key Laboratory, Rice Research Institute, Guangxi Academy of Agricultural Sciences, Nanning, China
- 3National Key Laboratory for Crop Genetics and Germplasm Enhancement, Nanjing Agricultural University, Nanjing, China
- 4Xiamen Entry-Exit Inspection and Quarantine Bureau, Xiamen, China
Chalkiness is one of several major restricting factors for the improvement of rice quality. Although many chalkiness-related quantitative trait loci have been mapped, only a small number of genes have been cloned to date. In this study, the candidate gene GSE5 of a major quantitative trait locus (QTL) for rice chalkiness, qDEC5, was identified by map-based cloning. Phenotyping and haplotype analysis of proActin:GSE5 transgenic line, gse5-cr mutant, and 69 rice varieties further confirmed that GSE5 had the pleiotropic effects and regulated both chalkiness and grain shape. Genetic analysis showed GSE5 was a dominant gene for grain length and a semi-dominant gene for grain width and chalkiness. The DNA interval closely linked to GSE5 was introgressed to Zhenshan 97B (ZB) based on molecular marker-assisted selection, and the improved ZB showed lower chalkiness and longer but smaller grains, which showed that GSE5 played an important role in breeding rice varieties with high yield and good quality. Transcriptomics, proteomics, and qRT-PCR analyses showed that thirty-nine genes associated with carbon and protein metabolism are regulated by GSE5 to affect the formation of chalkiness, including some newly discovered genes, such as OsCESA9, OsHSP70, OsTPS8, OsPFK04, OsSTA1, OsERdj3A, etc. The low-chalkiness lines showed higher amino sugar and nucleotide sugar metabolism at 10 days after pollination (DAP), lower carbohydrate metabolism at 15 DAP, and lower protein metabolism at 10 and 15 DAP. With heat shock at 34/30°C, rice chalkiness increased significantly; OsDjC10 and OsSUS3 were upregulated at 6 and 12 DAP, respectively, and OsGSTL2 was downregulated at 12 DAP. Our results identified the function and pleiotropic effects of qDEC5 dissected its genetic characteristics and the expression profiles of the genes affecting the chalkiness formation, and provided a theoretical basis and application value to harmoniously pursue high yield and good quality in rice production.
Introduction
Rice is a staple food for more than half of the global population. Previous studies showed that the current rice quality was generally inadequate and that the main factor that restricted improvement of rice quality was the chalkiness trait (Qi, 2011; Xu et al., 2011; Meng et al., 2012). The chalky part of the rice grain not only renders an unattractive appearance but also markedly affects the processing and cooking quality as well as the taste of rice grains (Qi, 2011). Hence, improving rice chalkiness has great significance for rice quality improvement.
Rice chalkiness is strongly influenced by environmental conditions, especially the temperature at the grain filling stage (Kentaro et al., 2016; Chen et al., 2017; Kabir et al., 2017; Cheng et al., 2019). However, great variations exist in the chalkiness trait among rice varieties. For example, the percentage of grains with chalkiness (PGWC) and the degree of endosperm chalkiness (DEC) of an elite rice variety, Jiafuzhan, is close to zero under various environmental conditions (Wang et al., 2007). Therefore, the chalkiness trait is mainly controlled by genetic factors, and some rice germplasms can maintain a low level of chalkiness regardless of different ecological regions (Cheng et al., 2019; Zhou et al., 2019). As a quantitative trait, chalkiness is polygenic and has a strong additive effect on inheritance characteristics (Jin et al., 2000). The primary task in decreasing rice chalkiness is to improve the chalkiness-related genetic characteristics. Hence, the major genes related to chalkiness must be identified and cloned to perform functional analyses and facilitate comprehensive dissection of the genetic network for the chalkiness trait.
To date, many researchers have conducted quantitative trait loci (QTLs) mapping and epistatic interaction analysis for rice chalkiness using different types of mapping populations and have altogether identified more than 400 QTLs (He et al., 1999; Tan et al., 2000; Zeng et al., 2002; Li et al., 2003, 2004, 2016; Wan et al., 2005; Liu et al., 2007; Zhou et al., 2009b,c; Gao et al., 2014, 2016; Qiu et al., 2015, 2017; Tao et al., 2015; Wang et al., 2016; Yun et al., 2016; Gong et al., 2017; Jiang et al., 2017; Misra et al., 2021). These QTLs can be further grouped into approximately 30 intervals by a comparative analysis and integration with high-density molecular marker linkage maps. These mapping results implied that some genetic loci would be present in different genetic mapping populations and under different environmental conditions. Cloning these genes and dissecting their functions are important for understanding the genetic network of rice chalkiness. To date, three major QTLs associated with rice chalkiness have been fine mapped (qPGWC-7, QTLqPGWC-8, and qACE9), which map to a 44-kb interval on chromosome 7 (Zhou et al., 2009a), a 142-kb interval on chromosome 8 (Guo et al., 2011) and a 22-kb interval on chromosome 9 (Li et al., 2014), respectively. PGC6.1 was found to be a QTL contributing to lower grain chalkiness in low amylose varieties in a genome-wide association study (GWAS) (Misra et al., 2021).
With the development of “omics” analysis technology, some new technologies, such as transcriptomics, proteomics, and metabolomics, have been widely used to explore the complicated mechanism for the formation of rice chalkiness. The results showed that chalkiness formation involves multiple metabolic and regulatory pathways, including carbohydrate metabolism, protein metabolism, and redox homeostasis (Liu et al., 2010; Lin et al., 2014, 2017a,2017b; Biselli et al., 2015; Sera et al., 2019). Many genes in these pathways have been cloned, and their functions have been comprehensively expounded. WB1 (white belly 1) and GIFI (grain incomplete filling 1) both encode cell-wall invertases, while GIFI in wild rice and wb1 showed enhanced chalkiness (Wang et al., 2008, 2018). OsSSIIIa/OsFLO5 (floury endosperm 5) encode soluble starch synthases IIIa, and the flo5 showed white-core floury in the endosperm (Ryoo et al., 2007; Zhang et al., 2011). In addition, OsFLO2, FLO4, OsFLO6, and OsFLO13 are all probably involved in the synthesis of starch, and the mutation of each one in these genes could produce floury endosperm (Kang et al., 2005; She et al., 2010; Cheng et al., 2014; Hu et al., 2018). OsPDIL1-1, FLO11/OsHsp70CP2, and OsBiP1/OsBIP3 encode protein disulfide isomerase-like enzyme 1-1 (PDIL1-1), 70-kDa plastid-localized heat shock protein 2 (FLO11/OsHsp70CP2), and endosperm lumenal binding protein (OsBiP1/OsBIP3), respectively (Wakasa et al., 2011; Han et al., 2012; Tabassum et al., 2020), which are involved in protein metabolism. The absence of OsPDIL1-1 led to the formation of floury endosperm (Han et al., 2012), while severe suppression or significant overexpression of OsBiP1 resulted in the floury endosperm (Wakasa et al., 2011). flo11-2 significantly increased chalkiness compared with the wild-strain type at 28°C, but not at 24°C (Tabassum et al., 2020). The cloned genes related to chalkiness usually severely affect the development of endosperm to produce the floury phenotype, and the floury phenotype is easily identified and ruled out in the field. As a result, a very small number of genes are available for chalkiness modification in rice breeding. Chalk5 (a major QTL for grain chalkiness on chromosome 5) is thought to be a genuine gene among them. Chalk5 encodes a vacuolar H+-translocating pyrophosphatase. Overexpression of Chalk5 would affect the in vivo pH balance in the endosperm, which in turn would affect the synthesis of the proteinoplast and the formation of vesicle-like bodies, thereby producing an air gap and leading to chalk production in grain (Li et al., 2014). Moreover, the GW2 gene for grain width (GW), which encodes an E3 ubiquitin ligase (Song et al., 2007), and the qGW7 gene, which encodes a TONNEAU1-recruiting motif protein (Wang et al., 2015), are also thought to potentially affect the chalkiness trait. GW5/qSW5, a cloned gene, is involved in the brassinosteroid signaling pathway to regulate GW (Shomura et al., 2008; Weng et al., 2008; Liu et al., 2017), while some QTL analyses and GWASs found that some major QTLs for rice chalkiness was close to GW5/qSW5 (Wang et al., 2011; Gao et al., 2014; Qiu et al., 2015, 2017). Although GW5/qSW5 has been cloned for a long time, its gene structure was not identified until 2017, and it was then named GSE5 (Duan et al., 2017). In the context of this complex trait, a very small number of chalkiness-related genes available for chalkiness modification in rice breeding have been fine mapped or cloned despite a large number of identified QTLs.
In our previous studies, a major QTL for rice chalkiness was identified in the RM598-RM5140 interval on chromosome 5 (Wang et al., 2011; Jiang et al., 2017). In this study, near-isogenic lines (NILs) were developed to fine map this major QTL, transgenic lines were used to confirm the function of the candidate gene, and transcriptome, proteome, and time-course analyses were performed to explore the molecular mechanisms of chalkiness formation.
Materials and Methods
Materials and Mapping Populations
Zhenshan 97B (ZB), an indica variety, and a maintenance line. Zhenshan 97A (ZA) is the sterile line corresponding to ZB (Table 1). Zhenjia B (ZJB), a maintenance line germplasm with a long grain shape and good quality was developed by molecular marker-assisted selection (MAS) by the authors (Table 1 and Figure 1).
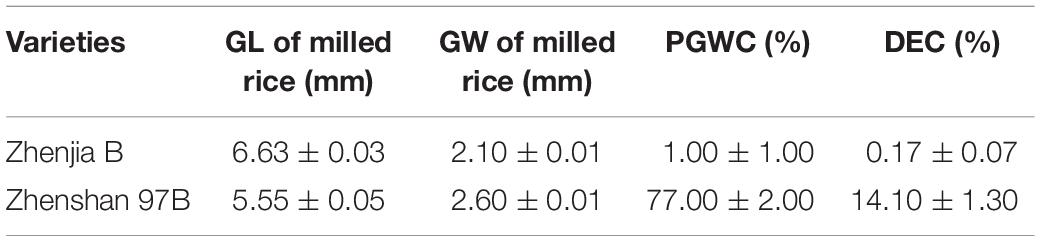
Table 1. The phenotypes of the parents.
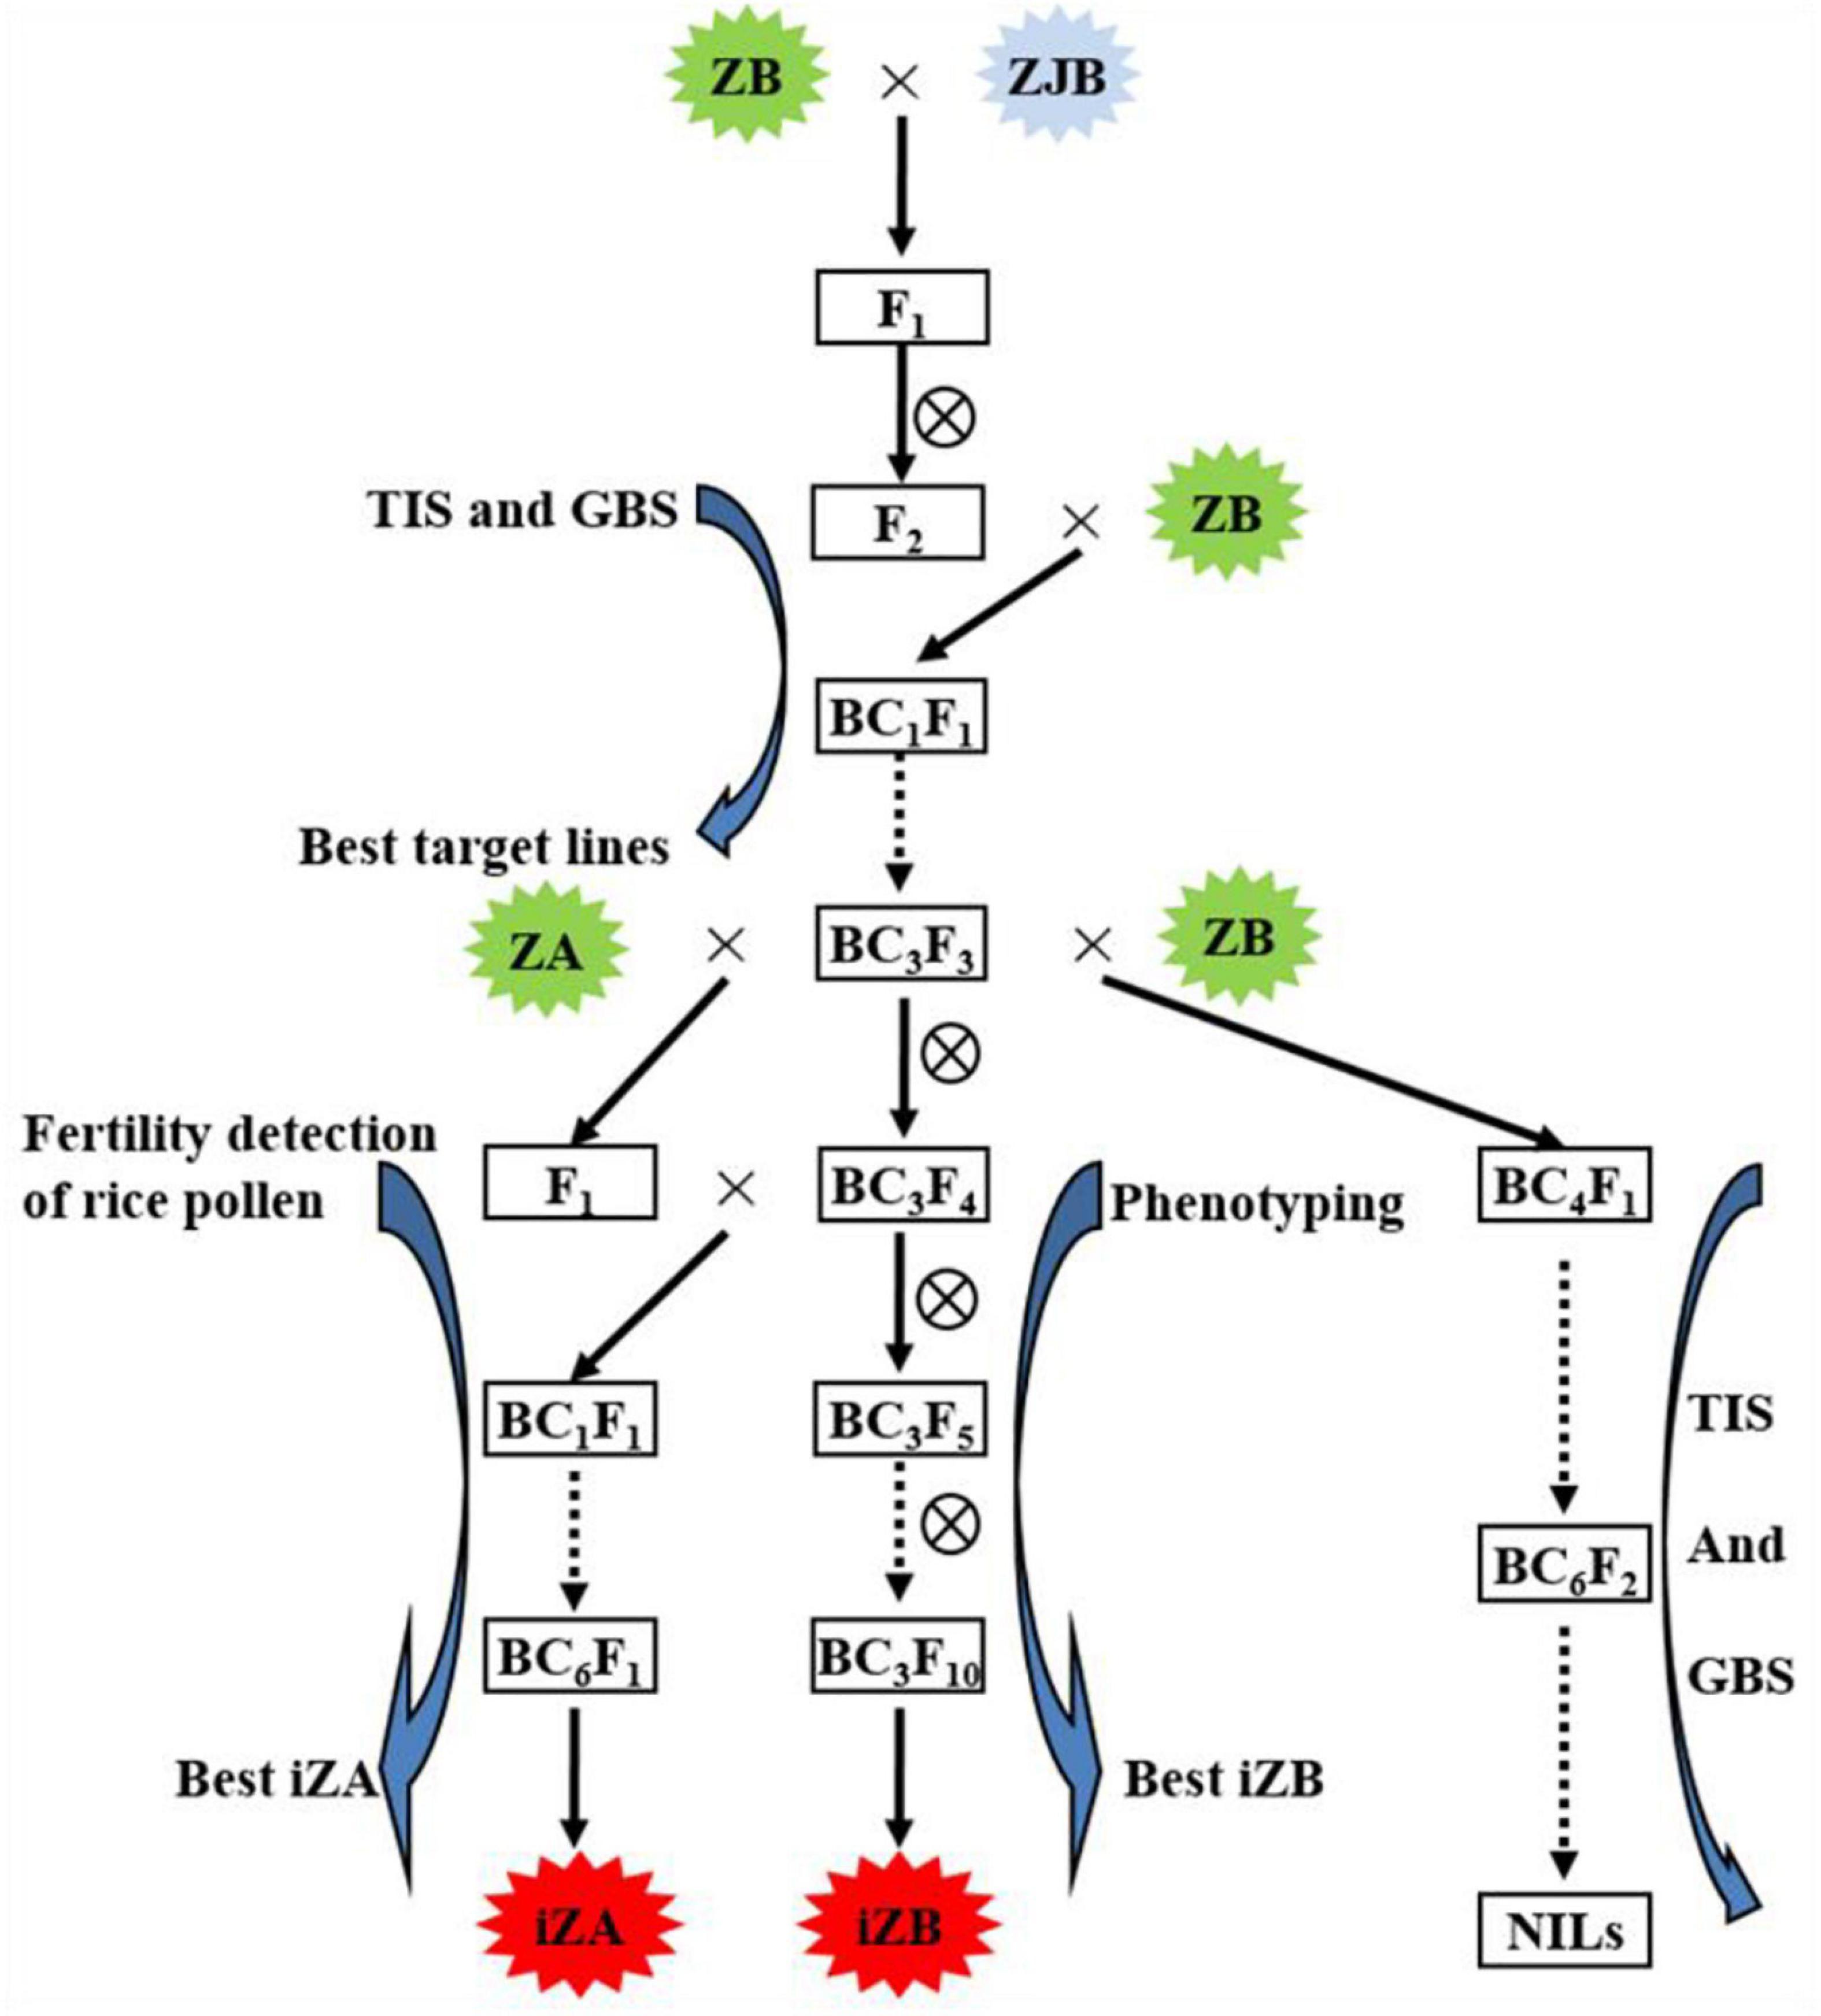
Figure 1. Working routine of the construction of near-isogenic lines (NILs) and iZA breeding by molecular marker-assisted selection. ZB, Zhengshan 97B; ZJB, Zhengjia B; ZA, Zhengshan 97A; TIS, the target interval selection; GBS, the genetic background selection; iZA, improved ZA; iZB, improved ZB. ZB was the recipient parent, and ZJB was the donor parent of the target gene.
The materials, Zhonghua 11 (ZH11), proActin:GSE5, and gse5-cr were provided by Professor Yunhai Li (the Institute of Genetics and Developmental Biology, Chinese Academy of Sciences) and Plant Bioscience Limited (Norwich N, England). ZH11 is a japonica variety. proActin:GSE5 is a line with overexpressed GSE5 in ZH11 background, and gse5-cr is a line with a 1-bp deletion mutant of GSE5 in ZH11 background (Duan et al., 2017).
In this study, NILs (BC6S2, BC7S2, and BC7S3) were constructed based on MAS, in which ZB was the recipient parent, ZJB was the donor parent of the target gene (Figure 1). MAS includes two processes. One is foreground selection, which is target gene or interval selection (TIS), and the other is genetic background selection (GBS), which selects the genetic background from the recurrent parent using the molecular markers showing polymorphism between the parents. In each backcross separation population, such as BC1F1, BC2F2, BC3F2, and so on, the lines with the target interval and the most genetic background of recurrent parents (ZB) were selected for the next backcross. Three pairs of simple sequence repeat (SSR) markers (RM169, RM289, and RM598) were used for TIS and 95 pairs of SSR markers (Supplementary Table 1) showing polymorphism between ZJB and ZB were used for GBS in MAS breeding (Wang et al., 2011).
Sixty-nine rice varieties from around the world (Supplementary Table 2) were provided by the National Seed Bank of China for haplotype analysis of GSE5.
Phenotypic Analysis of Grain Shape and Chalkiness-Related Traits
Rice grains were collected from the plants during the ripening stage. The grains were dried in an oven at 60°C until a constant weight was achieved.
Brown rice was made from rice grains using the hulling machine JLGJ4.5 (Taizhou Grain Instrument Factory, Zhejiang, China). The brown rice was processed to milled rice with a rice milling machine PEARLEST (KETT, Japan). More than 100 whole-grain milled rice grains with normal development were selected and spread on a scanner such that no contact and overlap occurred between the grains. The scanner was connected to a computer, and the JMWT 12 analysis software (Beijing Oriental Fude Technology Development Co. LTD, China and SATAKE MultiMix Corporation, Japan.)1 was opened. We selected the standard, edible rice GB1354, and indica rice analysis menu and then clicked “Begin” to start the scan. Phenotypic values, including PGWC, DEC, grain length (GL), and GW, were generated.
Scanning Electron Microscopy Observation of the Endosperm Starch in the Rice Grains
The rice grain was broken at the midpoint of the endosperm longitudinal axis. The cross-section was subjected to spraying with gold for 60 s under 7 Pa of pressure and a 15-mA current. The Hitachi desktop scanning electron microscope TM-1000 (HITACHI Corporation, Japan) was used for scanning and imaging the grains.
Extraction of Plant Genomic DNA
Genomic DNA was extracted and purified using the cetyltrimethylammonium bromide (CTAB) method (Wang and Fang, 2003).
Primer Design and Synthesis
The sequences of all the RM series SSR markers can be found on the GRAMENE website2. Other primers were self-designed using the Primer Premier 6 software (PREMIER Biosoft, USA)3 by referring to the sequences of the rice varieties Nipponbare (Oryza sativa subsp. japonica) and 9311 (Oryza sativa subsp. indica). All the primers were synthesized by Xiamen Baijin Biological Technology Co. Ltd. (Xiamen, China).
Linkage Map Construction for the Quantitative Trait Locus Analysis
In this study, 59 pairs of primers from the RM series SSR on chromosome 5 (Supplementary Table 3) and 17 pairs of self-designed XM series primers (Supplementary Table 4) were used for polymorphism analysis between the parental lines. Polymorphic primers were used for the genotypic analysis of the genetic population and the construction of a genetic linkage map.
Phenotypic and genotypic analyses of 316 NILs (BC6S2) were performed, and then a linkage map was constructed with the QGAStation 2 software (Zhejiang University, China)4 based on the genotypes of these lines. According to the software user’s manual, we first imported molecular marker data, selected the “linkage map” menu, and then set the linkage map construction criteria by selecting “P = 0.05” to run the software. The linkage map data was generated upon completion of the computation. Then, QTLNetwork 2.1 was used for QTL mapping (see text footnote 4). First, we created the map file and data file following the user manual, opened QTLNetwork 2.1, clicked “create a new file,” imported the map file and data file, and then clicked “OK.” Next, we set relevant parameters [e.g., set the significance level as 0.05 and the analysis method as Markov chain Monte Carlo (MCMC)]. Finally, we clicked the “Confirm” button to start the analysis, and the results were shown when the analysis was completed.
Fine Mapping and Gene Sequence Analysis of the Candidate Gene
In fine mapping, 66 pairs of primers (Supplementary Table 5) were synthesized and 37 pairs of SSR primers were self-designed and synthesized (Supplementary Table 6).
Among NILs (BC6S2), 1,083 lines with high chalkiness (homozygous recessive) were chosen for fine mapping of the candidate gene. Molecular markers in the target interval were used for the analysis of the exchange rate. New PCR primers were designed in a region closer to the target candidate gene according to the previous mapping result and the whole-genome sequences of Nipponbare and 9311. Further analysis of the exchange rate of these molecular markers was used to derive the physical distance between the target gene and each of the molecular markers. Following this procedure, the target gene was mapped to a rather small physical interval. According to the genome annotation in this interval and the target trait, the candidate gene was inferred through the analysis.
For the sequence analysis, 4, 4, 2, 2, 2, 3, 4, 2, and 2 pairs of primers (Table 2) were used in this study to amplify the full-length sequences of the Chalk5, GS5, LOC_Os05g09460, LOC_Os05g09470, LOC_Os05g09480, LOC_Os05g09490, LOC_Os05g09500, LOC_Os05g09510, and LOC_Os05g09520 genes, respectively.
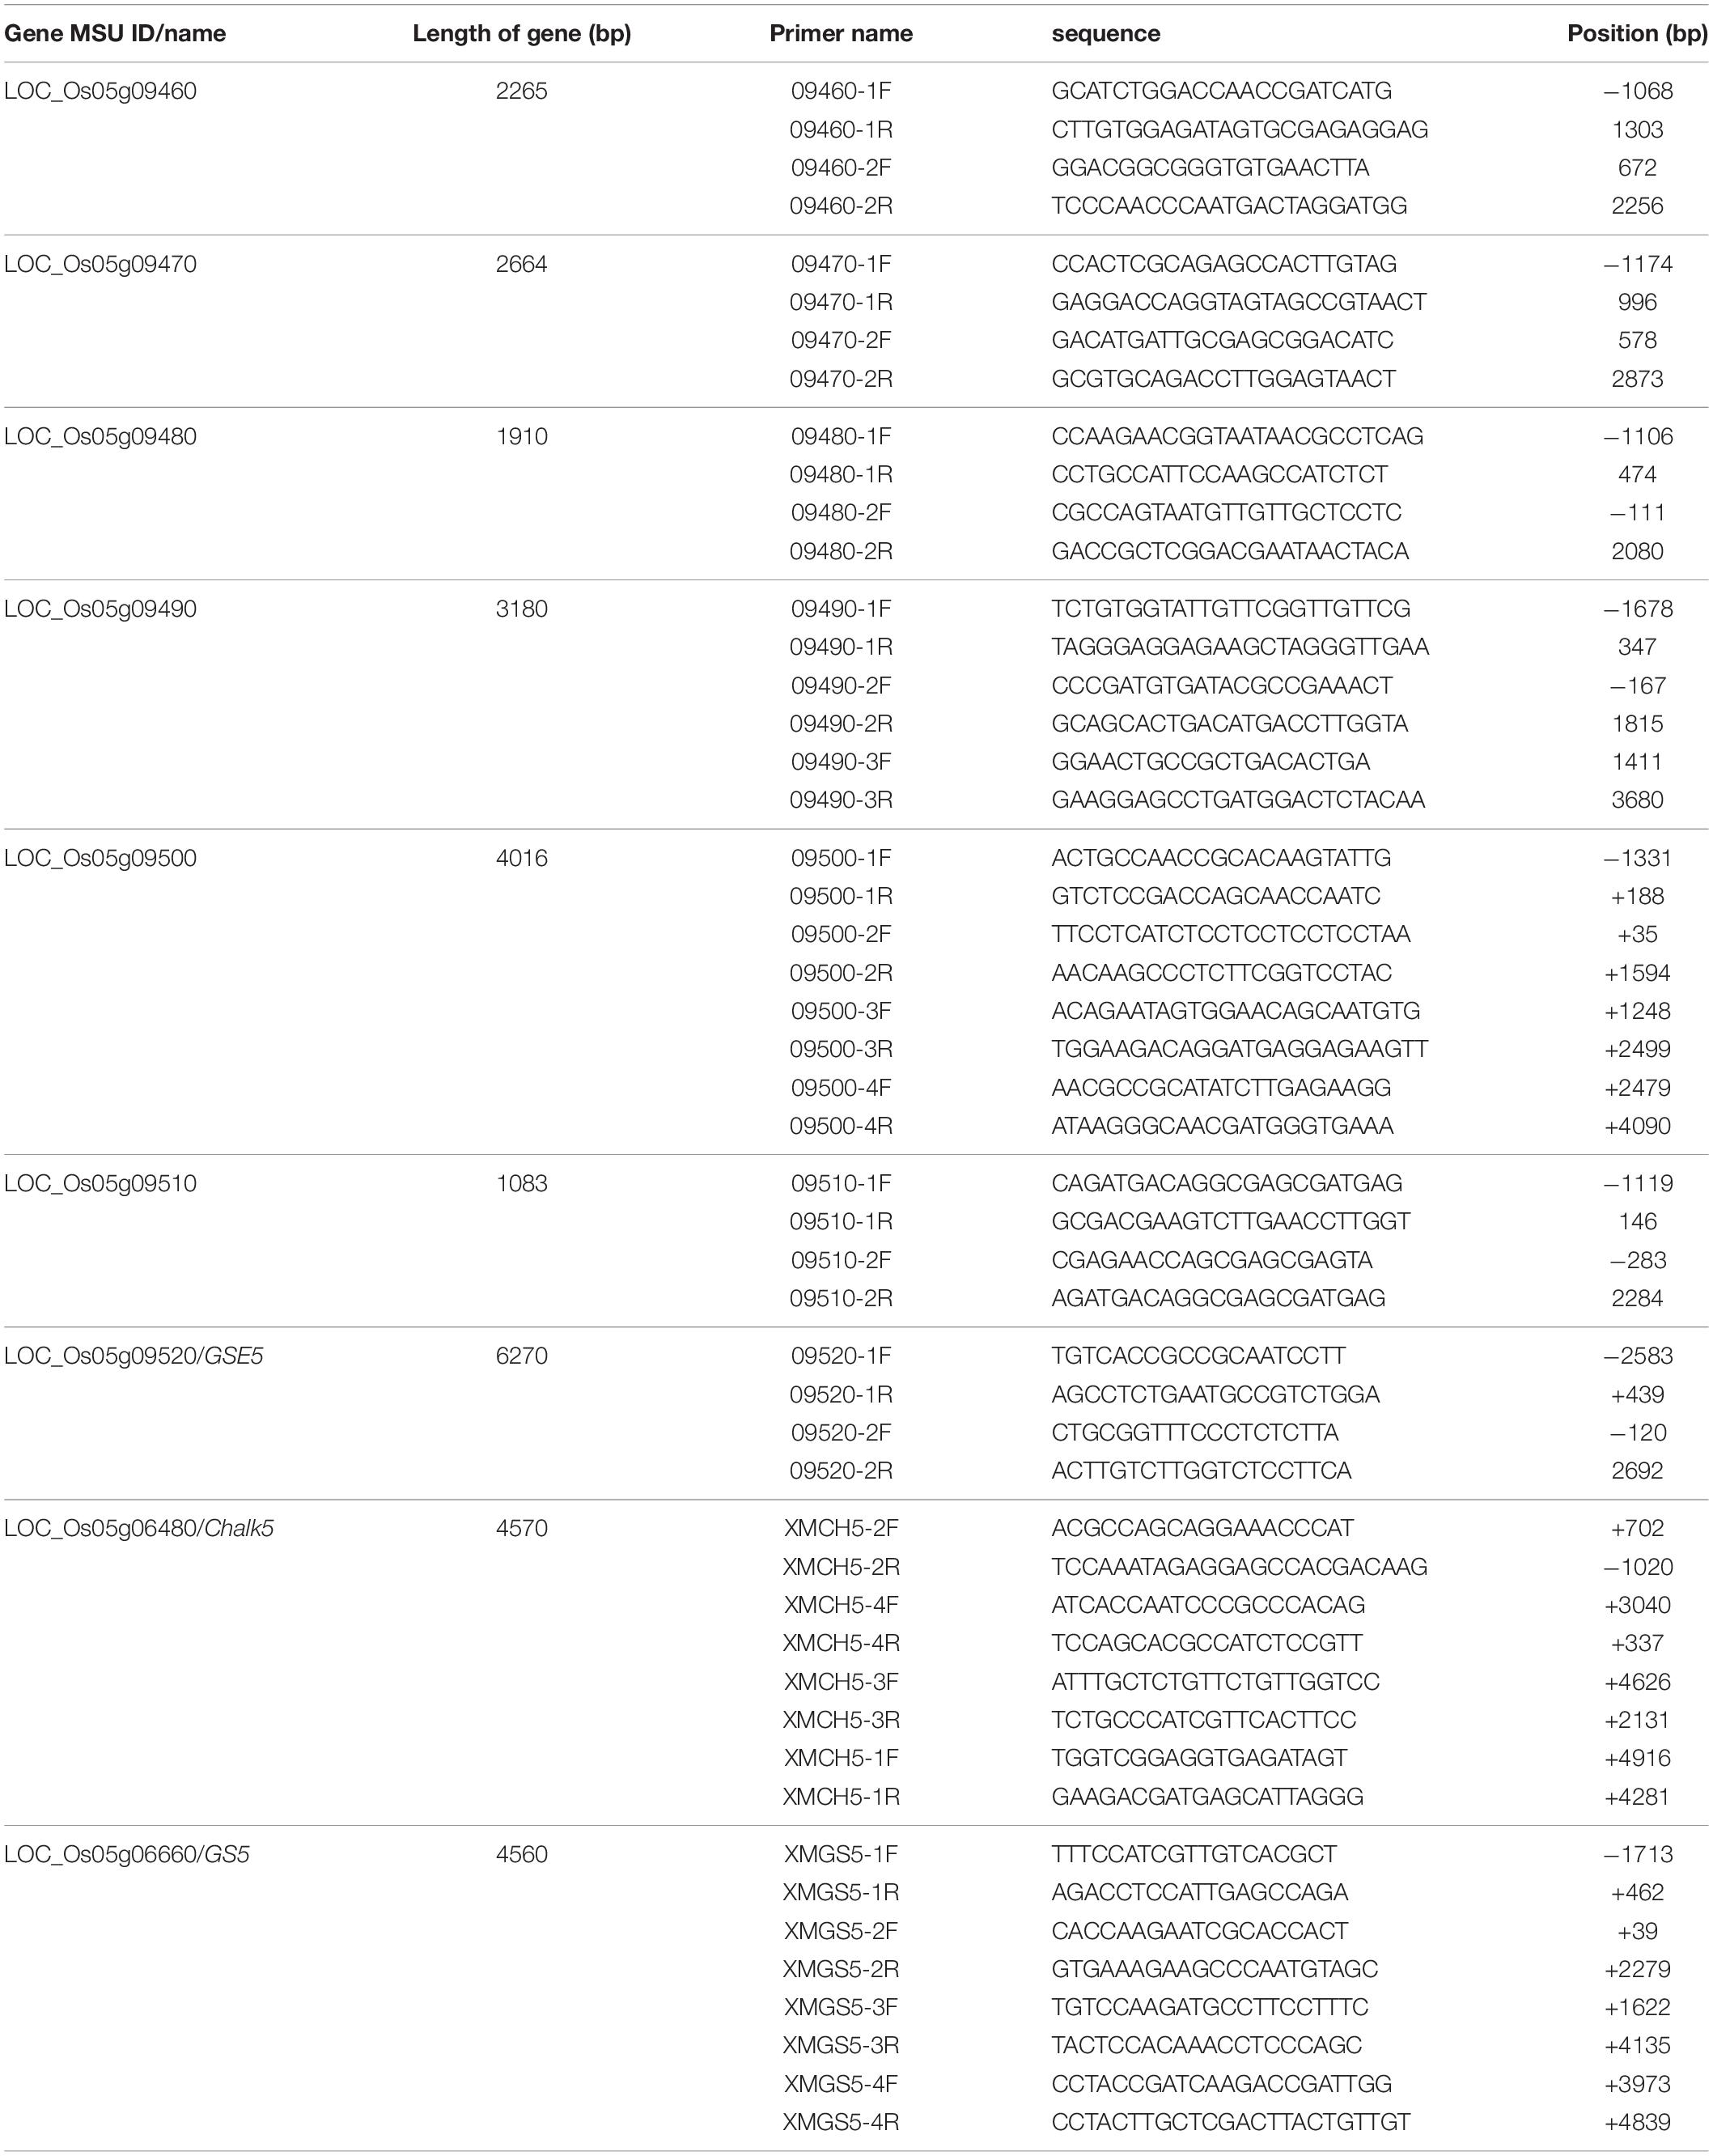
Table 2. Primers for amplifying the full-length sequences of the genes in the target interval, Chalk5, and GS5.
Real-Time PCR Analysis
In this experiment, 56 pairs of primers of the genes showing different expression levels in our “omics” analysis or are known genes associated with chalkiness were designed and used for qRT-PCR analysis (Supplementary Tables 7, 8). Total RNA was isolated from dehulled kernels with TaKaRa MiniBEST Universal RNA Extraction kits (Takara Bio Inc., China). cDNA synthesis was carried out with the Thermo Scientific RevertAid First Strand cDNA Synthesis Kit (Thermo Fisher Scientific, United States). The actin gene (LOC_Os03g50885) was used as the reference expression gene. SYBR Green II real-time PCR was carried out using the TransStart® Top Green qPCR Super Mix Kit (TransGen Biotech, China) on an ABI Prism 7500 Sequence Detector (Applied Biosystems, Inc., United States). The real-time PCR amplification mixture (20 μl) contained 1 μg of cDNA, 10 μl of 2 × TransStart® Top Green qPCR Super Mix Kit, 0.4 μl of 50 × Dye II and 4 μl of 5 μM forward and reverse primers.
RNA Sequencing and Analysis
The dehulled developing caryopsis was collected at 10 days after pollination (DAP) and 15 DAP on ZB and NILqDEC5 lines (BC7S3) in the field, and each line had three biological replicates. A total amount of 3 μg RNA per sample was used as input material for RNA sample preparation. RNA-Seq libraries were prepared by the NEBNext® Ultra™ RNA Library Prep Kit for Illumina® (NEB, United States), according to manufacturers’ instructions. The libraries were sequenced on an Illumina HiSeq 2500/X platform (Illumina, United States), and 125/150-bp paired-end reads were generated. Raw data (raw reads) in fastq format were first processed through in-house Perl scripts. At the same time, Q20, Q30, and GC contents of the clean data were calculated. All the downstream analyses were based on clean data with high quality. Reference genome and gene model annotation files were downloaded from the genome website directly.5 5 The index of the reference genome was built using Bowtie version 2.2.3 (Johns Hopkins University, USA), and paired-end clean reads were aligned to the reference genome using TopHat version 2.0.12 (Johns Hopkins University, USA) (Trapnell et al., 2009). Cuffquant and cuffnorm (version 2.2.1) were used to calculate fragments per kilobase of transcript per million mapped reads (FPKMs) of genes in each sample (Trapnell et al., 2010). Here, differential expression analysis between two samples, ZB and NILqDEC5 at the same developmental stage, was performed using the DESeq2 R package (European Bioconductor Conference, Germany) (Wang et al., 2010). The resulting P-values were adjusted using Benjamini and Hochberg’s approach for controlling the false discovery rate. Genes with an adjusted P-value < 0.01 found by DESeq2 were assigned as differentially expressed. The sequencing data were submitted to GenBank (PRJNA751381).
Gene Ontology Term Enrichment Analyses
The GOseq R package was employed to analyze Gene ontology (GO) enrichment since it was developed to account for RNA length bias typical of RNA-Seq approaches (Young et al., 2010). GO terms with corrected P-value < 0.05 were considered significantly enriched by differentially expressed genes (DEGs).
Protein Extraction, Two-Dimensional Electrophoresis, and Image Acquisition
The dehulled developing caryopsis was collected at 6 DAP, 12 DAP, 18 DAP, and 24 DAP from ZB, ZJB, NILqdec5, and NILqDEC5 lines (BC7S2) in the field, and each line had three biological replicates. The methods of protein extraction, two-dimensional electrophoresis, and image acquisition refer to the paper (Chen et al., 2014).
Mass Spectrometry Analysis and Database Search
The selected protein spots were excised from the 2-DE gels and digested with sequencing-grade trypsin (Promega Corporation, United States). The method of mass spectrometry analysis and database searches for the peptides refer to the paper (Chen et al., 2014).
Protein-Protein Interaction Analysis
Protein-protein interaction (PPI) analysis of DEGs was based on the STRING database6.
Heat Shock Treatment
In the research field, three lines (3 plants/lines), proActin:GSE5, ZH11, and gse5-cr, planted in square plastic pots (45 cm × 60 cm) and grown under natural conditions (from August to November in Xiamen, Fujian, China). At 3 DAP, the pots were moved to an illumination incubator with a double-temperature zone (MPI-1008HF-2R, Ningbo Jiangnan Instrument Factory, Ningbo, China) and grown until the rice grains were ripe. One zone is the control condition (28°C, 100,000 Lux for 12 h/26°C, dark for 12 h), while the other zone is a high-temperature condition (34°C, 100,000 Lux for 12 h; 30°C, dark for 12 h). At 6 and 12 DAP, the developing caryopsis was detached from the panicles, immediately frozen in liquid nitrogen, and stored at −80°C until the determination of transcript levels. At 30 DAP, the mature seeds were harvested and used for phenotyping after drying in an oven at 60°C.
Molecular Marker-Assisted Selection and Breeding
In the previous study, our research group found that the RM598-RM169-RM289 interval of chromosome 5 had a strong influence on chalkiness and grain shape (Wang et al., 2011). In this study, MAS was used to rapidly improve the maintainer line, ZB, and its corresponding sterile line, ZA. In this study, ZJB was the donor of high-quality genes corresponding to rice appearance quality traits and ZB was the receptor. In F2 from the hybridization between ZJB and ZB, TIS and GBS were carried out using molecular markers, and then the selected lines were backcrossed with ZB. After self-crossing, BC1F2 was obtained, and then TIS and GBS were carried out again. The selected lines continued to backcross, the BC3F2 population was finally produced, and MAS was carried out again to obtain iZB (Figure 1). Three SSR markers, RM598, RM169, and RM289, were used for TIS. Ninety-five pairs of SSR markers showing polymorphism between ZB and ZJB were used for GBS (Supplementary Table 1).
Method for Calculating the Homozygosity Degree
In this study, the homologous degree (HD) indicates that the recurrent parent genotype (genetic background) accounts for a proportion of the entire rice genome in the progeny individuals. HD was calculated based on the formula 1-ax (a, the polymorphism between ZB and ZJB, a = 16.37%) (Wang et al., 2011); x refers to the genetic polymorphism rate in the intervals of genetic background selection, and x is the number of polymorphic markers between the selected lines and ZB/the number of the total markers used for GBS.
Fertility Identification of Rice Pollen Granules by Microscope
The fertility of rice pollen granules was identified by microscopy. After rice pollen granules were impregnated with 1% iodine/potassium iodide aqueous solution (I2/KI), the fertile pollens showed complete black solid round grains, which were called “stained black,” and the sterile pollens were light-colored and round or irregularly shaped, which were called “light stained.”
At approximately 8:00 a.m., spikes that were about to blossom were picked from rice plants and placed into a plastic bag for moisturization. A drop of 1% I2/KI was dropped on a glass slide. The glume was peeled off with tweezers, and all the six anthers on every spikelet were taken out and placed in the 1% I2/KI on the glass slide for staining. Then, the cover glass was placed over the solution and gently pressed to release the pollen granules from the broken pollen sac. They were then observed under a light microscope with 10 × 10 magnification. Two spikelets were taken from each panicle every time, three fields were observed, and each field was counted as 300 pollen granules. Two replicates were applied for each panicle.
Results
Mapping of qPGWC5 and qDEC5
To locate the causal interval for chalkiness traits on chromosomes, a linkage group was constructed on chromosome 5 based on the BC6S2 population. The QTL analysis showed that a QTL for PGWC (qPGWC5) and a QTL for DEC (qDEC5) were colocalized and mapped to the RM18004—RM18035 interval on chromosome 5. The additive effect and the genetic contribution rate [H2(A)] of these two QTLs were 20.49 and 47.2% and 3.31 and 40.7%, respectively (Table 3 and Figure 2A). These results indicated that one major QTL for the chalkiness trait was located in the RM18004—RM18035 interval, which was named qDEC5.

Table 3. Major QTLs for the chalkiness trait in the RM18004—RM18035 interval.
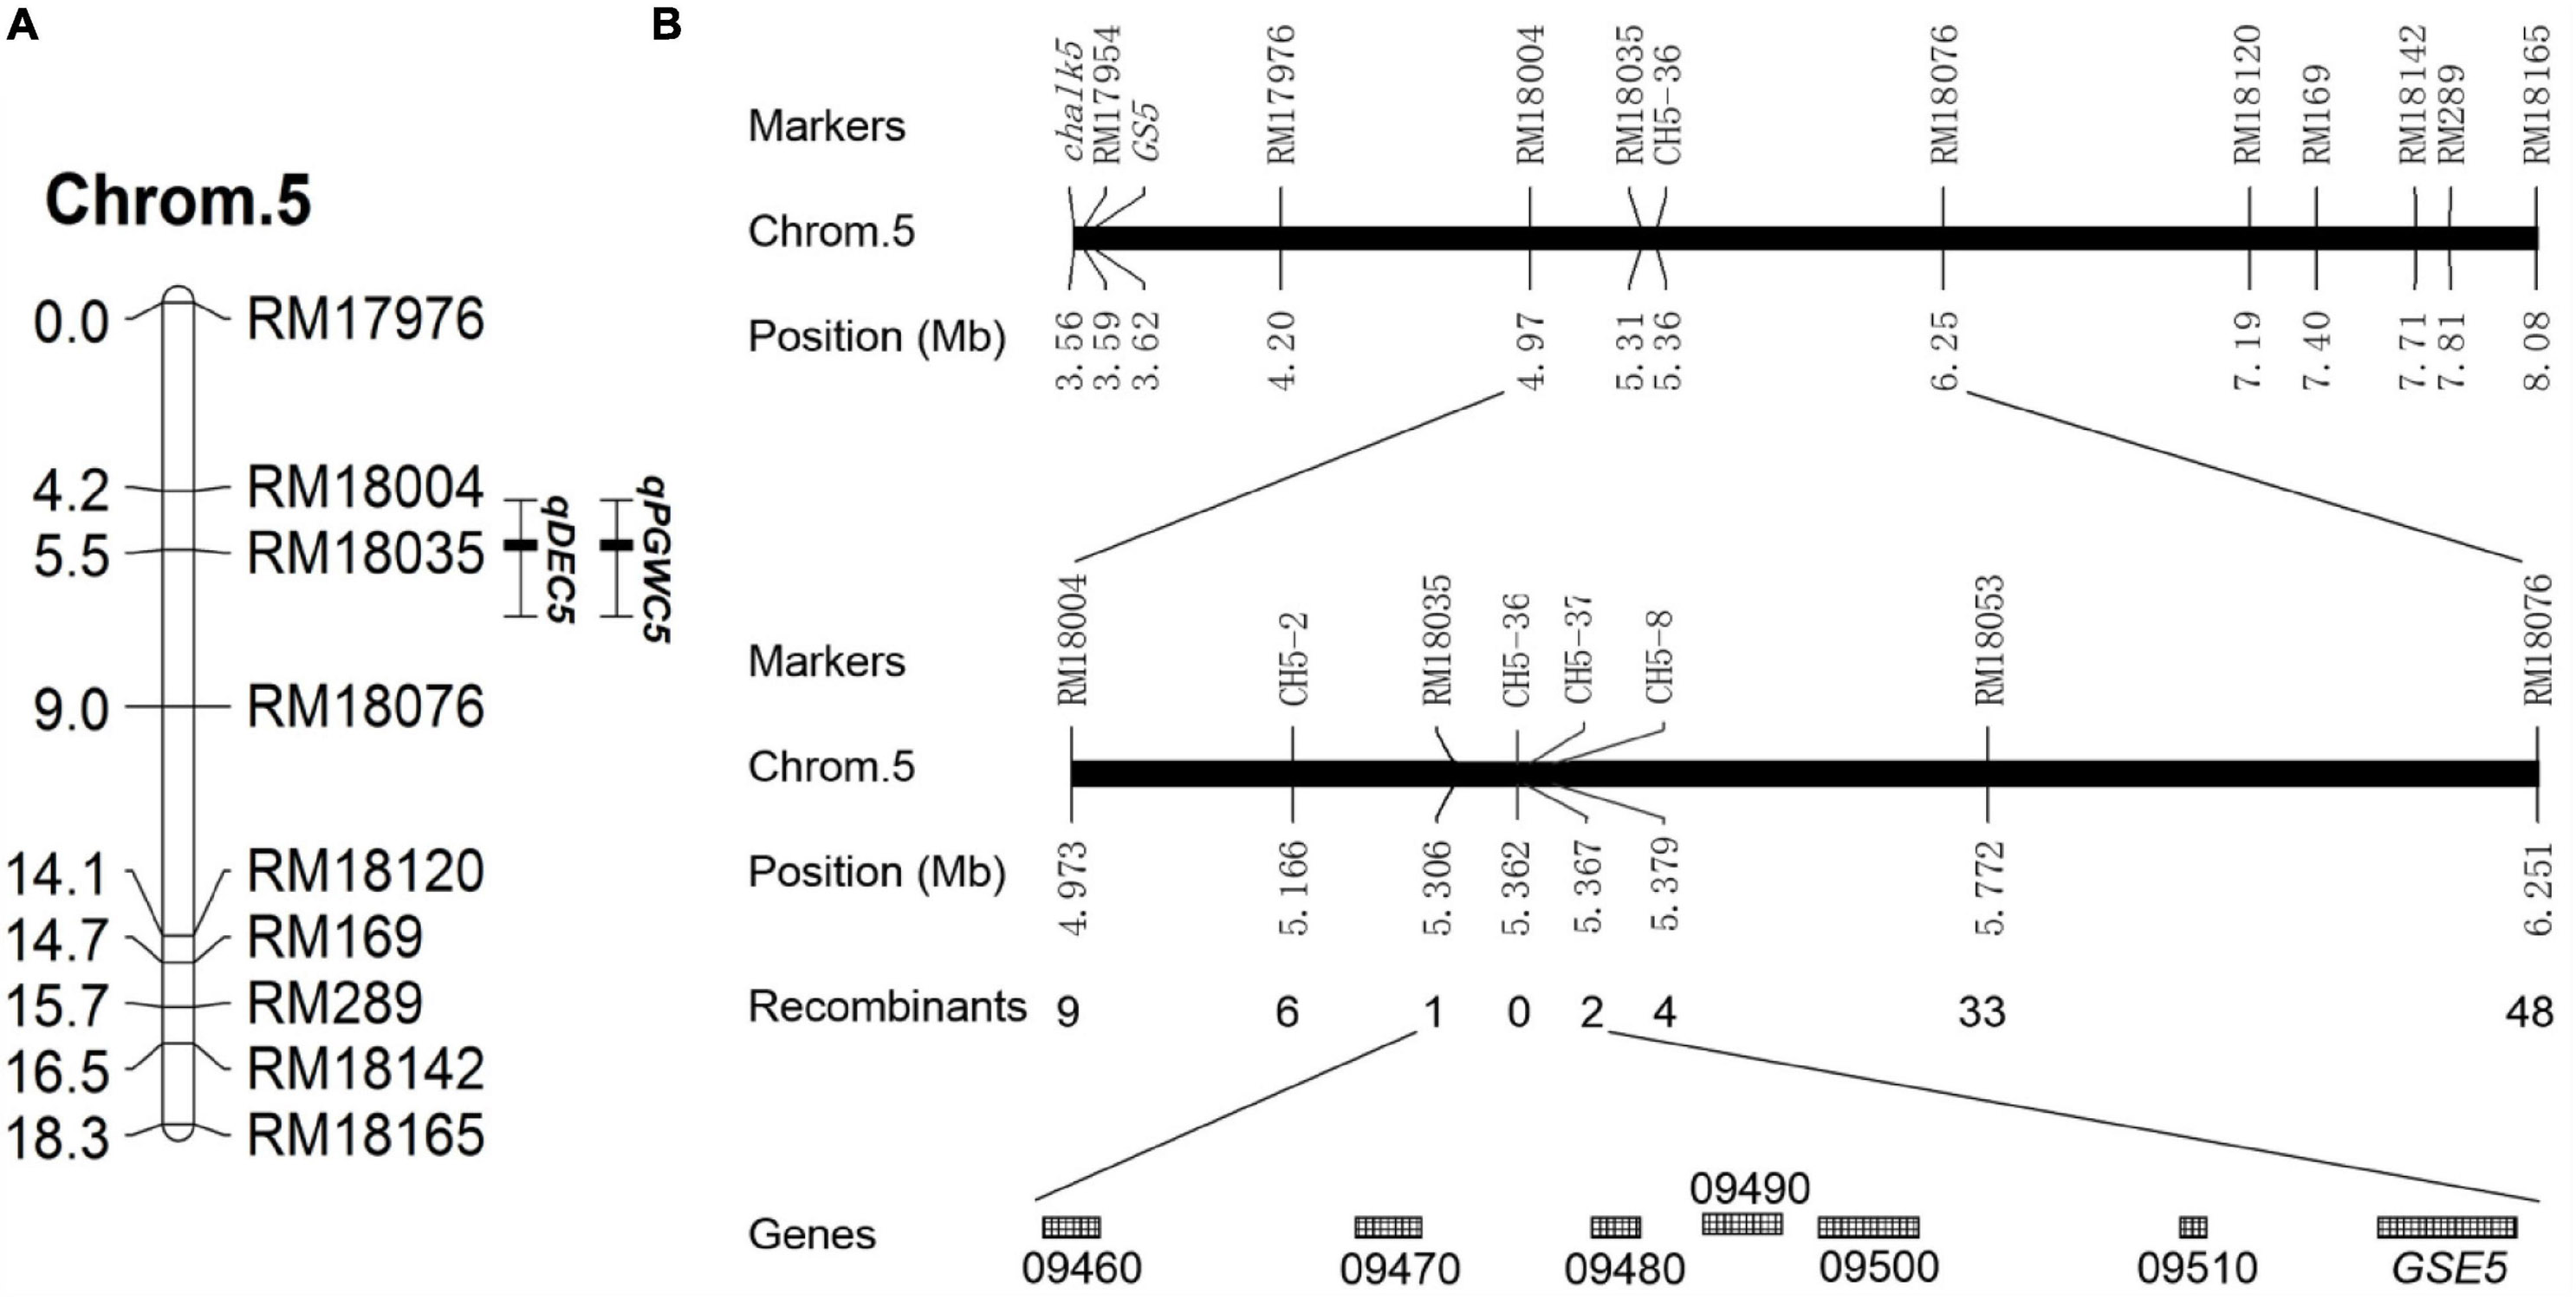
Figure 2. Genetic linkage map and physical map. (A) Genetic linkage map. Chrom.5 indicates chromosome 5, the numbers on the left side are the genetic distances (cM), the numbers on the right side are the molecular marker names, qPGWC5 is a QTL for PGWC, and qDEC5 is a QTL for DEC. (B) Fine mapping of qDEC5. “LOC_Os05g + the number” shown on the last line indicates the gene number in the rice gene annotation library of the Michigan State University (MSU) website (http://rice.plantbiology.msu.edu/).
Fine Mapping of qDEC5 Using Near-Isogenic Lines
A total of 1,083 NILs with high chalkiness (homozygous recessive) and 37 pairs of self-designed primers (CH5 series) were used to obtain recombinants in the target interval. qDEC5 was mapped in the interval of 61 kb between RM18035 and CH5-37 (Figure 2B and Supplementary Table 9), harboring seven known genes (LOC_Os05g09460, LOC_Os05g09470, LOC_Os05g09480, LOC_Os05g09490, LOC_Os05g09500, LOC_Os05g09510, and GSE5) (Figure 2B and Supplementary Table 10).
GSE5 Was the Candidate Gene of qDEC5
To screen for the candidate gene, sequence analysis of the seven genes and their leading sequences in the interval was carried out. The result indicated no differences in six of the genes between the two parental lines (LOC_Os05g09460, LOC_Os05g09470, LOC_Os05g09480, LOC_Os05g09490, LOC_Os05g09500, and LOC_Os05g09510) (Table 2). Chalk5 for rice chalkiness (Li et al., 2014) and GS5 for rice grain shape (Li et al., 2011), are also very close to GSE5 on chromosome 5. The sequence analysis of these two genes showed no difference between the two parental lines (Table 2). However, differences were detected in GSE5.
Sequence analysis of GSE5 indicated a 15-bp deletion from 1,372 to 1,386 bp in ZB, the parent with high chalkiness (Figure 3A and Table 2). The deletion was at the third exon and resulted in a deletion of five amino acids covering positions No. 428 to No. 432 in the encoded protein (Figure 3B).
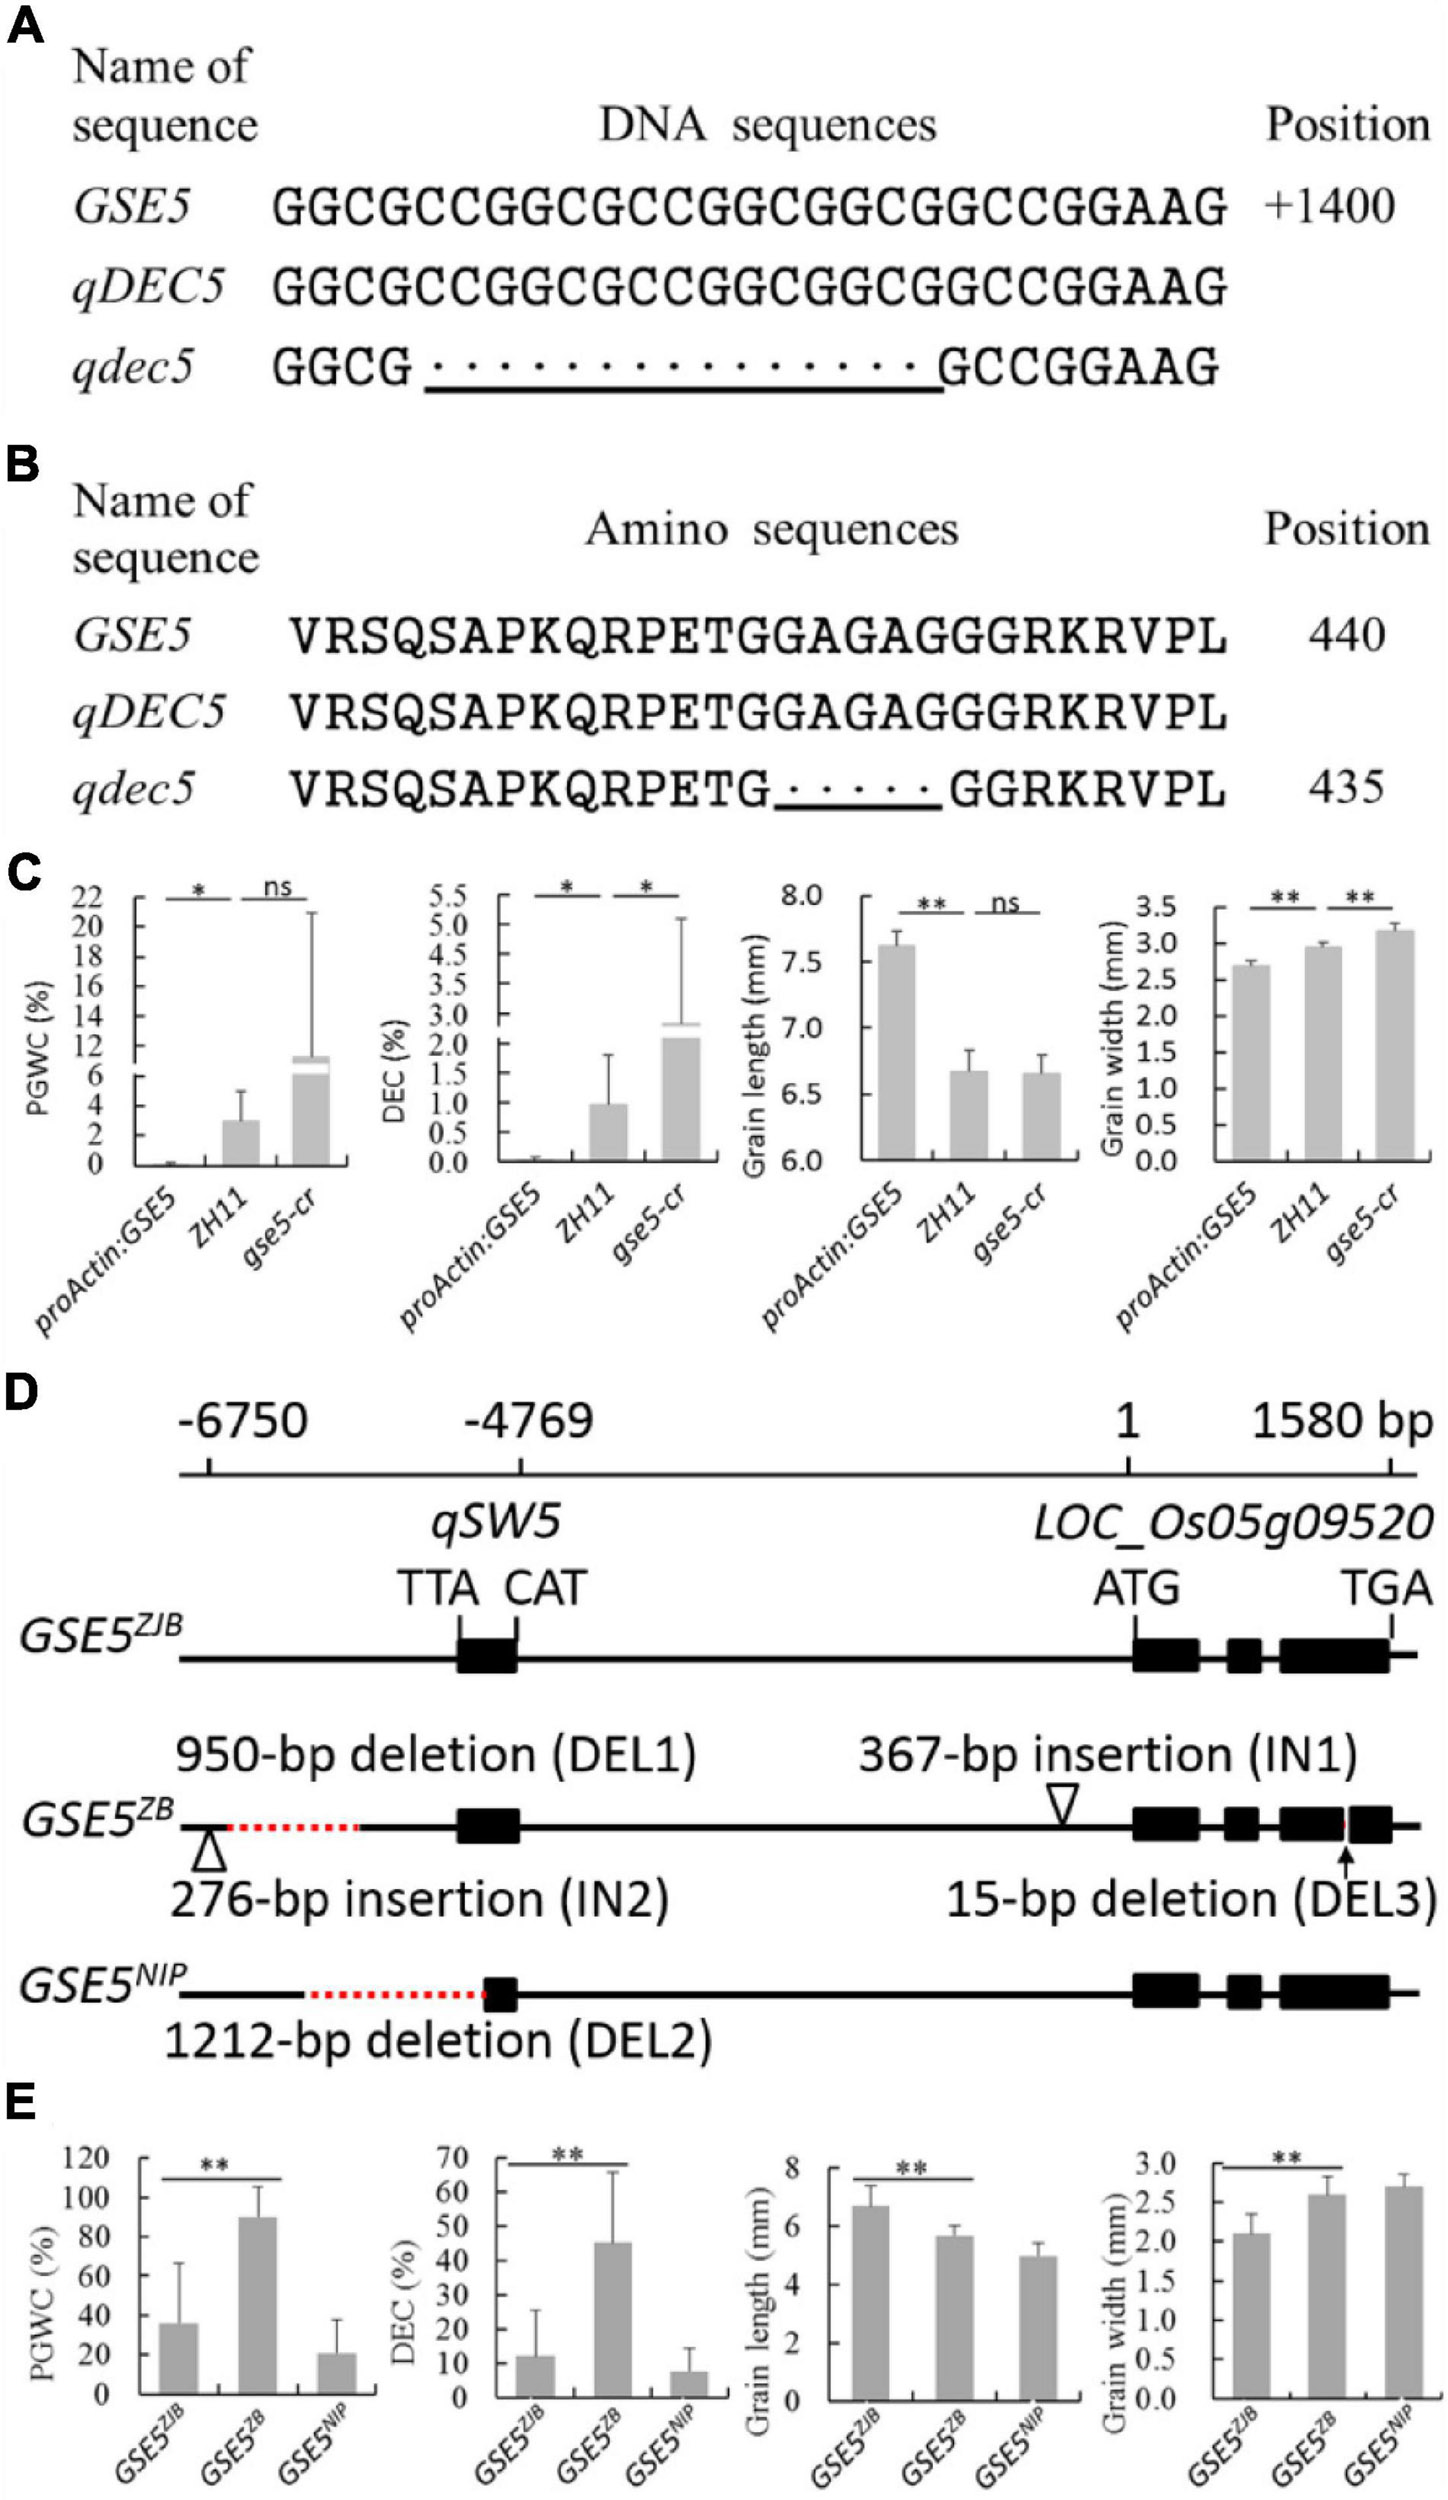
Figure 3. Genotyping and phenotyping analysis of the GSE5. (A) DNA sequence alignment of qDEC5 between ZB and ZJB. (B) Amino sequence alignment of qDEC5 between ZB and ZJB. (C) Phenotyping analysis of ZH11, proActin:GSE5 and gse5-cr. (D) The three major haplotypes of GSE5 (GSE5ZJB, GSE5ZB, and GSE5NIP). ZJB, ZB, and NIP are Zhenjia B, Zhenshan 97B, and Nipponbare, respectively. (E) The phenotyping analysis of the rice varieties with different haplotypes. The bottom line shows the mutations. Every black “.” indicates a one-base or one-amino acid deletion. Significance is determined using analysis of variance (ANOVA) (*P < 0.05, **P < 0.01, and ns represents no signification). The red dashed lines represent deletions, and the triangles represent insertions in the genomic regions.
GSE5 Regulates Chalkiness and Grain Shape
The proActin:GSE5 transgenic line and gse5-cr mutant generated by CRISPR/Cas9 with the genetic background of ZH11 were planted to confirm the function of qDEC5. Phenotyping and Student’s t-test showed that PGWC and DEC were markedly lower in proActin:GSE5 lines than in ZH11, while DEC was markedly higher in the gse5-cr mutant than in ZH11 (Figure 3C). GL in proActin:GSE5 was extremely significantly longer than in ZH11, while GW was extremely significantly smaller (Figure 3C). GW was extremely significantly greater in gse5-cr than in ZH11, whereas GL was similar to that in ZH11 (Figure 3C). These results indicate that qDEC5 controls rice chalkiness and grain size.
We identified three major haplotypes of GSE5 (GSE5ZJB, GSE5ZB, and GSE5NIP) in 69 rice varieties from around the world (Figures 3D,E). Among them, thirty-nine indica varieties with the GSE5ZJB haplotype showed a lower PGWC and DEC and a slim grain shape (Figure 3E and Supplementary Tables 2, 11). Another 17 indica varieties with the GSE5ZB haplotype showed a higher PGWC and DEC and a shorter and wider grain shape (Figure 3E and Supplementary Tables 2, 11). The GSE5ZB haplotype contains a 950-bp deletion (DEL1), a 276-bp insertion (IN2) in the 3′ flanking region of qSW5, a 367-bp insertion (IN1) in the flanking region of LOC_Os05g09520, and a 15-bp deletion (DEL3) in the third exon of LOC_Os05g09520 (Figure 3D). Thirteen japonica varieties had the GSE5NIP haplotype, which contains a 1212-bp deletion (DEL2) in qSW5 and its 3′ flanking region (Figure 3D).
GSE5 Is a Semi-Dominant Gene Regulating Chalky Trait
To study the genetic characteristics of GSE5/qDEC5, milled rice grain shape and chalkiness phenotypic analysis of ZB, ZJB, and the NIL population (BC6S2, 316 lines) was carried out. The milled rice GL, GW, PGWC, and DEC values for ZB were 5.55 ± 0.05 mm, 2.6 ± 0.01 mm, 77 ± 2%, and 14.1 ± 1.3%, respectively, whereas the values for ZJB were 6.63 ± 0.03 mm, 2.1 ± 0.01 mm, 1 ± 1%, and 0.17 ± 0.07%, respectively (Table 1). For the NILs, the milled rice GL and GW were in a nearly normal distribution (Figures 4A,B), and the distributions of the PGWC and DEC showed a nearly three-peak distribution (Figures 4C,D).
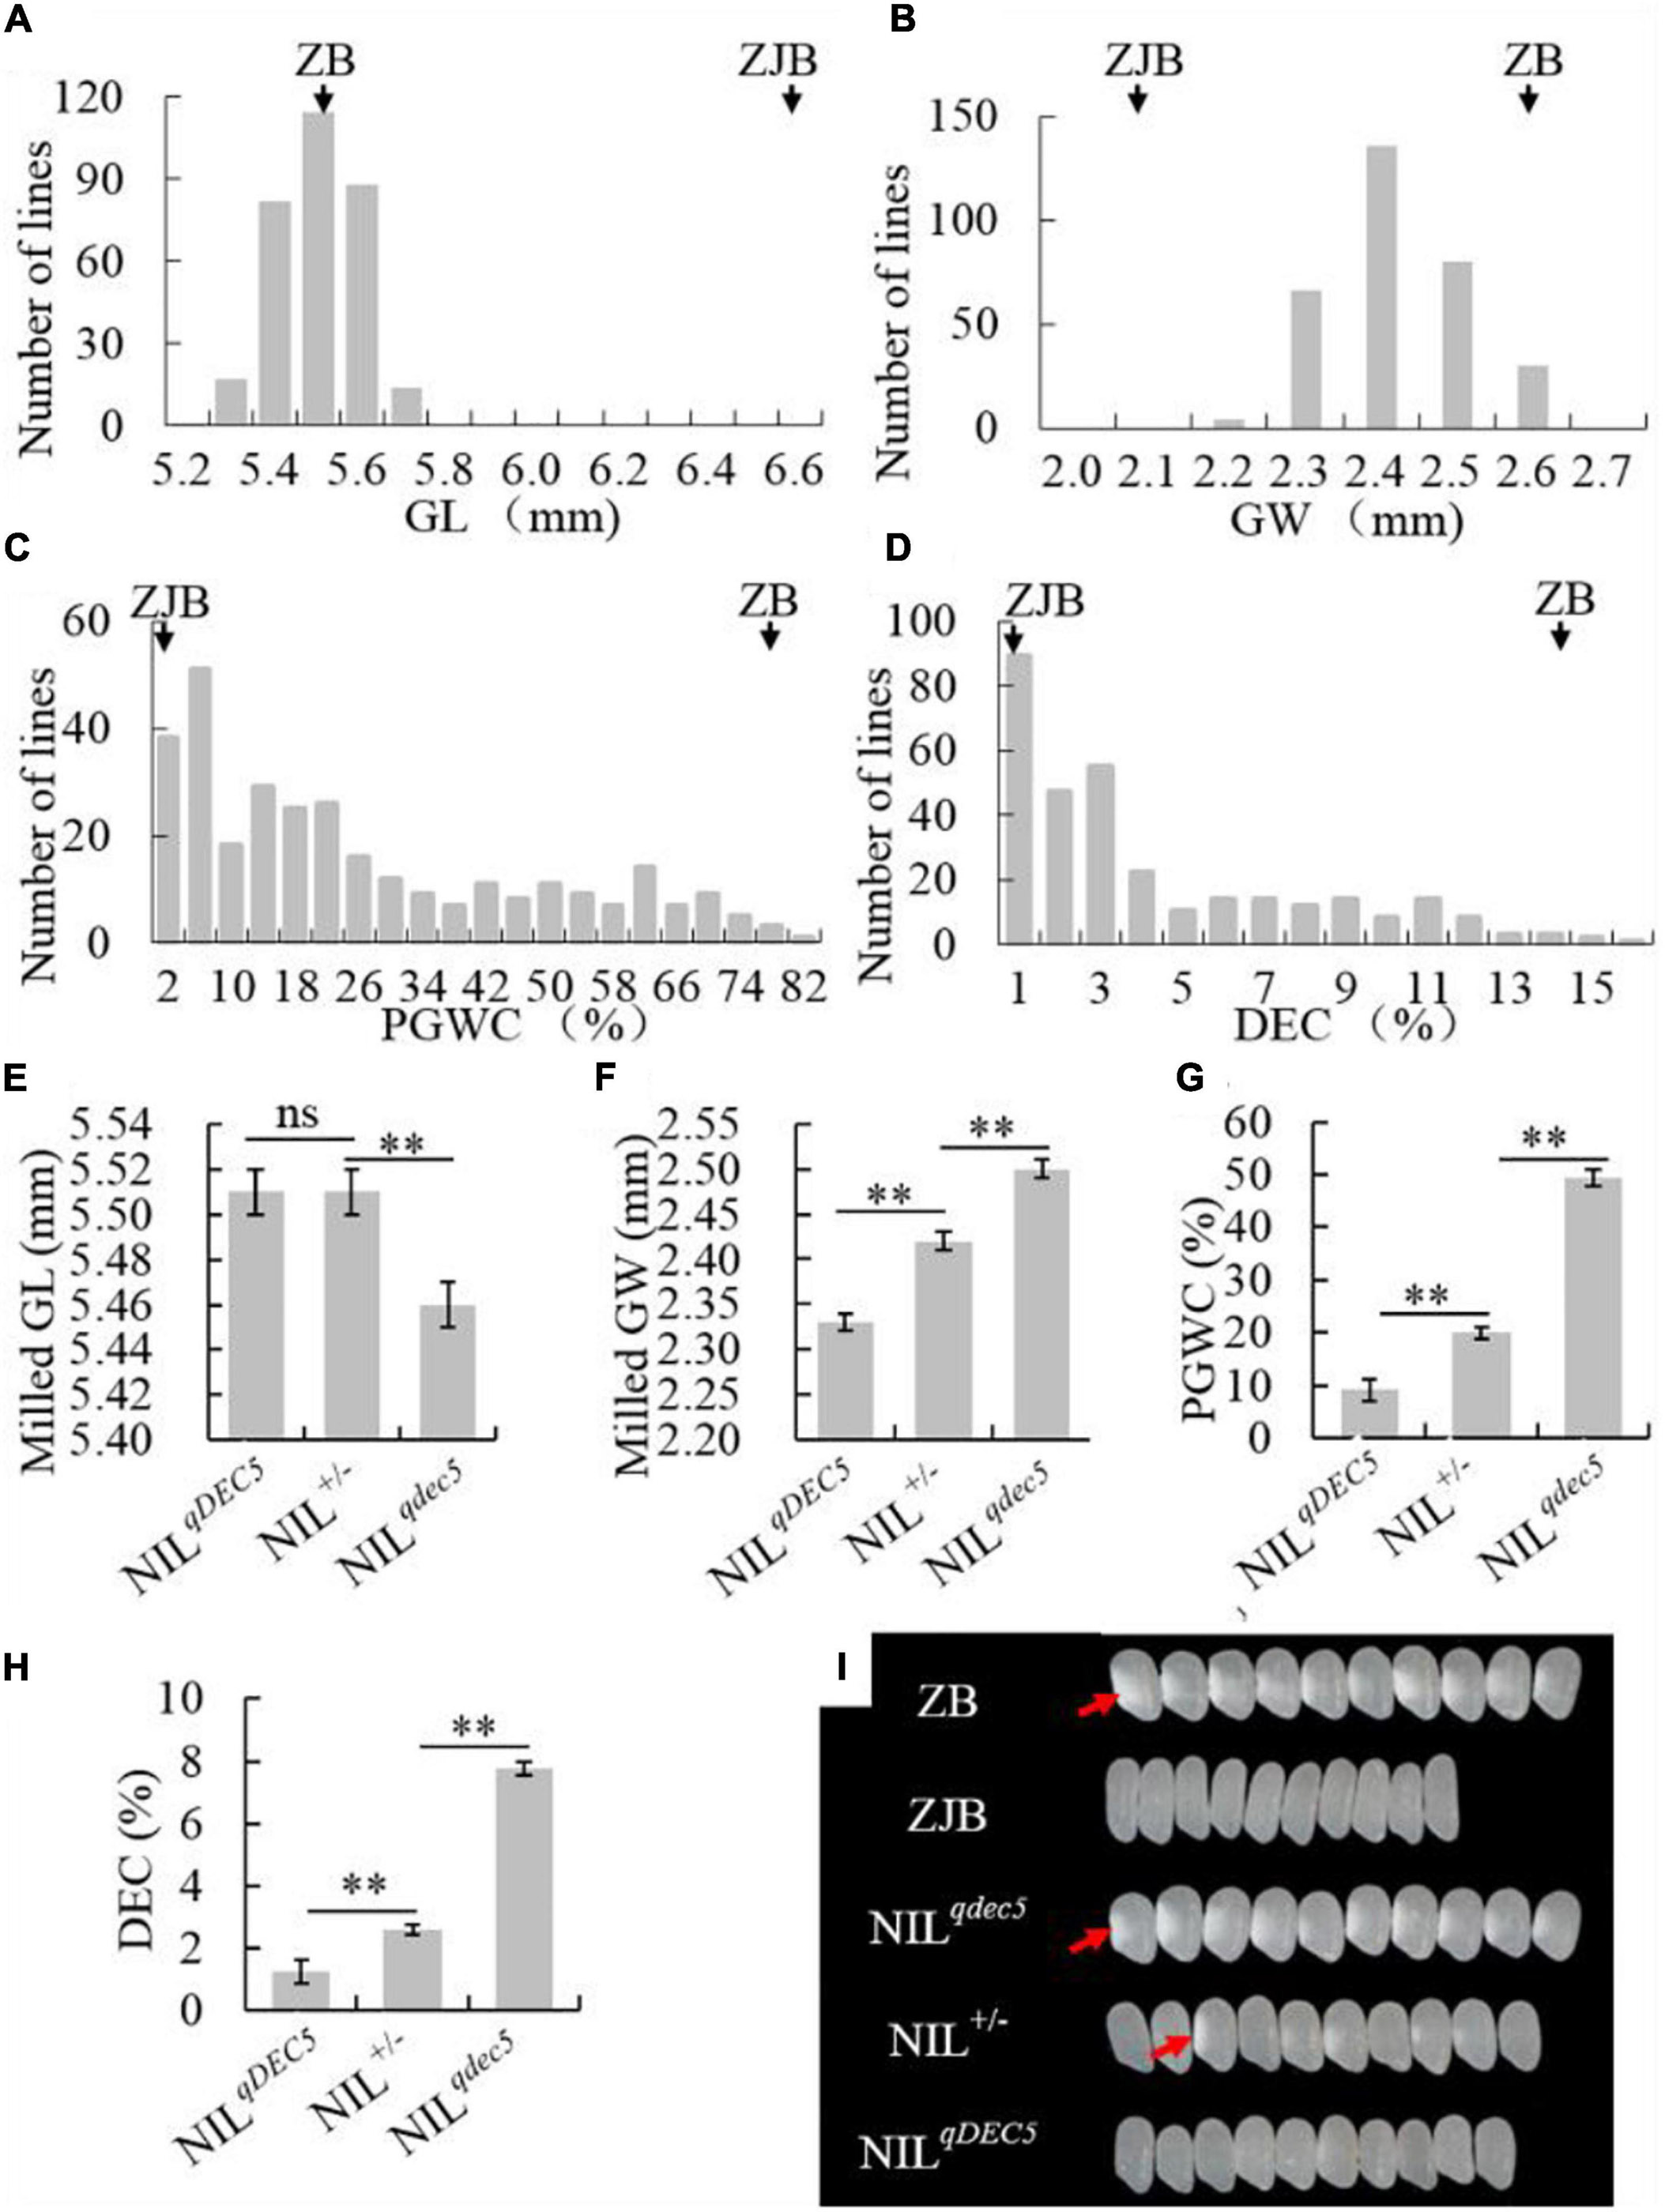
Figure 4. The phenotype and genetic characteristics of grain shape and chalkiness traits. The distribution of the GL (A), GW (B), PGWC (C), and DEC (D) traits in the NIL population. The average GL (E), GW (F), PGWC (G), and DEC (H) values for three different groups of NILs (NILqDEC5, NIL±, and NILqdec5), where ZJB and ZB represent Zhenjia B and Zhenshan 97B, respectively, ** denotes a difference at a very significant level, and ns represents no signification. (I) Images of milled rice grains of ZB, ZJB, and the three different types of NILs, where the white parts (red arrows) represent rice chalkiness.
The NILs were divided into three groups based on the GSE5/qDEC5 genotype. The first group (NILqdec5) included 89 lines whose qDEC5 genotype was from the ZB background. This group had milled rice GL, milled rice GW, PGWC, and DEC values of 5.46 ± 0.01 mm, 2.5 ± 0.01 mm, 49.48 ± 2.13%, and 7.76 ± 0.39%, respectively. The second group (NILqDEC5) included 76 lines whose qDEC5 genotype was from the ZJB background. This group had milled rice GL, milled rice GW, PGWC, and DEC values of 5.51 ± 0.01 mm, 2.33 ± 0.01 mm, 9.07 ± 1.58%, and 1.23 ± 0.24%, respectively. The third group (NIL±) included 151 lines whose qDEC5 genotype was heterozygous. This group had milled rice GL, milled rice GW, PGWC, and DEC values of 5.51 ± 0.01 mm, 2.42 ± 0 mm, 19.97 ± 1.04%, and 2.61 ± 0.16%, respectively (Figures 4E–H and Supplementary Table 12).
The milled rice GL was the same for the NIL± and NILqDEC5 lines but significantly different from the NILqdec5 lines. For the milled rice GW, PGWC, and DEC traits, the average values of each trait for the NIL± group were significantly different from those of the other two groups (the NILqDEC5 and NILqdec5 lines), as were the median values of the NILqDEC5 and NILqdec5 lines (Figures 4E–I and Supplementary Table 13). The above results showed that qDEC5 controls both the grain shape and chalkiness traits, and the milled rice GL trait exhibits dominant inheritance, while the milled rice GW, PGWC, and DEC traits exhibit semi-dominant inheritance.
Scanning Electron Microscopy Observations of the Endosperm Starch in Rice Grains
Scanning electron microscopy (SEM) observations of the transverse sections of whole-grain rice were carried out to understand the cell contour in the matured endosperm. In the non-chalky ZJB variety and the NILqDEC5 lines, the transverse section appeared quite neat and smooth (Figures 5A,B). In the high-chalkiness ZB variety and the NILqdec5 lines, the non-chalky region had a pattern similar to the non-chalkiness lines, but the chalky part was granular throughout the whole region with an unclear cell contour (Figures 5C,D).
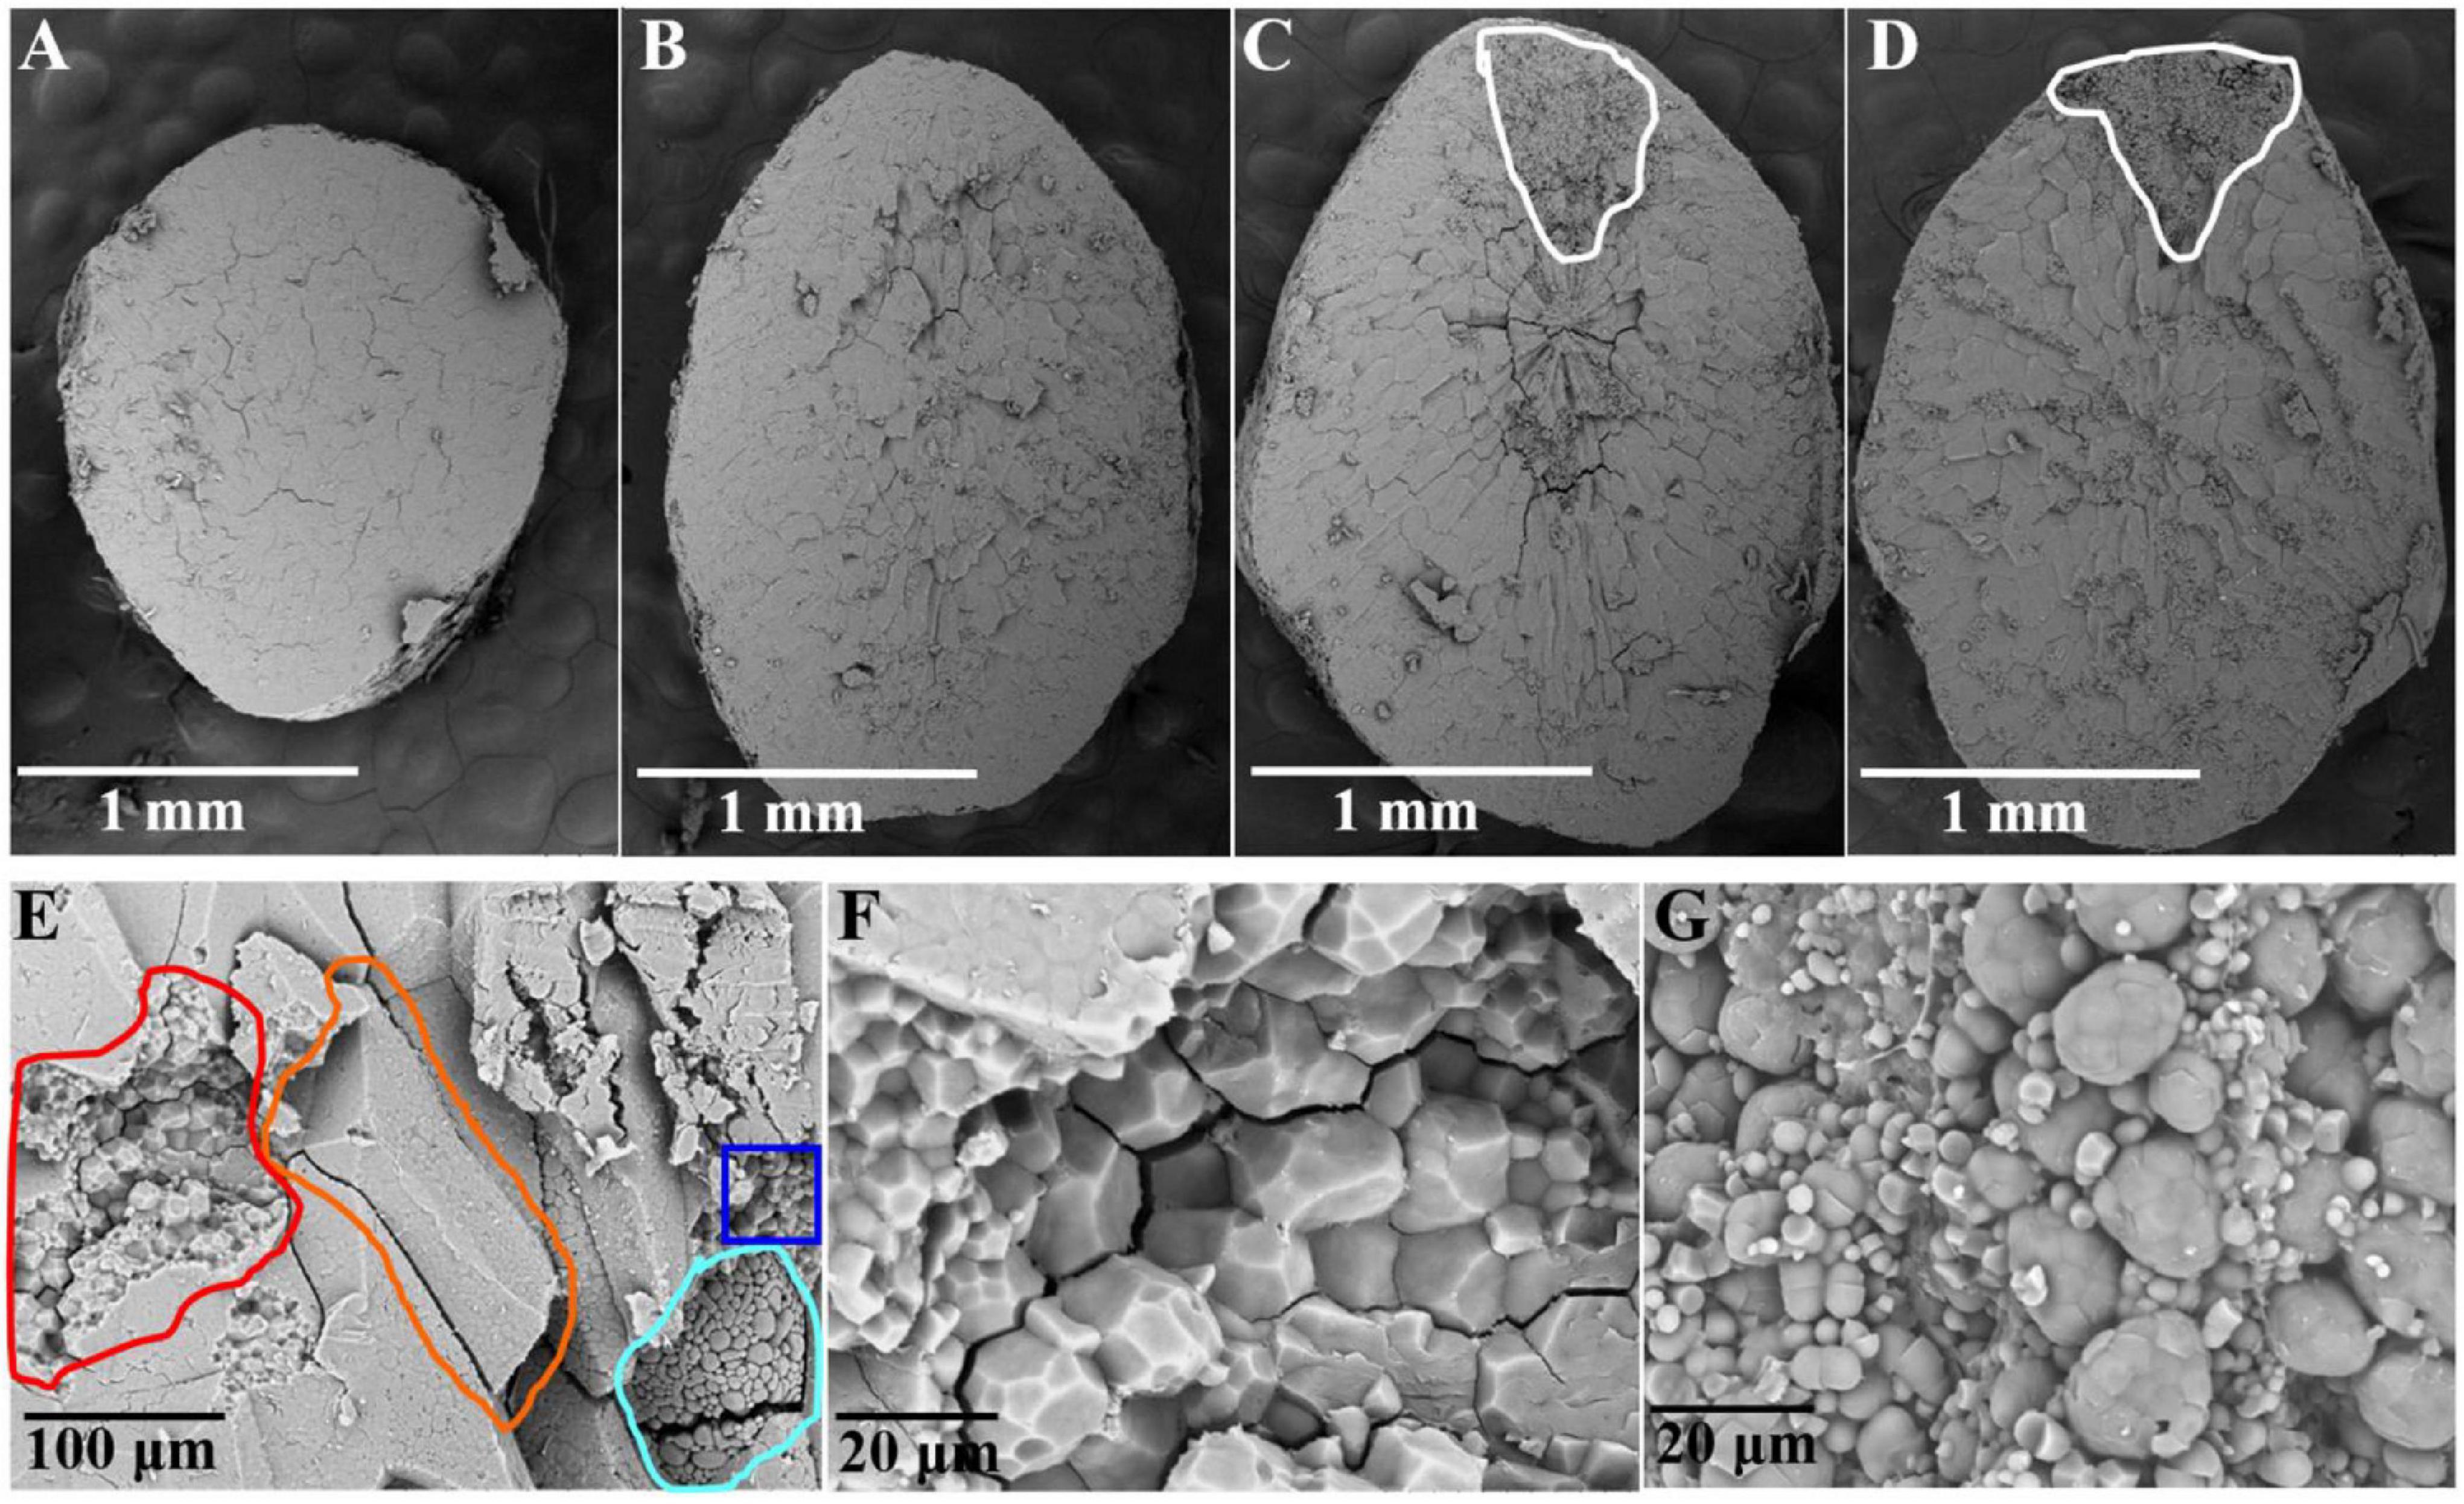
Figure 5. Transverse sections of the rice endosperm observed by SEM. Shown in panels (A–D) are whole transverse sections of a ZJB, NILqDEC5, NILqdec5, and ZB rice grains, respectively, as observed by SEM. The chalky part is located within the white circle (C,D). Panel (E) is a local cross-section of a ZB rice grain. The orange circle indicates one side of a whole starch cell in the non-chalky part, the red circle indicates the torn cell cross-section in the non-chalky part, the blue circle indicates one side of the whole cell in the chalky part, and the blue-purple circle indicates the torn cell cross-section in the chalky part. (F) Magnified image of some parts of the red circle in panel (E). (G) Magnified image of some parts of the blue-purple circle in panel (E).
For ZB, upon zooming in the local cross-section, the cell surface in the non-chalky part was smooth, and the cell had a polyhedral and angular shape, whereas the cell surface in the chalky part had a smoothly arched shape (Figure 5E). The transverse sections of torn cells were enlarged 2000 times for detailed observation. In the non-chalky part, the amyloplasts were rather uniform in size, polyhedral and angular in shape, and tightly packed, and very few exposed amyloplasts can be seen (Figure 5F). In contrast, in the chalky part, the amyloplasts were round or oval in shape and loosely packed. The large round granule (amyloplast) is composed of many small round granules, which are most likely exposed starch granules (Figure 5G). Thus, the most pronounced structural differences between the chalky and non-chalky parts of the endosperm were the composition and arrangement of the amyloplasts.
Time-Course Analysis of Some Genes Related to Chalkiness or Starch Biosynthesis During the Process of Seed Development by Quantitative Real-Time-PCR
To investigate whether some genes related to chalkiness or starch synthesis were regulated by GSE5/qDEC5, time-course experiments of 20 genes were performed at 5-time points (5, 10, 15, 20, and 25 days after pollination) during the process of seed development by means of quantitative real-time PCR (qRT-PCR) (Figure 6A and Supplementary Table 7). At 5 DAP, the expression levels of GSE5, OsSSI, OsSSIIa, OsSSIVb, OsFLO2, OsFLO6, OsEnS-51 (Oryza sativa endosperm-specific gene 51), ISA (Oryza sativa isoamylase), and OsRab5a (small GTPase Rab5) were lower in NILqDEC5 lines with the GSE5ZJB haplotype than in ZB with the GSE5ZB haplotype, while the expression levels of OsWx (Oryza sativa waxy), Chalk5, OsGW2, OsAmy3A (Oryza sativa alpha-amylase isozyme 3A), FLO4, OsFLO5, OsEnS-57, G6PIb (glucose-6-phosphate isomerase, cytosolic b), OsSUS3 (Oryza sativa rice sucrose synthase 3), OsGIFI (Oryza sativa grain incomplete filling 1), and OsAPL2 (Oryza sativa ADP-glucose pyrophosphorylase large subunit 2) showed no difference between the two haplotypes, and no upregulated gene was found (Figure 6B). At 10 DAP, the expression levels of GSE5, OsSSIVb, OsFLO2, OsEnS-51, and ISA increased in NILqDEC5 and exceeded those in ZB, and only OsSSIIa still showed lower expression; the expression levels of OsGW2 and FLO4 decreased, while that of OsEnS-57 markedly increased in NILqDEC5 (Figure 6B).
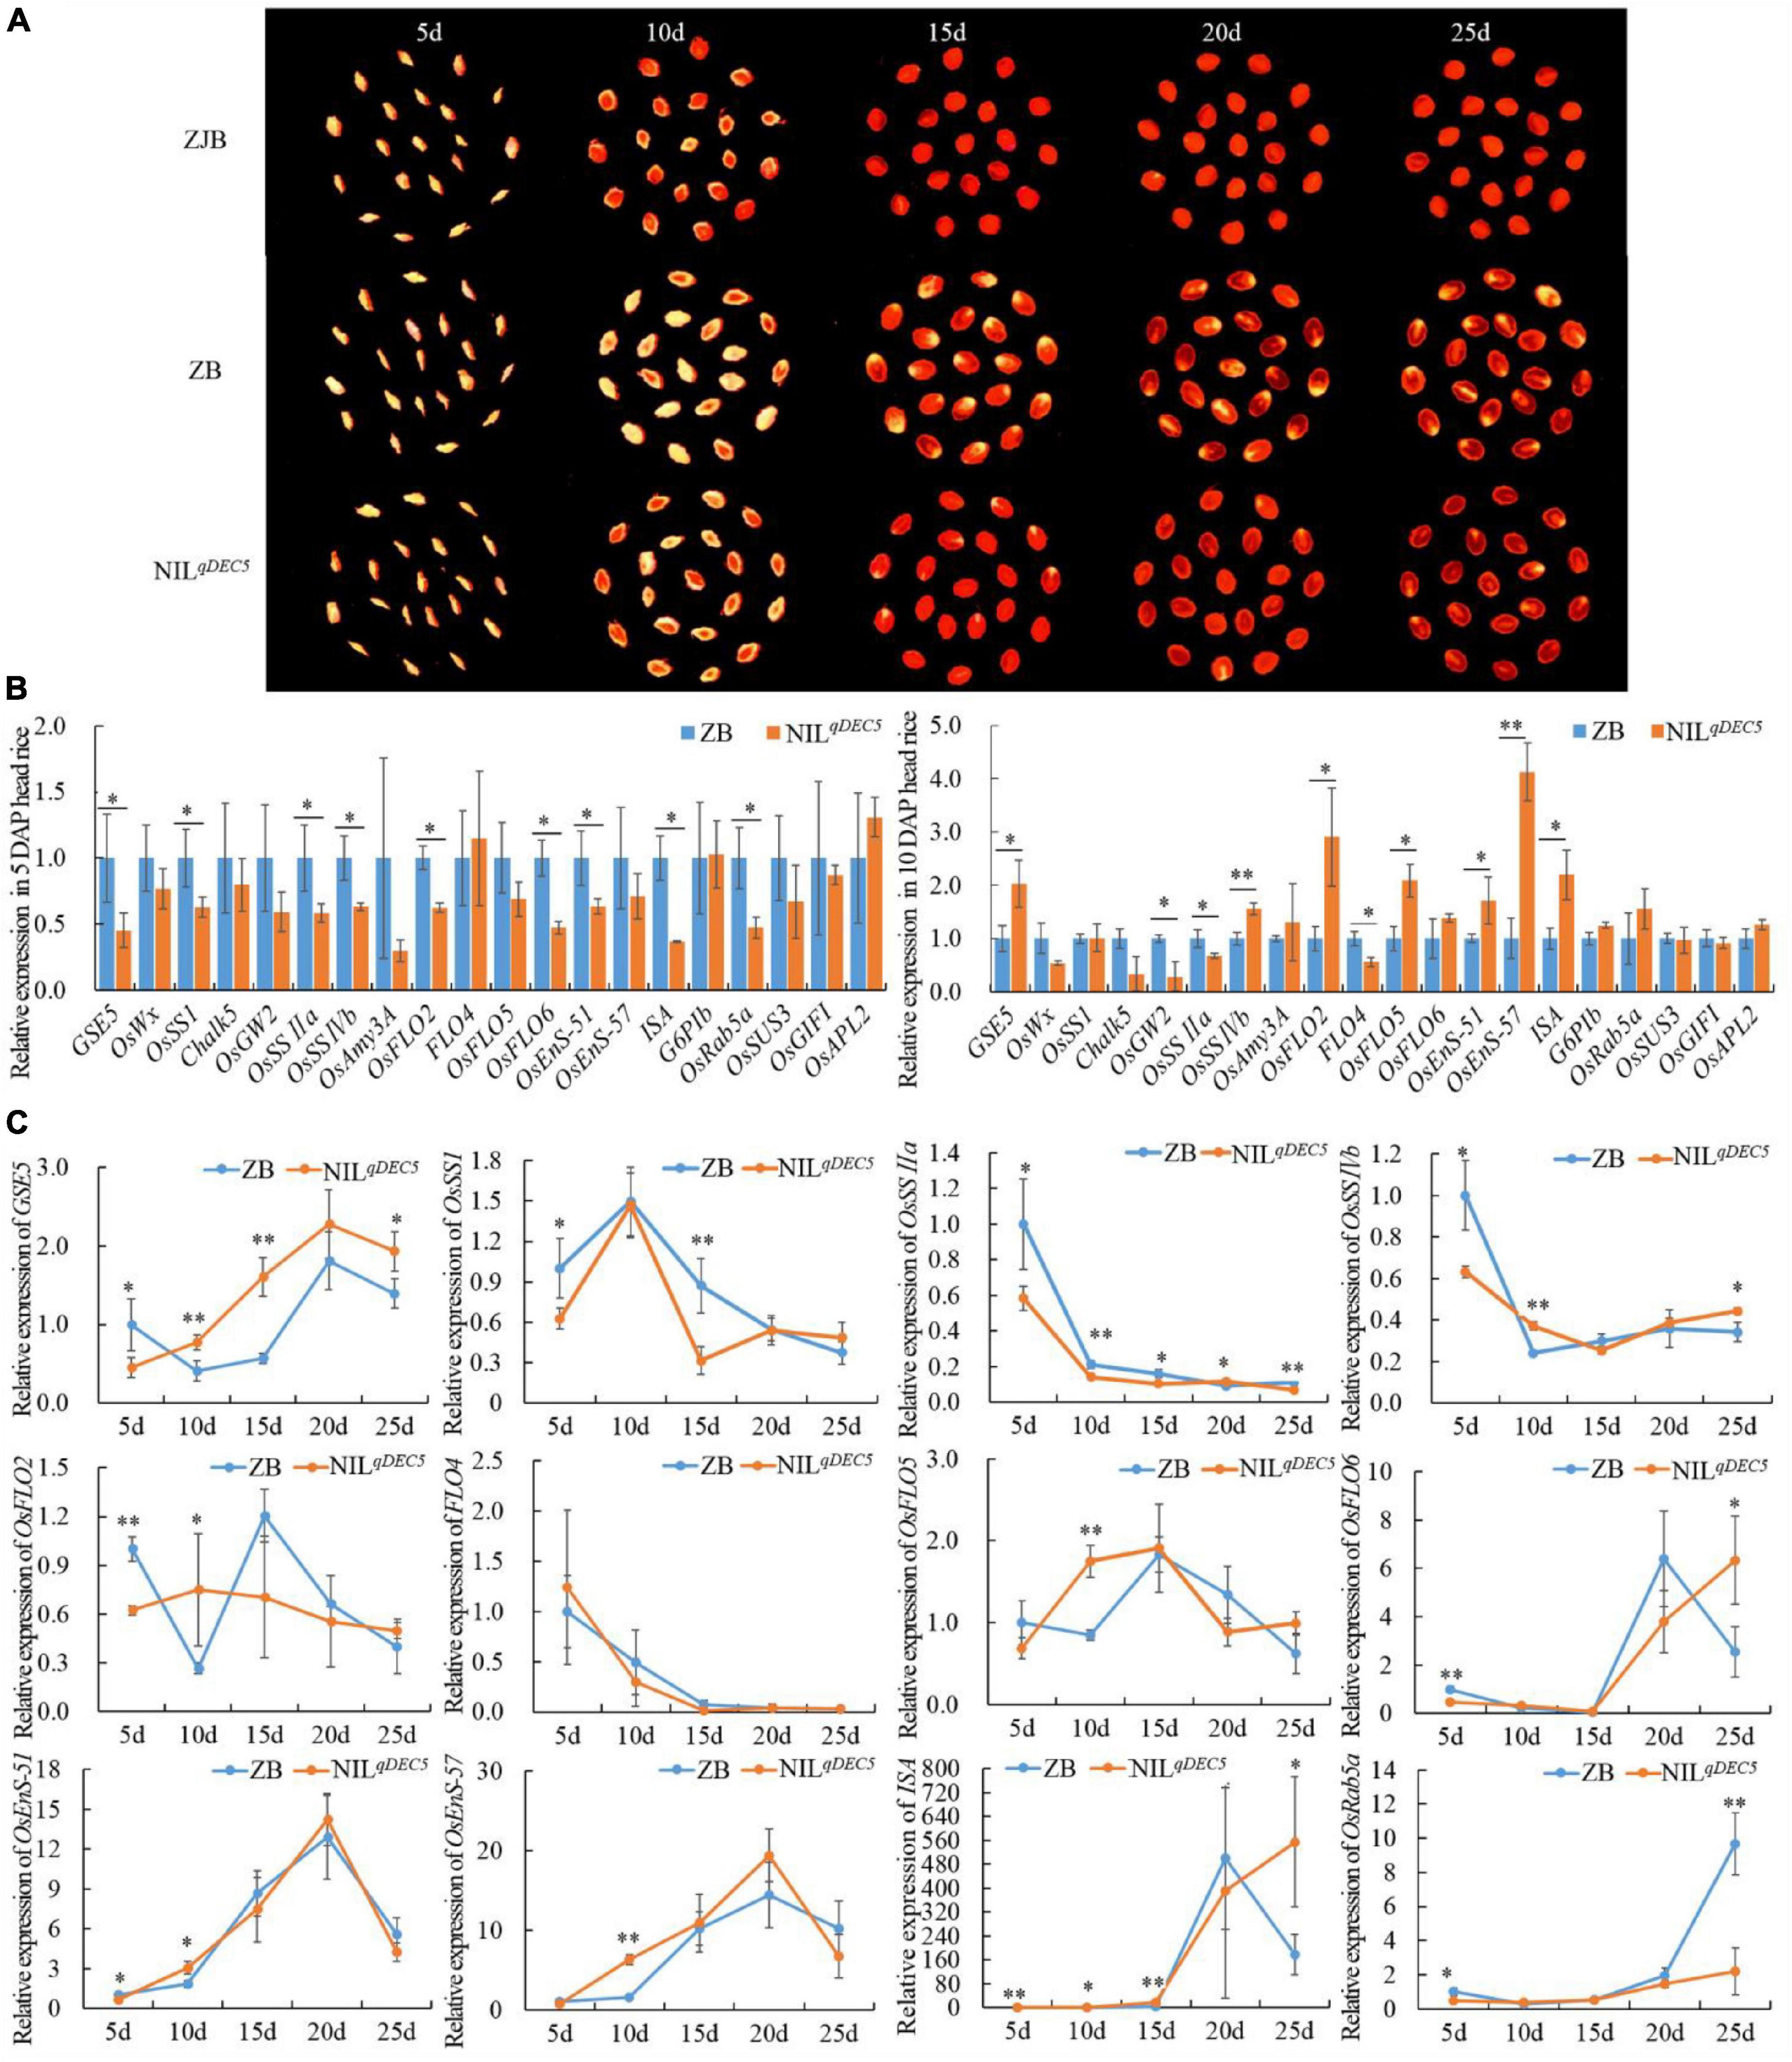
Figure 6. The dehulled developing caryopsis and the relative expression of GSE5 and genes related to chalkiness or starch metabolism during the process of seed development. (A) The dehulled caryopsis cross-section of ZJB, ZB, and NILqDEC5 at different developmental stages was obtained by the negative scan function of the HP ScanJet G4050 scanner. The yellowish-white spot is the floury or chalky part in the endosperm. (B) The relative expression levels of genes related to chalkiness or starch biosynthesis during the process of seed development. ZB expression represents 1. (C) Time course analysis of genes’ expression during the process of seed development. ZB expression at 5 DAP represents 1. Significance was determined by analysis of variance (ANOVA) (*P < 0.05 and **P < 0.01). Error bar shows the SD (n = 3); DAP, day after pollination.
Twelve of the 20 genes showed different expression levels between ZB and NILqDEC5 at 5 DAP or 10 DAP, and then the expression dynamics of these 12 genes were processed at 5-time points during the process of seed development. At the same time, two main expression patterns were found in the GSE5ZJB and GSE5ZB haplotypes. The first pattern was that the expression levels of GSE5, OsFLO6, OsEnS-51, OsEnS-57, and ISA showed a trend from low to high during the first 20 days of seed development; then, those of GSE5, OsEnS-51, and OsEnS-57 decreased quickly (Figure 6C). At 5 DAP, the expression level of GSE5 in ZB was significantly higher than in NILqDEC5; however, those at 10, 15 and 25 DAP were significantly or extremely significantly lower. The expression levels of OsFLO6 and ISA at 25 DAP decreased rapidly in ZB, but in NILqDEC5, their expression levels continued to increase. The second pattern was that OsSSI, OsSSIIa, OsSSIVb, and FLO4 showed a trend with high expression levels in the early stage of seed development and low levels in the following stage. The expression levels of OsSSIIa at 5, 10, 15, and 25 DAP in NILqDEC5 were all lower than those in ZB (Figure 6C).
Transcriptomics Analysis of Dehulled Developing Caryopsis
Transcriptional profiles facilitate studies of regulatory networks related to chalkiness in the developing caryopsis. Comparative RNA-Seq-based transcriptomics analysis of dehulled developing caryopsis was conducted at 10 DAP and 15 DAP on ZB and NILqDEC5 (BC7S3). This study revealed 194 and 132 DEGs at the two developmental stages, respectively. The DEGs were involved in various biological processes (regulation of transcription, protein folding, sucrose metabolic process, cellulose biosynthetic processes, carbohydrate metabolic process, oxidation-reduction process, and chitin catabolic process), cellular components (vacuole, mitochondrial matrix, integral component of plasma membrane, and vacuolar membrane) and molecular functions [unfolded protein binding, beta-galactosidase activity, aldehyde dehydrogenase (NAD) activity, sucrose synthase activity, DNA binding, cellulose synthase (UDP-forming) activity, and carbohydrate-binding] based on GO enrichment analysis (Figure 7A). According to the Kyoto Encyclopedia of Genes and Genomes (KEGG) database, the most abundant category was classified as being involved in carbon metabolism (31.7 and 21% of the total annotated DEGs at 10 and 15 days, respectively). The second most abundant class consisted of genes related to amino acid metabolism and protein synthesis, assembly, and degradation (14.6 and 14.5% of the total annotated DEGs at 10 and 15 days, respectively).
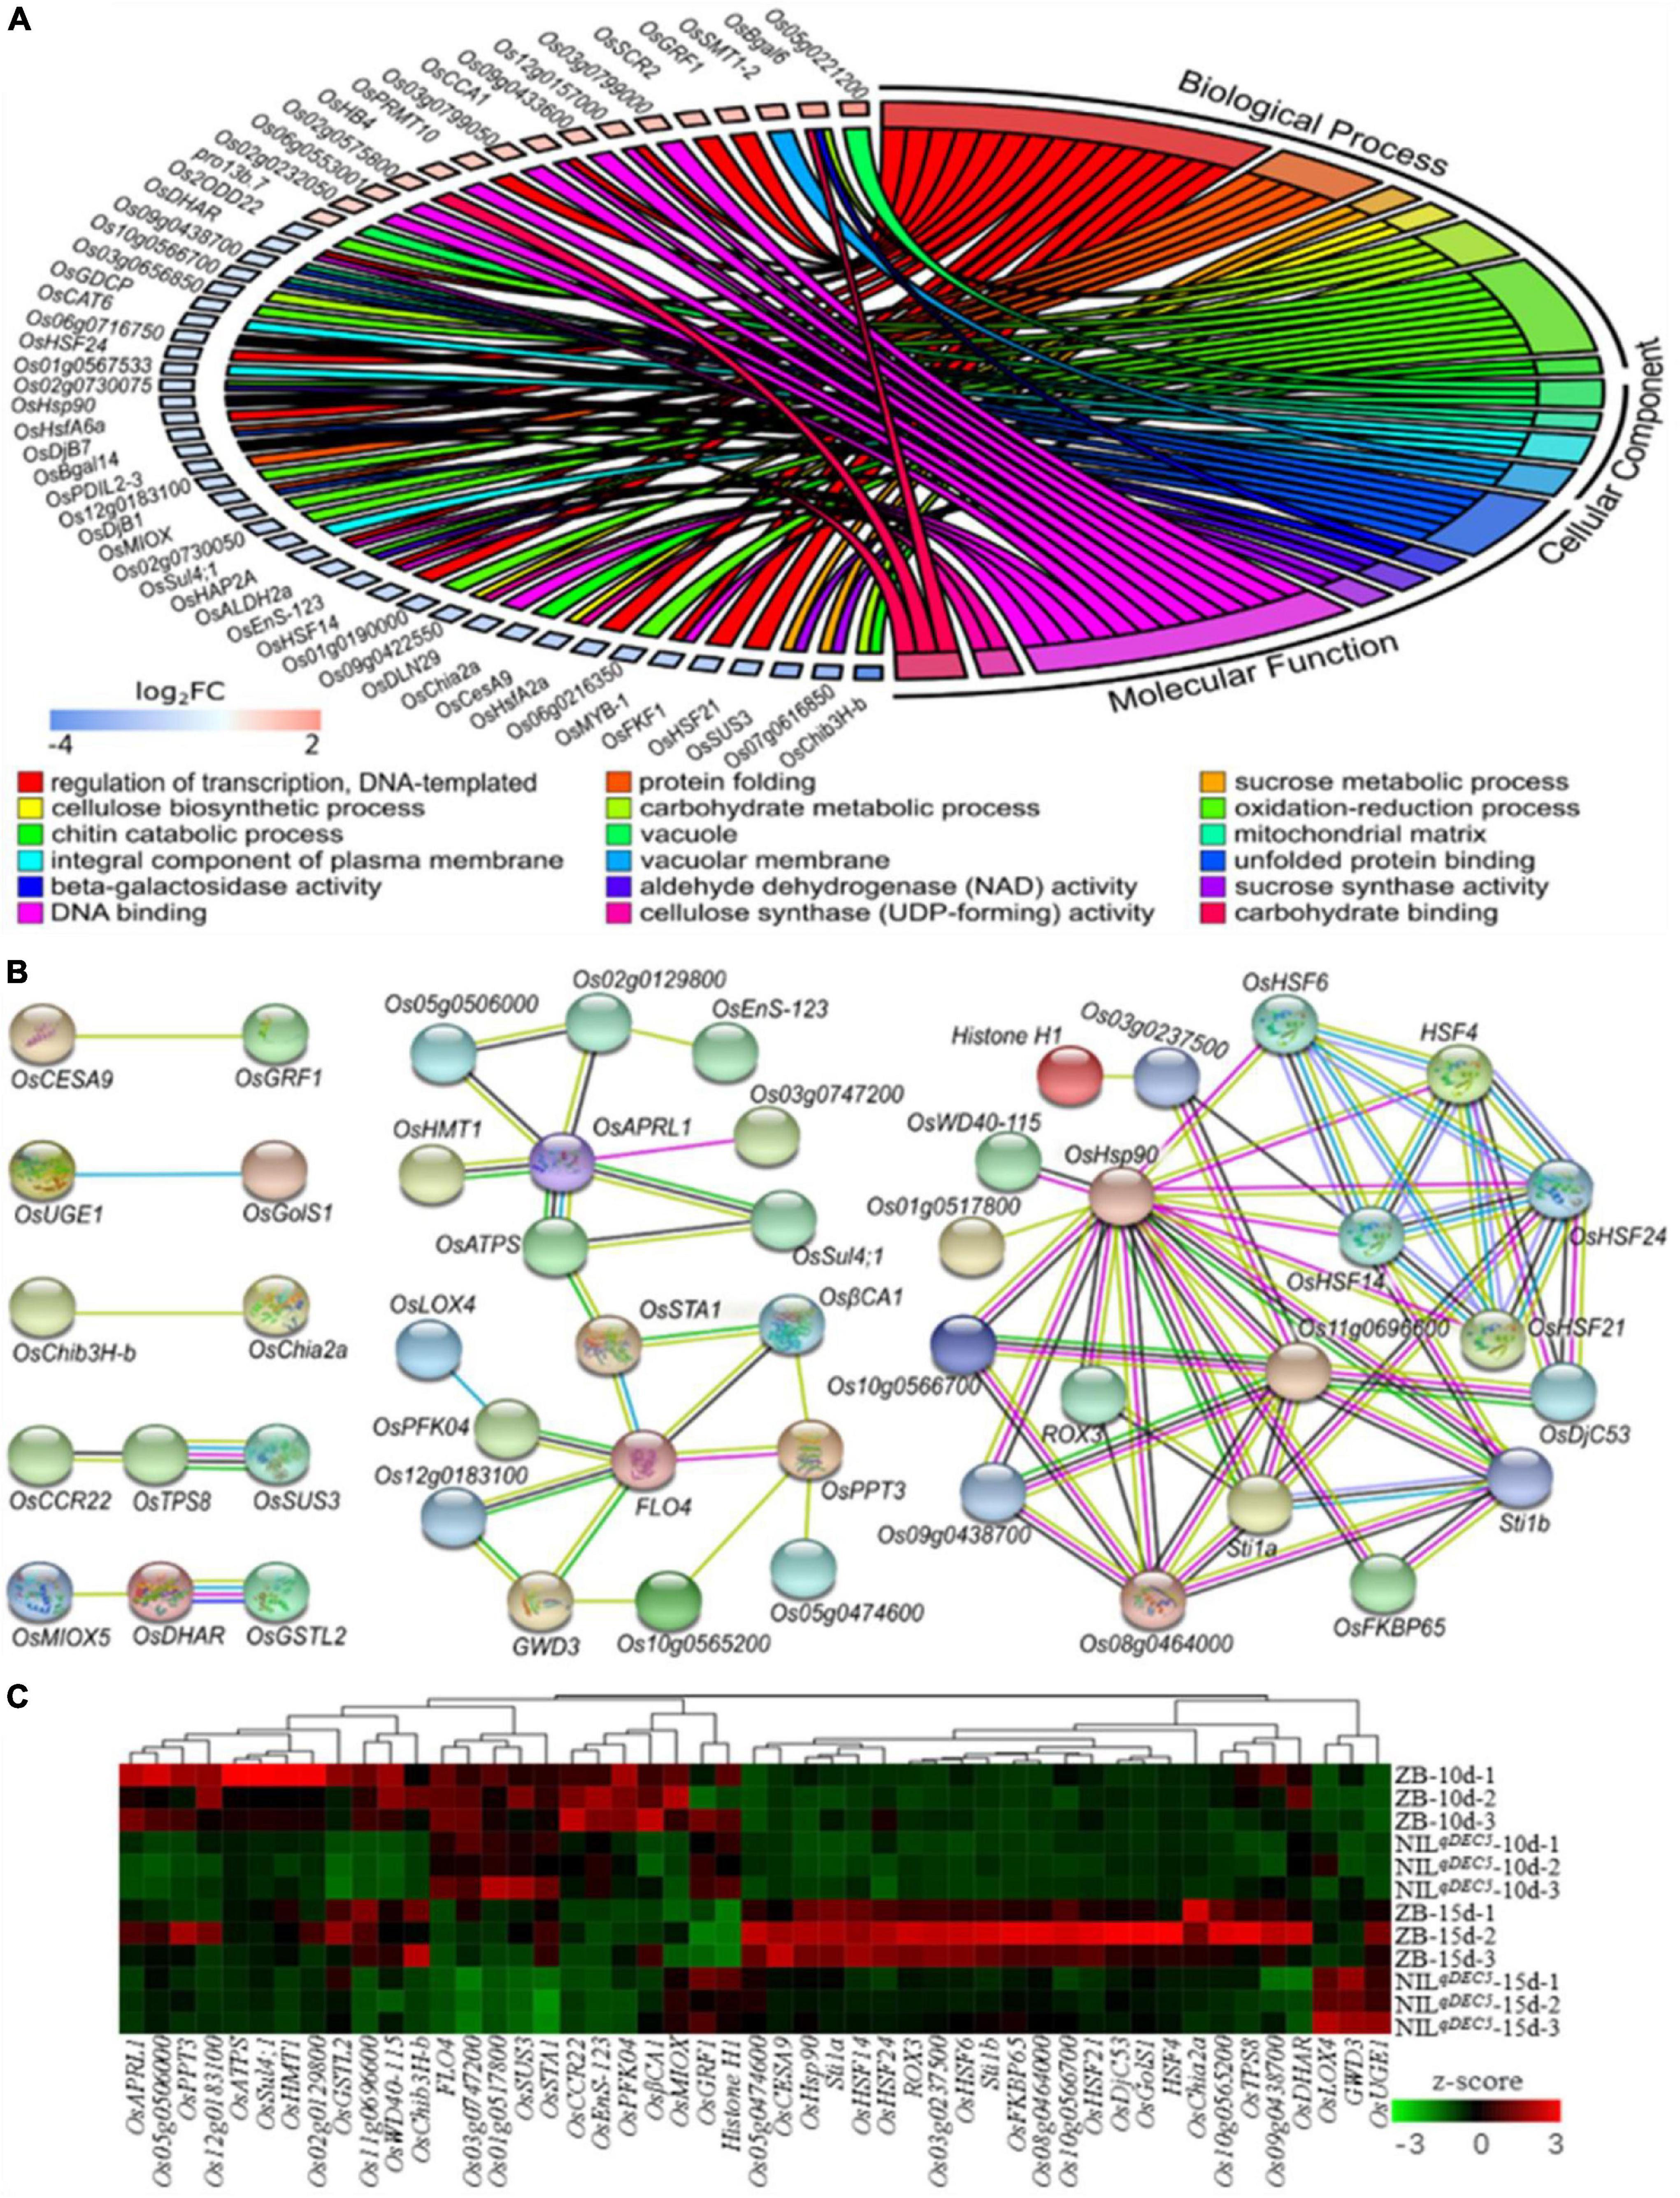
Figure 7. DEGs from the transcriptomic analysis. (A) GO enrichment results of DEGs. (B) The interaction network of DEGs. DeepSkyBlue1 line, from curated databases; DeepPink3 line, experimentally determined; Green line, gene neighborhood; Blue line, gene co-occurrence; OliveDrab3 line, text mining; black line, co-expression; MediumSlateBlue line, protein homology. (C) Hierarchical clustering analysis heat map of the average relative expression levels.
Protein-protein interaction analysis was carried out based on the STRING database to develop the interaction networks between the DEGs. The interaction networks can be mainly divided into two groups (Figure 7B). The 29 genes in the first group are probably involved in carbohydrate metabolisms, such as GWD3 (similar to Phosphoglucan, water dikinase), FLO4, OsSTA1 (putative phosphoenolpyruvate carboxylase), OsPFK04 (pyrophosphate-dependent phosphofructo-1-kinase, phosphofructokinase 4), OsCESA9 (cellulose synthase A catalytic subunit 9), OsSUS3, OsUGE1 (UDP-glucose 4-epimerase 1), and OsMIOX (myo-inositol oxygenase). GWD3 mediates the incorporation of phosphate into starch-like phospho-alpha-glucan and may be required for starch degradation. FLO4 participates in starch metabolism and modulation of carbon flow for starch and lipid biosynthesis during grain filling. OsSTA1, OsPFK04, OsCESA9, OsSUS3, and OsUGE1 are involved in different pathways of carbohydrate metabolism. OsMIOX encodes an inositol oxygenase and is involved in the biosynthesis of UDP-glucuronic acid (UDP-GlcA). The 19 genes in the second group are involved in heat stress, such as heat stress transcription factors (HSF4, OsHSF6, OsHSF14, OsHSF21, and OsHSF24) and heat shock proteins (OsHSP90, OsDjC53, Os08g0464000, and Os11g0696600).
A hierarchical clustering analysis heat map of the average relative expression levels (log2 ratio) of 49 genes in the gene interaction net was generated. The results showed four main clusters; the genes, including OsAPRL1 (adenosine 5′-phosphosulfate reductase-like protein 1), OsGSTL2 (lambda class glutathione S-transferase 2), and Os11g069660, in the first cluster expressed lower in NILqDEC5 at both 10 and 15 DAP, those (including FLO4, OsSUS3, and OsPFK04) in the second cluster were highly expressed at 10 DAP and weakly expressed at 15 DAP; those (such as OsHSP90, OsHSF14, and OsDjC53) in the third cluster showed high expression in ZB at 15 DAP; and the three genes (OsLOX4, GWD3, and OsUGE1) in the fourth cluster were highly expressed only in NILqDEC5 at 15 DAP (Figure 7C). Most genes related to heat shock proteins and heat shock transcription factors were clustered in the third cluster (Figure 7C).
Proteomics Analysis of Dehulled Developing Caryopsis
To further understand the protein profiles in connection with chalkiness formation in the developing caryopsis, two-dimensional electrophoresis (2-DE) and MALDI-TOF/MS analysis were conducted in rice dehulled developing caryopsis of ZB, ZJB, NILqdec5, and NILqDEC5 (BC7S2) at 6, 12, 18, and 24 days. Approximately 800 protein spots were repeatedly detected in every 2-DE map (Figure 8). Four protein spots (D11, D33, D19, and D20) showed differences both between the parents (ZB and ZJB) and between the two NILs (NILqdec5 and NILqDEC5) at the same time. D11 was found in the four stages, D33 was found in the late three stages, and D19 and D20 were found in the middle two stages (Figure 8). These four spots were successfully identified as 36 differentially expressed proteins (DEPs), mainly including the proteins related to starch synthase (OsSSI, OsFLO6, and OsWx) and heat shock (OsHSP70, OsBiP2, OsBiP3, and OS08T0487800) (Figures 9A,B). OsSSI, OsFLO6, and OsWx are a starch synthase I, a CBM48 domain-containing protein, and a granule-bound starch synthase 1, respectively, all of which are involved in starch biosynthesis. These 36 proteins are involved in various biological processes (such as starch biosynthetic process, cellular process, protein metabolic process, and chromatin organization) (Figure 9C), cellular components (such as amyloplast, cell, chloroplast, and intracellular membrane-bounded organelle), and molecular functions [such as starch synthase activity, glycogen (starch) synthase activity, carbohydrate derivative binding, and heterocyclic compound binding] (Figure 9D).
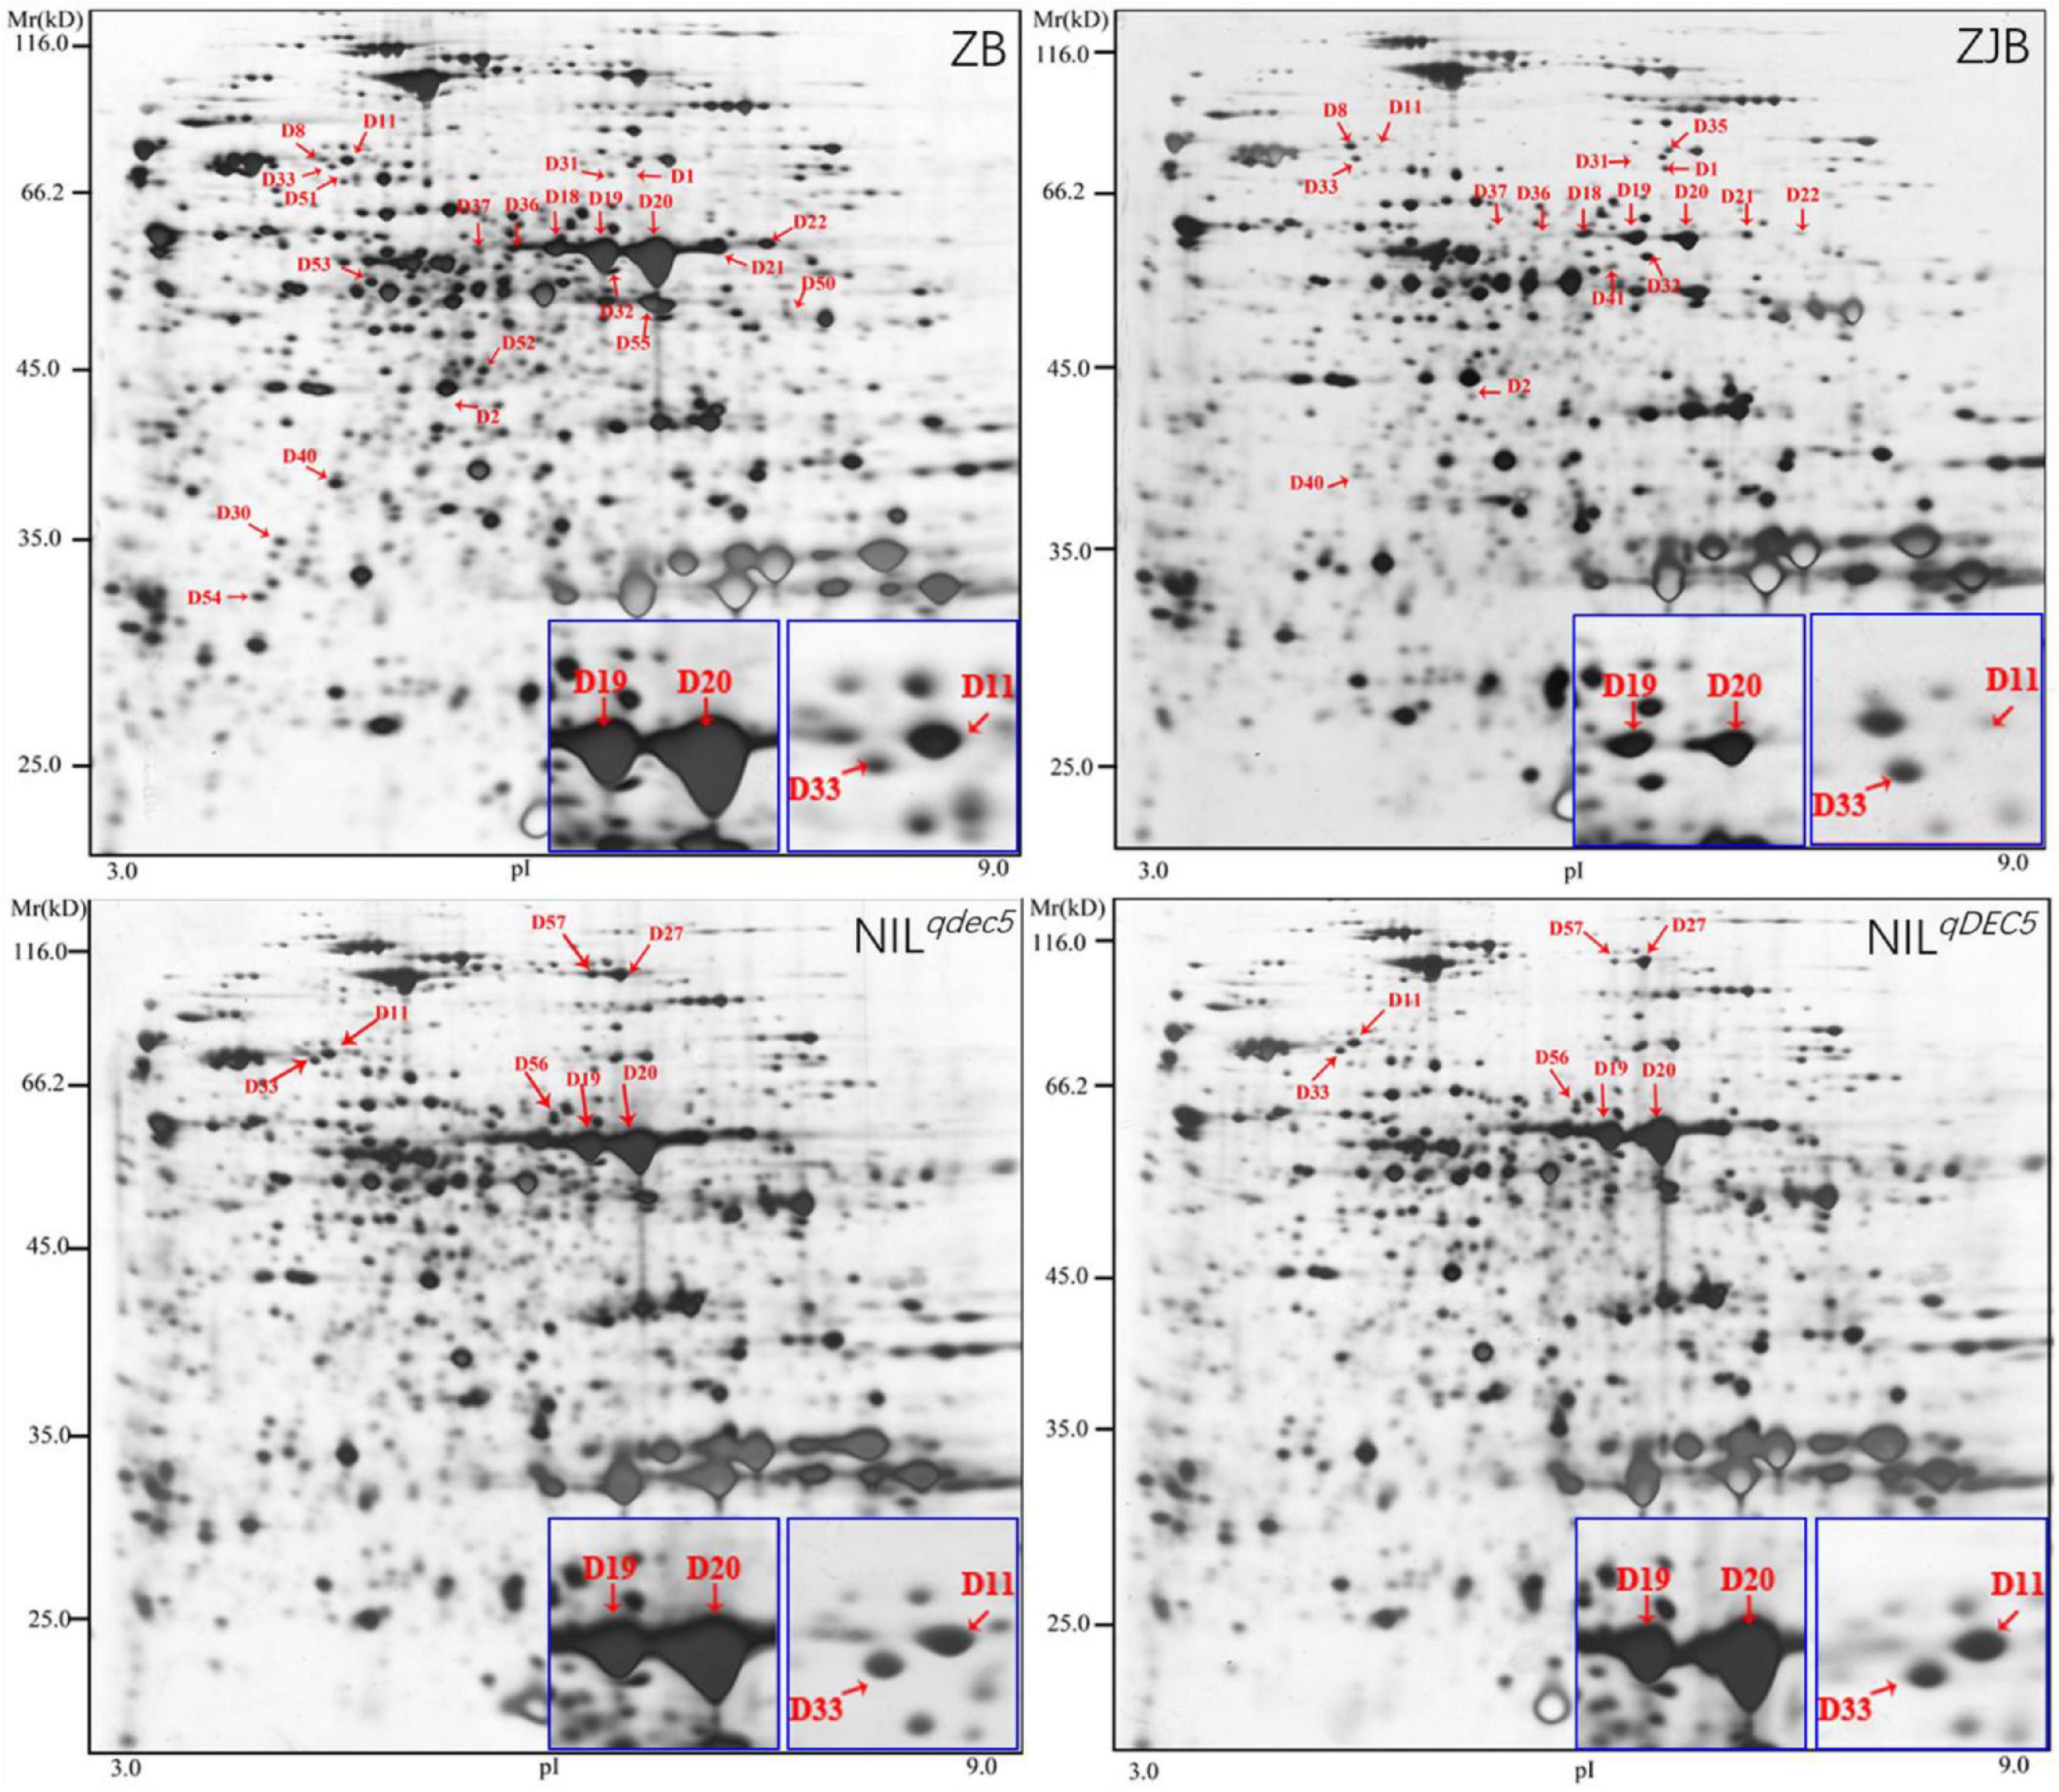
Figure 8. 2-DE maps at 12 DAP. Red arrows indicate the positions of protein spots showing differential expression. The blue box is an enlarged view of the corresponding protein spots in the maps.
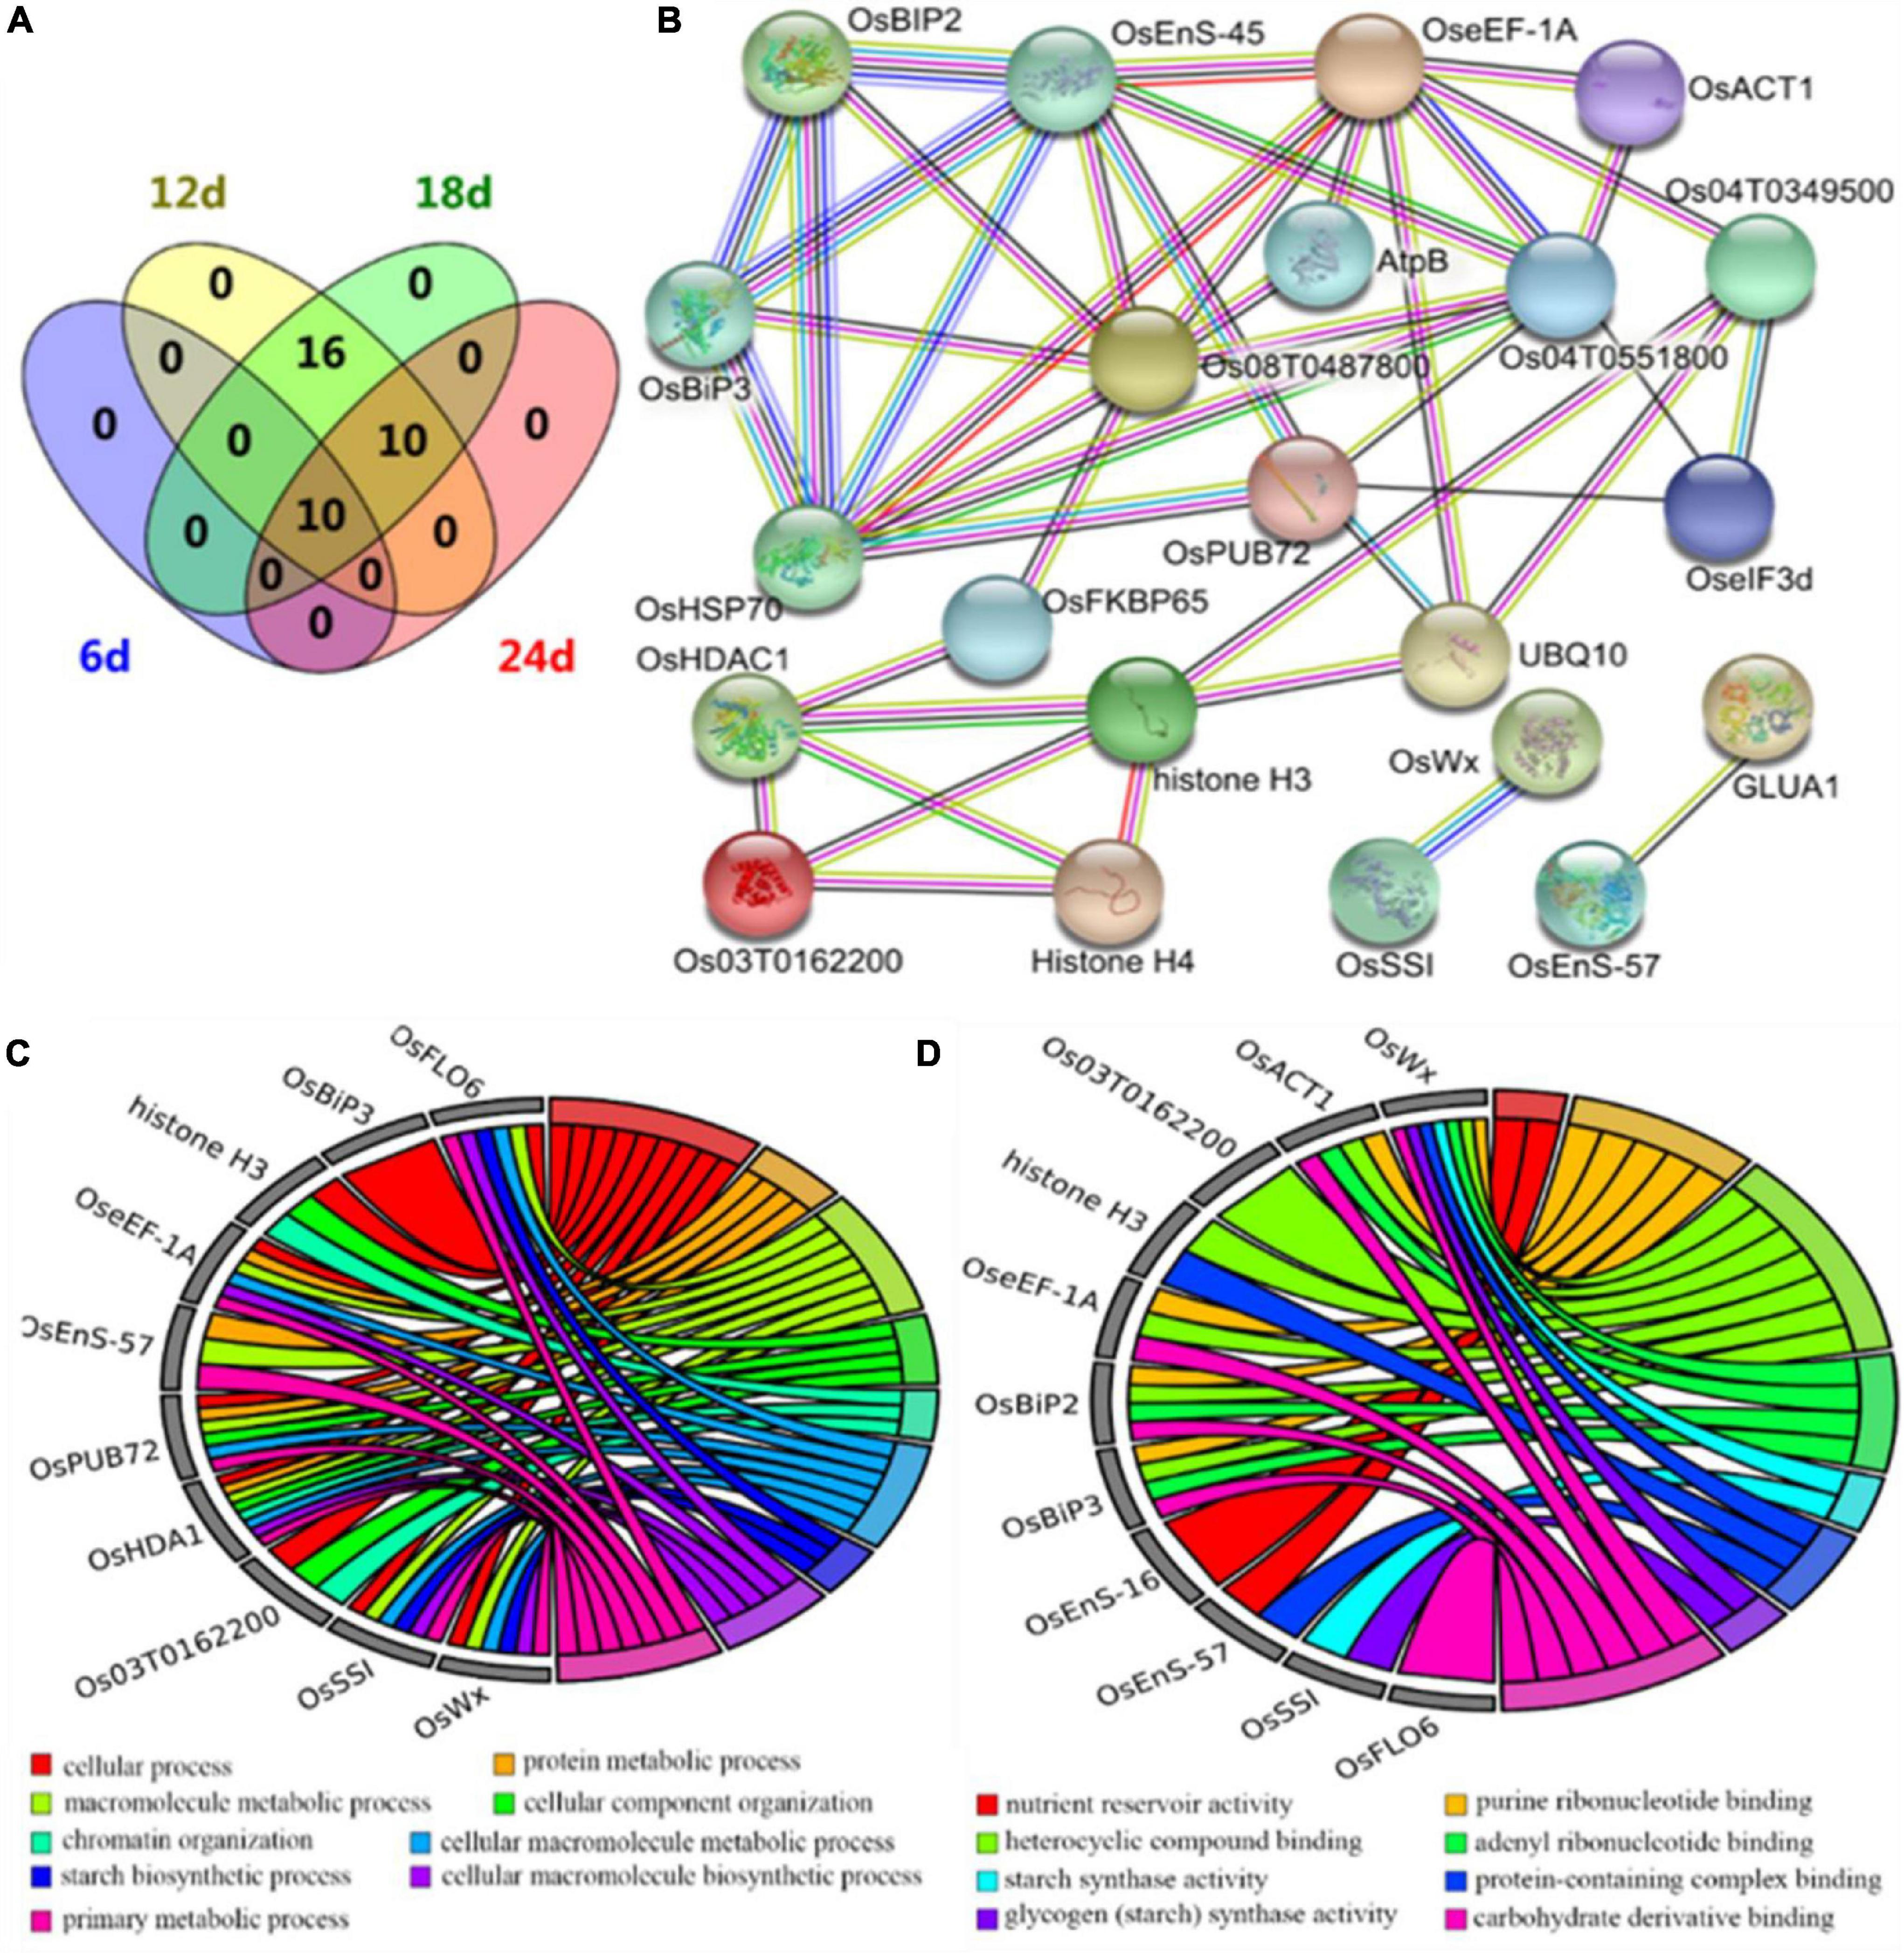
Figure 9. Differentially expressed proteins from proteomics analysis. (A) Venn diagram of differentially expressed proteins. (B) The interaction network of differentially expressed proteins. DeepSkyBlue1 line, from curated databases; DeepPink3 line, experimentally determined; Green line, gene neighborhood; Red line, gene fusions; Blue line, gene co-occurrence; OliveDrab3 line, text mining; black line, co-expression; MediumSlateBlue line, protein homology. (C) Biological process enrichment map from GO analysis. (D) Molecular function enrichment map from GO analysis.
Differentially Expressed Genes Associated With Carbohydrate Metabolism
The low-chalkiness lines showed higher amino sugar and nucleotide sugar metabolism at 10 DAP and lower carbohydrate metabolism at 15 DAP. In the above omics analysis, 27 DEGs related to carbohydrate metabolism were identified. These genes were directly involved in starch synthesis and hydrolysis, cell wall biogenesis, glycolysis, pentose phosphate pathway, monosaccharide and oligosaccharide synthesis, gluconeogenesis, and the TCA cycle (Figure 10A). On the other hand, 22 DEGs were identified in the transcriptomic analysis, two in the proteomics analysis, and five in the time course analysis by qRT-PCR.
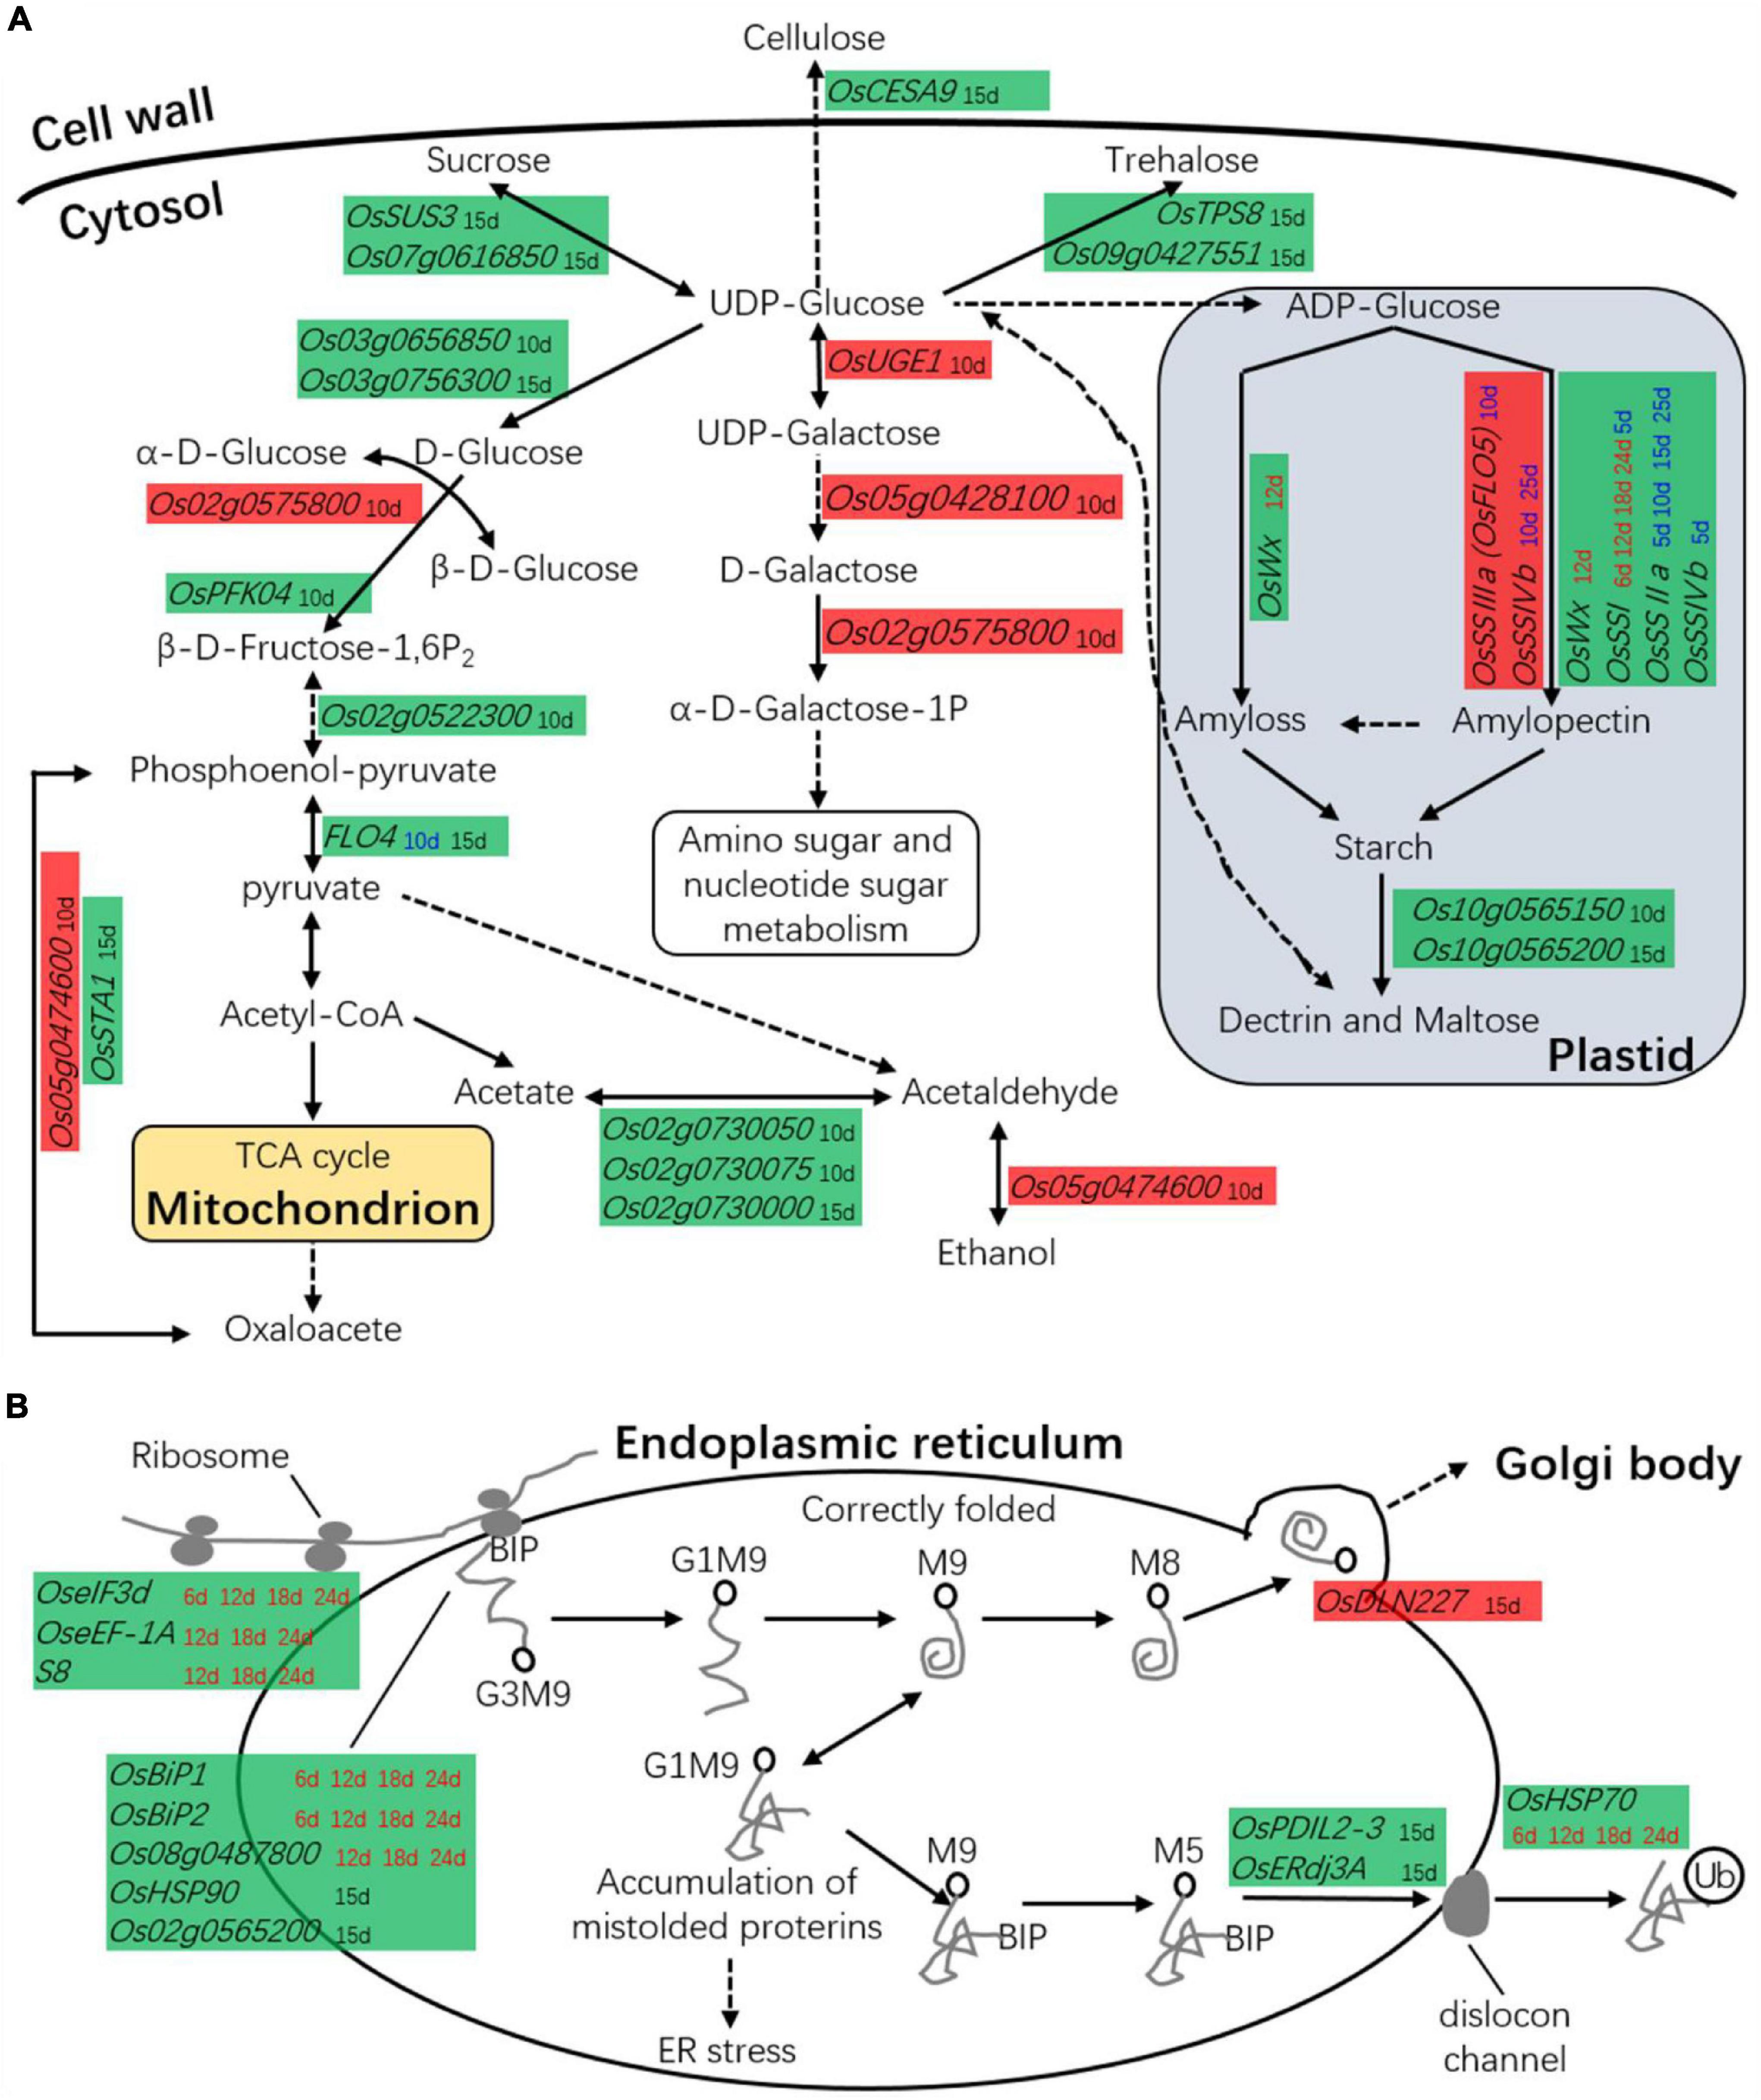
Figure 10. The DEGs in carbon or protein metabolism. (A) DEGs are associated with carbohydrate metabolism. (B) DEGs are associated with protein metabolism. Red background box, the gene was upregulated in low-chalkiness lines; Green background box, the gene was downregulated in low-chalkiness lines; The time spots in different colored letters indicate DEGs from different sources; Black font, the DEGs from transcriptomic analysis; Red font, the DEGs from proteomics analysis; Blue font, the DEGs from time-course analysis by qRT-PCR. Solid lines represent one-step reactions, dotted lines represent multistep reactions, and arrows denote the reaction direction.
Transcriptomic analysis showed from UDP-Glucose to α-D-Galactose-1P, OsUGE1, Os05g0428100, and Os02g0575800 were upregulated in the low-chalkiness lines at 10 DAP. In other monosaccharide and oligosaccharide synthesis, most DGEs, including OsSUS3, OsPFK04, OsTPS8, Os07g0616850, Os03g0656850, Os03g0756300, and Os09g0427551, showed low expression at 10 or 15 DAP. OsCESA9, which is involved in cellulose synthesis, also showed low expression at 15 DAP. OsFLO4, which is involved in conversion between phosphoenol-pyruvate and pyruvate, and OsSTA1, which is involved in conversion between phosphoenol-pyruvate and oxaloacetate, were downregulated in the transcriptomic analysis at 15 DAP. Proteomics analysis showed that in starch synthesis, OsWx at 12 DAP and OsSSI at 6, 12, 18, and 24 DAP was downregulated in the low-chalkiness lines. Time course analysis by qRT-PCR showed that OsSSI (at 5 and 15 DAP), OsSSIIa (at 5, 10, 15, and 25 DAP), and OsSSIVb (at 5 DAP), which are all related to soluble starch synthase, were also downregulated, while OsSSIIa (at 10 DAP) and OsSSIvb (at 10 and 25 DAP) were upregulated in the low-chalkiness lines.
Differentially Expressed Genes Associated With Protein Synthesis, Assembly, and Degradation
The low-chalkiness lines showed lower protein metabolism but higher protein transport ability from the endoplasmic reticulum (ER) to the Golgi. In proteomics analysis, seven DEGs associated with protein synthesis, assembly, and degradation were identified and showed downregulation in the low-chalkiness lines (Figure 10B). KEGG analysis showed that OseIF3d (eukaryotic translation initiation factor 3 subunit D), OseEF-1A (elongation factor 1-alpha), and S8 (40S ribosomal protein S8) were involved in protein synthesis, while Os08g0487800 (similar to heat-shock protein precursor), OsBiP1 (endosperm luminal binding protein 1) and OsBiP2 were involved in protein recognition by luminal chaperones. In the transcriptomic analysis at 15 DAP, five DEGs were associated with protein synthesis, assembly, and degradation (Figure 10B). OsHSP90 (heat-shock protein 90.1) and Os02g0565200 (signal peptidase complex subunit 2), which are involved in protein recognition, and OsPDIL2-3 (protein disulfide-isomerase 2-3), OsERdj3A (ER-resident J-protein 3A), and OsHSP70 (heat-shock protein 70), which are involved in protein degradation, were downregulated in the low-chalkiness lines. OsDLN227 (DLN motif protein 227), which may be involved in ER-Golgi transport, was found to be upregulated.
Response of Chalkiness and Related Genes to Heat Shock
High temperature during the grain-filling stage promotes rice chalkiness formation. To elucidate the expression dynamics of some genes related to chalkiness under high temperatures, a heat shock experiment was carried out in this study. ZH11, proActin:GSE5 and gse5-cr were cultivated in illumination incubators with 28/26°C (day/night) and 34/30°C (day/night) at the beginning and 3 DAP, respectively. The results showed that the PGWC and DEC of the three lines at 34/30°C all significantly or extremely significantly increased, and the GL of proActin:GSE5 and gse5-cr at 34°C significantly decreased, while the GL of ZH11 and the GW of the three lines showed no difference at the two temperatures (Figure 11A).
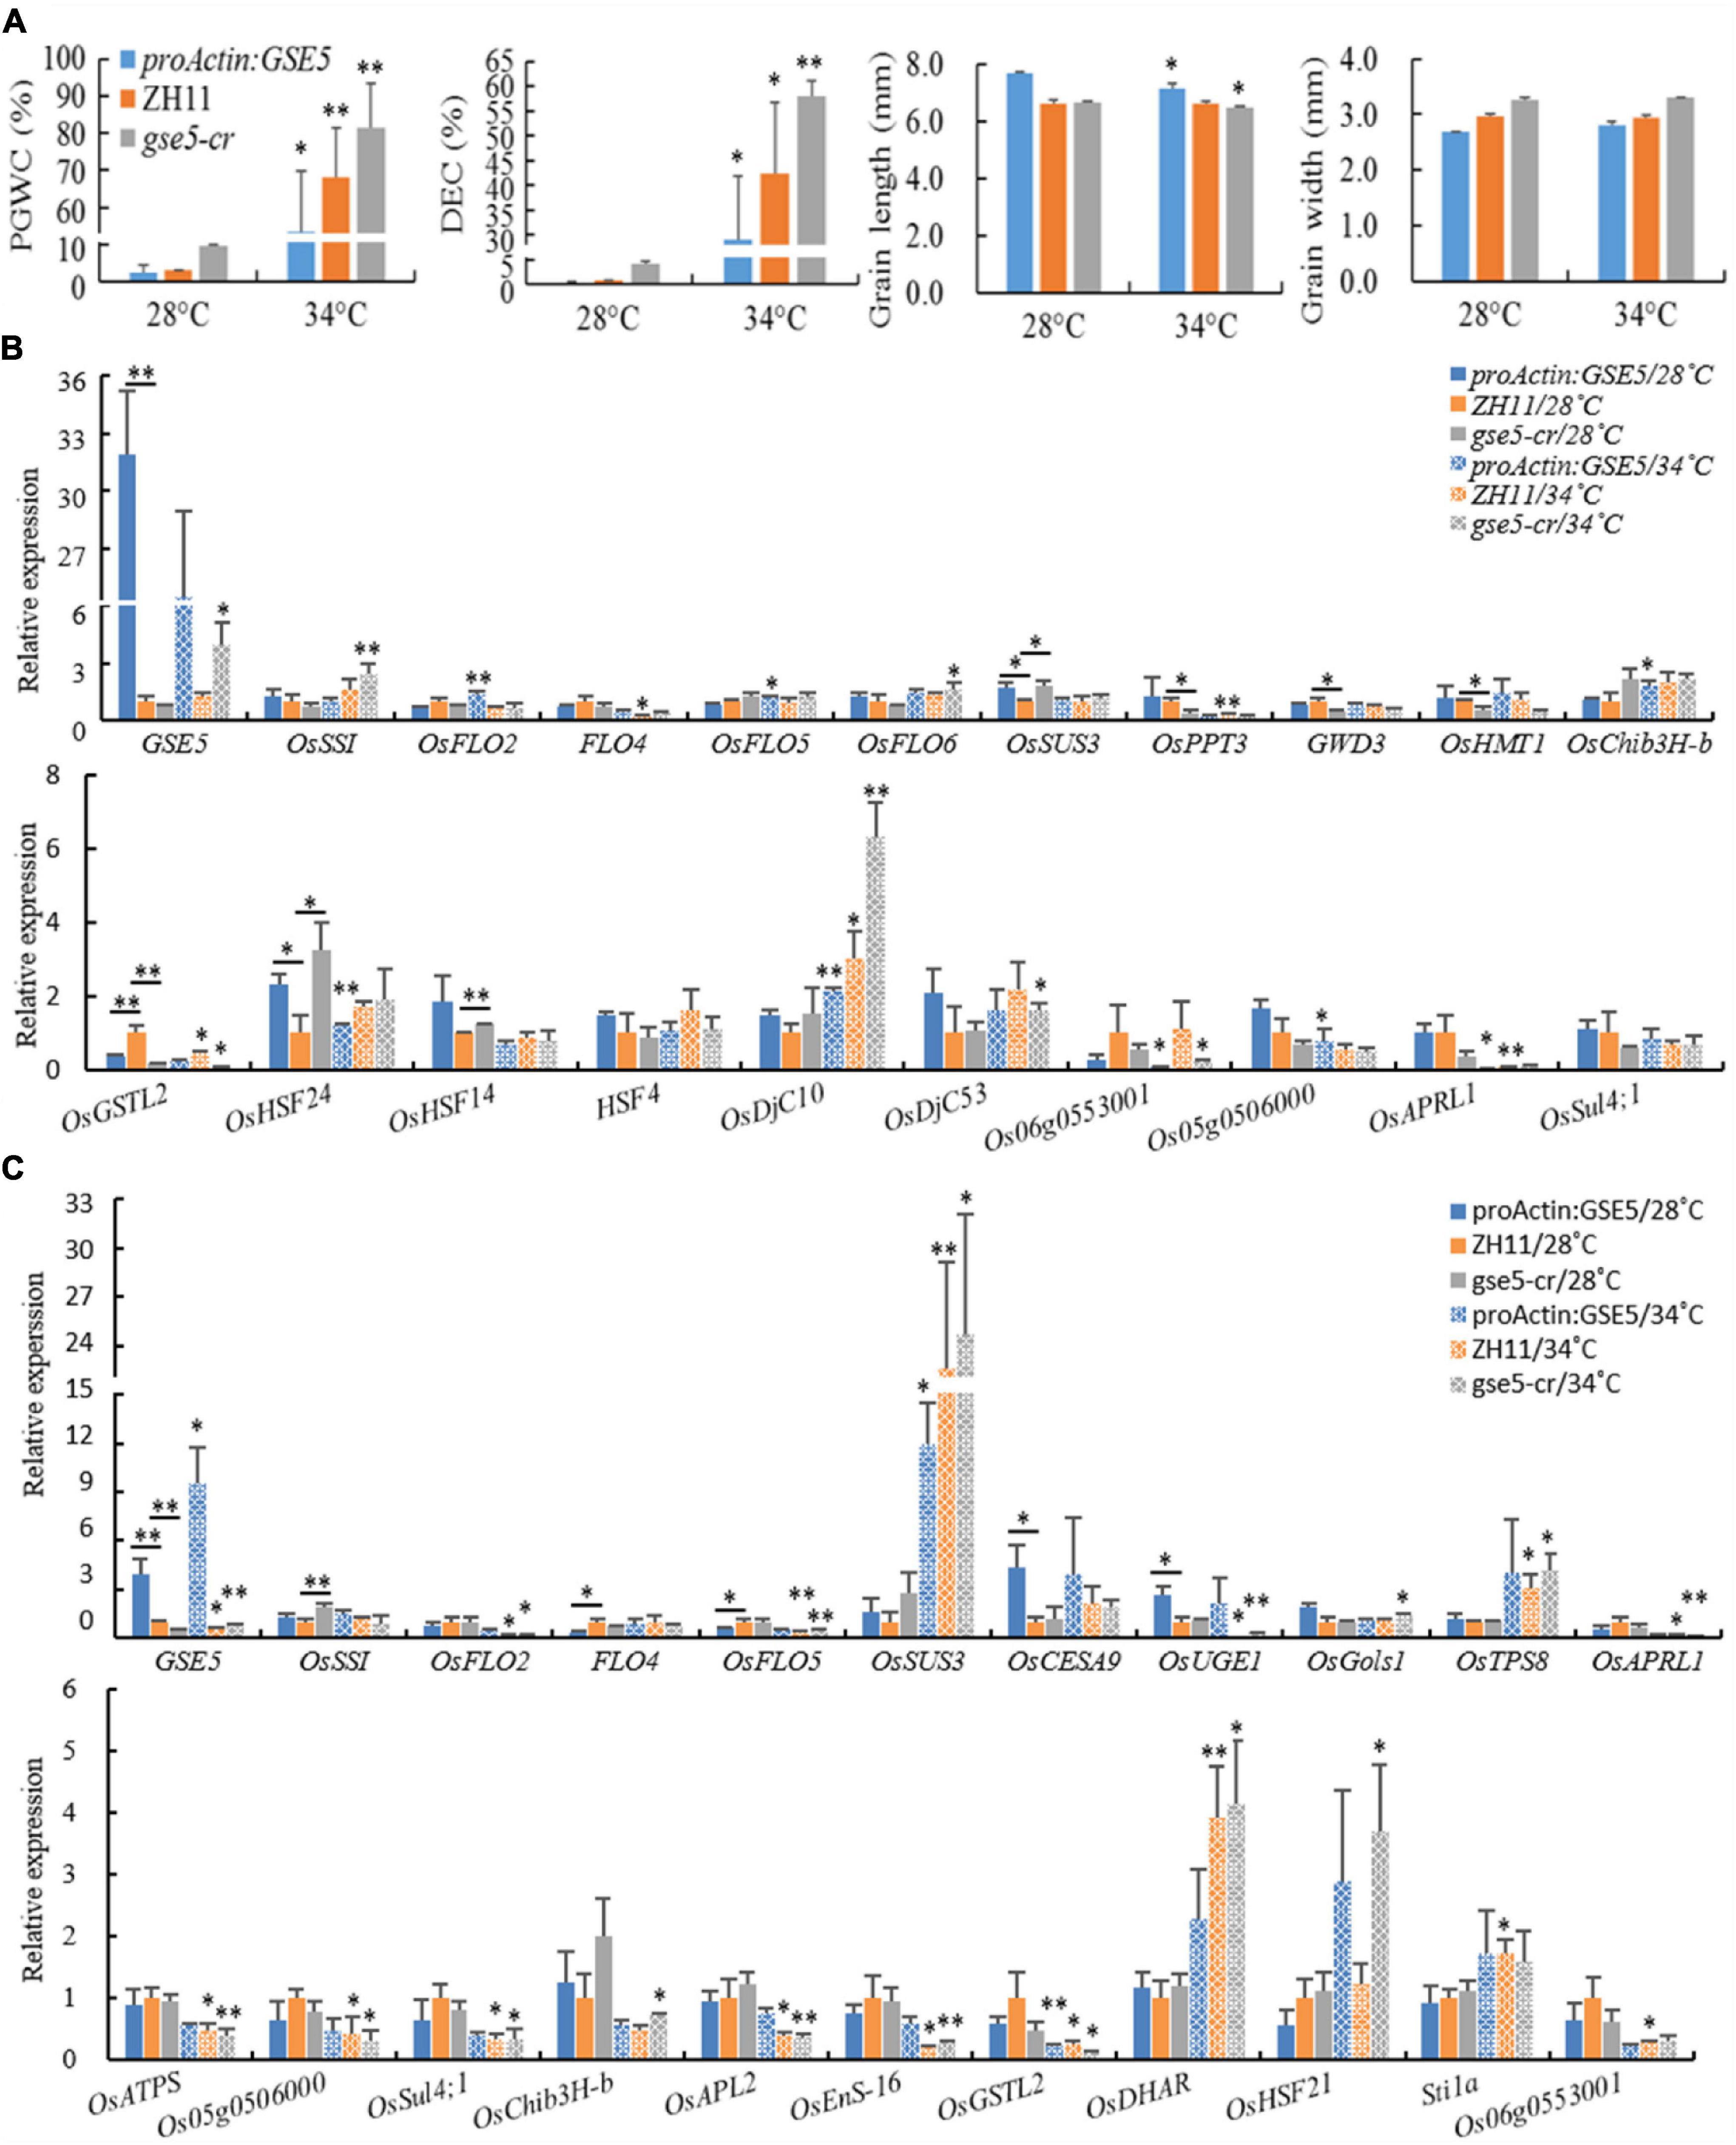
Figure 11. The relative expression levels of some DEGs under heat shock treatment. (A) The chalkiness and grain shape phenotypes of ZH11, proActin:GSE5 and gse5-cr at 28 and 34°C. * Phenotype differences in a line at different temperatures (*P < 0.05 and **P < 0.01). (B) Some genes showed different expression levels at 6 DAP under heat shock treatment. (C) Some genes showed different expression levels at 12 DAP under heat shock treatment. * with underlining indicates different expression levels between two adjacent lines, * without underlining indicates the different expression levels in a line at different temperatures (*P < 0.05 and **P < 0.01).
The relative expression levels of 46 genes showing different expression levels in this study or known genes associated with chalkiness were tested in dehulled developing caryopsis at 6 and 12 DAP (Supplementary Table 8). The results showed the expression of GSE5 increased markedly at 6 and 12 DAP in proActin:GSE5 and decreased markedly at 12 DAP in gse5-cr at 28/26°C compared with ZH11 (Figures 11B,C). At 6 DAP, OsHSF24 was highly expressed, while OsGSTL2 showed low expression in both proActin:GSE5 and gse5-cr. OsSUS3 and OsHSF14 showed higher expression levels, and OsPPT3, GWD3, and OsHMT1 showed lower levels in gse5-cr (Figure 11B). At 12 DAP, OsCESA9 and OsUGE1 showed higher expression levels, and FLO4 and OsFLO5 showed lower levels in proActin:GSE5 (Figure 11B). OsSSI showed higher expression levels in gse5-cr (Figure 11B). This study further confirmed that GSE5 probably regulated these genes, including OsHSF24, OsHSF14, OsPPT3, GWD3, OsHMT1, OsCESA9, OsUGE1, OsFLO5, and OsSSI, to affect the formation of rice chalkiness.
Under 34/30°C heat shock, the expression levels of OsFLO2, OsFLO5, OsChib3H-b (class III chitinase homolog), and OsDjC10 (DnaJ domain protein C10, a heat shock protein) were increased, while those of OsHSF24, Os06g0553001, Os05g0506000, and OsAPRL1 decreased in proActin:GSE5 at 6 DAP (Figure 11B). The expression of OsDjC10 was increased, while the levels of FLO4, OsPPT3, OsGSTL2, and OsAPRL1 were decreased in ZH11 (Figure 11B). The expression levels of GSE5, OsSSI, OsFLO6, OsDjC10, and OsDjC53 were increased, while those of OsGSTL2 and Os06g0553001 were decreased in gse5-cr (Figure 11B).
Under 34/30°C heat shock, the expression levels of GSE5 and OsSUS3 were increased, and that of OsGSTL2 were decreased in proActin:GSE5 at 12 DAP (Figure 11C). The expression levels of OsSUS3, OsTPS8, OsDHAR, and Stila were increased, while those of GSE5, OsFLO2, OsFLO5, OsUGE1, OsAPRL1, OsATPS, Os05g0506000, OsSul4;1, OsAPL2, OsEnS-16, OsGSTL2, and Os06g0553001 were decreased in ZH11 (Figure 11C). The expression levels of GSE5, OsSUS3, OsGols1, OsTPS8, OsDHAR, and OsHSF21 were increased, while those of OsFLO2, OsFLO5, OsUGE1, OsAPRL1, OsATPS, Os05g0506000, OsSul4;1, OsChib3H-b, OsAPL2, OsEnS-16, and OsGSTL2 were decreased in gse5-cr (Figure 11C).
This study showed that the chalkiness of the three lines increased significantly under heat shock at 34/30°C, and even the floury endosperm appeared, and the GL of proActin:GSE5 and gse5-cr decreased, but the GW did not. Among the 46 genes, more than 20 were differentially expressed in the three different haplotypes of GSE5, and the response direction of the same gene to heat shock differed among haplotypes. Under 34/30°C heat shock, OsDjC10 (at 6 DAP) and OsSUS3 (at 12 DAP) were upregulated, and OsGSTL2 (at 12 DAP) was downregulated in all three haplotypes of GSE5.
Improvement of Rice Appearance Quality of Zhenshan 97B by Marker-Assisted Selection
To improve the rice appearance quality of ZB and verify the effectiveness of GSE5/qDEC5 for improving chalkiness traits in MAS, the hybridization was carried out between ZB (the recurrent parent) and ZJB (the donor of the elite appearance quality). The target interval (RM598-RM169-RM289 on chromosome 5, which is tightly linked to qDEC5), TIS, and GBS were carried out in the segregation population by molecular markers. The selected lines were used for further backcrossing with ZB. In BC3F2, 68 lines were obtained by TIS. According to outlier screening (), 52 selected lines with a chalkiness rate less than 46.54% were obtained, with conformity of 76.47%. The PGWC of this selected population was 18.88 ± 1.29%, which was 78.72% lower than that of ZB (Figures 12A,B). In addition, the GL increased, the GW decreased, and the grain shape was slender (Figure 12B). After background genome identification and comprehensive character screening in the field, eight improved ZBs (iZBs) were selected, with average genetic background homozygosity of 99.60% from ZB (Figure 12C). Hybridization was carried out between Zhenshan 97A (ZA) and iZB, and the pollen fertility of the progenies was examined by microscopy. The percentages of sterile pollens among 21 of 50 lines were greater than 99.9%, and that of one line reached 100% (Figure 12D). Subsequently, iZB was used for backcrossing with the selected sterile lines until BC6F1 was obtained. Finally, the improved ZA (iZA) and iZB were successfully bred. This study indicated that the locus GSE5/qDEC5 was an important locus affecting rice appearance quality, with a significant effect in MAS breeding.
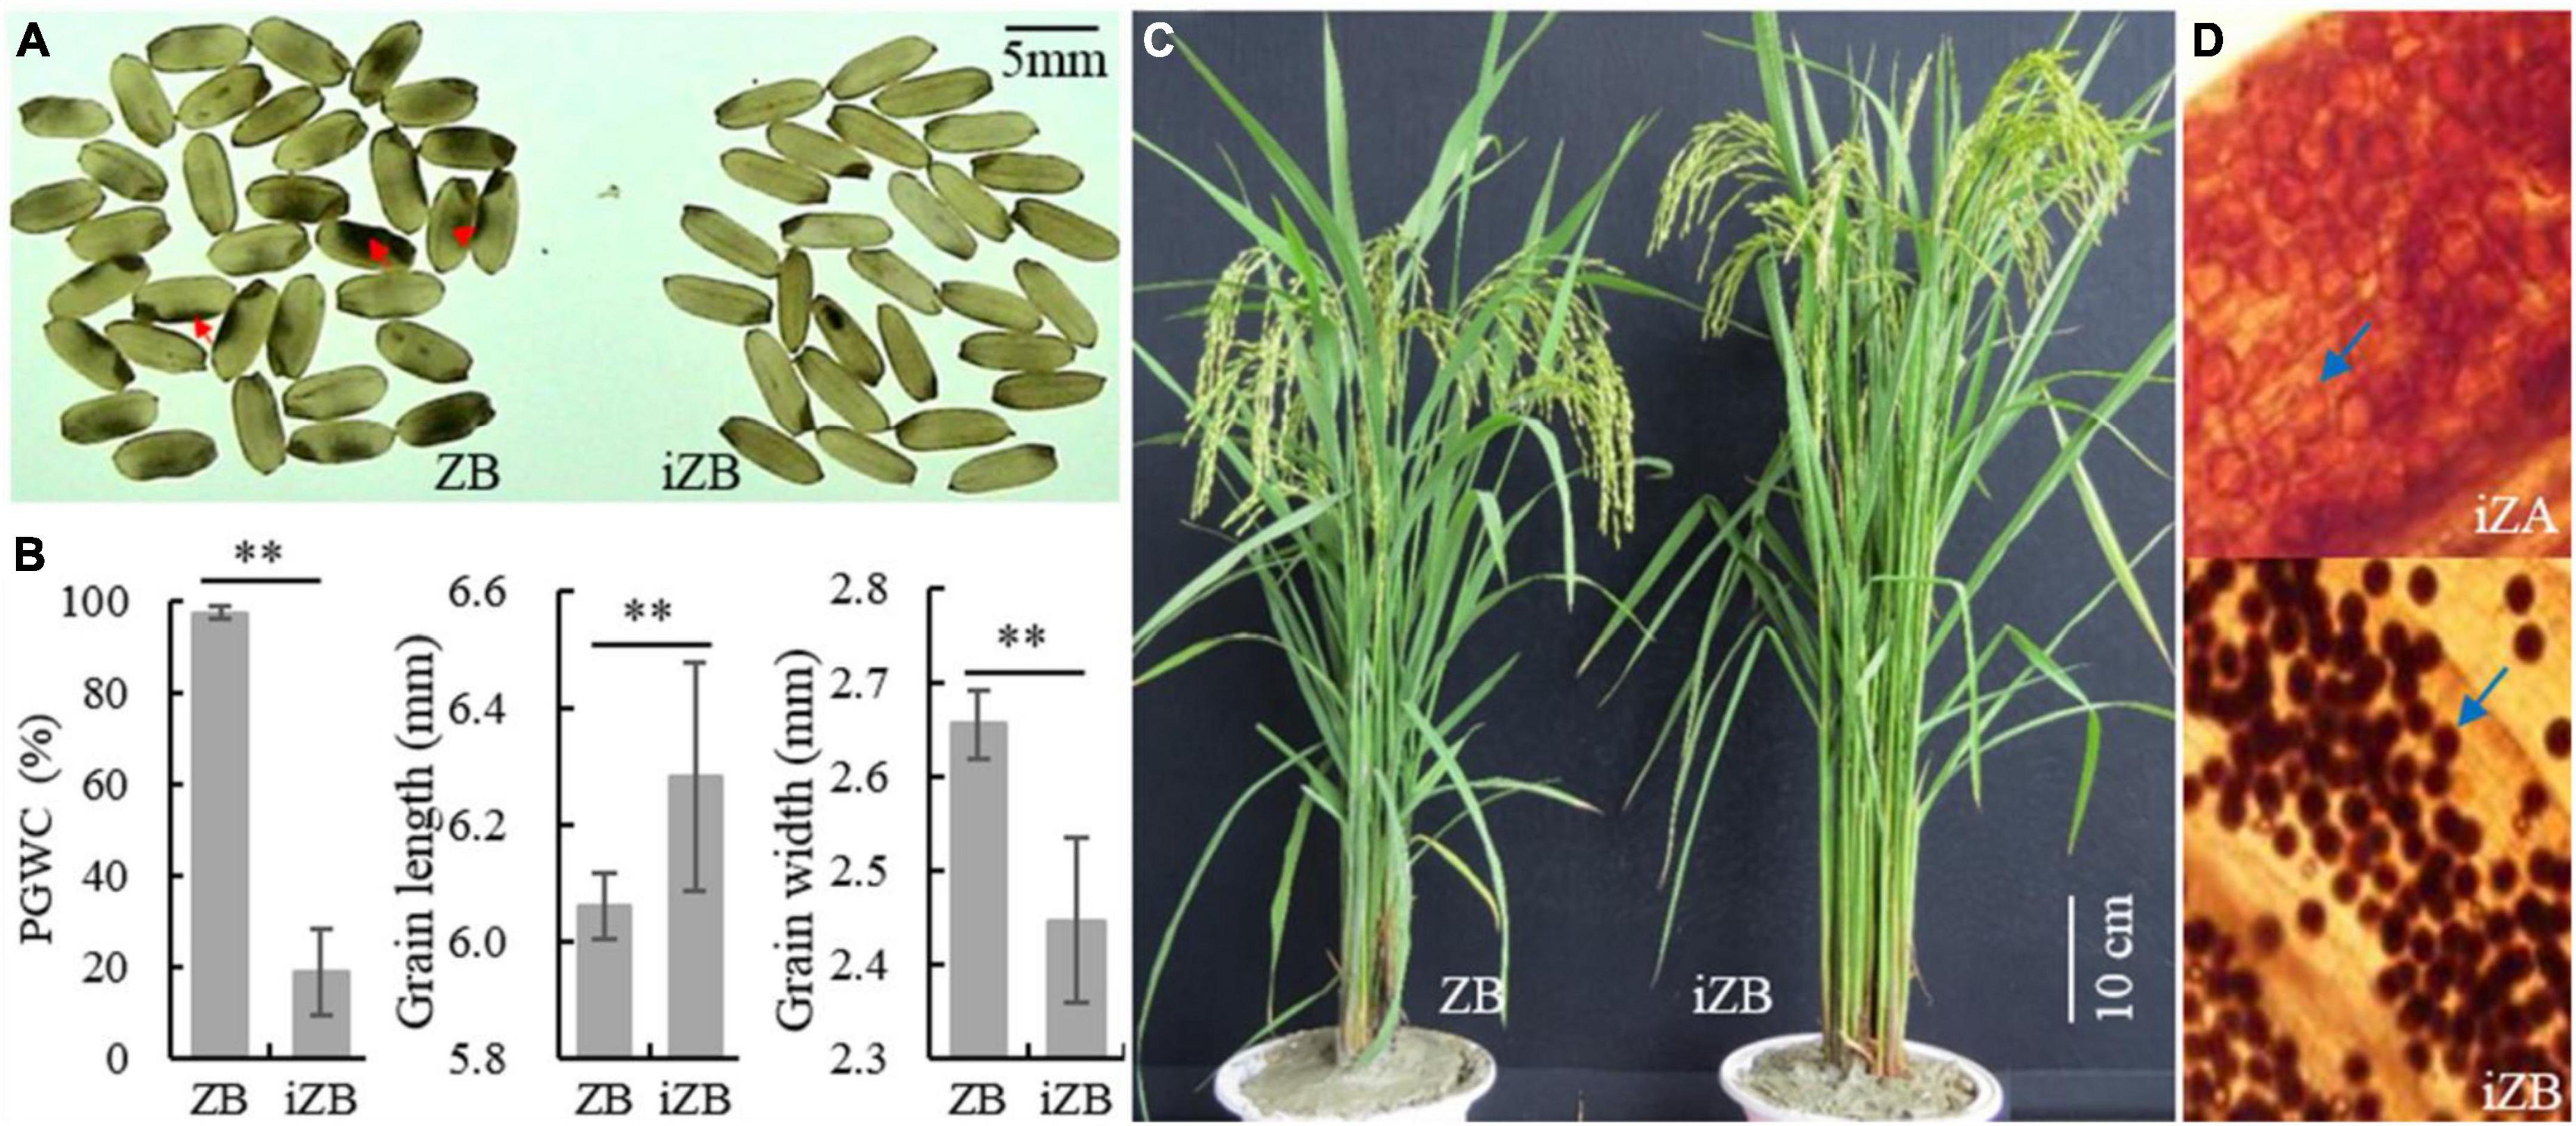
Figure 12. The phenotypes of ZB, iZB, and iZA. (A) Brown rice of ZB and iZB. The red arrows indicate chalkiness. (B) PGWC, GL, and GW traits of ZB and iZB. ** denotes a difference at a very significant level. (C) Plant morphology of ZB and iZB. (D) Pollen granules dyed by 1% I2/KI. The blue arrows indicate pollen granules. The pollen granules dyed black are fertile; otherwise, they are sterile. The magnification is 10 × 10.
Discussion
GSE5 Regulates Chalkiness and Grain Shape
GW5/qSW5/GSE5, which regulates rice GW, was cloned in 2008 (Shomura et al., 2008; Weng et al., 2008), while some QTL analyses and GWASs found that some major QTLs for rice chalkiness were close to GW5/qSW5/GSE5 (Wang et al., 2011; Gao et al., 2014; Qiu et al., 2015, 2017; Ayaad et al., 2021). Chalk5 for rice chalkiness (Li et al., 2014) and GS5 for rice grain shape (Li et al., 2011), which are cloned genes, locate on chromosome 5 and are also very close to GSE5. Chalk5 and GS5 are 2.03 and 1.92 Mb from GSE5, respectively. The sequence analysis of these two genes showed no difference between the two parental lines (ZJB and ZB) in this study, indicating that the difference in chalkiness between ZB and ZJB was not affected by these two genes (Table 2). Our map-based cloning, sequence alignment, and qRT-PCR analysis showed that GSE5 was the candidate gene of qDEC5. Phenotyping of proActin:GSE5 transgenic plants and the gse5-cr mutant and haplotype analysis of 69 rice varieties from around the world further confirmed that qDEC5/GSE5 was pleiotropic because it could regulate both chalkiness and grain shape.
GSE5 Regulates Some Genes Associated With Carbohydrate or Protein Metabolism to Affect Rice Chalkiness Formation
In previous omics analysis, the genes or proteins involved in carbohydrate or protein metabolism played an important role in the formation of rice chalkiness (Liu et al., 2010; Lin et al., 2014, 2017a,b). In our omics analysis, the highest number (27) of DEGs belonging to carbohydrate metabolism were detected, which also showed those genes related to carbohydrate metabolism occupied an important position and role in the development of chalkiness. These genes were directly involved in starch synthesis and hydrolysis, cell wall biogenesis, glycolysis, pentose phosphate pathway, monosaccharide and oligosaccharide synthesis, gluconeogenesis, and the TCA cycle (Figure 9A). Twelve DEGs associated with protein synthesis, assembly, and degradation were found (Figure 9B). Among these DEGs, some genes have been identified to be involved in chalkiness formation in previous studies, and some have functions similar to those genes associated with chalkiness.
WB1 and GIFI, which encode cell-wall invertases, regulate rice endosperm development, and loss of their function can lead to the white-belly endosperm phenotype (Wang et al., 2008, 2018). In this study, we found that a catalytic subunit of cellulose synthase gene, OsCESA9, involved in the formation of the cell wall was downregulated in low-chalkiness lines at 15 DAP. OsWx, OsSSI, and OsSSIa/OsFLO5 are considered to be the important enzymes for starch synthesis during endosperm development (Fujita et al., 2006; Zhang et al., 2011, 2012). In this study, OsWx (12 DAP) and OsSSI (6, 12, 18, and 24 DAP) showed downregulation in low-chalkiness lines, while OsSSIIa/OsFLO5 showed upregulation (10 DAP). FLO4, a chloroplastic pyruvate orthophosphate dikinase modulating carbon flow for starch and lipid biosynthesis during grain filling (Kang et al., 2005), was found to have lower expression in low-chalkiness lines than high-chalkiness lines by both RNA-Seq (at 15 DAP) and qRT-PCR (at 10 DAP). OsFLO6, which encodes a CBM48 domain-containing protein involved in compound starch granule formation and starch synthesis in the endosperm (Cheng et al., 2014), was found to have lower expression in low-chalkiness lines in both proteomics and qRT-PCR analyses. Some ER molecular chaperones, such as OsPDIL1-1 (Han et al., 2012) and OsBiP1/OsBIP3 (Yasuda et al., 2009), may be responsible for the occurrence of the floury endosperm. In this study, OsBiP1, OsBiP2, and OsPDIL2-3 were found to be downregulated in low-chalkiness lines. These three genes were also found in an iTRAQ analysis but showed downregulation in the chalky tissue (Lin et al., 2014). Low expression of FLO11/OsHsp70CP2 would lead to the occurrence of chalkiness (Tabassum et al., 2020). We found that OsHSP70 was downregulated in low-chalkiness lines in the proteomics analysis.
In previous studies, the functional absence of most cloned genes associated with chalkiness, including WB1, OsFLO2, FLO4, OsFLO6, OsFLO13, and OsPDIL1-1, would result in the floury endosperm (Kang et al., 2005; She et al., 2010; Han et al., 2012; Cheng et al., 2014; Hu et al., 2018; Wang et al., 2018). Nevertheless, in this study, many DEGs, such as OsCESA9, FLO4, OsFLO6, OsPDIL1-1, OsBiP1, OsBiP2, OsPDIL2-3, and OsHSP70, showed downregulation in low-chalkiness lines. The low-chalkiness lines showed probably higher amino sugar and nucleotide sugar metabolism at 10 DAP, lower carbohydrate metabolism at 15 DAP, and lower protein metabolism. Therefore, the attainment of low-chalkiness or non-chalky rice is likely to be achieved not simply through the high or low expression of a few genes but the co-expression and interaction of a group of related genes, although more evidence is needed in a future study.
High Yield and Good Quality Can Be Harmoniously Achieved in Rice Breeding
A large body of evidence has shown that PGWC is significantly negatively correlated with GL but positively correlated with GW (Li et al., 2000; Xu et al., 2004; Zou et al., 2009) and that grain thickness is positively correlated with the PGWC and DEC (Yoshida et al., 2002; Gong et al., 2008). This study showed that although qDEC5 reduced chalkiness, it also led to an increased GL and decreased GW. Previous studies also showed that GW2 resulted in increased chalkiness (Song et al., 2007) and GL7 led to decreased chalkiness (Wang et al., 2015). Hence, the increase in the GW would readily lead to increasing chalkiness, thereby reducing rice quality. Conversely, an increase in GL would not increase chalkiness. This result provides a theoretical basis for long-grain and high-quality rice breeding as follows: the GW must be properly controlled/decreased to ensure low chalkiness for the sake of high quality, and with that condition fulfilled, an increased GL is desired to increase thousand-grain-weight for a high grain yield. Accordingly, both high yield and high quality can be harmoniously achieved in rice production. qDEC5 is a very good case.
Data Availability Statement
The original contributions presented in the study are publicly available. This data can be found here: National Center for Biotechnology Information (NCBI) BioProject database under accession number PRJNA751381.
Author Contributions
LJ, YH, HW, YT, and JsZ conceived and designed the experiments. LJ, HZ, XJ, JpZ, RH, FL, YD, QL, and HW performed the experiments. LJ, HZ, XJ, and QL analyzed the data. LJ and HZ wrote the manuscript and other authors revised the manuscript. All authors read and approved the manuscript.
Funding
This study was supported by grants from the National Natural Science Foundation of China (31100866) and the Major Science and Technology Special Project in Fujian Province (2020NZ08016).
Conflict of Interest
The authors declare that the research was conducted in the absence of any commercial or financial relationships that could be construed as a potential conflict of interest.
Publisher’s Note
All claims expressed in this article are solely those of the authors and do not necessarily represent those of their affiliated organizations, or those of the publisher, the editors and the reviewers. Any product that may be evaluated in this article, or claim that may be made by its manufacturer, is not guaranteed or endorsed by the publisher.
Acknowledgments
We would like to thank Yunhai Li at the Institute of Genetics and Developmental Biology, Chinese Academy of Sciences and Plant Bioscience Limited (Norwich N, England) for supplying the materials, ZH11, proActin:GSE5 and gse5-cr.
Supplementary Material
The Supplementary Material for this article can be found online at: https://www.frontiersin.org/articles/10.3389/fpls.2021.814928/full#supplementary-material
Abbreviations
DAP, day after pollination; DEC, the degree of endosperm chalkiness; DEGs, differentially expressed genes; DEPs, differentially expressed proteins; GBS, genetic background selection; GL, grain length; GO, Gene Ontology; GW, grain width; iZA, the improved Zhenshan 97A; iZB, the improved Zhenshan 97B; KEGG, Kyoto Encyclopedia of Genes and Genomes; MAS, molecular marker-assisted selection; NIP, Nipponbare; PGWC, the percentage of grains with chalkiness; PPI, protein-protein interactions; SEM, scanning electron microscopy; TIS, target interval selection; ZA, Zhenshan 97A; ZB, Zhenshan 97B; ZH11, Zhonghua 11; ZJB, Zhenjia B.
Footnotes
- ^ http://www.graininstru.com/productInfo_19.html
- ^ http://www.gramene.org/
- ^ http://www.premierbiosoft.com/index.html
- ^ http://ibi.zju.edu.cn/software/
- ^ http://plants.ensembl.org/Oryza_sativa/Info/Index
- ^ http://string-db.org/
References
Ayaad, M., Han, Z., Zheng, K., Hu, G., Abo-Yousef, M., Sobeih, S. E. S., et al. (2021). Bin-based genome-wide association studies reveal superior alleles for improvement of appearance quality using a 4-way MAGIC population in rice. J. Adv. Res. 28, 183–194. doi: 10.1016/j.jare.2020.08.001
Biselli, C., Bagnaresi, P., Cavalluzzo, D., Urso, S., Desiderio, F., Orasen, G., et al. (2015). Deep sequencing transcriptional fingerprinting of rice kernels for dissecting grain quality traits. BMC Genomics 16:1091. doi: 10.1186/s12864-015-2321-7
Chen, F., Jiang, L., Zheng, J., Huang, R., Wang, H., Hong, Z., et al. (2014). Identification of differentially expressed proteins and phosphorylated proteins in rice seedlings in response to strigolactone treatment. PLoS One 9:e93947. doi: 10.1371/journal.pone.0093947
Chen, J., Tang, L., Shi, P., Yang, B., Sun, T., Cao, W., et al. (2017). Effects of short-term high temperature on grain quality and starch granules of rice (Oryza sativa L.) at post-anthesis stage. Protoplasma 254, 935–943. doi: 10.1007/s00709-016-1002-y
Cheng, C., Ali, A., Shi, Q., Zeng, Y., Tan, X., Shang, Q., et al. (2019). Response of chalkiness in high-quality rice (Oryza sativa L.) to temperature across different ecological regions. J. Cereal Sci. 87, 39–45. doi: 10.1016/j.jcs.2019.02.009
Cheng, P., Wang, Y., Fe Ng, L., Ren, Y., Zhou, K., Jia, L., et al. (2014). FLOURY ENDOSPERM6 encodes a CBM48 domain-containing protein involved in compound granule formation and starch synthesis in rice endosperm. Plant J. 77, 917–930. doi: 10.1111/tpj.12444
Duan, P., Xu, J., Zeng, D., Zhang, B., Geng, M., Zhang, G., et al. (2017). Natural variation in the promoter of GSE5 contributes to grain size diversity in rice. Mol. Plant 10, 685–694. doi: 10.1016/j.molp.2017.03.009
Fujita, N., Yoshida, M., Asakura, N., Ohdan, T., Miyao, A., Hirochika, H., et al. (2006). Function and characterization of starch synthase I using mutants in rice. Plant Physiol. 140, 1070–1084. doi: 10.1104/pp.105.071845
Gao, F. Y., Qiu, L., Lu, X. J., Ren, J. S., Wu, X. T., Ren, G. J., et al. (2014). QTL analysis on grain shape and chalkiness of an elite maintainer line gang 46Bin hybrid rice(Oryza sativa L.). Chin. J. Rice Sci. 28, 235–242. doi: 10.3969/j.issn.1001-7216.2014.03.003
Gao, Y., Liu, C., Li, Y., Zhang, A., Dong, G., Xie, L., et al. (2016). QTL analysis for chalkiness of rice and fine mapping of a candidate gene for qACE9. Rice 9:41. doi: 10.1186/s12284-016-0114-5
Gong, J., Miao, J., Zhao, Y., Zhao, Q., Feng, Q., Zhan, Q., et al. (2017). Dissecting the genetic basis of grain shape and chalkiness traits in hybrid rice using multiple collaborative populations. Mol. Plant 10, 1353–1356. doi: 10.1016/j.molp.2017.07.014
Gong, Y., Feng, J., Xiao, K., Dong, Y., and Lin, D. (2008). Genetic dissection of QTLs for the appearance quality in japanese rice variety koshihikari. Chin. Agric. Sci. Bull. 24, 96–101.
Guo, T., Liu, X., Wan, X., Weng, J., Liu, S., Liu, X., et al. (2011). Identification of a stable quantitative trait locus for percentage grains with white chalkiness in rice (Oryza sativa). J. Integr. Plant Biol. 53, 598–607. doi: 10.1111/j.1744-7909.2011.01041.x
Han, X., Wang, Y., Liu, X., Jiang, L., Ren, Y., Liu, F., et al. (2012). The failure to express a protein disulphide isomerase-like protein results in a floury endosperm and an endoplasmic reticulum stress response in rice. J. Exp. Bot. 63, 121–130. doi: 10.1093/jxb/err262
He, P., Li, S. G., Qian, Q., Ma, Y. Q., Li, J. Z., Wang, W. M., et al. (1999). Genetic analysis of rice grain quality. Theor. Appl. Genet. 98, 502–508. doi: 10.1007/s001220051098
Hu, T., Tian, Y., Zhu, J., Wang, Y., Jing, R., Lei, J., et al. (2018). OsNDUFA9 encoding a mitochondrial complex I subunit is essential for embryo development and starch synthesis in rice. Plant Cell Rep. 37, 1667–1679. doi: 10.1007/s00299-018-2338-x
Jiang, L., Huang, R., Huang, Y., Wang, H., and Zheng, J. (2017). QTL mapping, epistasis and environmental effects analysis for rice chalkiness trait. Mol. Plant Breed. 15, 1385–1394. doi: 10.1007/s00122-015-2616-8
Jin, Z., Qiu, T., Sun, Y., and Jin, X. (2000). Combining ability analysis of chalkiness rate in grains of japonica rice hybrids. Chin. J. Rice Sci. 14, 199–202. doi: 10.3321/j.issn:1001-7216.2000.04.002
Kabir, M. H., Liu, Q., Su, Y., Huang, Z., and Xiao, L. (2017). Dynamics of phytohormones and their relationship with chalkiness of early indica rice under different post-anthesis temperature regimes. Bangladesh J. Agric. Res. 42, 53–65. doi: 10.3329/bjar.v42i1.31975
Kang, H., Park, S., Matsuoka, M., and An, G. (2005). White-core endosperm floury endosperm-4 in rice is generated by knockout mutations in the C4-type pyruvate orthophosphate dikinase gene (OsPPDKB). Plant J. 42, 901–911. doi: 10.1111/j.1365-313X.2005.02423.x
Kentaro, K., Maiko, S., Nanako, K., Hiromu, S., Yukiko, S., Takeshi, S., et al. (2016). Proteomic and glycomic characterization of rice chalky grains produced under moderate and high-temperature conditions in field system. Rice 9, 1–16. doi: 10.1186/s12284-016-0100-y
Li, J., Peng, Q., Shi, W., Liu, Y., Zhang, D., Wu, J., et al. (2016). QTL Analysis of Chalkiness in Rice. Agric. Sci. Technol. 17:3.
Li, J., Xiao, J., Grandillo, S., Jiang, L., Wan, Y., Deng, Q., et al. (2004). QTL detection for rice grain quality traits using an interspecific backcross population derived from cultivated Asian (O. sativa L.) and African (O. glaberrima S.) rice. Genome 47, 697–704. doi: 10.1139/g04-029
Li, X., Tang, S., Yin, Z., Zhu, Y., Wang, A., and Mo, H. (2000). Performance and genetic control of quality characters of rice grains in japonica hybrids. Acta Agron. Sin. 26, 411–419.
Li, Y., Fan, C., Xing, Y., Jiang, Y., Luo, L., Sun, L., et al. (2011). Natural variation in GS5 plays an important role in regulating grain size and yield in rice. Nat. Genet. 43, 1266–1269. doi: 10.1038/ng.977
Li, Y., Fan, C., Xing, Y., Yun, P., Luo, L., Yan, B., et al. (2014). Chalk5 encodes a vacuolar H(+)-translocating pyrophosphatase influencing grain chalkiness in rice. Nat. Genet. 46, 398–404. doi: 10.1038/ng.2923
Li, Z. F., Wan, J. M., Xia, J. F., and Zhai, H. Q. (2003). Mapping quantitative trait loci underlying appearance quality of rice grains (Oryza sativa L.). Acta Genet. Sin. 30, 251–259.
Lin, Z., Wang, Z., Zhang, X., Liu, Z., Li, G., Wang, S., et al. (2017a). Complementary proteome and transcriptome profiling in developing grains of a notched-belly rice mutant reveals key pathways involved in chalkiness formation. Plant Cell Physiol. 58, 560–573. doi: 10.1093/pcp/pcx001
Lin, Z., Zhang, X., Wang, Z., Jiang, Y., and Ding, Y. (2017b). Metabolomic analysis of pathways related to rice grain chalkiness by a notched-belly mutant with high occurrence of white-belly grains. BMC Plant Biol. 17:39. doi: 10.1186/s12870-017-0985-7
Lin, Z., Zhang, X., Yang, X., Li, G., Tang, S., Wang, S., et al. (2014). Proteomic analysis of proteins related to rice grain chalkiness using iTRAQ and a novel comparison system based on a notched-belly mutant with white-belly. BMC Plant Biol. 14:163. doi: 10.1186/1471-2229-14-163
Liu, J., Chen, J., Zheng, X., Wu, F., Lin, Q., Heng, Y., et al. (2017). GW5 acts in the brassinosteroid signalling pathway to regulate grain width and weight in rice. Nat. Plants 3:17043. doi: 10.1038/nplants.2017.43
Liu, J., Kui, L., Zhu, Z., Tan, L., Wang, G., Li, Q., et al. (2007). Identification of QTLs associated with processing quality and appearance quality of common wild rice (Oryza rufipogon Griff.). J. Agric. Biotechnol. 15, 90–96.
Liu, X., Tao, G., Wan, X., Wang, H., Zhu, M., Li, A., et al. (2010). Transcriptome analysis of grain-filling caryopses reveals involvement of multiple regulatory pathways in chalky grain formation in rice. BMC Genomics 11:730. doi: 10.1186/1471-2164-11-730
Meng, W., Quang, C., Liu, F., Quan, D., Jin, C., Wu, Z., et al. (2012). Character analysis on drain quality of different varieties of japonica rice. Hubei Agric. Sci. 51, 361–363.
Misra, G., Badoni, S., Parween, S., Singh, R. K., Leung, H., Ladejobi, O. F., et al. (2021). Genome-wide association coupled gene to gene interaction studies unveil novel epistatic targets among major effect loci impacting rice grain chalkiness. Plant Biotechnol. J. 19, 910–925. doi: 10.1111/pbi.13516
Qi, C. (2011). Characteristics of rice quality and cluster analysis of species in liaoning province. Agric. Sci. Technol. Equip. 14–16. doi: 10.16313/j.cnki.nykjyzb.2011.02.048
Qiu, X., Kai, C., Lv, W., Ou, X., Zhu, Y., Xing, D., et al. (2017). Examining two sets of introgression lines reveals background-independent and stably expressed QTL that improve grain appearance quality in rice (Oryza sativa L.). Theor. Appl. Genet. 130, 951–967. doi: 10.1007/s00122-017-2862-z
Qiu, X., Pang, Y., Yuan, Z., Xing, D., Xu, J., Dingkuhn, M., et al. (2015). Genome-wide association study of grain appearance and milling quality in a worldwide collection of indica rice germplasm. PLoS One 10:e0145577. doi: 10.1371/journal.pone.0145577
Ryoo, N., Yu, C. H., Park, C., Baik, M., Park, I. M., Cho, M., et al. (2007). Knockout of a starch synthase gene OsSSIIIa/Flo5 causes white-core floury endosperm in rice (Oryza sativa L.). Plant Cell Rep. 26, 1083–1095. doi: 10.1007/s00299-007-0309-8
Sera, Y., Hanamata, S., Sakamoto, S., Ono, S., and Kuchitsu, K. (2019). Essential roles of autophagy in metabolic regulation in endosperm development during rice seed maturation. Sci. Rep. 9:18544. doi: 10.1038/s41598-019-54361-1
She, K.-C., Kusano, H., Koizumi, K., Yamakawa, H., Hakata, M., Imamura, T., et al. (2010). A novel factor FLOURY ENDOSPERM2 is involved in regulation of rice grain size and starch quality. Plant Cell 22, 3280–3294. doi: 10.1105/tpc.109.070821
Shomura, A., Izawa, T., Ebana, K., Ebitani, T., Kanegae, H., Konishi, S., et al. (2008). Deletion in a gene associated with grain size increased yields during rice domestication. Nat. Genet. 40, 1023–1028. doi: 10.1038/ng.169
Song, X. J., Huang, W., Shi, M., Zhu, M. Z., and Lin, H. X. (2007). A QTL for rice grain width and weight encodes a previously unknown RING-type E3 ubiquitin ligase. Nat. Genet. 39, 623–630. doi: 10.1038/ng2014
Tabassum, R., Dosaka, T., Ichida, H., Morita, R., and Katsube-Tanaka, T. (2020). FLOURY ENDOSPERM11-2 encodes plastid HSP70-2 involved with temperature-dependent chalkiness of rice (Oryza sativa L.) grains. Plant J. 103, 604–616. doi: 10.1111/tpj.14752
Tan, Y. F., Xing, Y. Z., Li, J. X., Yu, S. B., Xu, C. G., and Zhang, Q. (2000). Genetic bases of appearance quality of rice grains in Shanyou 63, an elite rice hybrid. Theor. Appl. Genet. 101, 823–829. doi: 10.1007/s001220051549
Tao, Y., Xu, M., Wang, F., Chen, D., Zhou, Y., and Liang, G. (2015). QTL Mapping of Chalkiness Using Chromosome Single Segment Substituted Lines in Rice. Acta Agric. Boreali Sin. 30, 1–8. doi: 10.7668/hbnxb.2015.01.001
Trapnell, C., Pachter, L., and Salzberg, S. L. (2009). TopHat: discovering splice junctions with RNA-Seq. Bioinformatics 25, 1105–1111. doi: 10.1093/bioinformatics/btp120
Trapnell, C., Williams, B. A., Pertea, G., Mortazavi, A., Kwan, G., Van Baren, M. J., et al. (2010). Transcript assembly and quantification by RNA-Seq reveals unannotated transcripts and isoform switching during cell differentiation. Nat. Biotechnol. 28, 511–515. doi: 10.1038/nbt.1621
Wakasa, Y., Yasuda, H., Oono, Y., Kawakatsu, T., Hirose, S., Takahashi, H., et al. (2011). Expression of ER quality control-related genes in response to changes in BiP1 levels in developing rice endosperm. Plant J. 65, 675–689. doi: 10.1111/j.1365-313X.2010.04453.x
Wan, X. Y., Wan, J. M., Weng, J. F., Jiang, L., Bi, J. C., Wang, C. M., et al. (2005). Stability of QTLs for rice grain dimension and endosperm chalkiness characteristics across eight environments. Theor. Appl. Genet. 110, 1334–1346. doi: 10.1007/s00122-005-1976-x
Wang, E., Wang, J., Zhu, X., Hao, W., Wang, L., Li, Q., et al. (2008). Control of rice grain-filling and yield by a gene with a potential signature of domestication. Nat. Genet. 40, 1370–1374. doi: 10.1038/ng.220
Wang, H., Qiu, S., Fang, Y., Huang, Y., Chen, R., Zhong, X., et al. (2007). Breeding and application of Jiafuzhan, a new elite early indica rice cultivar in China. Front. Biol. 2, 144–150. doi: 10.1007/s11515-007-0021-7
Wang, H., Zhang, Y., Sun, L., Xu, P., Tu, R., Shuai, M., et al. (2018). WB1, a regulator of endosperm development in rice, is identified by a modified mutMap method. Int. J. Mol. Sci. 19:2159. doi: 10.3390/ijms19082159
Wang, L., Chen, L., Wang, P., Wang, Z., Zheng, H., Ma, H., et al. (2016). Detecting the QTL of rice chalkiness traits using advanced backcrossing population. J. Nanjing Agric. Univ. 39, 183–190. doi: 10.7685/jnau.201505042
Wang, L., Feng, Z., Wang, X., Wang, X., and Zhang, X. (2010). DEGseq: an R package for identifying differentially expressed genes from RNA-seq data. Bioinformatics 26, 136–138. doi: 10.1093/bioinformatics/btp612
Wang, Q., Jiang, L., Zheng, J., Huang, R., Wang, H., and Huang, Y. (2011). Major QTLs mapping and analysis for rice grain chalkiness and grain shape traits. Mol. Plant Breed. 9, 547–553. doi: 10.3969/mpb.009.000547
Wang, S., Li, S., Liu, Q., Wu, K., Zhang, J., Wang, S., et al. (2015). The OsSPL16-GW7 regulatory module determines grain shape and simultaneously improves rice yield and grain quality. Nat. Genet. 47, 949–954. doi: 10.1038/ng.3352
Wang, Z., and Fang, X. (2003). Plant DNA Isolation. Mol. Plant Breed. 1, 281–288. doi: 10.1007/978-3-642-87873-2_5
Weng, J., Gu, S., Wan, X., Gao, H., Guo, T., Su, N., et al. (2008). Isolation and initial characterization of GW5, a major QTL associated with rice grain width and weight. Cell Res. 18, 1199–209. doi: 10.1038/cr.2008.307
Xu, X., Ying, X., Duan, B., Zhu, Z., and Huang, H. (2011). Quality analysis and evaluation of rice varieties from Guangxi Zhuang Autonomous Region. J. Southern Agric. 42, 575–577.
Xu, Z., Chen, W., Ma, D., Lu, Y., Zhou, S., and Liu, L. (2004). Correlations between rice grain shapes and main qualitative characteristics. Acta Agron. Sin. 30, 894–900.
Yasuda, H., Hirose, S., Kawakatsu, T., Wakasa, Y., and Takaiwa, F. (2009). Overexpression of BiP has inhibitory effects on the accumulation of seed storage proteins in endosperm cells of rice. Plant Cell Physiol. 50, 1532–43. doi: 10.1093/pcp/pcp098
Yoshida, S., Ikegami, M., Kuze, J., Sawada, K., Hashimoto, Z., Ishii, T., et al. (2002). QTL analysis for plant and grain characters of sake-brewing rice using a doubled haploid population. Breed. Sci. 52, 309–317. doi: 10.1270/jsbbs.52.309
Young, M. D., Wakefield, M. J., Smyth, G. K., and Oshlack, A. (2010). Gene ontology analysis for RNA-seq: accounting for selection bias. Genome Biol. 11:R14. doi: 10.1186/gb-2010-11-2-r14
Yun, P., Zhu, Y., Wu, B., Gao, G., Sun, P., Zhang, Q., et al. (2016). Genetic mapping and confirmation of quantitative trait loci for grain chalkiness in rice. Mol. Breed. 36:162. doi: 10.1007/s11032-016-0600-x
Zeng, D., Qian, Q., Qing, R. L., Sheng, T., Yasufum, K., Hiroshi, F., et al. (2002). QTL analysis of chalkiness size in three dimensions. Chin. J. Rice Sci. 16, 11–14.
Zhang, G., Cheng, Z., Zhang, X., Guo, X., and Wan, J. (2011). Double repression of soluble starch synthase genes SSIIa and SSIIIa in rice (Oryza sativa L.) uncovers interactive effects on the physicochemical properties of starch. Genome 54, 448–459. doi: 10.1139/g11-010
Zhang, M.-Z., Fang, J.-H., Yan, X., Liu, J., Bao, J.-S., Fransson, G., et al. (2012). Molecular insights into how a deficiency of amylose affects carbon allocation – carbohydrate and oil analyses and gene expression profiling in the seeds of a rice waxy mutant. BMC Plant Biol. 12:230. doi: 10.1186/1471-2229-12-230
Zhou, H. W., Zhang, H. Y., Wang, Z. H., He, C., You, L. L., Fu, D. H., et al. (2019). Discovery of unique single nucleotide polymorphisms in rice in response to high nighttime temperature stress using a hybrid sequencing strategy. Environ. Exp. Bot. 162, 48–57. doi: 10.1016/j.envexpbot.2019.02.005
Zhou, L., Jiang, L., Liu, X., Chen, H., Chen, L., Liu, S., et al. (2009b). QTL mapping and interaction analysis for 1000-grain weight and percentage of grains with chalkiness in rice. Acta Agron. Sin. 35, 255–261. doi: 10.3724/sp.j.1006.2009.00255
Zhou, L., Liu, X., Jiang, L., Zheng, L.-N., Chen, L., Liu, S., et al. (2009c). Analysis of QTL and GE effects on PGWC in rice (Oryza sativa L.) using CSSL and BIL populations. Sci. Agric. Sin. 42, 1129–1135. doi: 10.3864/j.issn.0578-1752.2009.04.001
Zhou, L., Chen, L., Jiang, L., Zhang, W., Liu, L., Liu, X., et al. (2009a). Fine mapping of the grain chalkiness QTL qPGWC-7 in rice (Oryza sativa L.). Theor. Appl. Genet. 118, 581–590. doi: 10.1007/s00122-008-0922-0
Keywords: rice (Oryza sativa L.), percentage of grains with chalkiness, degree of endosperm chalkiness, grain shape, near-isogenic lines, molecular marker-assisted selection, transcriptomics, proteomics
Citation: Jiang L, Zhong H, Jiang X, Zhang J, Huang R, Liao F, Deng Y, Liu Q, Huang Y, Wang H, Tao Y and Zheng J (2022) Identification and Pleiotropic Effect Analysis of GSE5 on Rice Chalkiness and Grain Shape. Front. Plant Sci. 12:814928. doi: 10.3389/fpls.2021.814928
Received: 14 November 2021; Accepted: 20 December 2021;
Published: 20 January 2022.
Edited by:
Yongzhong Xing, Huazhong Agricultural University, ChinaReviewed by:
Hewei Du, Yangtze University, ChinaMohammed Hussein Ayaad, Nuclear Research Center, Egyptian Atomic Energy Authority, Egypt
Copyright © 2022 Jiang, Zhong, Jiang, Zhang, Huang, Liao, Deng, Liu, Huang, Wang, Tao and Zheng. This is an open-access article distributed under the terms of the Creative Commons Attribution License (CC BY). The use, distribution or reproduction in other forums is permitted, provided the original author(s) and the copyright owner(s) are credited and that the original publication in this journal is cited, in accordance with accepted academic practice. No use, distribution or reproduction is permitted which does not comply with these terms.
*Correspondence: Liangrong Jiang, lrjiang108@xmu.edu.cn; Yi Tao, yitao@xmu.edu.cn; Jingsheng Zheng, zheng21006@xmu.edu.cn
†These authors have contributed equally to this work