 Allyson J. Weiss1
 Aaron O. Panduro2Erica L. Schwarz3Zachary A. Sexton3Ingrid S. Lan3
 Thomas. R. Geisbush4
 Alison L. Marsden3,5
 Nicholas A. Telischak4*
- 1Department of Mechanical Engineering, Stanford University, Stanford, CA, United States
- 2Department of Biochemistry, California State University, Fresno, CA, United States
- 3Department of Bioengineering, Stanford University, Stanford, CA, United States
- 4Department of Radiology, School of Medicine, Stanford University, Stanford, CA, United States
- 5Department of Pediatrics, School of Medicine, Stanford University, Stanford, CA, United States
Introduction: Initiation and progression of cerebral aneurysms is known to be driven by complex interactions between biological and hemodynamic factors, but the hemodynamic mechanism which drives aneurysm growth is unclear. We employed robust modeling and computational methods, including temporal and spatial convergence studies, to study hemodynamic characteristics of cerebral aneurysms and identify differences in these characteristics between growing and stable aneurysms.
Methods: Eleven pairs of growing and non-growing cerebral aneurysms, matched in both size and location, were modeled from MRA and CTA images, then simulated using computational fluid dynamics (CFD). Key hemodynamic characteristics, including wall shear stress (WSS), oscillatory shear index (OSI), and portion of the aneurysm under low shear, were evaluated. Statistical analysis was then performed using paired Wilcoxon rank sum tests.
Results: The portion of the aneurysm dome under 70% of the parent artery mean wall shear stress was higher in growing aneurysms than in stable aneurysms and had the highest significance among the tested metrics (p = 0.08). Other metrics of area under low shear had similar levels of significance.
Discussion: These results align with previously observed hemodynamic trends in cerebral aneurysms, indicating a promising direction for future study of low shear area and aneurysm growth. We also found that mesh resolution significantly affected simulated WSS in cerebral aneurysms. This establishes that robust computational modeling methods are necessary for high fidelity results. Together, this work demonstrates that complex hemodynamics are at play within cerebral aneurysms, and robust modeling and simulation methods are needed to further study this topic.
1 Introduction
Approximately 5% of the population develops at least one cerebral aneurysm in their lifetime. Of these, about 0.2% rupture every year, causing subarachnoid hemorrhages which carry a mortality rate of almost 50% (Sadasivan et al., 2013). Because of the significant risk of mortality, identifying indicators for both aneurysm growth and rupture is of critical importance in the clinical setting.
Historically, clinicians have commonly used morphological characteristics such as size and shape to assess the risk of rupture. However, hemodynamics also play a significant role in aneurysm development. Multiple studies have shown that initiation and progression of cerebral aneurysms is driven by complex interactions between biological and hemodynamic factors, one hemodynamic factor being wall shear stress (WSS), and that rupture occurs when the stress on the wall exceeds the wall’s strength (Meng et al., 2007; Metaxa et al., 2010). However, the hemodynamic mechanism that drives aneurysm growth is still under debate. Elevated maximal WSS can cause endothelial injury, initiating wall remodeling and potential degeneration and therefore aneurysm initiation and growth (Sforza et al., 2009; Meng et al., 2014). Conversely, regions of low velocity within aneurysms can result in low WSS, which can lead to wall inflammation along with localized degeneration and thinning (Sforza et al., 2009; Meng et al., 2014).
Computational fluid dynamics (CFD) offers a unique opportunity to study patient-specific hemodynamics in cerebral arteries and aneurysms by simulating in-vivo blood flow through imaging-derived geometrical models. While previous studies have investigated cerebral aneurysms using CFD, most assumed traction-free outlet boundary conditions (Shojima MD et al., 2004; Mut et al., 2011; Xiang et al., 2011; Kono et al., 2012; Fukazawa et al., 2015). Under traction-free conditions, the outlet face is free from external stress; however, a physiological cerebral artery is not pressure-free, and can even experience time-varying changes in outlet resistance, making these models physiologically inaccurate.
In addition to the assumption of constant resistance, multiple studies also split outflow volumes according to Murray’s law (Sforza et al., 2016; Brinjikji et al., 2017; Chung et al., 2018). However, previously reported values of cerebral flow splits deviate substantially from Murray’s law, suggesting that cerebral arteries are potentially not well governed by Murray’s law (Seymour et al., 2020). Further, previous studies that split flows by Murray’s law fail to consider temporal variations in downstream resistance, which also leads to physiologically inaccurate flows. Thus, the lack of physiological boundary conditions warrants a study with higher physiological detail to more closely model the patients hemodynamics. The variable waveform shape can be more accurately governed by RCR boundary conditions to account for downstream capacitance (Vignon-Clementel et al., 2010).
To investigate the association between hemodynamics and cerebral aneurysm growth and address previous studies’ limitations, we analyze 11 pairs of growing and non-growing aneurysms pair-matched both in size and location. We use pulsatile inflow waveforms and the Windkessel (RCR) outlet boundary conditions to create physiological simulations. In addition, we perform mesh refinement to ensure WSS convergence and investigate the effect of mesh sizing on hemodynamic fields of interest. We then extract hemodynamic metrics in the aneurysm dome as well as in the parent artery and perform statistical analysis on the matched pairs.
2 Materials and methods
2.1 Data collection
CT angiography (CTA) and MR angiography (MRA) reports from 2002 to 2021 were retrospectively queried through a Stanford Health database as part of a study approved by the Stanford University Institutional Review Board (IRB). From these reports, patient aneurysms were identified that had undergone a follow-up scan more than 1 year after initial imaging. Subsequently, the selected aneurysms were measured in three orthogonal dimensions, and volumetric estimates were calculated based on these measurements. Aneurysms were then categorized as either growing or stable and matched both by location and volume. Growing aneurysms were characterized by an increase in size of at least 1 mm in two or more dimensions on a subsequent scan, while measurements for stable aneurysms remained within a 1 mm increase in all dimensions. A total of 11 growing aneurysms were identified and paired with stable aneurysms possessing similar volume and the same location for inclusion in this study (refer to Figure 1A for models). Demographic information for the selected patients is available in Table 1 below.
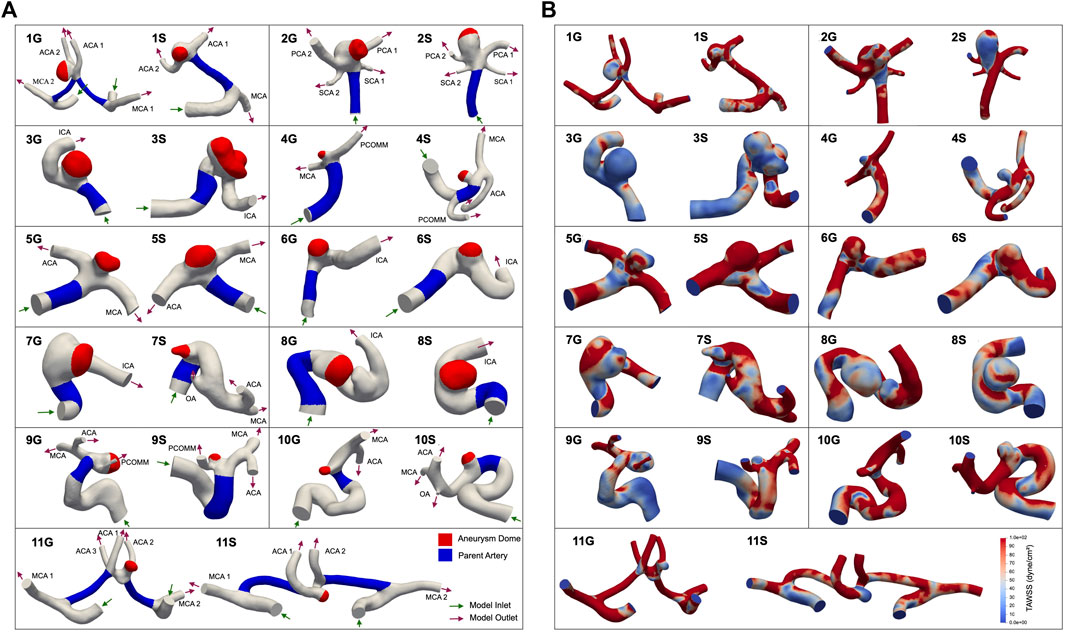
FIGURE 1. 11 pairs of aneurysms in our cohort, matched in both size and location. ‘G’ denotes a growing aneurysm, and ‘S’ denotes a stable aneurysm. The aneurysm dome is represented by the red region, and the parent artery is represented by the blue region (A). The aneurysm dome was clipped to exclude the impingement region, which is defined as the region where flow impinges against the aneurysm wall (Cebral et al., 2005b). (B) Shows time-averaged WSS distributions, in dyne/cm2. Abbreviations: ACA, anterior cerebral crtery; ICA, internal carotid artery; MCA, middle cerebral artery; OA, ophthalmic artery; PCA, posterior cerebral artery; PCOMM, posterior communicating artery; SCA, superior cerebellar artery.
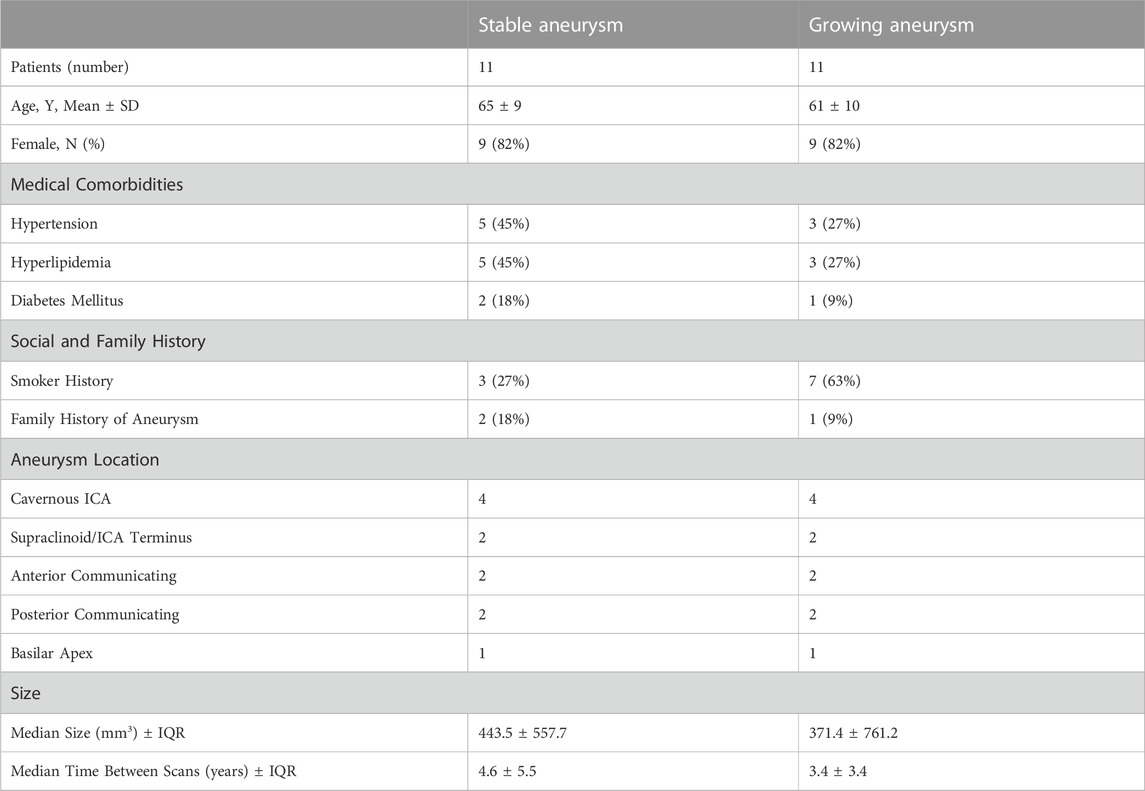
TABLE 1. Patient demographics and aneurysm characteristics.
2.2 Patient-specific model construction
Patient-specific, three-dimensional anatomical models of each cerebral aneurysm (Figure 1) were constructed from MRA and CTA images using the level set segmentation tool in the Vascular Modeling Toolkit, which is a collection of tools for image-based 3D reconstruction, geometric analysis, and surface data processing of blood vessels. Methodology details are provided at www.vmtk.org. Each segment was modeled by placing two seeds on the segment of interest and subsequently propagating wavefronts based on the contrasting image intensity of the vessel and surrounding tissue to create a tubular vessel model. Once segmented, each model was smoothed using Autodesk Meshmixer (www.meshmixer.com). Inlets and outlets were truncated perpendicular to the vessel using ParaView (Ahrens et al., 2005). All models were then imported into the open-source software SimVascular, a software package that provides a pipeline from medical image segmentation to blood flow simulation and analysis. Methodology details are provided at simvascular.github.io. They were then meshed with linear tetrahedral elements using TetGen (Research Group Numerical Mathematics and Scientific Computing, 2015) and an initial maximum edge size informed by the minimum outlet size (approximately 0.25–0.4 mm). All models used in this study can be located in the Vascular Model Repository, an open-source database of vascular models, at vascularmodel.com.
2.3 Simulation
All hemodynamic simulations were performed using svSolver, SimVascular’s finite element simulation suite. Wall compliance was neglected, and no-slip boundary conditions were applied at the walls. Blood was approximated as a Newtonian fluid with density 1.06 g/cm3 and viscosity 0.04 Poise, with the assumption of a constant viscosity based on previous studies that indicate that the Newtonian fluid assumption is generally acceptable in CFD of cerebral aneurysms (Fisher and Stroud Rossmann, 2009; Xiang et al., 2012).
Clinically measured flow waveforms were prescribed at the inlets with a parabolic velocity profile. The waveforms reference flow rates and waveforms of healthy patients reported in previous studies (Gwilliam et al., 2009; Wake-Buck et al., 2012; Seymour et al., 2020) and can be seen in Figure 2. RCR Windkessel boundary conditions were applied to each outlet (Supplementary Table S1), with the outlet resistances split inversely to the outlet areas, as in the following equation:
where
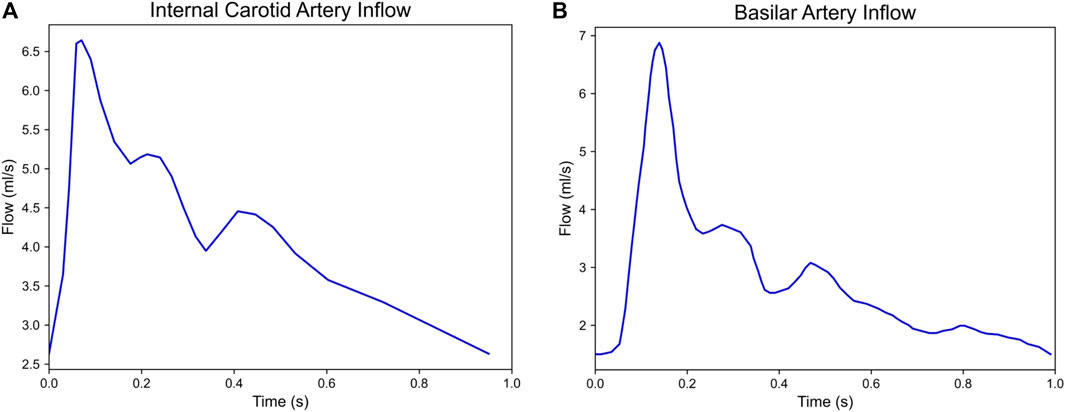
FIGURE 2. Flow waveforms of the (A) internal carotid artery (ICA) and (B) basilar artery (BA) prescribed at the inlets of our simulated models. 10 pairs of growing and stable aneurysms required the ICA inflow and 1 pair (2G and 2S) required the BA inflow.
The ratio of proximal to distal resistance in the RCR circuit was prescribed as 1:9. The resistance and capacitance values were tuned to achieve target systolic and diastolic aortic pulse pressures within 5% of 120 mmHg and 80 mmHg, respectively. 3D simulations were run until inlet and outlet pressures were converged within 5% to a limit cardiac cycle. Upon completion of outlet boundary condition tuning, we performed mesh refinement to ensure time-averaged WSS (TAWSS) convergence.
2.4 Mesh convergence
Finite element solutions are sensitive to discretization schemes, with known dependence on mesh size. This is particularly true when seeking to analyze hemodynamic quantities, such as WSS, which are dependent on the spatial gradient of the velocity solution (Craven et al., 2018). To ensure spatial convergence of our hemodynamic quantities of interest, we performed a mesh convergence study on our aneurysm models. We began by discretizing our meshes with tetrahedral elements with a maximum edge size of 0.25–0.4 mm, dependent on the size of the aneurysm model. The spatially averaged TAWSS was then calculated in the aneurysm body. The maximum edge size of the model was then decreased by approximately 10% with every refinement iteration. The model was determined to be converged when the spatially averaged TAWSS in the dome was within 5% of that in the previous refinement.
2.5 Postprocessing
Following simulation of each aneurysm model, we postprocessed the results of the final cardiac cycle of the simulation. We segmented the model into two regions corresponding to the aneurysm dome and the parent vessel. Mean, minimum, and maximum TAWSS and oscillatory shear index (OSI) parameters were extracted from both the dome and parent regions (Figure 1A). TAWSS and OSI were calculated using the following equations:
and
The mean TAWSS in the parent artery was used to determine thresholds for identifying areas of low TAWSS in the aneurysm dome. We calculated the low shear area (LSA), defined as the non-dimensional ratio of the dome area with TAWSS at least one standard deviation below the mean TAWSS in the parent artery to the total dome area. We also calculated the non-dimensional area beneath a direct percentage of the parent artery mean TAWSS as the mean-thresholded low shear area (MTLSAX%) where the threshold value is defined as X% of mean parent artery TAWSS. The low shear area was calculated as a percentage of the parent artery mean TAWSS to accommodate varying flow patterns in patient-specific vessel geometries, as opposed to using an absolute threshold for all models which may not be applicable to each patient-specific geometry.
2.6 Statistical analysis
The mean, minimum, and maximum values of the TAWSS and OSI and low WSS exposure areas were calculated in the aneurysm dome for both the growing and non-growing aneurysms. A Shapiro-Wilk test determined that not all metrics demonstrated a normal distribution (Supplementary Table S2), so a paired Wilcoxon rank sum test was performed to determine the statistical significance of the computed differences between growing and non-growing aneurysms. We denote a significance of p = 0.1 in our reported results.
3 Results
3.1 Temporal convergence
Each simulation in our study was run to a limit cardiac cycle to ensure temporal convergence of pressure. Boundary conditions were tuned to achieve target systolic and diastolic pressures within 5% of 120 mmHg and 80 mmHg, respectively.
3.2 Mesh convergence
All cases converged within the specified 5% tolerance. The final maximum edge sizes ranged between 0.144 mm and 0.32 mm across models. Several models required multiple refinement iterations, resulting in large changes in TAWSS between refinements, including a maximum error of over 150% between the mean TAWSS of the initial model and the mean TAWSS of the final, refined model (Figure 3).
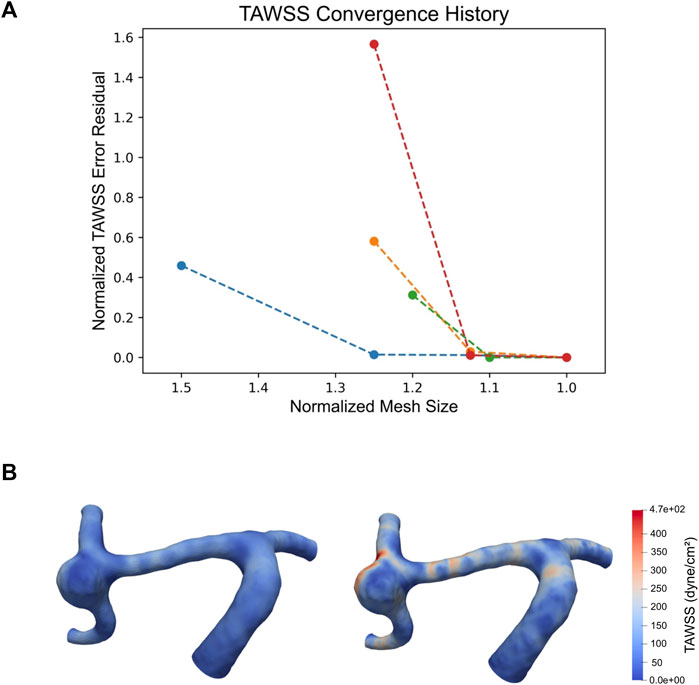
FIGURE 3. Plot of TAWSS convergence of cases 1S, 2G, 2S, and 3S, where each point represents a mesh refinement step. Normalized mesh size is defined as
3.3 Stable versus growing aneurysms
We found differences with a statistical significance at p = 0.1 between growing and stable cerebral aneurysms for the portion of the aneurysm dome under 70% of the parent artery spatially-averaged TAWSS (Table 2). The portion of the aneurysm under 50% and 90% of the parent artery spatially averaged TAWSS showed marginal significances of p = 0.101 and 0.110, respectively (Table 2). Distributions of WSS, OSI, and pressures of each model can be found in Figure 1B and Supplementary Figures S1A, B, respectively.
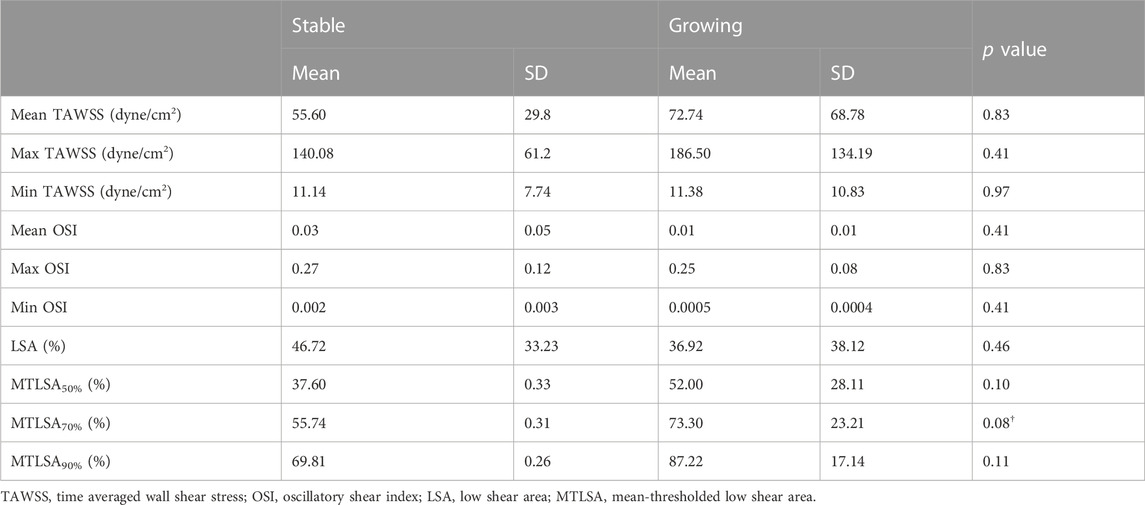
TABLE 2. Mean and standard deviations of hemodynamic variables of interest for stable and growing aneurysms, and corresponding p values from the paired Wilcoxon rank sum test.
4 Discussion
It is well established that WSS plays a role in cerebral aneurysm initiation and growth, and that when the stress exceeds the wall’s strength, rupture occurs (Metaxa et al., 2010; Meng et al., 2014). However, less is known about the hemodynamics of aneurysm growth. Recent studies have used CFD to assess several hemodynamic variables, including WSS and OSI, and their association with cerebral aneurysm growth and rupture. One study of seven aneurysms found that low TAWSS is associated with localized aneurysm wall deformation of at least 0.3 mm3, while another study of 33 cerebral aneurysms indicated that unstable aneurysms have higher concentrations of WSS and higher area of low WSS than growing aneurysms, though the latter was not found to be statistically significant (Sforza et al., 2016). Despite the identification of significant indicators, particularly WSS, within individual studies, the lack of consistently significant indicators of aneurysm growth highlights the complexity of the interactions between physiology, anatomy, genetics, and hemodynamics and demonstrates the need for additional research into the link between hemodynamics and aneurysm outcomes.
In our study of 11 pairs of growing and stable aneurysms matched in both size and location, we found differences with a statistical significance at p = 0.1 between aneurysm growth and the area of the aneurysm subjected to low WSS. Growing aneurysms tended to have a larger area of the aneurysm under 70% of the spatially averaged TAWSS in the parent artery. This finding indicates that CFD may be a useful prognostic tool in the clinical setting, beyond the current indicators of size and location, for assessing the risk of aneurysm progression. We also found that growing aneurysms had higher area under low shear stress across multiple threshold values (Table 2), which agrees with other papers in this field (Sforza et al., 2009; Brinjikji et al., 2017; Chung et al., 2018). Although we did not reach statistical significance at the p = 0.05 level, our results align with previously observed trends, which noted that growing aneurysms tend to have higher areas of low shear compared to their non-growing counterparts, although the exact definition of low shear and level of significance varied greatly between studies. Consistent with the low flow theory of aneurysm progression, a higher region of low shear in the aneurysm dome may lead to larger areas of localized degeneration and thinning, which can give rise to aneurysm growth due to thinner, weaker vessel walls (Sforza et al., 2009; Meng et al., 2014). Thus, when considered in context with the wider body of aneurysm growth research, particularly in the application of CFD, our findings indicate a promising direction for future study of the link between aneurysm growth and area under low shear.
CFD represents an important tool for investigating hemodynamic forces that are immeasurable in-vivo. However, utilizing CFD requires the careful selection of computational parameters for hemodynamic simulation, including boundary conditions, mesh size, and simulation duration (Vignon-Clementel et al., 2010; Craven et al., 2018). Pursuant to this, we utilized robust methods to ensure physiological and numerical accuracy in our CFD simulations. While many previous studies relied on Murray’s Law to establish flow splits, values for flow splits in cerebral arteries recorded in literature were not consistent with this assumption (Kobayashi and Karino, 2010; Seymour et al., 2020). Using area to distribute resistance has been shown to more consistently represent physiological conditions than Murray’s Law in cerebrovascular simulations (Chnafa et al., 2018), leading us to split resistance and flow based on outlet area. Many previous studies also utilized purely resistance-based outlet conditions, assuming zero capacitance in the distal vascular bed. This has been shown to be non-physiological and can affect the time-resolved velocity field, which in turn changes the calculated velocities and WSS (Vignon-Clementel et al., 2010). To address this, we utilized Windkessel RCR boundary conditions that incorporate distal capacitance and resistance and tuned the values to achieve physiological pressure and flow waveforms. Many previous studies also ran simulations of only 2 or 3 cardiac cycles (Cebral et al., 2005a; Boussel et al., 2008; Castro et al., 2009; Cebral et al., 2011; Mut et al., 2011; Xiang et al., 2011; Byrne et al., 2014; Sforza et al., 2016; Brinjikji et al., 2017; Chung et al., 2018), which we did not find to be enough to achieve pressure convergence in many cases. In this study, we ensured temporal convergence by running simulations until a limit cycle was reached.
Further, previous studies investigating CFD in growing vs. stable cerebral aneurysms reported using a constant mesh size across all models and did not perform mesh refinement to ensure spatial convergence of hemodynamic values such as WSS (Cebral et al., 2005a; Mut et al., 2011; Brinjikji et al., 2017). Previous papers have investigated the effect of mesh size on cerebral aneurysm flow simulations (Cebral et al., 2005b), however these did not look at the effect of mesh size on WSS specifically and only noted the effect of mesh size on overall flow features. As a gradient of the velocity field, it is known that WSS is more sensitive to mesh size in finite element models (Craven et al., 2018) and can require additional mesh refinement to achieve similar levels of convergence. Throughout our mesh adaptation studies, we saw that WSS was highly sensitive to changes in mesh size, and we even observed changes in WSS greater than 150% between refinement steps (Figure 3). This has significant implications on the accuracy of WSS in studies that forgo mesh convergence and indicates that mesh convergence is necessary to have strong confidence in the accuracy of reported WSS values. By conducting a WSS convergence study, we can be confident that the WSS values we calculate accurately represent the hemodynamic stresses inside of our modeled geometries.
There remain several limitations in our study. We modeled our blood as an incompressible Newtonian fluid. Some studies indicate that the assumption of blood as a Newtonian fluid may be a significant oversimplification of hemodynamics, but a clear consensus has not yet been reached about the importance of non-Newtonian effects on the simulation of cerebral aneurysms, or which non-Newtonian model should be selected. Some studies found that hemodynamic differences are less sensitive to blood constitutive law than they are to aneurysm geometry (Fisher and Stroud Rossmann, 2009), while others suggest that the Newtonian assumption could overestimate wall shear stress in low-flow regions (Xiang et al., 2012). However, both studies came to the conclusion that the Newtonian fluid assumption is generally acceptable in CFD of cerebral aneurysms (Fisher and Stroud Rossmann, 2009; Xiang et al., 2012).
We also assumed rigid vessel walls due to the lack of information regarding vessel wall thickness and mechanical properties. A CFD study on the influence of wall compliance on hemodynamics in intracranial aneurysms observed an overestimation of WSS magnitude in rigid models, but a number of other hemodynamic characteristics were not found to vary significantly between rigid models and compliant models (Dempere-Marco et al., 2006). Although there may be differences in CFD analysis of rigid and compliant vessels, the variation of wall motion among patients is unknown (Dempere-Marco et al., 2006), as are the wall compliance properties of our modeled aneurysms. For this reason, we assumed a rigid wall for all of our models.
Another limitation was utilizing the same flow profile across our patient cohort. While there may be differences in cerebral inflow among patients, patient-specific flows are rarely measured in practice due to the additional time required to obtain the measurements and the difficulty of perpendicular slice selection at desired locations as a result of the tortuous nature of cerebral vascular (Gwilliam et al., 2009). The lack of clinically measured, patient-specific flow profiles for each patient in our study necessitated this assumption. Alternative approaches may be considered in the future, including scaling the waveform based on allometric assumptions of cardiac output. Another approach to account for lack of patient-specific waveforms may be to couple the 3D aneurysm domain to a 0D or 1D lumped parameter network representing the global cardiovascular system (Moghadam et al., 2013). While such 0D-3D or 1D-3D coupling could potentially better account for the effect of patient-specific geometries on the inlet flow profile, it may be difficult to identify patient-specific values for the parameter values of the network, and the estimation of said parameters warrants careful thought.
Further, we categorized aneurysms as stable or growing based upon imaging studies separated in time by at least 1 year, but it is possible that aneurysms in this study have been miscategorized. For instance, aneurysms that seem to be stable over a 1-year period may in fact be growing aneurysms with a growth rate for which a 1-year time interval was not enough to detect any change. Including growing aneurysms in our control group would inhibit our ability to detect differences between groups.
Finally, we were limited by the low cohort size in this matched-pair study. The inclusion of additional patients could increase the statistical power of our findings and may be particularly impactful in investigating metrics we observed at p = 0.10 significance. This points to future work where our modeling pipeline could be applied to a larger cohort of matched-pair cerebral aneurysms. In addition, future studies could investigate a wider variety of hemodynamic metrics. While our study focused on the relationship between WSS and aneurysm growth due to the heavy implication of WSS as a driving factor of aneurysm progression, several studies have found significant or near-significant correlation between vorticity and shear concentration and aneurysm growth and rupture (Sforza et al., 2016; Brinjikji et al., 2017). Applying our robust modeling techniques to a study where these additional metrics are investigated would increase confidence in the analyzed hemodynamic values.
Data availability statement
The raw data supporting the conclusion of this article will be made available by the authors, without undue reservation.
Ethics statement
The studies involving humans were approved by the Stanford University Institutional Review Board: Retrospective Imaging and Outcomes Review of Stroke Patients. The studies were conducted in accordance with the local legislation and institutional requirements. Written informed consent for participation was not required from the participants or the participants’ legal guardians/next of kin in accordance with the national legislation and institutional requirements.
Author contributions
AW: Formal Analysis, Investigation, Methodology, Software, Writing–original draft, Writing–review and editing. AP: Investigation, Methodology, Writing–original draft. ES: Validation, Writing–original draft, Writing–review and editing, Supervision. ZS: Validation, Writing–review and editing, Supervision. IL: Validation, Writing–review and editing, Supervision. TG: Data curation, Writing–review and editing. AM: Supervision, Writing–review and editing. NT: Conceptualization, Data curation, Supervision, Writing–review and editing.
Funding
The author(s) declare financial support was received for the research, authorship, and/or publication of this article. American Heart Association Award No. 882080, Stanford Cardiovascular Institute, Stanford Research Experience for Undergraduates.
Acknowledgments
CFD simulations were performed using Stanford Research Computing Center’s Sherlock cluster.
Conflict of interest
The authors declare that the research was conducted in the absence of any commercial or financial relationships that could be construed as a potential conflict of interest.
The author(s) declared that they were an editorial board member of Frontiers, at the time of submission. This had no impact on the peer review process and the final decision.
Publisher’s note
All claims expressed in this article are solely those of the authors and do not necessarily represent those of their affiliated organizations, or those of the publisher, the editors and the reviewers. Any product that may be evaluated in this article, or claim that may be made by its manufacturer, is not guaranteed or endorsed by the publisher.
Supplementary material
The Supplementary Material for this article can be found online at: https://www.frontiersin.org/articles/10.3389/fphys.2023.1300754/full#supplementary-material
References
Ahrens J., Geveci B., Law C. (2005). ParaView: an end-user tool for large data visualization. Vis. Handb. 717, 8. doi:10.1016/b978-012387582-2/50038-1
Boussel L., Rayz V., McCulloch C., Martin A., Acevedo-Bolton G., Lawton M., et al. (2008). Aneurysm growth occurs at region of low wall shear stress: patient-specific correlation of hemodynamics and growth in a longitudinal study. Stroke 39 (11), 2997–3002. doi:10.1161/STROKEAHA.108.521617
Brinjikji W., Chung B. J., Jimenez C., Putman C., Fallmes D. F., Cebral J. R. (2017). Hemodynamic differences between unstable and stable unruptured aneurysms independent of size and location: a pilot study. J. Neurointerv Surg. 9 (4), 376–380. doi:10.1136/neurintsurg-2016-012327
Byrne G., Mut F., Cebral J. (2014). Quantifying the large-scale hemodynamics of intracranial aneurysms. AJNR Am. J. Neuroradiol. 35, 333–338. doi:10.3174/ajnr.A3678
Castro M., Putman C., Sheridan M., Cebral J. (2009). Hemodynamic patterns of anterior communicating artery aneurysms: a possible association with rupture. AJNR Am. J. Neuroradiol. 30, 297–302. doi:10.3174/ajnr.A1323
Cebral J. R., Castro M. A., Appanaboyina S., Putman C. M., Millan D., Frangi A. F. (2005b). Efficient pipeline for image-based patient-specific analysis of cerebral aneurysm hemodynamics: technique and sensitivity. IEEE Trans. Med. Imaging 24 (4), 457–467. doi:10.1109/tmi.2005.844159
Cebral J. R., Castro M. A., Burgess J. E., Pergolizzi R. S., Sheridan M. J., Putman C. M. (2005a). Characterization of cerebral aneurysms for assessing risk of rupture by using patient-specific computational hemodynamics models. Am. J. Neuroradiol. 26 (10), 2550–2559.
Cebral J. R., Mut F., Weir J., Putman C. (2011). Quantitative characterization of the hemodynamic environment in ruptured and unruptured brain aneurysms. AJNR Am. J. Neuroradiol. 32 (1), 145–151. doi:10.3174/ajnr.A2419
Chnafa C., Brina O., Pereira V. M., Steinman D. A. (2018). Better than nothing: a rational approach for minimizing the impact of outflow strategy on cerebrovascular simulations. AJNR Am. J. Neuroradiol. 39 (2), 337–343. doi:10.3174/ajnr.A5484
Chung B. J., Mut F., Putman C. M., Hamzei-Sichani F., Brinjikji W., Kallmes D., et al. (2018). Identification of hostile hemodynamics and geometries of cerebral aneurysms: a case-control study. Am. J. Neuroradiol. 39 (10), 1860–1866. doi:10.3174/ajnr.A5764
Craven B. A., Aycock K. I., Manning K. B. (2018). Steady flow in a patient-averaged inferior vena cava-Part II: computational fluid dynamics verification and validation. Cardiovasc Eng. Technol. 9, 654–673. doi:10.1007/s13239-018-00392-0
Dempere-Marco L., Oubel E., Castro M., Putman C., Frangi A., Cebral J. (2006). CFD analysis incorporating the influence of wall motion: application to intracranial aneurysms. Med. Image Comput. Comput. Assist. Interv. 9 (2), 438–445. doi:10.1007/11866763_54
Fisher C., Stroud Rossmann J. (2009). Effect of non-Newtonian behavior on hemodynamics of cerebral aneurysms. J. Biomech. Eng. 131 (9), 091004. doi:10.1115/1.3148470
Fukazawa K., Ishida F., Umeda Y., Miura Y., Shimosaka S., Matsushima S., et al. (2015). Using computational fluid dynamics analysis to characterize local hemodynamic features of middle cerebral artery aneurysm rupture points. World Neurosurg. 83 (1), 80–86. doi:10.1016/j.wneu.2013.02.012
Gwilliam M. N., Hoggard N., Capener D., Singh P., Marzo A., Verma P. K., et al. (2009). MR derived volumetric flow rate waveforms at locations within the common carotid, internal carotid, and basilar arteries. J. Cereb. Blood Flow. Metab. 29, 1975–1982. doi:10.1038/jcbfm.2009.176
Kobayashi N., Karino T. (2010). Flow patterns and velocity distributions in the human vertebrobasilar arterial system. Laboratory investigation. J. Neurosurg. 113 (4), 810–819. doi:10.3171/2010.1.JNS09575
Kono K., Fujimoto T., Shintani A., Terada T. (2012). Hemodynamic characteristics at the rupture site of cerebral aneurysms: a case study. Neurosurgery 71 (6), E1202–E1208. doi:10.1227/NEU.0b013e31826f7ede
Meng H., Tutino V. M., Xiang J., Siddiqui A. (2014). High WSS or low WSS? Complex interactions of hemodynamics with intracranial aneurysm initiation, growth, and rupture: toward a unifying hypothesis. AJNR Am. J. Neuroradiol. 35 (7), 1254–1262. doi:10.3174/ajnr.A3558
Meng H., Wang Z., Hoi Y., Gao L., Metaxa E., Swartz D. D., et al. (2007). Complex hemodynamics at the apex of an arterial bifurcation induces vascular remodeling resembling cerebral aneurysm initiation. Stroke 38, 1924–1931. doi:10.1161/STROKEAHA.106.481234
Metaxa E., Tremmel M., Natarajan S. K., Xiang J., Paluch R. A., Mandelbaum M., et al. (2010). Characterization of critical hemodynamics contributing to aneurysmal remodeling at the basilar terminus in a rabbit model. Stroke 41, 1774–1782. doi:10.1161/STROKEAHA.110.585992
Moghadam M. E., Vignon-Clementel i. E., Figliola R., Marsden A. L., Investigators M. O. C. H. A. M. (2013). A modular numerical method fo implicit 0D/3D coupling in cardiovascular finite element simulations. J Comput. Phys 244, 63–79. doi:10.1016/j.jcp.2012.07.035
Mut F., Löhner R., Chien A., Tateshima S., Viñuela F., Putman C., et al. (2011). Computational hemodynamics framework for the analysis of cerebral aneurysms. Int. J. Numer. Method Biomed. Eng. 27 (6), 822–839. doi:10.1002/cnm.1424
Research Group Numerical Mathematics and Scientific Computing (2015). TetGen. Avaliable at: https://wias-berlin.de/software/index.jsp?id=TetGen (Accessed July 11, 2022).
Sadasivan C., Fiorella D. J., Woo H. H., Lieber B. B. (2013). Physical factors effecting cerebral aneurysm pathophysiology. Ann. Biomed. Eng. 41 (7), 1347–1365. doi:10.1007/s10439-013-0800-z
Seymour R. S., Hu Q., Snelling E. P. (2020). Blood flow rate and wall shear stress in seven major cephalic arteries of humans. J. Anat. 236 (3), 522–530. doi:10.1111/joa.13119
Sforza D. M., Kono K., Tateshima S., Viñuela F., Putman C., Cebral J. R. (2016). Hemodynamics in growing and stable cerebral aneurysms. J. Neurointerv Surg. 8 (4), 407–412. doi:10.1136/neurintsurg-2014-011339
Sforza D. M., Putman C. M., Cebral J. R. (2009). Hemodynamics of cerebral aneurysms. Annu. Rev. Fluid Mech. 41, 91–107. doi:10.1146/annurev.fluid.40.111406.102126
Shojima Md M., Oshima M., Takagi K., Torii R., Hayakawa M., Katada K., et al. (2004). Magnitude and role of wall shear stress on cerebral aneurysm: computational fluid dynamic study of 20 middle cerebral artery aneurysms. Stroke 35, 2500–2505. doi:10.1161/01.STR.0000144648.89172.0f
Vignon-Clementel I. E., Figueroa C. A., Jansen K. E., Taylor C. A. (2010). Outflow boundary conditions for 3D simulations of non-periodic blood flow and pressure fields in deformable arteries. Comput. Methods Biomech. Biomed. Engin 13 (5), 625–640. doi:10.1080/10255840903413565
Wake-Buck A. K., Gatenby J. C., Gore J. C. (2012). Hemodynamic characteristics of the vertebrobasilar system analyzed using MRI-based models. PLoS One 7, 513466–e51412. doi:10.1371/journal.pone.0051346
Xiang J., Natarajan S. K., Tremmel M., Ma D., Mocco J., Hopkins L. N., et al. (2011). Hemodynamic-morphologic discriminants for intracranial aneurysm rupture. Stroke 42, 144–152. doi:10.1161/STROKEAHA.110.592923
Keywords: aneurysm, cerebral, blood flow, stroke, intracranial, computational fluid dynamics, hemodynamics
Citation: Weiss AJ, Panduro AO, Schwarz EL, Sexton ZA, Lan IS, Geisbush TR, Marsden AL and Telischak NA (2023) A matched-pair case control study identifying hemodynamic predictors of cerebral aneurysm growth using computational fluid dynamics. Front. Physiol. 14:1300754. doi: 10.3389/fphys.2023.1300754
Received: 23 September 2023; Accepted: 29 November 2023;
Published: 15 December 2023.
Edited by:
Dalin Tang, Worcester Polytechnic Institute, United StatesCopyright © 2023 Weiss, Panduro, Schwarz, Sexton, Lan, Geisbush, Marsden and Telischak. This is an open-access article distributed under the terms of the Creative Commons Attribution License (CC BY). The use, distribution or reproduction in other forums is permitted, provided the original author(s) and the copyright owner(s) are credited and that the original publication in this journal is cited, in accordance with accepted academic practice. No use, distribution or reproduction is permitted which does not comply with these terms.
*Correspondence: Nicholas A. Telischak, teli@stanford.edu