 Yu-Tang Tung1,2,3
 Chi-Chang Huang
 Wen-Ching Huang
- 1Graduate Institute of Metabolism and Obesity Sciences, Taipei Medical University, Taipei, Taiwan
- 2Nutrition Research Center, Taipei Medical University Hospital, Taipei, Taiwan
- 3Cell Physiology and Molecular Image Research Center, Wan Fang Hospital, Taipei Medical University, Taipei, Taiwan
- 4Graduate Institute of Sports Science, National Taiwan Sport University, Taoyuan City, Taiwan
- 5Proteomics Research Center, National Yang-Ming University, Taipei, Taiwan
- 6Agricultural Biotechnology Research Center, Academia Sinica, Taipei, Taiwan
- 7Department of Exercise and Health Science, National Taipei University of Nursing and Health Sciences, Taipei, Taiwan
Regular exercise prevents lipid abnormalities and conditions such as diabetes mellitus, hypertension, and obesity; it considerably benefits sedentary individuals. However, individuals exhibit highly variable responses to exercise, probably due to genetic variations. Animal models are typically used to investigate the relationship of intrinsic exercise capacity with physiological, pathological, psychological, behavioral, and metabolic disorders. In the present study, we investigated differential physiological adaptations caused by intrinsic exercise capacity and explored the regulatory molecules or mechanisms through multiomics approaches. Outbred ICR mice (n = 100) performed an exhaustive swimming test and were ranked based on the exhaustive swimming time to distinguish intrinsically high- and low-capacity groups. Exercise performance, exercise fatigue indexes, glucose tolerance, and body compositions were assessed during the experimental processes. Furthermore, the gut microbiota, transcriptome, and proteome of soleus muscle with intrinsically high exercise capacity (HEC) and low exercise capacity (LEC) were further analyzed to reveal the most influential factors associated with differential exercise capacities. HEC mice outperformed LEC mice in physical activities (exhaustive swimming and forelimb grip strength tests) and exhibited higher glucose tolerance than LEC mice. Exercise-induced peripheral fatigue and the level of injury biomarkers (lactate, ammonia, creatine kinase, and aspartate aminotransferase) were also significantly lower in HEC mice than in LEC mice. Furthermore, the gut of the HEC mice contained significantly more Butyricicoccus than that of the LEC mice. In addition, transcriptome data of the soleus muscle revealed that the expression of microRNAs that are strongly associated with exercise performance-related physiological and metabolic functions (i.e., miR-383, miR-107, miR-30b, miR-669m, miR-191, miR-218, and miR-224) was higher in HEC mice than in LEC mice. The functional proteome data of soleus muscle indicated that the levels of key proteins related to muscle function and carbohydrate metabolism were also significantly higher in HEC mice than in LEC mice. Our study demonstrated that the mice with various intrinsic exercise capacities have different gut microbiome as well as transcriptome and proteome of soleus muscle by using multiomics approaches. The specific bacteria and regulatory factors, including miRNA and functional proteins, may be highly correlated with the adaptation of physiological functions and exercise capacity.
Introduction
Unhealthy diet and lack of exercise cause more than 300,000 deaths per year. A sedentary lifestyle is considered an independent risk factor for cardiovascular disease (Blair et al., 1989; McGinnis and Foege, 1993). Regular physical activity can reduce both morbidity and all-cause mortality, including preventing dyslipidemia, diabetes, hypertension, and obesity development (Jennings et al., 1989; Blair et al., 1995). Individuals exhibit variable responses to exercise, which may be primarily mediated through genetic variations (Bouchard et al., 1999). Furthermore, genes determine intrinsic exercise capacity in an untrained state (Braith et al., 1994; Krushkal et al., 1999). High intrinsic exercise capacity is related to genes that determine adaptive responses to exercise (Braith et al., 1994; Bouchard et al., 2000). In addition, aerobic endurance is affected by genetic and environmental factors (Falconer and Mackay, 1996). Researchers have also demonstrated an increased prevalence of interrelated chronic metabolic diseases among individuals with low intrinsic exercise capacity, including insulin resistance, type 2 diabetes mellitus, obesity, and coronary heart disease (Schwarzer et al., 2010; Pekkala et al., 2017; Koch and Britton, 2018). Therefore, aerobic capacity may be closely related to multiple chronic diseases.
Endurance exercise includes running, cross-country skiing, cycling, swimming, and other aerobic exercises, and it can be defined as cardiovascular exercise (Joyner and Coyle, 2008). The physiological and biochemical requirements of endurance exercise elicit muscle- and system-based responses. The main adaptations caused by endurance exercise are improved mechanical, metabolic, neuromuscular, and contractile function in muscles; rebalanced electrolytes (Russell et al., 2013); reduced glycogen stores (Munoz et al., 2010); and increased mitochondrial biogenesis in muscle (Snow et al., 1981). In addition, endurance exercise may cause an increase in oxidative stress, intestinal permeability, muscle damage, systemic inflammation, and immune responses (Davies et al., 1981; Mach and Fuster-Botella, 2017).
The human intestine contains numerous microorganisms that significantly affect host nutrition, metabolic function, intestinal development, immune system function, and epithelial cell maturation (Hooper and Gordon, 2001). The gut microbiota promotes food digestion and absorption (Hsu et al., 2015), and the microbiota digests and subsequently ferments complex carbohydrates in the colon into short-chain fatty acids, such as n-butyrate, acetate, and propionate. A study found that elite male rugby players had lower levels of Bacteroidetes and higher levels of Firmicutes than healthy non-athletic individuals (Clarke et al., 2014). Regardless of diet, exercise increased the percentage of Bacteroides and reduced the percentage of Firmicutes (Evans et al., 2014). In ovariectomized female high-capacity runner (HCR) and low-capacity runner (LCR) breed rats, exercise intervention caused differential effects on host metabolism and gut microbial communities. The abundance of Firmicutes, Proteobacteria, and Cyanobacteria caused shifts in ovariectomized LCR, but Christensenellaceae was significantly higher in HCR rats than in LCR rats (Liu et al., 2015). Another similar ovariectomized model also validated that the microbial diversity and number of the Bacteroidetes phylum were significantly increased in LCR rats but unchanged in HCR rats without exercise intervention (Cox-York et al., 2015).
In traditional analysis methods, reductionist approaches are insufficient to comprehensively portray connections and regulation of complicated biological responses. The term omics implies a comprehensive (or global) assessment of a set of molecules. Several omics technologies exist, including genomics, epigenomics, transcriptomics, proteomics, metabolomics, and microbiomics, which are all well-developed and widely used in different fields (Hasin et al., 2017). Compared with a single omics type, multiomics can provide different perspectives on the flow of information underlying phenotypes, physiological responses, and disease development.
In this study, we examined the effects of intrinsic high exercise capacity (HEC) and low exercise capacity (LEC) on physical activity performance and on physiological and biochemical data using a multiomics approach. Our results could provide alternative perspectives on regulatory mechanisms for physiological adaptations and even on critical factors affecting health.
Materials and Methods
Animals and Group Design
Male outbred ICR mice (7 weeks old) were purchased from a supplier accredited by the Association for Assessment and Accreditation of Laboratory Animal Care (BioLASCO, Yi-Lan, Taiwan). Experimental animals were maintained in the animal room at the National Taiwan Sport University (NTSU), and all procedures were approved by the Institutional Animal Care and Use Committee of the NTSU (IACUC-10103). All animals were maintained at 23 ± 2°C (room temperature) and 60 ± 5% humidity and were fed a standard laboratory diet (Laboratory Rodent Diet #5001, PMI Nutrition International, Brentwood, MO, United States) and distilled water ad libitum. Mice were acclimated to the environment for 1 week before experiments were conducted. Then, all 100 mice, without artificial selection population as F0 generation, performed an exhaustive swimming test, with 5% body weight (BW) loading on the tail. After the test, the mice were categorized into three groups on the basis of the exhaustive swimming time: LEC (15 lowest capacity mice), medium exercise capacity (MEC; 15 medium capacity mice), and HEC (15 highest capacity mice) (Figure 1).
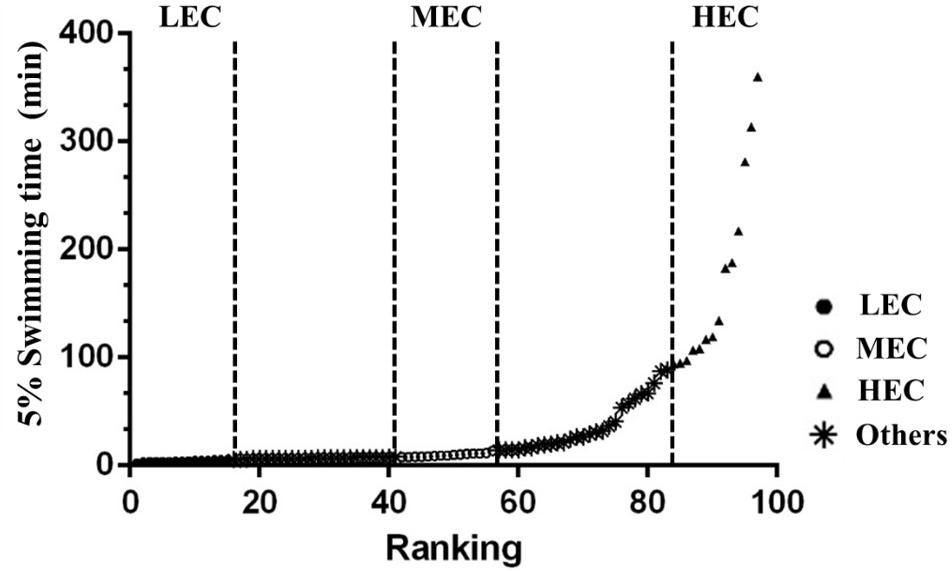
Figure 1. Capacity ranking from low to high for male mice (n = 100). The 15 lowest ranked, 15 medium ranked, and 15 highest ranked mice were categorized as low exercise capacity (LEC), medium exercise capacity (MEC), and high exercise capacity (HEC) mice for study experiments.
Exhaustive Swimming Exercise
Mice were individually placed in a columnar swimming pool (65 cm in height and 20 cm in diameter) with a 40-cm water depth maintained at 27 ± 1°C. A weight equivalent to 5% of the mouse’s BW was attached to the base of the tail, and for each mouse, endurance was measured as the swimming time recorded from the beginning of the time in the pool to exhaustion. The swimming period was defined as time spent floating, struggling, and making necessary movements until exhaustion – as indicated by evident uncoordinated movements and failure to swim to the water surface within 7 s (Huang et al., 2012).
Forelimb Grip Strength
Forelimb grip strength was assessed 1 week after the exhaustive swimming test. A low-force testing system (Model-RX-5, Aikoh Engineering, Nagoya, Japan) was used to measure the absolute forelimb grip strength of mice, as previously described (Huang et al., 2012). Tensile force was measured using a force transducer equipped with a metal bar (2 mm in diameter and 7.5 cm in length) for each mouse. The maximal force (g) recorded was used as an indicator of absolute grip strength.
Fatigue-Associated Biochemical Indices
Fatigue-associated biochemical indices were assessed 1 week after the forelimb grip strength test. Blood samples were collected immediately after mice swam for 15 min. After centrifugation at 1,500 × g for 10 min at 4°C, serum was analyzed on an automatic analyzer (Hitachi 7060, Hitachi, Tokyo, Japan). Biochemical variables, namely lactate, ammonia, blood urea nitrogen (BUN), glucose, lactic dehydrogenase (LDH), creatinine kinase (CK), aspartate aminotransferase (AST), and alanine aminotransferase (ALT), were evaluated as indices of exercise fatigue, as detailed previously (Huang et al., 2012; Wang et al., 2012; Wu et al., 2013).
Oral Glucose Tolerance Test
An oral glucose tolerance test (OGTT) was conducted 1 week after assessment of fatigue-associated biochemical indices. Mice were fasted for 14 h before the OGTT. An oral gavage of glucose (2.5 g/kg BW) was administered, and blood samples were collected at 0, 15, 30, 60, and 120 min and analyzed using a glucometer, Roche Accu-Chek® Comfort Curve (Roche Diagnostics, Indianapolis, IN, United States).
Blood Biochemical Assessments
At the end of the final experiment, all mice were killed by 95% CO2 asphyxiation at an optimal flow rate for CO2 displacement of 15% chamber volume per minute; then, their blood was withdrawn through a cardiac puncture after an 8-h fas. The blood was centrifuged at 1,500 × g for 10 min at 4°C, and the serum was used to assess the levels of AST, ALT, LDH, albumin, total protein (TP), BUN, alkaline phosphatase (Alk-P), creatinine, CK, uric acid (UA), total cholesterol (TC), triacylglycerol (TG), and glucose using the autoanalyzer (Hitachi 7060, Tokyo, Japan).
Tissue Sample Preparation
At the end of the study, the key tissues and organs – the liver, muscles (gastrocnemius and soleus muscles), kidney, heart, lung, epididymal fat pad (EFP), and brown adipose tissue (BAT) – were carefully removed and weighed. The total weight and specific tissue weights relative to individual BW (%) were recorded. Then, these tissues were immediately stored in liquid nitrogen, and the soleus muscle was collected separately for further proteomics and transcriptomics analyses.
Bacterial DNA Extraction and 16S rRNA Sequencing
Fecal samples were collected 1 week after the OGTT. Mice in each group were housed in a metabolic cage with food and water calculated to produce individual feces. The feces were immediately stored at −80°C for bacterial DNA extraction. Feces (500 mg) were homogenized (MagNA Lyser System; Roche, Basel, Switzerland) in ASL buffer, and DNA was extracted directly using the QIAamp DNA Stool Mini Kit (Qiagen, Germany) according to the manufacturer’s instructions. Extracted DNA was stored at −80°C before 16S rRNA sequencing. The hypervariable V3–V5 region of the bacterial 16S rRNA gene was amplified through polymerase chain reaction (PCR) with barcoded universal primers V3-357F (forward primer; 5′-CCTA TCCCCTGTGTGCCTTGGCAGTCTCAGCCTACGGGAGGCA GCAG-3′) and V5-926R (reverse primer; 5′-CCATCTCATCCC TGCGTGTCTCCGACTCAG NNNNNNCCGTCAATTCMTTT RAGT-3′). The underlined sequences are the 454 FLX sequencing primers, and the bold letters denote the universal 16S rRNA primers. The barcode within the primer is denoted by Ns. The regions of the 16S rRNA gene were amplified using FastStart HiFi Polymerase (Roche, Basel, Switzerland). The sequencing reaction was performed in a 9700 thermal cycler (Applied Biosystems, Foster, CA, United States) at 94°C for 4 min, followed by 40 cycles at 94°C for 15 s, 50°C for 45 s, and 72°C for 1 min, then held at 72°C for 8 min, and finally maintained at 4°C until use. The presence of amplicons was confirmed through 1.5% agarose gel electrophoresis. PCR amplicons were purified using the Agencourt AMPure XP Reagent (Beckman CoulterTM, Pasadena, CA, United States) and quantified using Agilent Bioanalyzer (Agilent Technologies, Palo Alto, CA, United States). Equimolar amounts of PCR amplicons were mixed in a single tube. The purified amplicon mixtures were sequenced on the GS Junior System (454 Life Sciences, a Roche Company, Branford, CT, United States) according to the protocols recommended by the manufacturer. The sequences were further analyzed using a Ribosomal Database Project Naive Bayesian rRNA Classifier (version 2.5) to categorize the microbiota and investigate the relative proportions of microbiota existing in an indicated sample.
Soleus Muscle MicroRNA TaqMan Low-Density Array Analysis
Total RNA was isolated using the TRI reagent (Thermo Scientific, San Jose, CA, United States) for further miRNA expression profiling. Total RNA was quantified using NanoDrop ND-1000 (Thermo Scientific, San Jose, CA, United States), and RNA integrity (RNA integrity number ≥ 6) was verified using the RNA 6000 Nano kit (Agilent Technologies, Palo Alto, CA, United States). The miRNA expression profile in the soleus muscle of mice in each capacity group was analyzed using the TaqMan Low-Density Array (TLDA) Rodent MicroRNA Cards (version 3A and B; Applied Biosystems, Foster, CA, United States). Each card contains 375 precoated rodent miRNA targets, all cataloged in the miRBase database, with three endogenous controls: Mamm U6, U87, and Y1. In this study, U87 was used as the endogenous normalizer. Total RNA (100 ng) was reverse-transcribed using Megaplex RT primer Pools A and B (381 stem-looped primers per pool) and the TaqMan MicroRNA Reverse Transcription kit (Applied Biosystems, Foster, CA, United States). The preamplified product was diluted with the TaqMan Universal PCR master mix (Applied Biosystems, Foster, CA, United States) and deionized distilled water, and it was loaded into one of the eight fill ports on the TLDA microfluidic card. The card was centrifuged for 1 min at 331 × g to distribute samples to multiple wells connected to the fill ports and was then sealed to prevent well-to-well contamination. All cards were processed and analyzed on a 7900 HT Real-Time PCR System (Applied Biosystems, Foster, CA, United States). Real-time RT-PCR data analysis was performed using the RQ Manager (version 1.2.1; Applied Biosystems, Foster, CA, United States) and Partek Genomic Suite (version 6.6). The expression level was calculated using the comparative Ct (ΔΔCt) method and was further analyzed by comparing the fold change relative to HEC and LEC. The results of the TLDA analysis were converted into a graphic display heat map based on hierarchical clustering using DataAssist (version 2.0).
Soleus Muscle Proteomics Analysis
Soleus muscle protein samples (50 μg) were applied to the gel in triplicate, and the sizes of proteins were visualized by staining with Coomassie Brilliant Blue G-250 (Bio-Rad, Hercules, CA, United States). After electrophoresis gel lanes were split into 10 equal fractions, the slices were destained through repeated washing in a solution of 25 mM ammonium bicarbonate and 50% (V/V) acetonitrile (1:1) until the protein bands were invisible. After completely drying them on Speed-Vac (Thermo Electron, Waltham, MA, United States), the proteins in the gel fragments were then subjected to reduction and cysteine alkylation reactions to irreversibly break the disulfide bridges in the proteins. For reduction, each gel piece was rehydrated with 2% (V/V) β-mercaptoethanol in 25 mM ammonium bicarbonate and incubated at room temperature for 20 min in the dark. Cysteine alkylation was performed by adding an equal volume of 10% (V/V) 4-vinylpyridine in 25 mM ammonium bicarbonate and 50% (V/V) acetonitrile for 20 min. The samples were then washed by soaking them in 1 mL of 25 mM ammonium bicarbonate for 10 min. After drying on Speed-Vac for 20 min, in-gel trypsin digestion was performed by incubating the samples with 100 ng of modified trypsin (Promega, Mannheim, Germany) in 25 mM ammonium bicarbonate at 37°C overnight. The supernatant of the tryptic digest was transferred to an Eppendorf tube. For extraction of the remaining peptides from the gel, 25 mM ammonium bicarbonate and 50% (V/V) acetonitrile were added, the samples were incubated for 10 min, and then the solution was collected. The resulting digests were dried in Speed-Vac and stored at −20°C. Each cryo-stored tryptic digest was resuspended in 30 μL of 0.1% (V/V) formic acid and analyzed using an online nanoAcquity ultra-performance liquid chromatography system (Waters, Manchester, United Kingdom) coupled to a hybrid linear ion trap Orbitrap (LTQ-Orbitrap Discovery) mass spectrometer with a nanoelectrospray ionization source (Thermo Scientific, San Jose, CA, United States). The eluted peptides were ionized with a spray of 2.33 kV and placed in the mass spectrometer. Mass spectrometric data were obtained using the data-dependent acquisition method, in which one full mass spectrometry survey scan (m/z 200–1,500) at a high resolution of 30,000 full width at half maximum width was followed by tandem MS (m/z 200–1,500) of the six most intense multiple-charged ions. A protein was identified when at least two unique peptides were matched with an Xcorr score of >2.5 for each peptide. The false discovery rate (≤1%) obtained from the search was compared against the decoy database to identify the protein.
Statistical Analysis
Statistical analyses were performed using SPSS (version 18.0; SPSS, Chicago, IL, United States). Data are expressed as mean ± standard deviation (SD). Significant differences in weight, diet, body composition, biochemical data, and physical activity performance among HEC, MEC, and LEC mice were calculated using one-way analysis of variance (ANOVA) and Duncan’s test, and p < 0.05 was considered significant. In addition, an independent t-test was used to compare the intestinal microbiota, transcriptome, and proteome of soleus muscle between HEC and LEC mice, and p < 0.05 (∗) was considered statistically significant.
Results
Intrinsic Aerobic Endurance and Grip Strength Performance
Mice (n = 100) performed an exhaustive swimming test under 5% BW loading. Intrinsic aerobic endurance was ranked according to the exhaustive swimming exercise performance of mice (Figure 1). Most mice were exhausted within 100 min, but a few mice demonstrated extreme endurance capacity and swam for >200 min. On the basis of their performance, mice were divided into three experimental groups: LEC (bottom 0–15% performers), MEC (intermediate 42.5–57.5% performers), and HEC (top 85–100% performers) groups. Each group contained 15 mice, all of whom underwent additional physical tests. The exhaustive swimming times of LEC, MEC, and HEC mice were 4.35 ± 0.23, 9.72 ± 0.42, and 172.4 ± 23.79 min, respectively (Figure 2A). Thus, the exhaustive swimming exercise performance of HEC mice significantly exceeded that of LEC mice by 38.6-fold (p < 0.001). In addition, the grip strength of HEC mice (139.2 ± 5.1 g) was higher than that of LEC (124.9 ± 3.2 g) and MEC (129.5 ± 3.2 g) mice (p = 0.032 and p = 0.038, respectively; Figure 2B).
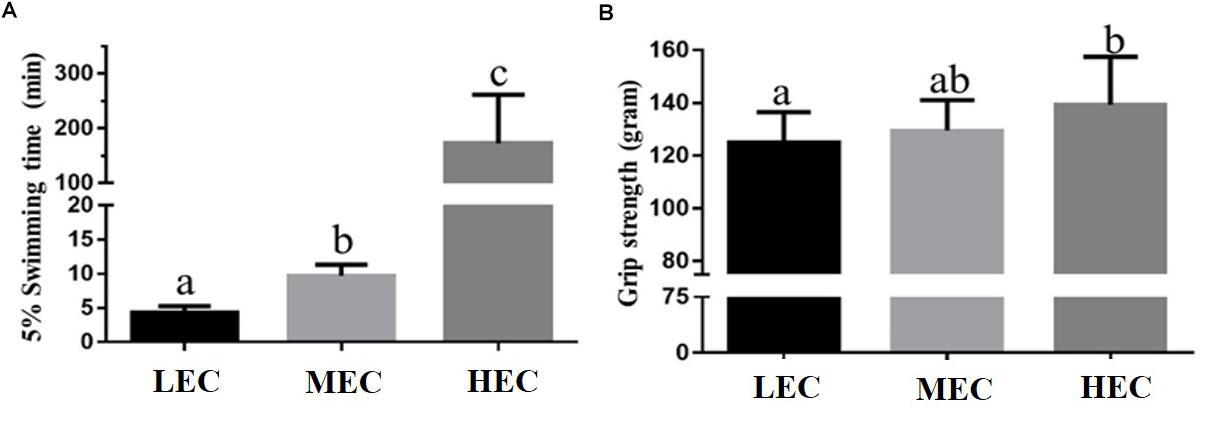
Figure 2. Effect of exercise capacity on (A) exhaustive swimming time and (B) forelimb grip strength. Data are presented as mean ± standard deviation for 15 mice per group. Different letters (a,b,c) indicate a significant difference at p < 0.05 using one-way ANOVA.
BW, Food Uptake, and Tissue Weight
Table 1 lists the BW, daily food intake, and tissue weight of LEC, MEC, and HEC mice. BW, diet, and water intake did not significantly differ among the groups. Therefore, differences in exercise performance were not attributable to nutritional supplementation but to other adaptive physiological factors. In addition, only the muscle weight (particularly the weight of gastrocnemius and soleus muscles) was significantly different between LEC and HEC mice (Table 1): It was 7.7% higher in HEC mice than in LEC mice (p = 0.042).
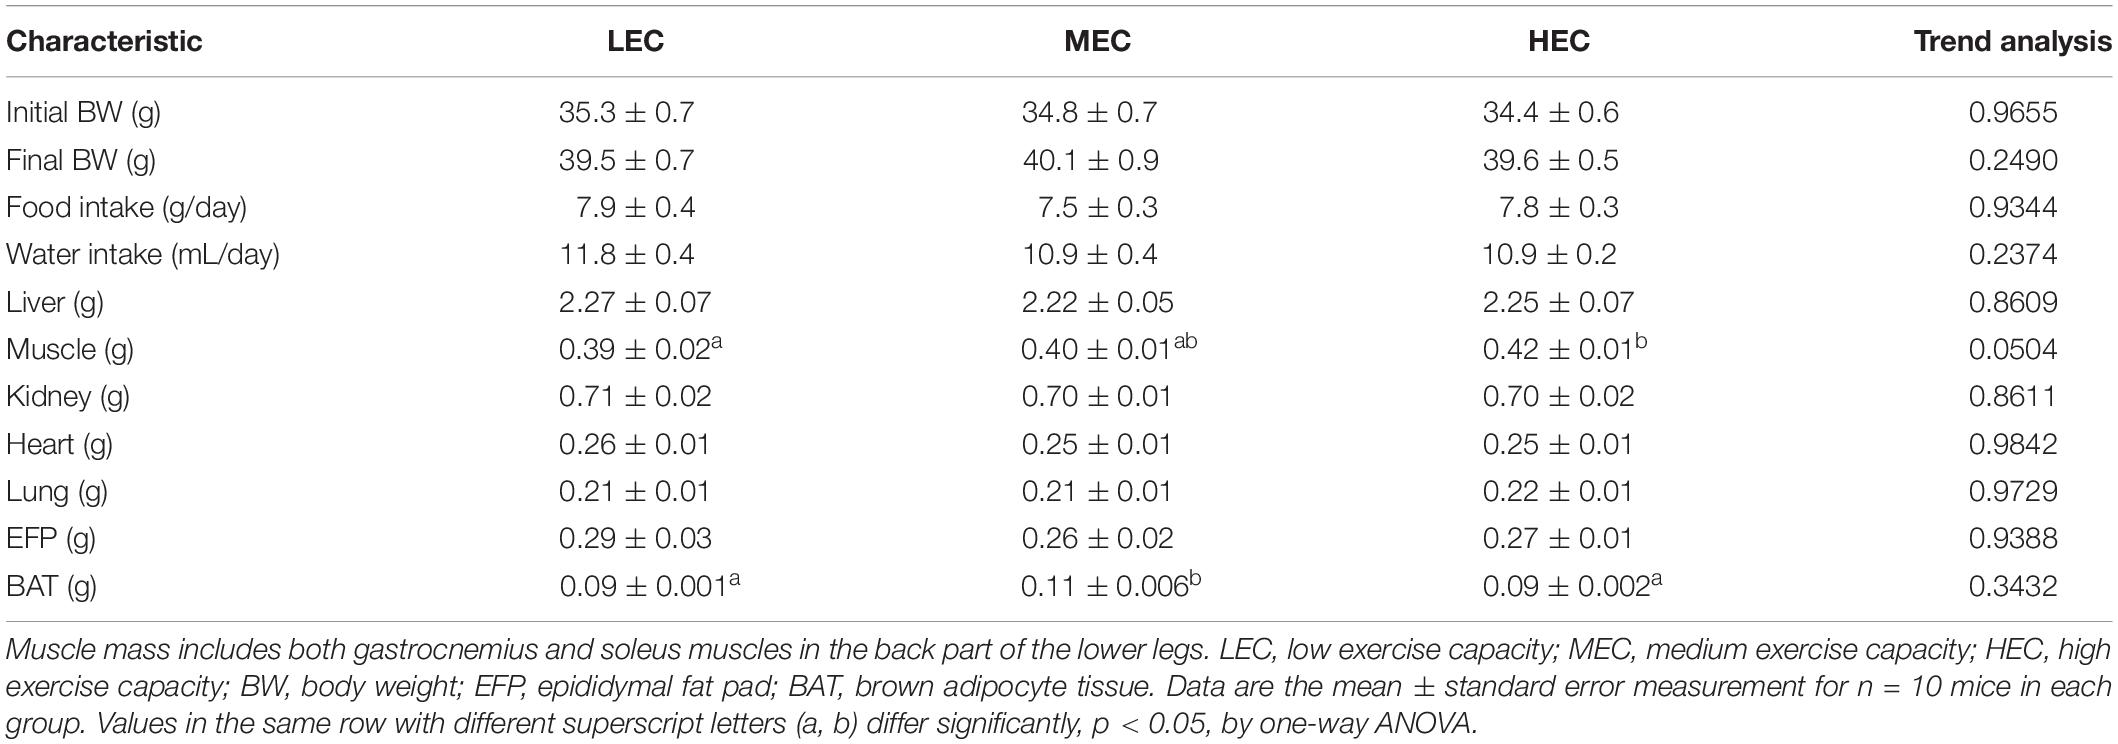
Table 1. Effect of different exercise capacities on general characteristics.
Clinical Biochemistry
We assessed fatigue-related (lactate, ammonia, BUN, and glucose) and injury-related (LDH, CK, AST, and ALT) biomarkers after the acute exercise challenge and evaluated biochemical data at the end of the study. Lactate and ammonia levels in HEC and MEC mice were significantly lower than those in LEC mice (p < 0.05; Figure 3). Regarding injury-related biomarkers, HEC and MEC mice had significantly lower CK and AST levels than LEC mice (p < 0.05; Figure 4). The remaining indicators, namely BUN, glucose, LDH, and ALT, did not differ significantly among the three groups (p > 0.05).
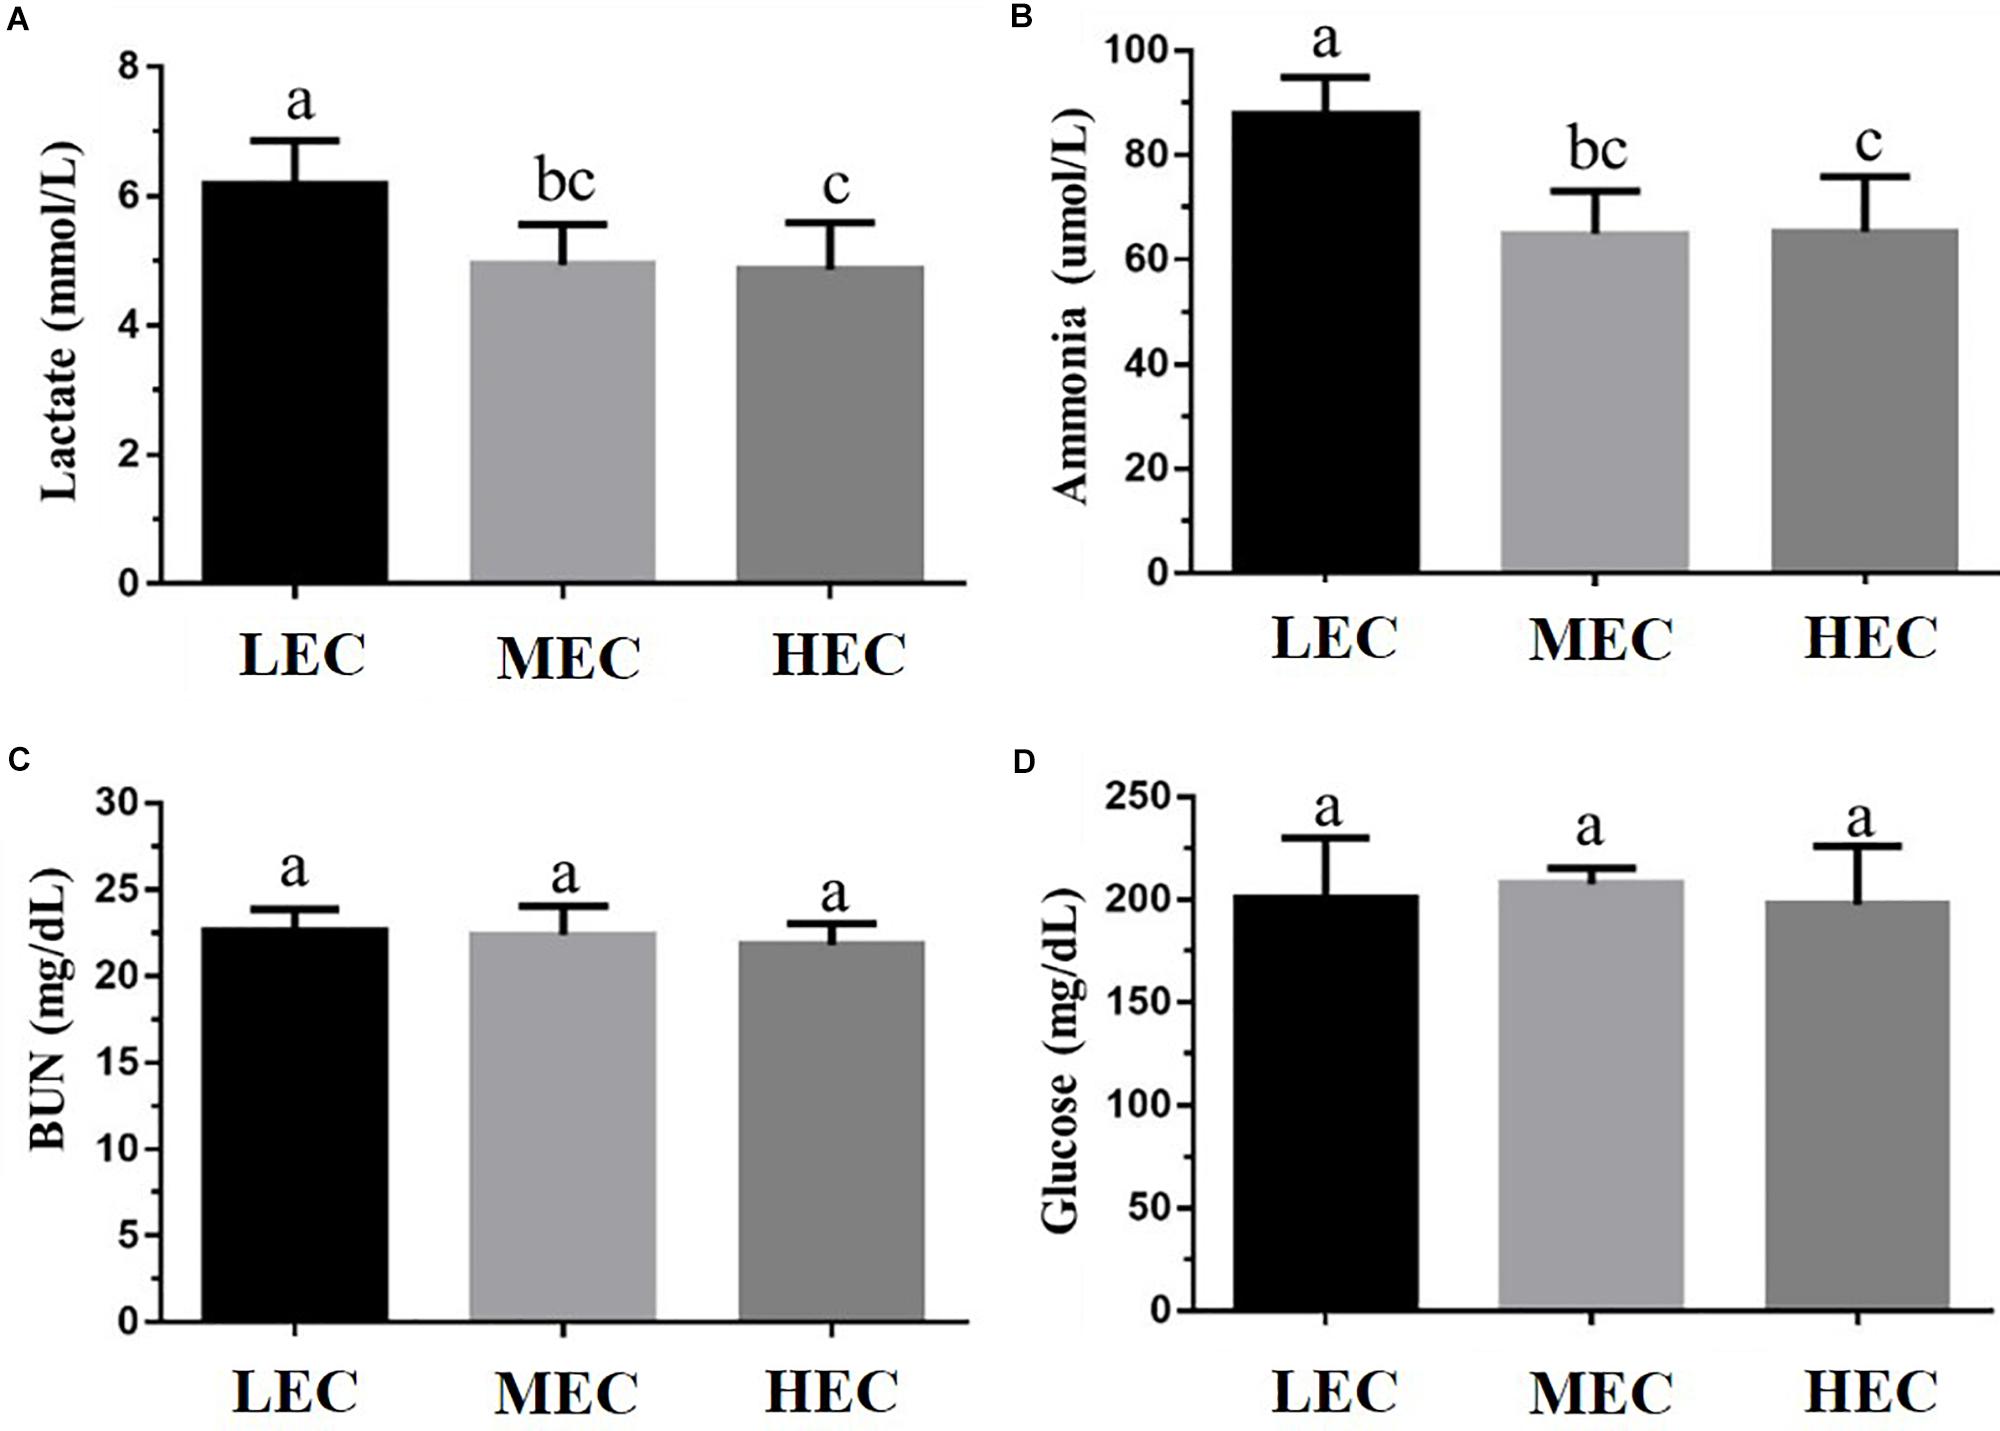
Figure 3. Effect of exercise capacity on fatigue-related biomarkers, namely serum (A) lactate, (B) ammonia, (C) blood urea nitrogen (BUN), and (D) glucose level, after the acute exercise challenge. Data are presented as mean ± standard deviation for 15 mice in each group. Different letters (a,b,c) indicate a significant difference at p < 0.05 using one-way ANOVA.
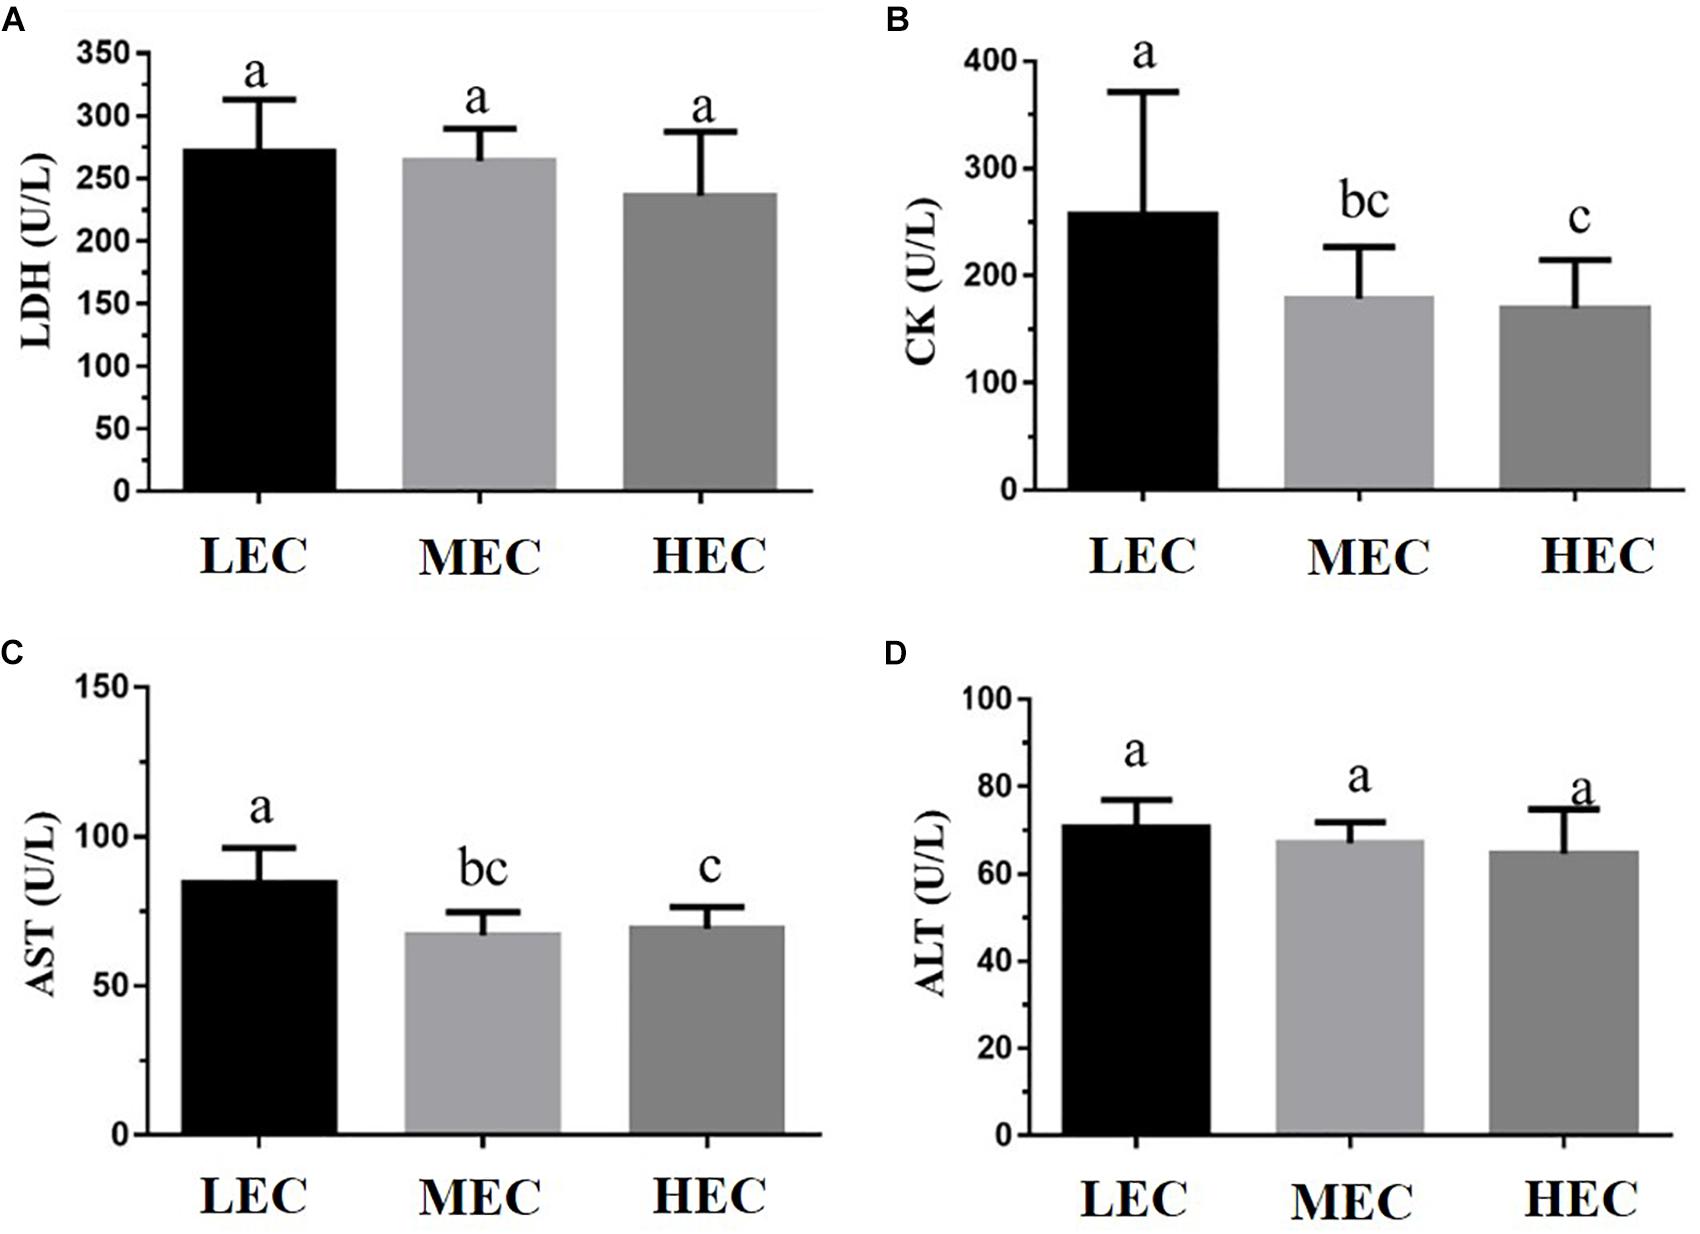
Figure 4. Effect of exercise capacity on injury-related markers, namely serum (A) lactic dehydrogenase (LDH), (B) creatinine kinase (CK), (C) aspartate aminotransferase (AST), and (D) alanine transaminase (ALT) levels, after the acute exercise challenge. Data are presented as mean ± standard deviation for 15 mice in each group. Different letters (a,b,c) indicate a significant difference at p < 0.05 using one-way ANOVA.
Table 2 presents the biochemical data assessed at the end of the study. Compared with LEC mice, HEC and MEC mice demonstrated significantly higher serum albumin levels but significantly lower BUN levels (both p < 0.05). Although ALT, LDH, and Alk-P levels were significantly different between the three groups, no significant difference was noted between HEC and LEC mice (p > 0.05). Similarly, AST, TP, creatinine, CK, UA, TC, TG, and Glu levels did not differ significantly among the three groups (p > 0.05).
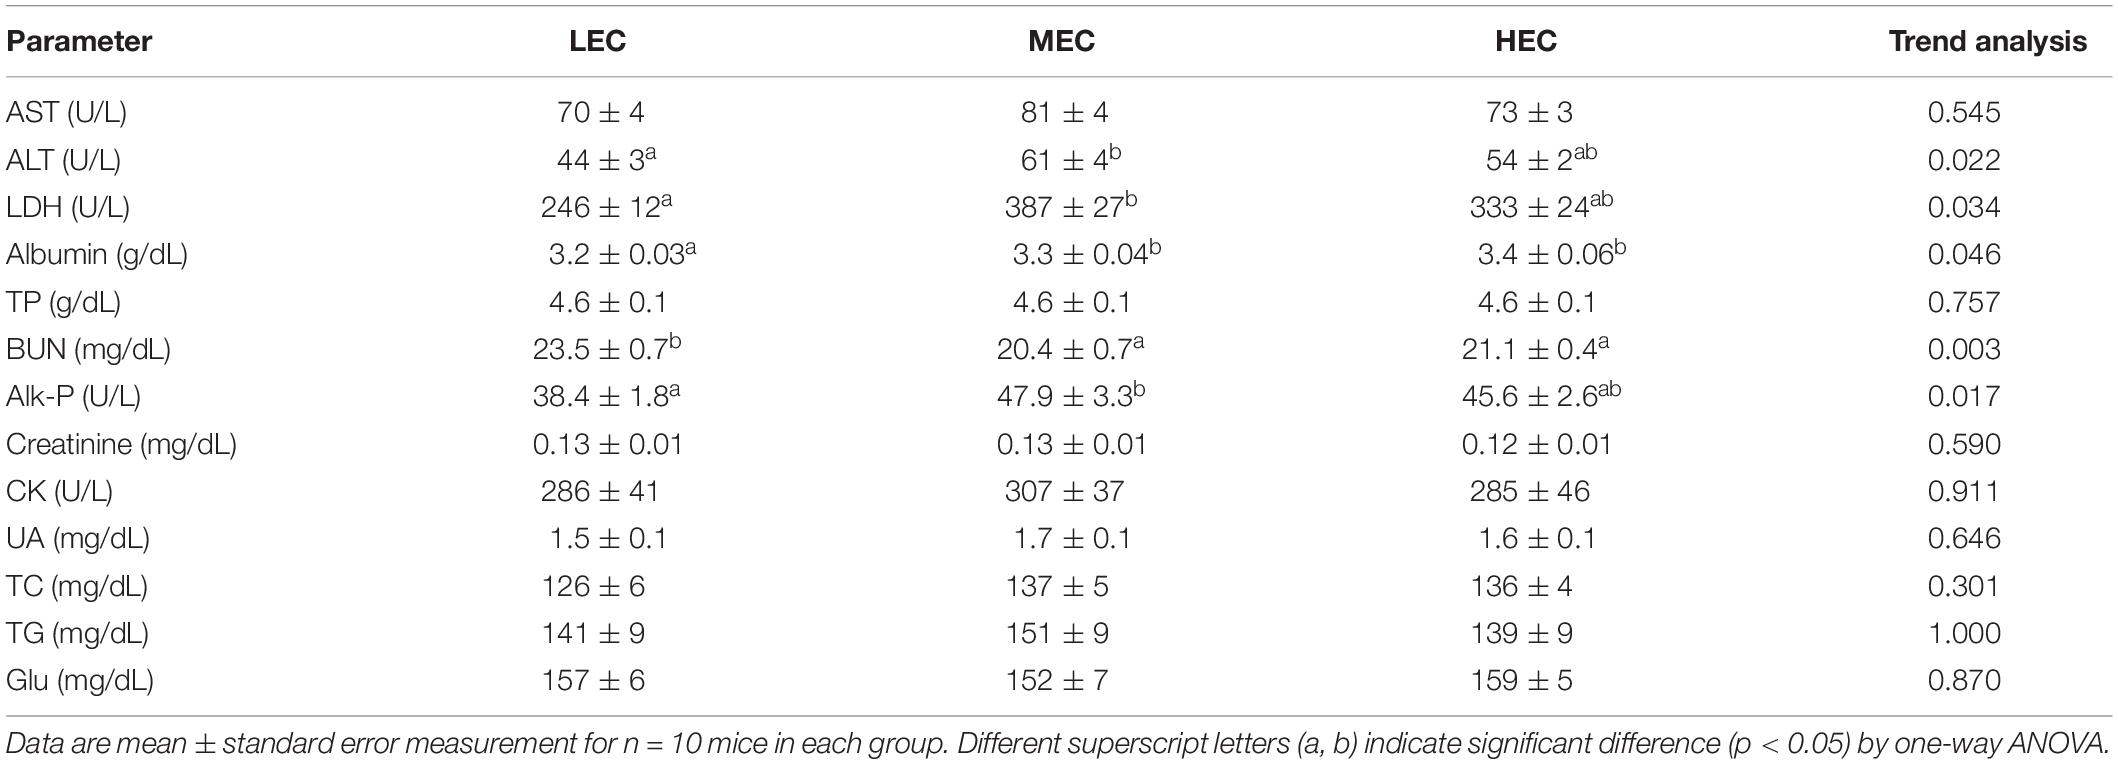
Table 2. Effect of different exercise capacity on biochemical analysis at the end of treatment.
OGTT
After the administration of glucose (2.5 g/kg) through oral gavage, blood was individually collected for glucose measurement at 0, 15, 30, 60, and 120 min (Figure 5). At the beginning (0 min), glucose levels did not differ significantly among the three groups (p > 0.05). However, at 15 and 30 min, glucose levels were significantly higher in LEC mice than in MEC and HEC mice (p = 0.024 and p < 0.001, respectively). At 60 min, LEC and MEC mice did not exhibit significantly different glucose levels; however, HEC mice had significantly lower glucose levels than did LEC and MEC mice (p = 0.004 and p = 0.012, respectively). Finally, at 120 min, LEC mice exhibited 2.01-fold higher glucose levels than HEC mice (p < 0.001).
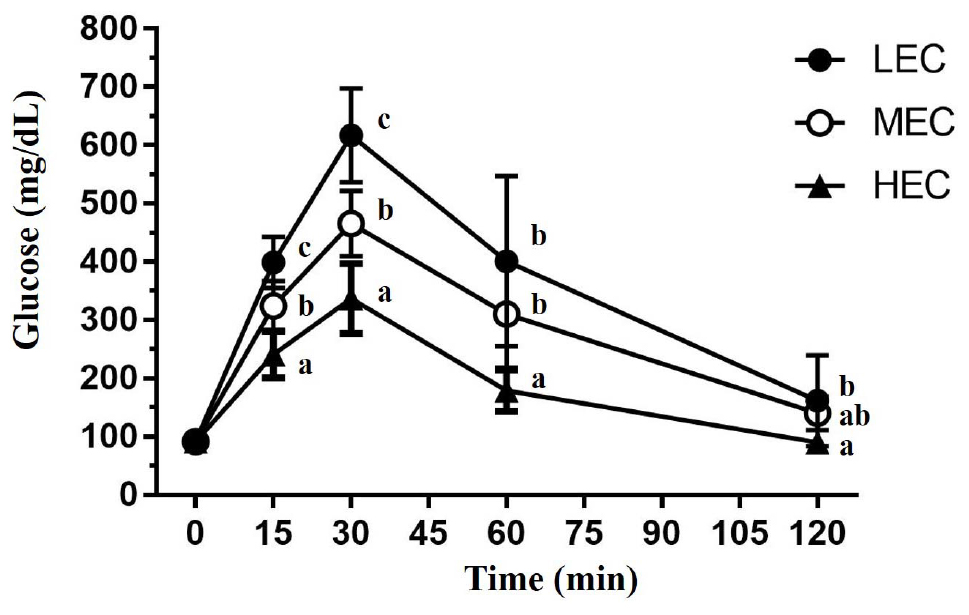
Figure 5. The oral glucose tolerance test was performed in mice with various exercise capacities at the same glucose dosage (2 g/kg) after 14 h of fasting. The indicated sampling times (0, 15, 30, 60, and 120 min) were plotted as the tolerance curve. Data are presented as mean ± standard deviation for 15 mice in each group. Different letters (a,b,c) indicate a significant difference at p < 0.05 using one-way ANOVA.
Gut Microbiota
A partial least squares discriminant analysis showed that mice clustered into relatively distinct groups based on LEC, MEC, and HEC mice (Figure 6A). Alpha-diversity indexes of richness (Observed and Chao1) were slightly increased in HEC mice compared with LEC mice (Figure 6B). The gut microbiota of HEC and LEC mice altered considerably. Nine phyla were detected: Actinobacteria, Bacteroidetes, Crenarchaeota, Cyanobacteria/Chloroplast, Deferribacteres, Firmicutes, Proteobacteria, Tenericutes, and TM7; the ratios of these phyla did not differ significantly between HEC and LEC mice. Furthermore, 13 classes were noted: Actinobacteria, Alphaproteobacteria, Bacilli, Bacteroidia, Betaproteobacteria, Chloroplast, Clostridia, Deferribacteres, Deltaproteobacteria, Erysipelotrichia, Gammaproteobacteria, Moliciches, and Thermoprotei. The proportion of Betaproteobacteria was significantly lower in HEC mice than in LEC mice (p = 0.04). Next, 14 orders were identified: Anaeroplasmatales, Bacillales, Bacteroidales, Burkholderiales, Clostridiales, Coriobacteriale, Deferribacterales, Desulfovibrionales, Enterobacteriales, Erysipelotrichales, Lactobacillales, Rhizobiale, Rhodospirillales, and Sphingomonadales. Compared with LEC mice, HEC mice exhibited a significantly lower number of Burkholderiales and Rhizobiales (p = 0.034 and 0.017, respectively) and a significantly higher number of Deferribacterales (p = 0.025). Of the 21 identified families, the number of Anaeroplasmataceae and Sutterellaceae was significantly lower in HEC mice than in LEC mice (p = 0.025 and 0.035). Of the 49 identified genera, the number of Anaeroplasma, Anaerovorax, Erysipelotrichia, Gemmiger, and Parasutterella was significantly lower in HEC mice than in LEC mice (p = 0.030, 0.015, 0.007, 0.018, and 0.04, respectively); however, the number of Butyricicoccus was significantly higher in HEC mice than in LEC mice (p = 0.038; Figure 6C).
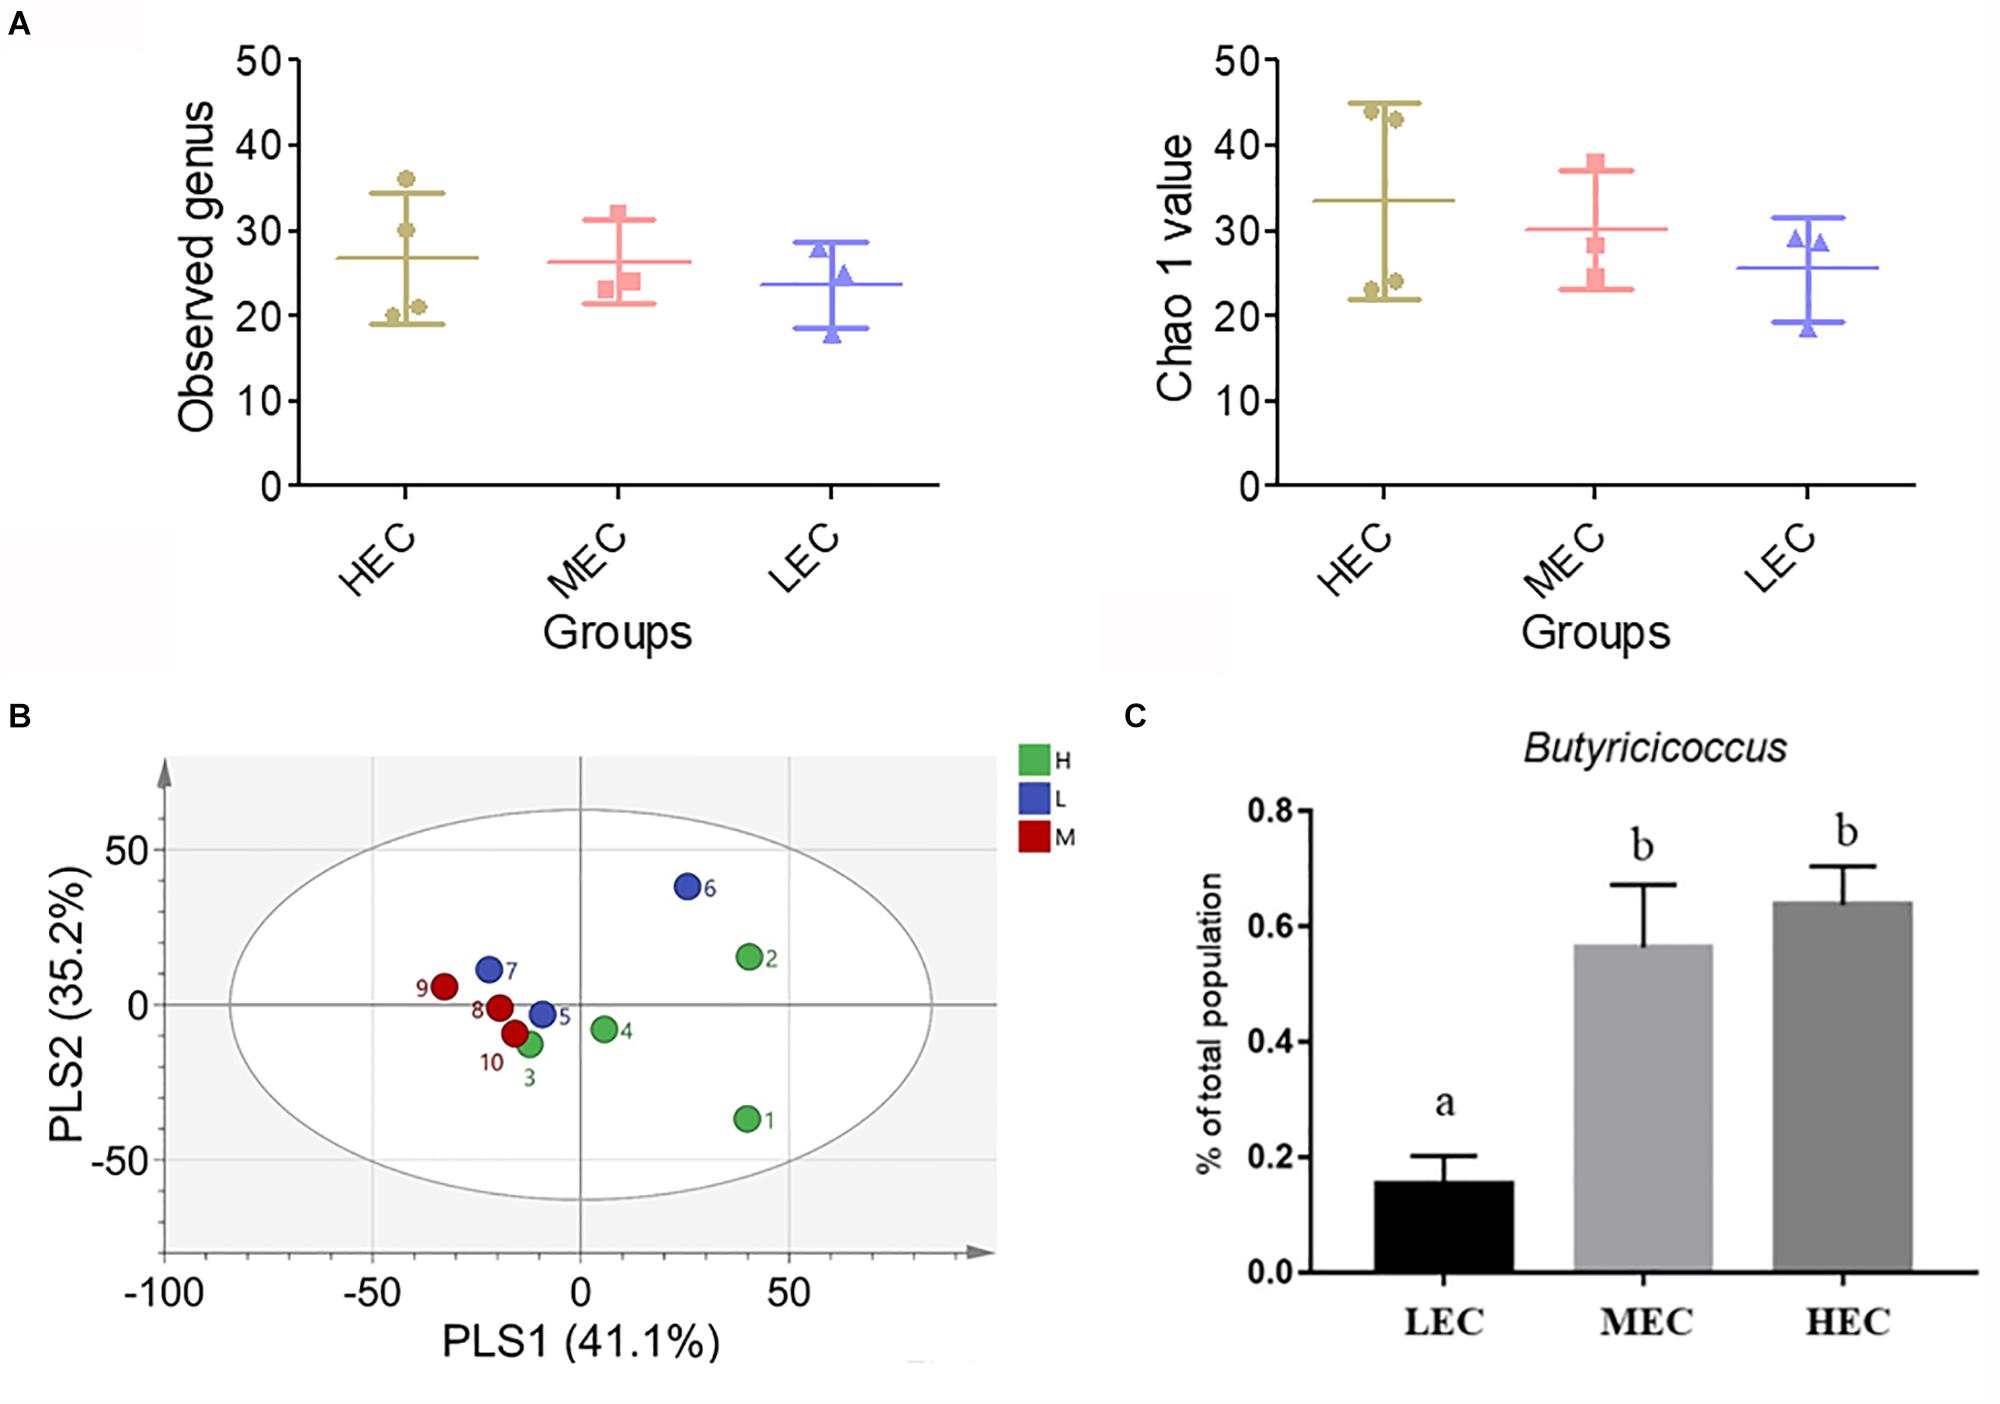
Figure 6. Effect of exercise capacity on (A) partial least squares discriminant analysis (PLSDA) of genus level, (B) alpha-diversity indexes of the gut microbiota composition, and (C) Butyricicoccus. Different letters (a,b) indicate a significant difference at p < 0.05 using one-way ANOVA.
Soleus Muscle miRNA Profiles
The 47 miRNA expression profiles of the soleus muscles, revealed using TLDA, varied among the three groups (Supplementary Figure 1). Compared with LEC mice, HEC mice exhibited significant changes (27.13–39.44-fold) in several miRNAs (Table 3). Seven miRNAs, namely miR-383, miR-107, miR-30b, miR-669m, miR-191, miR-218, and miR-224, were significantly upregulated in HEC mice (Table 4). Thus, a set of candidate miRNAs regulated in soleus muscles could be used as potential diagnostic biomarkers of intrinsic exercise capacities.
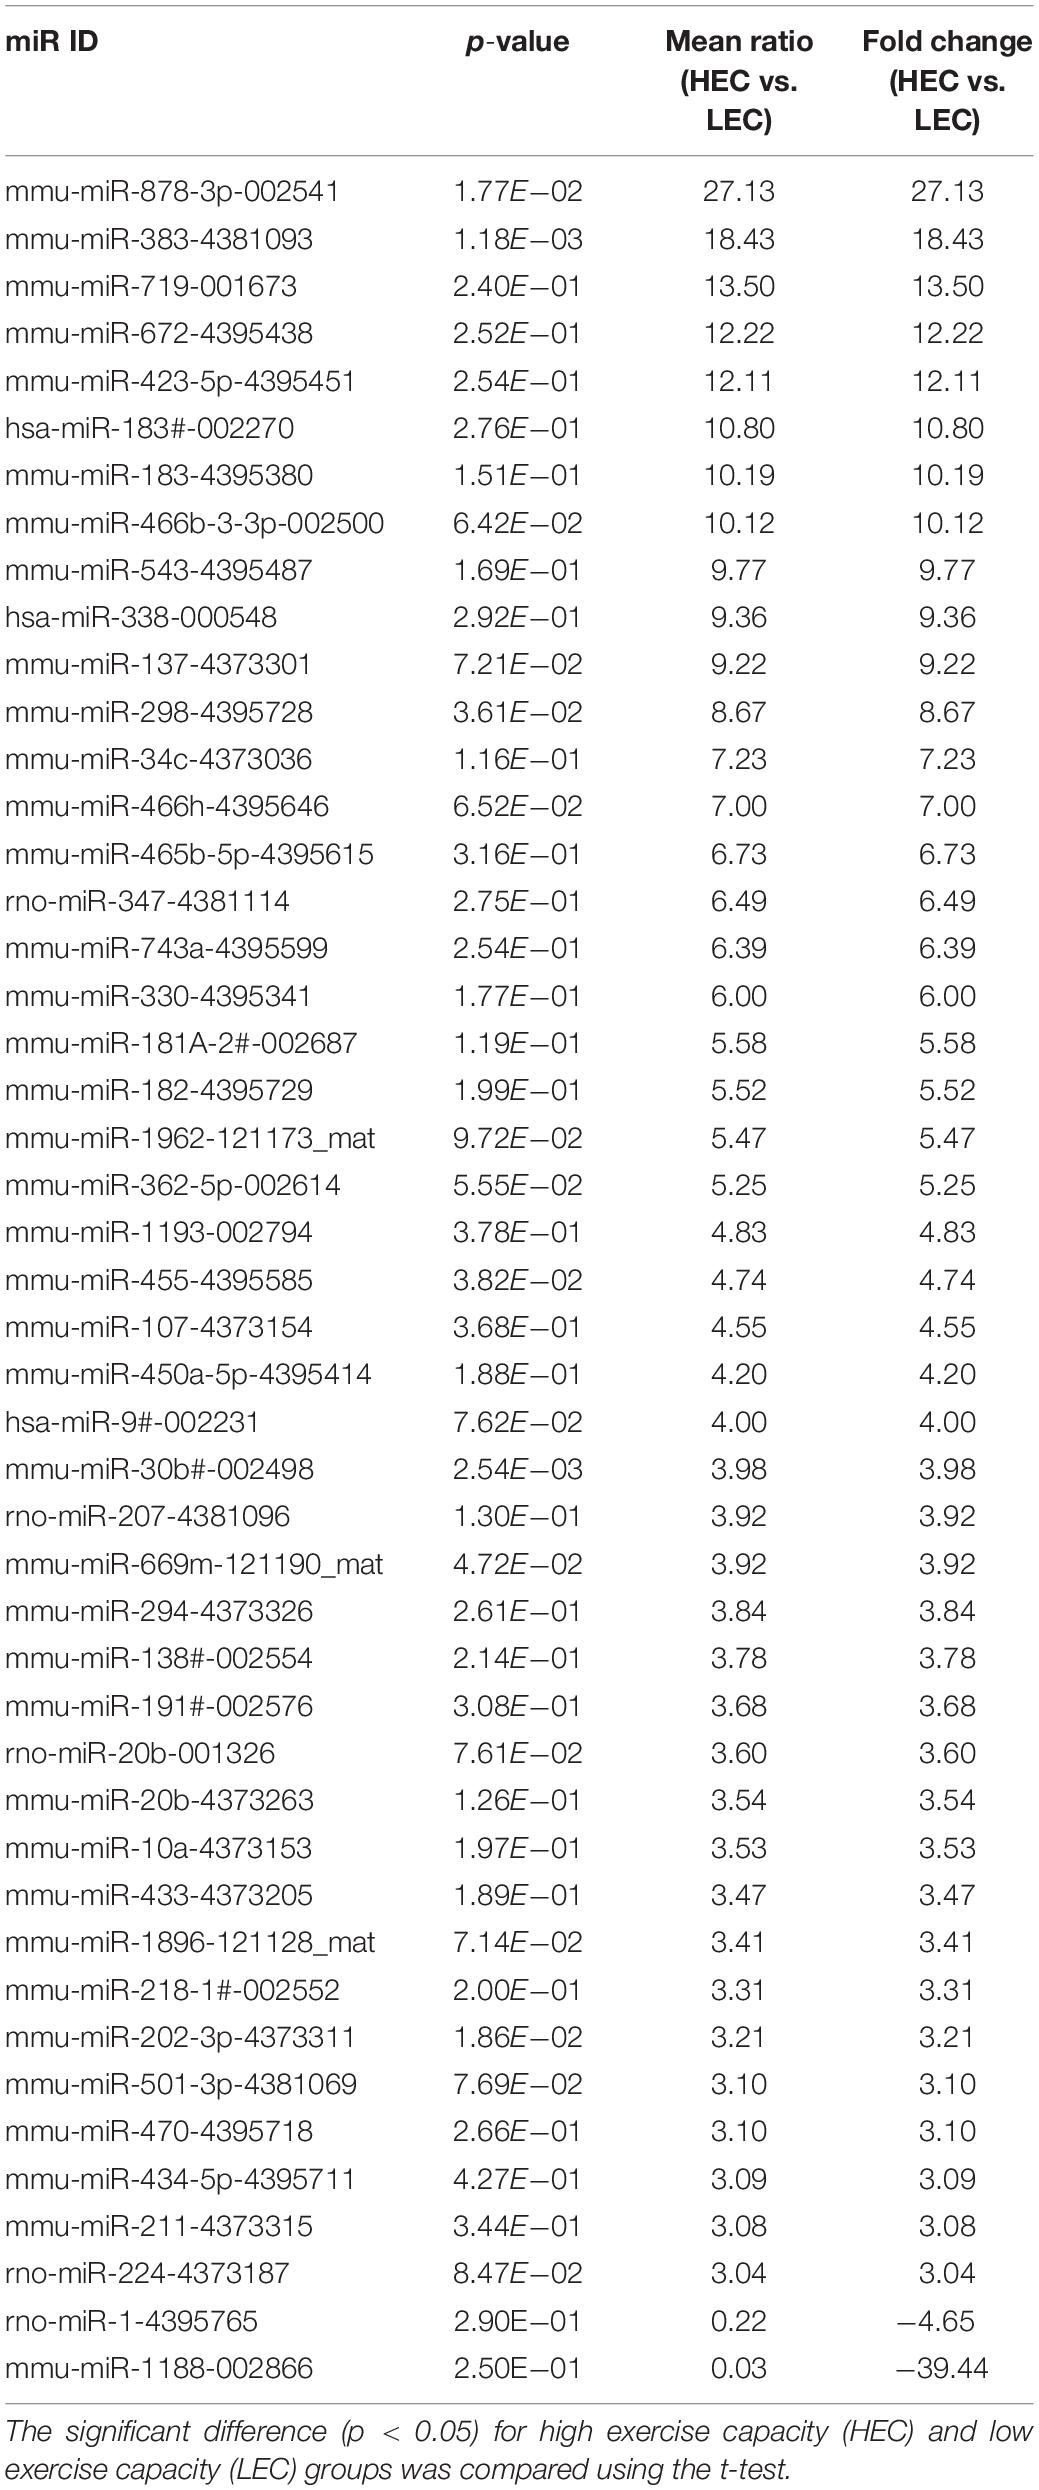
Table 3. Effect of different exercise capacities on miRNA expression.
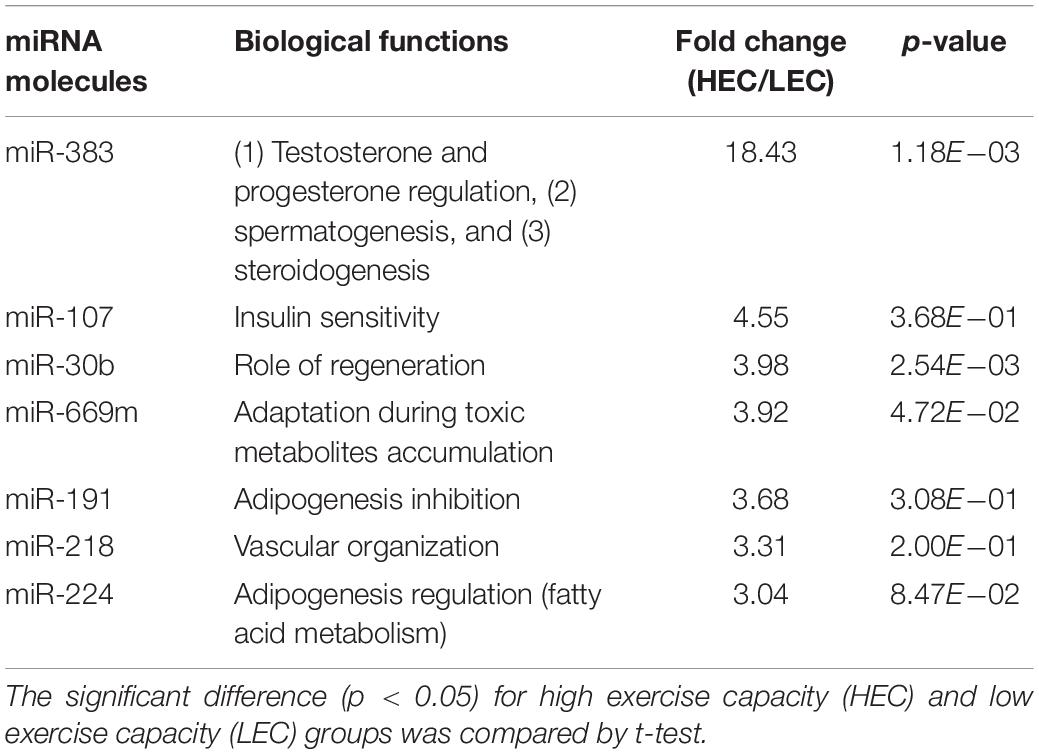
Table 4. Soleus miRNA molecules with significant difference related to intrinsic exercise capacity.
Soleus Muscle Proteomics Analysis
The soleus muscle protein profiles of LEC and HEC mice were analyzed using LC-MS/MS; next, various soleus muscle proteins were compared between these mice (Table 5). We detected 97 soleus proteins in LEC and HEC mice; of these, 8 were common and 89 were significantly regulated proteins in LEC and HEC mice. Among them, the levels of 79 and 10 proteins were significantly increased and decreased, respectively, in HEC mice compared with LEC mice. These major pathways between LEC and HEC mice were generated using ingenuity pathway analysis (IPA), where p < 0.05. In Supplementary Figure 2, the length of the bar only indicates that the differentially expressed proteins are related to this pathway but not that the pathway is either upregulated or downregulated. Soleus muscle proteins related to biofunctions and physiological metabolic pathways in HEC and LEC mice underwent significant changes related to (a) muscle contraction, (b) cardiovascular disease and organismal injury, (c) skeletal and muscle function, (d) carbohydrate metabolism, (e) muscle cell morphology, and (f) organ morphology.
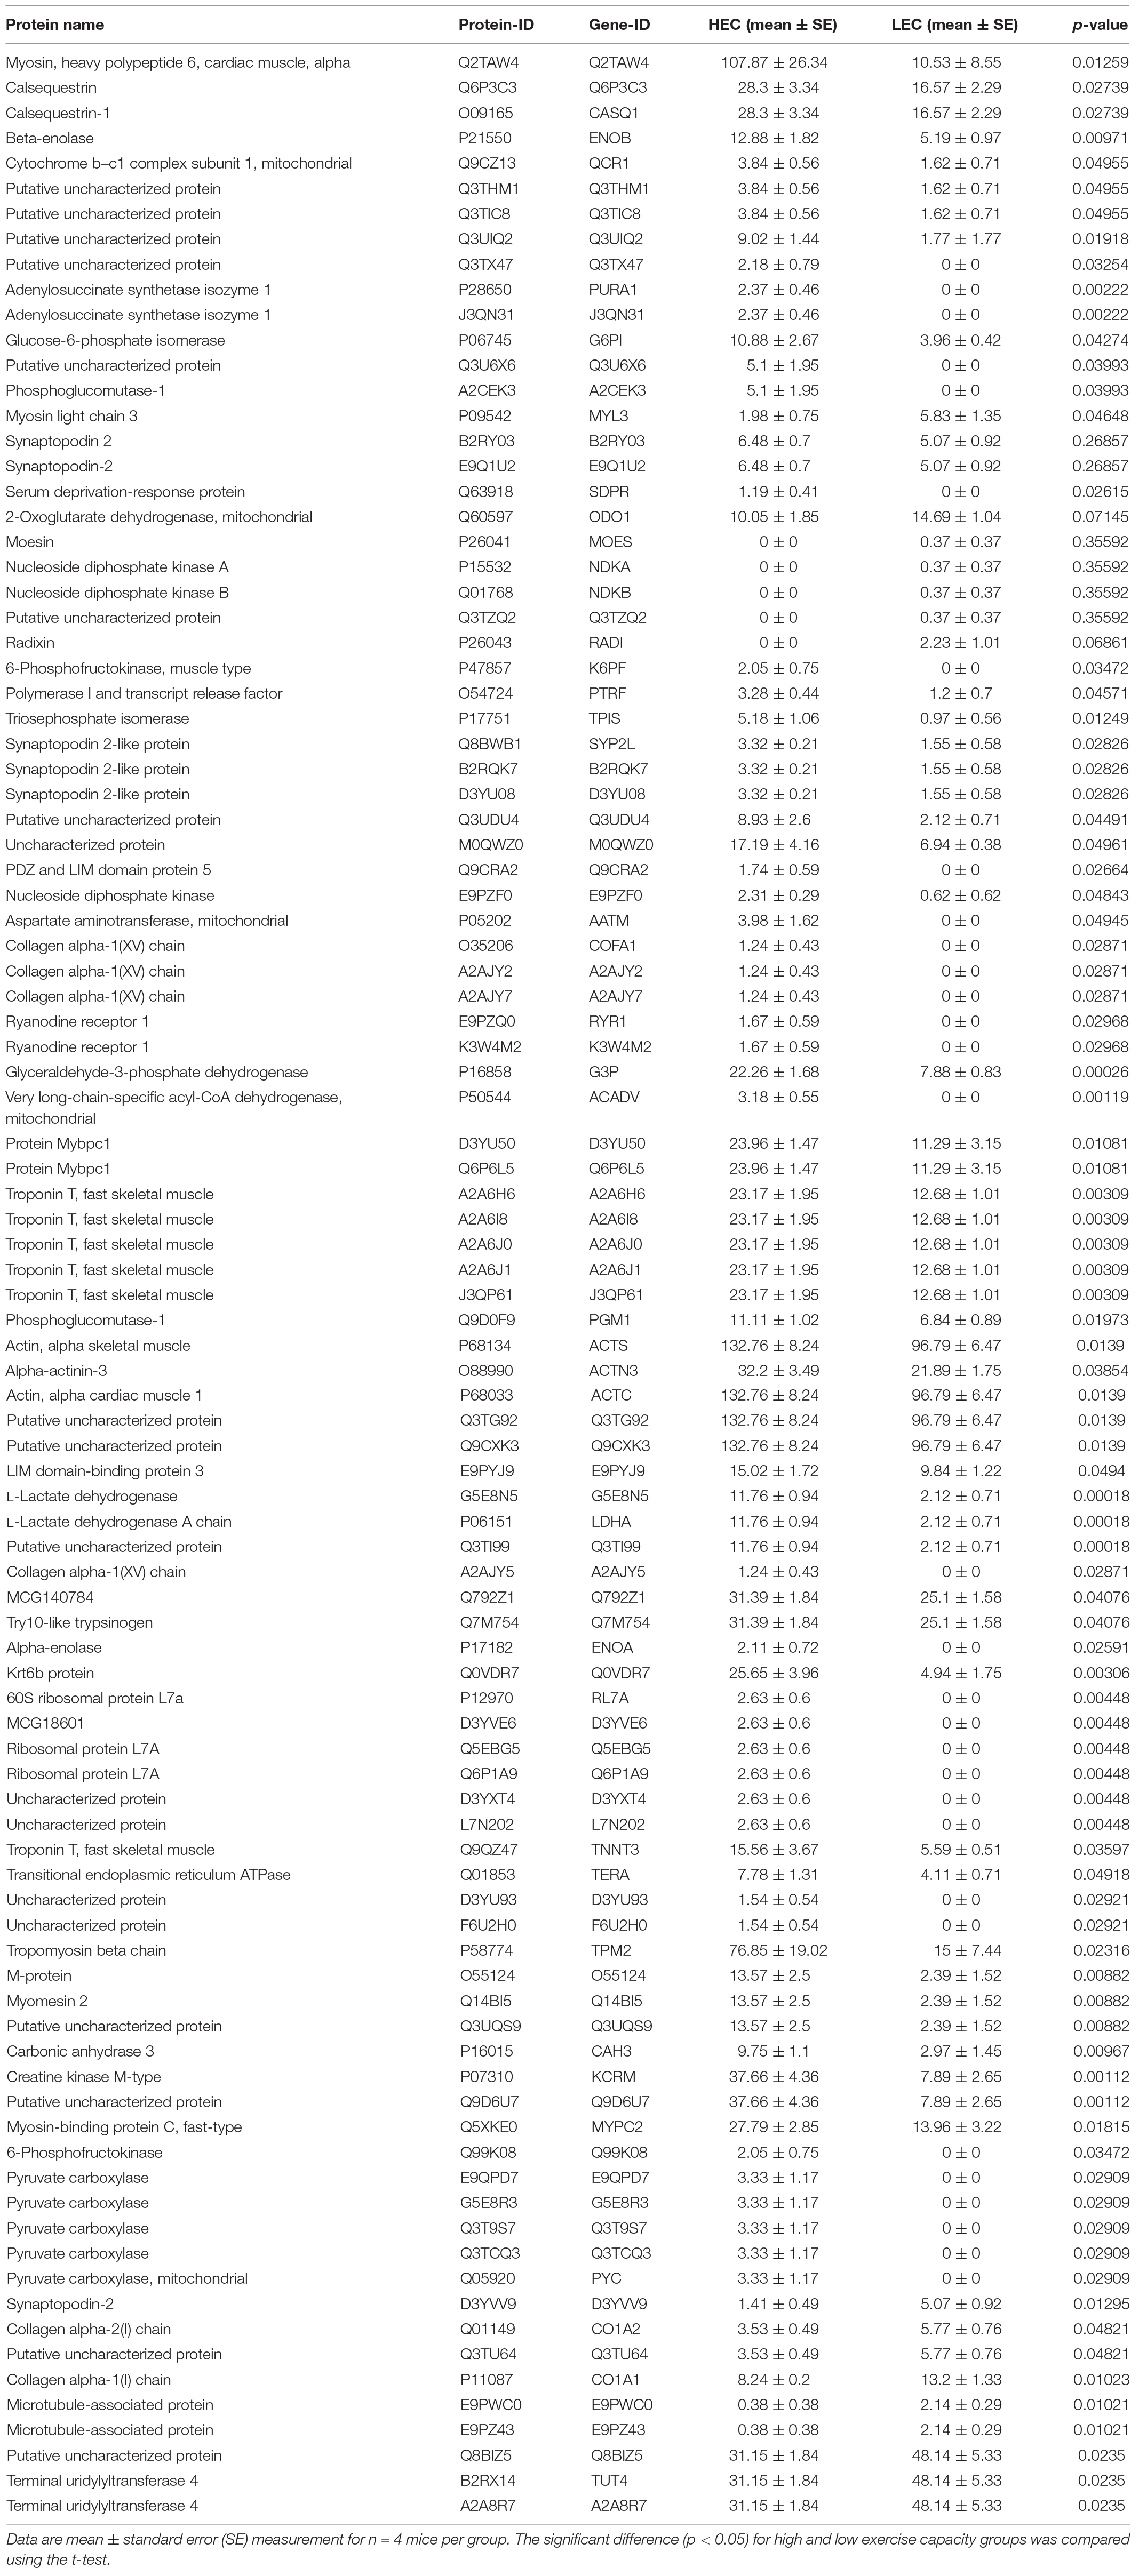
Table 5. Differential expression for protein molecules in soleus between low exercise capacity (LEC) and high exercise capacity (HEC) groups.
Discussion
For the 100 mice that performed an exhaustive swimming exercise test under 5% BW loading, their intrinsic endurance was ranked according to exhaustive swimming performance (Figure 1). The distribution pattern of exhaustive swimming exercise was similar to that reported by Koch et al. (1998). Koch and Britton (2001) demonstrated that of 96 male mice, the 13 lowest and the 13 highest performers became exhausted after an average of 13.0 ± 0.45 and 31.1 ± 0.81 min of running, respectively; thus, the exercise capacity of HEC mice was 2.4-fold higher than that of LEC mice. By contrast, in this study, of the 100 male mice, the 15 lowest and the 15 highest performers became exhausted after an average of 4.35 ± 0.23 and 172.40 ± 23.79 min of swimming, respectively; thus, the exercise capacity of HEC mice was 39.6-fold higher than that of LEC mice (Figure 2A). As illustrated in Figure 2B, the results of the grip strength test were similar to those of the exhaustive swimming exercise test. The grip strength of HEC mice (139.2 ± 5.1 g) was higher than that of the LEC (124.9 ± 3.2 g) and MEC (129.5 ± 3.2 g) mice (p < 0.05), indicating that the physical performance of HEC mice was significantly higher than that of MEC and LEC mice. Koch and Britton (2001) also detailed that selection for running capacity produced changes in BW and that the BW did not differ between HEC and LEC mice in the first generation; however, after breeding, the LEC- and HEC-line males exhibited significant differences in the fourth and fifth generations, respectively. In this study, BW and the growth curve did not differ significantly among LEC, MEC, and HEC mice (Table 1), possibly because these mice were not artificially selected for intrinsic aerobic endurance capacity. Swallow et al. (2010) demonstrated that HCR rats consumed and digested more food than LCR rats. Furthermore, HCR rats exhibited hypertrophy of the heart and kidneys and decreased length of the long intestine; thus, the oxygen utilization of these rats increased because of increased physical activity, resulting in increased food consumption and higher hypertrophy of key organs for O2 transport compared with LCR rats. Moreover, Novak et al. (2009) demonstrated that HCR rats exhibited increased physical activity, potentially leading to a degree of self-training and resulting in increased energy expenditure, reduced body fat, and other lean characteristics. By contrast, in the present study, no significant differences in the relative weights of organs (liver, kidney, heart, lung, EFP, or BAT) were evident between HEC and LEC mice, probably because our mice were not artificially selected generations. However, the muscle weight of HEC mice was significantly higher than that of LEC mice, consistent with the results of the physical activity tests (exhaustive swimming exercise and grip strength test); this may explain why HEC mice exhibited more neuromuscular coordination and muscular power improvement than LEC mice.
Exercise fatigue mechanisms can be generally divided into peripheral and central fatigue. Some common blood-based biological indicators can assess the physiological state of peripheral fatigue, including exercise fatigue indicators such as lactate, ammonia, BUN, and glucose and exercise-induced injury indicators (such as AST, ALT, CK, and LDH) (Huang et al., 2015). Although altering the peripheral system at the skeletal muscle level may facilitate the maintenance of endurance capacity, altering neural circuits regulating fatigue may be effective. Foley et al. (2006) demonstrated that increased brain 5-hydroxytryptamine (5-HT) release accelerates exercise fatigue, whereas increased brain dopamine (DA) release can delay it. These results suggest that individual differences in endurance capacity may be attributed to factors influencing the activities of 5-HT and DA systems. HCR rats exhibited higher 5-HT1B autoreceptor mRNA levels in the raphe nucleus and higher DR-D2 autoreceptor mRNA levels in the midbrain and striatum than LCR rats, indicating that central serotonergic and dopaminergic systems may be involved in the delay of exercise fatigue in HCR rats (Foley et al., 2006). In the present study, the levels of the fatigue indicators lactate, ammonia, CK, and AST were significantly lower in HEC mice than in LEC mice, possibly because of the positive effect of exercise on relevant metabolic mechanisms and circulatory systems; thus, the exercise performance of HEC mice was significantly higher than that of LEC mice. Ritchie et al. (2013) demonstrated that low intrinsic aerobic capacity is associated with increased risk factors for cardiovascular disease because of impaired glucose tolerance and elevated plasma insulin. In the present study, glucose levels in LEC mice were higher than those in MEC and HEC mice. Stephenson et al. (2012) demonstrated that the fasting serum insulin concentration in LCR rats was 62% higher than that in HCR rats; therefore, HCR rats had higher glucose tolerance. Ritchie et al. (2013) also determined that LCR rats had impaired glucose tolerance and upregulated gene expression of the glucose transporter GLUT4 compared with HCR rats. Previous studies used the HCR/LCR rat model, which is selected over many generations. However, in the current study, the mice were characterized by their aerobic exercise ability (without artificial population selection as F0 generation). Additionally, intrinsic LEC is associated with an increase in insulin-related metabolic syndrome, regardless of the intrinsic exercise capacity selected at many generations or at an early point in time (Stephenson et al., 2012; Ritchie et al., 2013).
The gut microbiota is associated with diseases such as obesity, aging, diabetes, allergies, cardiovascular disease, and cancer. Burcelin et al. (2011) discovered that the gut microbiota is involved in host metabolism, including adipose tissue functioning, liver fat storage, skeletal muscle energy metabolism, hepatic lipid metabolism, hepatic steatosis, atherosclerosis and cardiovascular diseases, tissue lipid composition in the retina and lens, periodontitis, behavior and motor activity, and enteroendocrine metabolism. Appukutty et al. (2015) demonstrated that the intervention combining Lactobacillus plantarum LAB12 intake and moderate exercise enhances functions and inhibits TNF-α production. Evans et al. (2014) reported that dietary intake and exercise intervention can alter the gut microbiota and produce physiological changes, such as weight control and high glucose tolerance. Hsu et al. (2015) determined that mice free of a specific pathogen exhibit improved exercise compared with completely pathogen-free mice, indicating that the composition of the gut microbiota is essential for exercise performance. In this study, we assessed whether the levels of intrinsic exercise capacity affect gut microbiota. In terms of genera, the numbers of Anaeroplasma, Anaerovorax, Erysipelotrichaceae, Gemmiger, and Parasutterella were significantly lower in HEC mice than in LEC mice, whereas the numbers of Butyricicoccus were significantly higher in LEC mice. Furthermore, Butyricicoccus pullicaecorum adapts to the gastrointestinal environment, is potentially probiotic (Geirnaert et al., 2014), and can improve inflammatory bowel disease (Steppe et al., 2014). Overall, our results indicate that HEC mice have a greater abundance and diversity of gut microbiota than LEC mice, which suggests that gut microbiota may be highly correlated with exercise capacity. In addition, the ratio of Firmicutes/Bacteroidetes was significantly higher in HEC mice than in LEC mice (Supplementary Figure 3). Exercise in normal rats was associated with higher numbers of Bacteroidetes and lower Firmicutes in fecal matter (Queipo-Ortuño et al., 2013; Evans et al., 2014). By contrast, the opposite was observed in exercised mice exposed to polychlorinated biphenyls (Choi et al., 2013) and also to type 2 diabetic (db/db) and control (db/+) mice (Lambert et al., 2015), similar to our own observations in HEC and LEC mice.
miRNAs are a class of highly abundant non-coding RNA molecules that can cause posttranscriptional gene repression; these are involved in various biological processes (Chaveles et al., 2012). In the present study, miR-383, miR-107, miR-30b, miR-669m, miR-191, miR-218, and miR-224 were significantly upregulated in HEC mice (Table 4). miR-383 regulates RBMS1 and inhibits downstream c-MYC expression, and along with miR-320, it controls E2F1 and SF1 genes to affect a steroid hormone. Therefore, miR-383 has therapeutic potential for hormone-related disorders (Yin et al., 2014). Van Caenegem et al. (2015) determined that an increase in testosterone levels can significantly increase muscle, power, and bone growth. miR-107 modulates the expression of the caveolin-1 gene, which encodes an upstream regulatory protein of the insulin receptor, thus improving insulin sensitivity. In this study, the glucose levels in LEC mice were higher than those in MEC and HEC mice; this may be related to the significant upregulation of miR-107 expression in HEC mice. In addition, miR-191 and miR-224 negatively regulate lipogenesis and inhibit lipid synthesis by modulating acyl-CoA synthetase activity (Ji et al., 2014). The proportion of muscle fat to visceral fat in HEC rats was lower than that in LEC rats (Spargo et al., 2007). In the present study, the EFP and BAT did not differ significantly among LEC, MEC, and HEC mice. However, future studies should investigate the influence of miR-191 and miR-224 on lipid regulation in artificially selected generations. Druz et al. (2012) determined that the oxidative stress induced by glucose deprivation caused reactive oxygen species accumulation and reduced glutathione depletion, which together inhibited histone deacetylase (HDAC) activity, reduced protein levels of HDAC2, and increased acetylation in miR-466 and miR-669 promoter regions, causing the activation of miR-466 and miR-669 to regulate physiological functions. The oxidative stress induced by glucose deprivation is similar to the exercise-induced oxidative stress observed in this study. This may explain why the levels of exercise-fatigue-related indicators, such as lactate and ammonia, were higher in LEC mice than in HEC mice. Chaveles et al. (2012) determined that the expression levels of miR-218 and miR-30 in liver tissue were higher after liver regeneration induced by two-thirds partial hepatectomy, suggesting that miR-218 and miR-30 may be crucial for liver regeneration. In this study, the mechanism of recovery from exercise-induced muscle damage was similar to that of liver regeneration. Therefore, the levels of injury-related biomarkers, such as CK, significantly decreased in HEC mice compared with those in LEC mice. These results indicate that these miRNAs related to intrinsic HEC play a major role in the adaptation and regulation of physiological functions.
The soleus muscle proteins exhibiting changes in regulation because of intrinsic exercise capacity were related to six major pathways between HEC and LEC mice, as determined by IPA, with a threshold p of <0.05. The six major biofunctions in the intrinsic exercise capacity-regulated soleus muscle proteins were muscle contraction, cardiovascular disease and injury, skeletal and muscle function, carbohydrate metabolism, muscle cell morphology, and organ morphology. The upregulated proteins associated with muscle contraction in HEC mice were ACTA1, ACTC1, Actin3, MYBPC1, MYBPC2, RYR1, and TNNT3. The muscle contraction was stronger in HEC mice than in LEC mice. Therefore, muscle weight, exhaustive swimming exercise performance, and grip strength were significantly higher in HEC mice than in LEC mice. Furthermore, low aerobic capacity may be associated with high risks of various diseases (Wisløff et al., 2005). Addressing associations and mechanisms concerning the progression of disease development using the respective indexes would be worthwhile. In addition, the results of different protein analysis on the functional network showed that the intrinsic exercise capacity is highly related to organ morphology and skeletomuscular development and function (Supplementary Figure 4). Thus, muscle function and carbohydrate metabolism may play an essential role in enhancing exercise performance.
In previous study with early obesity and non-alcoholic fatty liver disease (NAFLD) rat model, the exercise intervention could not only ameliorate HFD-induced body metabolic syndrome and hepatic steatosis, as a result of its lipid metabolism modulatory capacity and the exercise training also increased Parabacteroides, Bacteroides, and Flavobacterium genera, correlating with a beneficial metabolomic profile (Carbajo-Pescador et al., 2019). In our study, we also observed the Bacteroides genus is significantly higher proportions in HEC group than LEC group (Supplementary Figure 3) but the body composition and metabolic syndrome were not significant difference possible due to several reasons including, F0 generation, diet, and exercise intervention. There was another study to compare the diet and exercise on metabolic function and gut microbiota in obesity rat. The exercise intervention for obesity rat could reduce the inflammatory markers in all adipose tissue, and improve the BAT mitochondrial function, insulin resistance, and the relative abundance of Streptococcaceae (Welly et al., 2016). The GOTT test also showed that the HEC group exhibited the better glucose tolerance effects (Figure 5), which was also consistent with upregulation of miR-107 expression in HEC mice for insulin sensitivity (Table 4). In addition, the HEC also showed the higher expression levels in carbohydrate metabolism proteins (Supplementary Figure 3) related to aerobic metabolism. However, the diet and exercise training didn’t intervene HEC and LEC groups in current study, and the effects of gut microbiota and functional proteins with intrinsic exercise capacity need to be validated by further experimental designs by diet and training conditions.
One limitation of the study was sex of the mice used, as we used only male mice, and sex hormones can influence physiology and physiological adaptations. However, our experimental design focused on possible regulatory factors through a multiomics approach. Therefore, sex differences can be investigated in the future. In addition, ICR mice were subjected to an exhaustive swimming test and were ranked based on the exhaustive swimming time to distinguish intrinsically high- and low-capacity groups in the study. Previous studies have used the exhaustive swimming time method to assess the exercise capacity (Kan et al., 2018; Tung et al., 2019). However, mice are afraid of water, and the exhaustive swimming test causes them high mental stress. The blood biochemical parameters assessed in the present study (lactate, ammonia, BUN, glucose, LDH, CK, AST, and ALT) are not related to mental stress. Nevertheless, future studies should validate the changes in mental stress-related blood biochemical data, including hormones.
Conclusion
In this study, exhaustive swimming test was used to determine low and high capacities in mice. In contrast with LEC mice, glucose tolerance and the number of Butyricicoccus were significantly higher in HEC mice, and levels of exercise-induced peripheral fatigue and injury-related biomarkers, including lactic acid, ammonia, CK, and AST, were significantly lower in HEC mice. In addition, differences between the exercise performance of HEC and LEC mice may be attributed to the expression of miR-383, miR-107, miR-30b, miR-669m, miR-191, miR-218, and miR-224, which are strongly associated with physiological and metabolic functions. Moreover, the functional protein profile indicated the effect of key protein levels related to intrinsic exercise capacity on muscle function and carbohydrate metabolism; these proteins may play a major role in the adaptive mechanism of exercise physiology. The mechanisms underlying the influence of these critical factors on disease development warrants further study.
Data Availability
All datasets for this study are included in the manuscript and/or the Supplementary Files.
Ethics Statement
This study was conducted in accordance with the principles of the Basel Declaration and the recommendations of the Institutional Animal Care and Use Committee (IACUC) of the NTSU. The protocol (IACUC-10103) was approved by the IACUC of the NTSU.
Author Contributions
W-CH and C-CH designed the experiments. W-CH, Y-TT, Y-JH, and C-CL conducted the laboratory experiments. C-CH contributed the reagents, materials, and analysis platforms. S-TH analyzed the metagenome result. W-CH, Y-TT, Y-JH, and C-CH analyzed and illustrated the data. Y-TT, W-CH, and C-CH interpreted the results, prepared the figures, and wrote and revised the manuscript.
Funding
The corresponding author acknowledges the Ministry of Science and Technology, Taiwan (grant no. MOST108-2410-H-227-007) for providing financial support for this study.
Conflict of Interest Statement
The authors declare that the research was conducted in the absence of any commercial or financial relationships that could be construed as a potential conflict of interest.
Acknowledgments
We appreciate the efforts of the reviewers and their useful comments and suggestions for improving the manuscript. We also thank Wallace Academic Editing for their careful editing of the manuscript.
Supplementary Material
The Supplementary Material for this article can be found online at: https://www.frontiersin.org/articles/10.3389/fphys.2019.01201/full#supplementary-material
References
Appukutty, M., Ramasamy, K., Rajan, S., Vellasamy, S., Ramasamy, R., and Radhakrishnan, A. K. (2015). Effect of orally administered soy milk fermented with Lactobacillus plantarum LAB12 and physical exercise on murine immune responses. Benef. Microbes 17, 1–6. doi: 10.3920/BM2014.0129
Blair, S. N., Kohl, H. W. III., Barlow, C. E., Paffenbarger, R. S. Jr., Gibbons, L. W., and Macera, C. A. (1995). Changes in physical fitness and all-cause mortality: a prospective study of healthy and unhealthy men. JAMA 273, 1093–1098. doi: 10.1001/jama.273.14.1093
Blair, S. N., Kohl, H. W. III., Paffenbarger, R. S. Jr., Clark, D. G., Cooper, K. H., and Gibbons, L. W. (1989). Physical fitness and all-cause mortality: a prospective study of healthy men and women. JAMA 262, 2395–2401. doi: 10.1001/jama.262.17.2395
Bouchard, C., An, P., Rice, T., Skinner, J. S., Wilmore, J. H., Gagnon, J., et al. (1999). Familial aggregation of VO2max response to exercise training: results from the HERITAGE Family study. J. Appl. Physiol. 87, 1003–1008. doi: 10.1152/jappl.1999.87.3.1003
Bouchard, C., Rankinen, T., Chagnon, Y. C., Rice, T., Pérusse, L., Gagnon, J., et al. (2000). Genomic scan for maximal oxygen uptake and its response to training in the HERITAGE family study. J. Appl. Physiol. 88, 551–559. doi: 10.1152/jappl.2000.88.2.551
Braith, R. W., Pollock, M. L., Lowenthal, D. T., Graves, J. E., and Limacher, M. C. (1994). Moderate- and high-intensity exercise lowers blood pressure in normotensive subjects 60 to 79 years of age. Am. J. Cardiol. 73, 1124–1128. doi: 10.1016/0002-9149(94)90294-1
Burcelin, R., Serino, M., Chabo, C., Blasco-Baque, V., and Amar, J. (2011). Gut microbiota and diabetes: from pathogenesis to therapeutic perspective. Acta. Diabetol. 48, 257–273. doi: 10.1007/s00592-011-0333-6
Carbajo-Pescador, S., Porras, D., García-Mediavilla, M. V., Martínez-Flórez, S., Juarez-Fernández, M., Cuevas, M. J., et al. (2019). Beneficial effects of exercise on gut microbiota functionality and barrier integrity, and gut-liver crosstalk in an in vivo model of early obesity and non-alcoholic fatty liver disease. Dis. Model Mech. 12:dmm039206. doi: 10.1242/dmm.039206
Chaveles, I., Zaravinos, A., Habeos, I. G., Karavias, D. D., Maroulis, I., Spandidos, D. A., et al. (2012). MicroRNA profiling in murine liver after partial hepatectomy. Int. J. Mol. Med. 29, 747–755. doi: 10.3892/ijmm.2012.902
Choi, J. J., Eum, S. Y., Rampersaud, E., Daunert, S., Abreu, M. T., and Toborek, M. (2013). Exercise attenuates PCB-induced changes in the mouse gut microbiome. Environ. Health Perspect. 121, 725–730. doi: 10.1289/ehp.1306534
Clarke, S. F., Murphy, E. F., O’Sullivan, O., Lucey, A. J., Humphreys, M., Hogan, A., et al. (2014). Exercise and associated dietary extremes impact on gut microbial diversity. Gut 63, 1913–1920. doi: 10.1136/gutjnl-2013-306541
Cox-York, K. A., Sheflin, A. M., Foster, M. T., Gentile, C. L., Kahl, A., Koch, L. G., et al. (2015). Ovariectomy results in differential shifts in gut microbiota in low versus high aerobic capacity rats. Physiol. Rep. 3:e12488. doi: 10.14814/phy2.12488
Davies, K. J., Packer, L., and Brooks, G. A. (1981). Biochemical adaptation of mitochondria, muscle, and whole-animal respiration to endurance training. Arch. Biochem. Biophys. 209, 539–554. doi: 10.1016/0003-9861(81)90312-x
Druz, A., Betenbaugh, M., and Shiloach, J. (2012). Glucose depletion activates mmu-miR-466h-5p expression through oxidative stress and inhibition of histone deacetylation. Nucleic Acids Res. 40, 7291–7302. doi: 10.1093/nar/gks452
Evans, C. C., LePard, K. J., Kwak, J. W., Stancukas, M. C., Laskowski, S., Dougherty, J., et al. (2014). Exercise prevents weight gain and alters the gut microbiota in a mouse model of high fat diet-induced obesity. PLoS One 9:e92193. doi: 10.1371/journal.pone.0092193
Falconer, D. S., and Mackay, T. F. C. (1996). Introduction to Quantitative Genetics. Essex: Addison Wesley Longman.
Foley, T. E., Greenwood, B. N., Day, H. E., Koch, L. G., Britton, S. L., and Fleshner, M. (2006). Elevated central monoamine receptor mRNA in rats bred for high endurance capacity: implications for central fatigue. Behav. Brain Res. 174, 132–142. doi: 10.1016/j.bbr.2006.07.018
Geirnaert, A., Steyaert, A., Eeckhaut, V., Debruyne, B., Arends, J. B., Van Immerseel, F., et al. (2014). Butyricicoccus pullicaecorum, a butyrate producer with probiotic potential, is intrinsically tolerant to stomach and small intestine conditions. Anaerobe 30, 70–74. doi: 10.1016/j.anaerobe.2014.08.010
Hasin, Y., Seldin, M., and Lusis, A. (2017). Multi-omics approaches to disease. Genom. Biol. 18:83. doi: 10.1186/s13059-017-1215-1
Hooper, L. V., and Gordon, J. I. (2001). Commensal host–bacterial relationships in the gut. Science 292, 1115–1118. doi: 10.1126/science.1058709
Hsu, Y. J., Chiu, C. C., Li, Y. P., Huang, W. C., Huang, Y. T., Huang, C. C., et al. (2015). Effect of intestinal microbiota on exercise performance in mice. J. Strength Cond. Res. 29, 552–558. doi: 10.1519/JSC.0000000000000644
Huang, C. C., Hsu, M. C., Huang, W. C., Yang, H. R., and Hou, C. C. (2012). Triterpenoid-rich extract from Antrodia camphorata improves physical fatigue and exercise performance in mice. Evid. Based Complement. Alternat. Med. 2012:364741. doi: 10.1155/2012/364741
Huang, W. C., Chiu, W. C., Chuang, H. L., Tang, D. W., Lee, Z. M., Wei, L., et al. (2015). Effect of curcumin supplementation on physiological fatigue and physical performance in mice. Nutrients 7, 905–921. doi: 10.3390/nu7020905
Jennings, G. L., Deakin, G., Dewar, E., Laufer, E., and Nelson, L. (1989). Exercise, cardiovascular disease and blood pressure. Clin. Exp. Hypertens. 11, 1035–1052.
Ji, S., Li, W., Bao, L., Han, P., Yang, W., Ma, L., et al. (2014). PU.1 promotes miR-191 to inhibit adipogenesis in 3T3-L1 preadipocytes. Biochem. Biophys. Res. Commun. 45, 329–333. doi: 10.1016/j.bbrc.2014.07.130
Joyner, M. J., and Coyle, E. F. (2008). Endurance exercise performance: the physiology of champions. J. Physiol. 586, 35–44. doi: 10.1113/jphysiol.2007.143834
Kan, N. W., Lee, M. C., Tung, Y. T., Chiu, C. C., Huang, C. C., and Huang, W. C. (2018). The synergistic effects of resveratrol combined with resistant training on exercise performance and physiological adaption. Nutrients 10:E1360. doi: 10.3390/nu10101360
Koch, L. G., and Britton, S. L. (2001). Artificial selection for intrinsic aerobic endurance running capacity in rats. Physiol. Genomics 5, 45–52. doi: 10.1152/physiolgenomics.2001.5.1.45
Koch, L. G., and Britton, S. L. (2018). Theoretical and biological evaluation of the link between low exercise capacity and disease risk. Cold Spring Harb. Perspect. Med. 8:a029868. doi: 10.1101/cshperspect.a029868
Koch, L. G., Meredith, T. A., Fraker, T. D., Metting, P. J., and Britton, S. L. (1998). Heritability of treadmill running endurance in rats. Am. J. Physiol. 275, 1455–1460. doi: 10.1152/ajpregu.1998.275.5.R1455
Krushkal, J., Ferrell, R., Mockrin, S. C., Turner, S. T., Sing, C. F., and Boerwinkle, E. (1999). Genome-wide linkage analyses of systolic blood pressure using highly discordant siblings. Circulation 99, 1407–1410. doi: 10.1161/01.cir.99.11.1407
Lambert, J. E., Myslicki, J. P., Bomhof, M. R., Belke, D. D., Shearer, J., and Reimer, R. A. (2015). Exercise training modifies gut microbiota in normal and diabetic mice. Appl. Physiol. Nutr. Metab. 40, 749–752. doi: 10.1139/apnm-2014-0452
Liu, T. W., Park, Y. M., Holscher, H. D., Padilla, J., Scroggins, R. J., Welly, R., et al. (2015). Physical activity differentially affects the cecal microbiota of ovariectomized female rats selectively bred for high and low aerobic capacity. PLoS One 10:e0136150. doi: 10.1371/journal.pone.0136150
Mach, N., and Fuster-Botella, D. (2017). Endurance exercise and gut microbiota: a review. J. Sport Health Sci. 6, 179–197. doi: 10.1016/j.jshs.2016.05.001
McGinnis, J. M., and Foege, W. H. (1993). Actual causes of death in the United States. JAMA 270, 2207–2212.
Munoz, A., Riber, C., Trigo, P., Castejon-Riber, C., and Castejon, F. M. (2010). Dehydration, electrolyte imbalances and renin-angiotensin-aldosteronevasopressin axis in successful and unsuccessful endurance horses. Equine. Vet. J. 42, 83–90. doi: 10.1111/j.2042-3306.2010.00211.x
Novak, C. M., Escande, C., Gerber, S. M., Chini, E. N., Zhang, M., Britton, S. L., et al. (2009). Endurance capacity, not body size, determines physical activity levels: role of skeletal muscle PEPCK. PLoS One 4:e5869. doi: 10.1371/journal.pone.0005869
Pekkala, S., Lensu, S., Nokia, M., Vanhatalo, S., Koch, L. G., Britton, S. L., et al. (2017). Intrinsic aerobic capacity governs the associations between gut microbiota composition and fat metabolism age-dependently in rat siblings. Physiol. Genom. 49, 733–746. doi: 10.1152/physiolgenomics.00081.2017
Queipo-Ortuño, M. I., Seoane, L. M., Murri, M., Pardo, M., Gomez-Zumaquero, J. M., Cardona, F., et al. (2013). Gut microbiota composition in male rat models under different nutritional status and physical activity and its association with serum leptin and ghrelin levels. PLoS One 8:e65465. doi: 10.1371/journal.pone.0065465
Ritchie, R. H., Leo, C. H., Qin, C., Stephenson, E. J., Bowden, M. A., Buxton, K. D., et al. (2013). Low intrinsic exercise capacity in rats predisposes to age-dependent cardiac remodeling independent of macrovascular function. Am. J. Physiol. Heart Circ. Physiol. 304, 729–739. doi: 10.1152/ajpheart.00638.2012
Russell, A. P., Lamon, S., Boon, H., Wada, S., Güller, I., Brown, E. L., et al. (2013). Regulation of miRNAs in human skeletal muscle following acute endurance exercise and short-term endurance training. J. Physiol. 591, 4637–4653. doi: 10.1113/jphysiol.2013.255695
Schwarzer, M., Britton, S. L., Koch, L. G., Wisloff, U., and Doenst, T. (2010). Low intrinsic aerobic exercise capacity and systemic insulin resistance are not associated with changes in myocardial substrate oxidation or insulin sensitivity. Basic. Res. Cardiol. 105, 357–364. doi: 10.1007/s00395-010-0087-2
Snow, D. H., Baxter, P., and Rose, R. J. (1981). Muscle fibre composition and glycogen depletion in horses competing in an endurance ride. Vet. Rec. 108, 374–378. doi: 10.1136/vr.108.17.374
Spargo, F. J., McGee, S. L., Dzamko, N., Watt, M. J., Kemp, B. E., Britton, S. L., et al. (2007). Dysregulation of muscle lipid metabolism in rats selectively bred for low aerobic running capacity. Am. J. Physiol. Endocrinol. Metab. 292, E1631–E1636.
Stephenson, E. J., Stepto, N. K., Koch, L. G., Britton, S. L., and Hawley, J. A. (2012). Divergent skeletal muscle respiratory capacities in rats artificially selected for high and low running ability: a role for Nor1? J. Appl. Physiol. 113, 1403–1412. doi: 10.1152/japplphysiol.00788.2012
Steppe, M., Van Nieuwerburgh, F., Vercauteren, G., Boyen, F., Eeckhaut, V., Deforce, D., et al. (2014). Safety assessment of the butyrate-producing Butyricicoccus pullicaecorum strain 25-3(T), a potential probiotic for patients with inflammatory bowel disease, based on oral toxicity tests and whole genome sequencing. Food Chem. Toxicol. 72, 129–137. doi: 10.1016/j.fct.2014.06.024
Swallow, J. G., Wroblewska, A. K., Waters, R. P., Renner, K. J., Britton, S. L., and Koch, L. G. (2010). Phenotypic and evolutionary plasticity of body composition in rats selectively bred for high endurance capacity. J. Appl. Physiol. 109, 778–785. doi: 10.1152/japplphysiol.01026.2009
Tung, Y. T., Wu, M. F., Lee, M. C., Wu, J. H., Huang, C. C., and Huang, W. C. (2019). Antifatigue activity and exercise performance of phenolic-rich extracts from calendula officinalis, Ribes nigrum, and Vaccinium myrtillus. Nutrients 11:E1715. doi: 10.3390/nu11081715
Van Caenegem, E., Wierckx, K., Taes, Y., Schreiner, T., Vandewalle, S., Toye, K., et al. (2015). Body composition, bone turnover, and bone mass in trans men during testosterone treatment: 1-year follow-up data from a prospective case-controlled study (ENIGI). Eur. J. Endocrinol. 172, 163–171. doi: 10.1530/EJE-14-0586
Wang, S. Y., Huang, W. C., Liu, C. C., Wang, M. F., Ho, C. S., Huang, W. P., et al. (2012). Pumpkin (Cucurbita moschata) fruit extract improves physical fatigue and exercise performance in mice. Molecules 17, 11864–11876. doi: 10.3390/molecules171011864
Welly, R. J., Liu, T. W., Zidon, T. M., Rowles, J. L. III, Park, Y. M., Smith, T. N., et al. (2016). Comparison of diet versus exercise on metabolic function and gut microbiota in obese rats. Med. Sci. Sports Exerc. 48, 1688–1698. doi: 10.1249/MSS.0000000000000964
Wisløff, U., Najjar, S. M., Ellingsen, O., Haram, P. M., Swoap, S., Al-Share, Q., et al. (2005). Cardiovascular risk factors emerge after artificial selection for low aerobic capacity. Science 307, 418–420. doi: 10.1126/science.1108177
Wu, R. E., Huang, W. C., Liao, C. C., Chang, Y. K., Kan, N. W., and Huang, C. C. (2013). Resveratrol protects against physical fatigue and improves exercise performance in mice. Molecules 18, 4689–4702. doi: 10.3390/molecules18044689
Keywords: intrinsic exercise capacity, physical activities, gut microbiota, transcriptome, proteome
Citation: Tung Y-T, Hsu Y-J, Liao C-C, Ho S-T, Huang C-C and Huang W-C (2019) Physiological and Biochemical Effects of Intrinsically High and Low Exercise Capacities Through Multiomics Approaches. Front. Physiol. 10:1201. doi: 10.3389/fphys.2019.01201
Received: 26 April 2019; Accepted: 03 September 2019;
Published: 18 September 2019.
Edited by:
Vassilis Mougios, Aristotle University of Thessaloniki, GreeceReviewed by:
David Christopher Nieman, Appalachian State University, United StatesVictoria Jeanne Vieira-Potter, University of Missouri, United States
Copyright © 2019 Tung, Hsu, Liao, Ho, Huang and Huang. This is an open-access article distributed under the terms of the Creative Commons Attribution License (CC BY). The use, distribution or reproduction in other forums is permitted, provided the original author(s) and the copyright owner(s) are credited and that the original publication in this journal is cited, in accordance with accepted academic practice. No use, distribution or reproduction is permitted which does not comply with these terms.
*Correspondence: Chi-Chang Huang, john5523@ntsu.edu.tw; Wen-Ching Huang, wenching@ntunhs.edu.tw