On the linkage of oil prices and oil uncertainty with US equities: a combination analysis based on the wavelet approach and quantile-on-quantile regression
 Mohamed Yousfi1*
  Houssam Bouzgarrou2
- 1Higher Institute of Commercial Studies of Sousse (IHEC Sousse), University of Sousse, Sousse, Tunisia
- 2Higher Institute of Finance and Taxation of Sousse (ISFFS), University of Sousse, Sousse, Tunisia
This paper aims to investigate the dynamic and asymmetric linkage between crude oil, oil uncertainty, and the United States (US) equity markets across various horizons and tails using a combination of a time-frequency approach, Granger causality, and quantile-on-quantile regression from January 2020 to December 2022. The empirical results indicate that causal relationships and the dynamic co-movement between crude oil, oil implied volatility, and the Dow Jones industrial and transportation indices are confirmed across various frequencies through wavelet-based Granger causality and wavelet coherence. Then, the wavelet-based quantile-on-quantile regression shows that the relationship between oil, oil implied volatility, and both US equity markets is heterogeneous and asymmetric across short- and long-run horizons, in particular. The findings provide new insights into the sensitivity of US stock markets to oil shocks across various time frequencies and tails, offering several portfolio implications useful for heterogeneous investors and portfolio managers.
1 Introduction
Crude oil plays a crucial role in economic progress and the development of nations, being utilized in various economic activities. Consequently, oil price volatility has a widespread impact on different sectors, with the effects varying across these sectors [1–3]. Among the sectors, industrial and transportation sectors are particularly vulnerable to oil price fluctuations [4,5], as instability in prices can significantly affect firms’ activities, profits, and share prices [6,7]. The connection between oil prices and the stock market has garnered increased interest due to numerous oil shocks in recent decades. Previous research studies indicate a mixed impact of oil price shocks on stock markets (see [8–12]). However, the influence of oil prices on the stock market depends on factors such as whether the country is an importer or exporter of oil or the nature of oil shocks [13].
Over the last 2 decades, the dynamics of relationships between oil prices and various financial assets have been influenced by turbulent periods such as the global financial crisis and the oil crisis [14–16]. Similarly, oil market uncertainty, as measured by oil implied volatility (OVX), has impacted financial markets during both calm and turbulent periods [17–19]. On the other hand, the literature on the interconnectedness between oil and stocks presents empirical evidence confirming the contagion effect between the oil market and stock markets [20–25]. It also suggests that oil can serve as a risk management asset to mitigate risk within portfolio construction (see [26–29]).
Moreover, the current decade is marked by two crises impacting economic and financial systems. The global spread of the coronavirus since the onset of 2020, coupled with the increasing number of infection and death cases, prompted governments to implement stringent measures to curb the rapid spread of the virus, including general quarantine and travel restrictions. As a result of these policies, economic and transportation activities experienced a decline, leading to reduced energy demand worldwide. Consequently, a demand shock in the oil market emerged due to the global confinement policy [30]. However, firms’ performance and the stock market also responded to the impact of the COVID-19 crisis. In light of this, numerous studies have revisited the relationships between equity and oil prices, offering evidence of the pandemic’s influence on the association between oil and stock markets (see [31–37]). Furthermore, the war between Russia and Ukraine influenced the interconnectedness between oil and various financial assets (see [38–41]).
From a methodological standpoint, the examination of the relationship between equity markets and the oil market involved the application of diverse econometric models that account for linear, non-linear relationships, and time-frequency domains, drawing from related research. Notable examples include multivariate GARCH models [28,42–45], VAR and SVAR models [46,47], ARDL and NARDL models [48,49], quantile and quantile-on-quantile regression [30,50,51], time-frequency approach [34,52], various types of Diebold and Yilmaz connectedness approach [20,53–56,57], among others. Furthermore, several studies have adopted a combination of two or more models to enhance the analytical framework. Some studies have employed a combination of SVAR and M-GARCH models [58], the SVAR-NARDL model [59], wavelet and Granger causality approaches [34,60], wavelet and M-GARCH models [61,62], and the quantile-ARDL model [63], among others. This methodological diversity reflects the complexity of the relationship under investigation and underscores the importance of considering various aspects, such as volatility, causality, and time-frequency dynamics, in capturing the intricate interplay between equity and oil markets.
In the present research, we contribute to the existing literature on oil prices and equities by reexamining the connection between oil and stock markets, incorporating both time-frequency domains and the tail dependence structure. This approach aims to provide more comprehensive insights into the complex nexus between oil prices and equities. To achieve this, wavelet analysis and quantile regression are the most recommended models for examining the relationships between two time series data, considering both time-frequencies and tail dependence. Concurrently, quantile-on-quantile regression (QQR) delves into the tail dependence structure between two assets. Indeed, QQR represents a fusion of the standard quantile regression (QR) model with a non-parametric approach, offering more intricate insights into the complex linkage between time series compared to ordinary least squares (OLS) and traditional QR. While standard quantile regression unveils the impact of the dependent variable on the independent variable across various quantiles [64], QQR goes further by examining relationships across higher and lower quantiles of both dependent and independent variables [65]. This nuanced approach enhances our understanding of the dynamics within the relationship, particularly in capturing extreme values and tail behaviors. Nevertheless, prior studies have utilized both the wavelet approach and the QQR model, collectively termed the wavelet-based quantile approach, to explore the relationships between two time series. These studies confirm that this technique provides more detailed information about interdependence (see [66–70]).
The unique methodological approach that combines the wavelet method with QQR provides a comprehensive framework for investors to analyze and model financial time series data. Specifically, the wavelet approach offers a way to decompose and analyze data at multiple scales, while QQR regression helps in understanding and managing the tail risk of financial returns. Combining these techniques allows investors to gain deeper insights into the underlying dynamics of financial markets and make more informed investment decisions. Wavelet methods have gained interest in finance because they provide a multi-resolution analysis, meaning they can capture information at different scales or frequencies. The decomposition of financial time series into different frequency components helps investors understand which time scales contribute significantly to the overall variation in financial assets. Additionally, wavelets can be used to analyze volatility at different time scales. This is crucial for risk management, as investors can identify short-term and long-term volatility patterns [71–74].
Meanwhile, understanding the conditional distribution of returns is essential for risk management and portfolio optimization. QQR allows investors to model and analyze the tails of the distribution. This is particularly useful for assessing extreme events or tail risks, crucial considerations for investors concerned with downside protection. By modeling quantiles, investors can make decisions that are robust to different levels of risk. This is especially important in constructing portfolios that consider not only the mean and variance but also the tail behavior of asset returns.
Interestingly, based on the existing literature, we have observed that no prior study has assessed the intricate correlation of both crude oil and oil uncertainty with equity markets under the influence of the COVID-19 crisis and the Ukrainian war, while considering time scales and tail analysis using wavelet-based quantile-on-quantile regression. Therefore, this study aims to bridge this gap by integrating econometric models that consider frequencies and tail dependence, reexamining the relationships between oil shocks and US stock markets during recent crisis periods that significantly impacted the oil market and resulted in the emergence of oil shocks. Initially, we investigate the causal linkage between crude oil, oil uncertainty, and two US equity markets across eight frequencies using the wavelet-based Granger causality test. Subsequently, considering the time-frequency domains, we analyze the co-movement as well as the lead/lag linkage between the aforementioned financial assets through another wavelet approach known as wavelet coherence, based on the wavelet continuous transform. Finally, to gain more insights into the nature of the linkage between oil fluctuation and equity markets, we integrate frequency and quantile dependence via wavelet-based quantile-on-quantile regression. This approach enables us to examine the heterogeneous and asymmetric relationships across various quantiles of independent and dependent assets at different horizons.
The present paper introduces several contributions to the literature concerning the relationships between oil shocks and financial markets. Firstly, we reexamine the connection between oil prices, oil uncertainty measured by the OVX index, and stock markets. Our focus is on key stock indices that track the performance of companies heavily reliant on crude oil as an energy source, specifically the US industrial and transportation indices. Secondly, we narrow our attention to recent periods encompassing the COVID-19 crisis and the Ukrainian war, during which the oil market witnessed heightened fluctuations due to the repercussions of the pandemic and geopolitical risks. Lastly, we adopt a unique approach by combining two econometric methods that consider frequencies and tail dependence. Diverging from traditional econometric models, we merge the wavelet approach with the quantile-on-quantile regression model. The wavelet approach enables us to decompose time series into various frequencies, and subsequently, we employ these time series in a quantile-on-quantile model to explore heterogeneous and asymmetric linkages at different quantiles of both dependent and independent variables and their respective horizons. This combination proves valuable in addressing non-linear linkages between two time series.
The results derived from the aforementioned empirical methodologies regarding the relationships between oil price fluctuation, its uncertainty, and both US stock markets offer fresh insights into the sensitivity of equities to oil shocks across diverse timeframes, frequencies, and quantiles. Furthermore, our findings present various risk management options for heterogeneous investors and portfolio managers seeking to mitigate risk within portfolio construction.
The remaining sections of the present study are summarized as follows: Section 2 outlines the methodologies employed, while Section 3 provides a description of the data. Section 4 delves into the analysis and discussion of the results. Finally, Section 5 presents the conclusion, summarizing the key findings and their implications.
2 Methodologies
We aim to examine the relationship between the US stock markets, the oil market, and oil uncertainty, considering time, frequency domain, and tail dependence. To achieve this, we initially utilize a wavelet-based Granger causality test to identify any causal relationships across different horizons. Subsequently, we employ wavelet coherence to analyze the co-movement at various scales. Finally, we integrate wavelet decomposition and quantile-on-quantile regression to investigate tail dependence across different frequencies. The empirical methodologies are detailed in the following subsections.
2.1 Wavelet approaches
We use wavelet approaches to explore the interconnectedness among US equity markets, oil prices, and oil uncertainty indices across various time frequencies. The primary advantage of the wavelet approaches lies in their ability to decompose time series into various frequencies. Specifically, we use the maximum overlap discrete wavelet transform (MODWT) and continuous wavelet transform (CWT) to decompose our time series. The MODWT and CWT are distinct techniques employed in the processing and analysis of time series, particularly within the realm of wavelet analysis. MODWT functions as a discrete wavelet transform, breaking down series into different resolution levels through the use of overlapping windows. It excels in time localization and is computationally efficient when dealing with discrete data. On the other hand, CWT operates as a continuous wavelet transform, scrutinizing series across both time and scale. It achieves excellent time-frequency localization by continuously considering wavelets of varying scales, making it well-suited for applications where fine-scale details are critical. In summary, MODWT and CWT differ in their approaches to time series analysis. MODWT is discrete and computationally efficient, while CWT offers continuous analysis with superior time-frequency localization.
Indeed, the decomposition of US equity markets, oil prices, and oil uncertainty through the wavelet transform is outlined as follows:
Where
Actually, we employ the MODWT based on multi-resolution analysis, which facilitates a multi-horizon analysis across different time-frequencies. These frequency bands or scales can be categorized into short-, medium-, and long-term. Let
Where
In this study, the time series are decomposed using the Daubechies (a family of compactly supported wavelets) least asymmetric filter of length eight, LA(8). The LA(8) wavelet is relatively smooth when compared with Haar wavelet filters [75]. As highlighted in [60], the LA = 8 wavelet mother’s filter is commonly used in economic and financial applications of wavelets. As this paper does not discuss the choice of wavelet mothers, we apply this filter in the discrete case. More precise discussions on these technical aspects are presented in [76-78].
However, by applying the MRA-MODWT with the least asymmetric wavelet filter, LA (8), and J = 8 order, we enable to decompose the data sample into eight frequency bands from D1 to D8. The wavelet scales D1, D2, D3, D4 D5, D6, D7, and D8 are associated with oscillations of periods of 2–4, 4–8, 8–16, 16–32, 32–64, 64–128, 128–256, and more than 256 days, respectively1. Where D1, D2, and D3 represent the short-term, D4 and D5 represent the medium-term, and D6, D7, and D8 represent the long-term.
Furthermore, in this study, we applied the continuous wavelet transform (CWT) to decompose the time series into different scales. We use the Morlet wavelet set to
A crucial aspect of this technique lies in its ability to systematically decompose and then reconstruct a time series seamlessly, X1 (t)
Furthermore, this technique maintains the power of the observed time sequence as follows:
We utilized wavelet coherence, a method that enables the analysis of co-movement and lead/lag relationships between two time series across various time-frequencies [77,78,81]. [78] explained that the cross-wavelet transform can be elucidated through the analysis of two time sequences X1 (t) and X2 (t) as follow:
Where,
Where, M is the smoothing mechanism.
Where the parameters
2.2 Wavelet-based granger causality test
The wavelet-based Granger causality test is used in this study to evaluate the causal relationship between the variables across various scales. In a wavelet-based Granger causality test, multiple Vector Autoregressive (VAR) models are estimated to assess Granger causality across different decomposition levels (scales) of the wavelet transformation. The number of VAR models estimated corresponds to the number of decomposition levels chosen for the wavelet analysis.
Let’s denote the number of decomposition levels as J. For each decomposition level j, where j = 1, 2, . . ., J, a VAR model is estimated to test Granger causality. Therefore, a total of J VAR models are estimated. Each VAR model is estimated using the time series data after applying the wavelet transformation at a specific decomposition level. The VAR model for each scale typically follows the standard form. The equations of the wavelet-based Granger causality test are illustrated as follows:
Where,
2.3 Quantile-on-quantile regression
In the second step, we utilize the quantile-on-quantile approach introduced by [65] to investigate the asymmetric and heterogeneous linkage between the US stock markets and oil prices, as well as oil uncertainty, across various scales obtained from the wavelet approach. Unlike the ordinary least squares (OLS) model and standard quantile regression, the quantile-on-quantile (QQR) approach allows us to examine the linkage between two time series across the left and right tails of the mean of both variables at various frequencies. This approach provides more detailed insights into the nature of the relationship. However, it is important to note that QQR is based on the nonparametric estimation and standard quantile regression methodology proposed by [83]. The traditional quantile regression is presented as follows:
Where,
Therefore, the unknown function
Where,
Then, we substitute Equation 13 into the standard quantile regression (Eq. 11) to obtain the following equation:
Where,
The term
Overall, the QQR approach can successfully capture quantile-asymmetric and heterogeneous links without compromising the properties of traditional QR. However, the selection of bandwidth (h) for a nonparametric approach is crucial to avoid estimation errors when dealing with QQR. A large h leads to high bias and a decrease in the variance of the estimates; therefore, we opt for a small bandwidth, h = 0.05 [83,84].
3 Data description and preliminary analysis
This study investigates the relationship between oil instability and US stock markets during the COVID-19 pandemic and the Russia-Ukraine war. Notably, the US transportation and industrial sectors are identified as the largest consumers of petroleum products based on US energy information administration (EIA) statistics for 2022. Therefore, this study utilizes daily data on crude oil (WTI), the oil implied volatility index (OVX), Dow Jones industrial, and Dow Jones transportation indices. The dataset spans from January 2020 to December 2022, encompassing two significant crises: the COVID-19 pandemic and the Ukrainian war. West Texas Intermediate (WTI) crude oil, produced in the US and considered a benchmark in the oil market, is a focal point in this investigation. Following the same methodology as the Chicago Board Options Exchange Volatility Index (VIX), the OVX index represents the expected 30-day oil volatility. The Dow Jones industrial Index (DJI) reflects the stock prices of 30 of the largest industrial companies in the US, excluding transportation, while the Dow Jones transportation Index (DJT) tracks the stock prices of 20 of the largest transportation industry companies in the US. Data on US equity markets were collected from the S&P Global website (https://www.spglobal.com). Crude oil prices and OVX data were obtained from the Energy Information Administration (EIA) website (https://www.eia.gov) and the Chicago Board Options Exchange (CBOE) website (https://www.cboe.com), respectively. The start date for the data sample was chosen based on the objectives of the study.
Thereafter, we commence the preliminary analysis by presenting time series prices and returns in Figures 1, 2, respectively. The return series is calculated using the following equation:
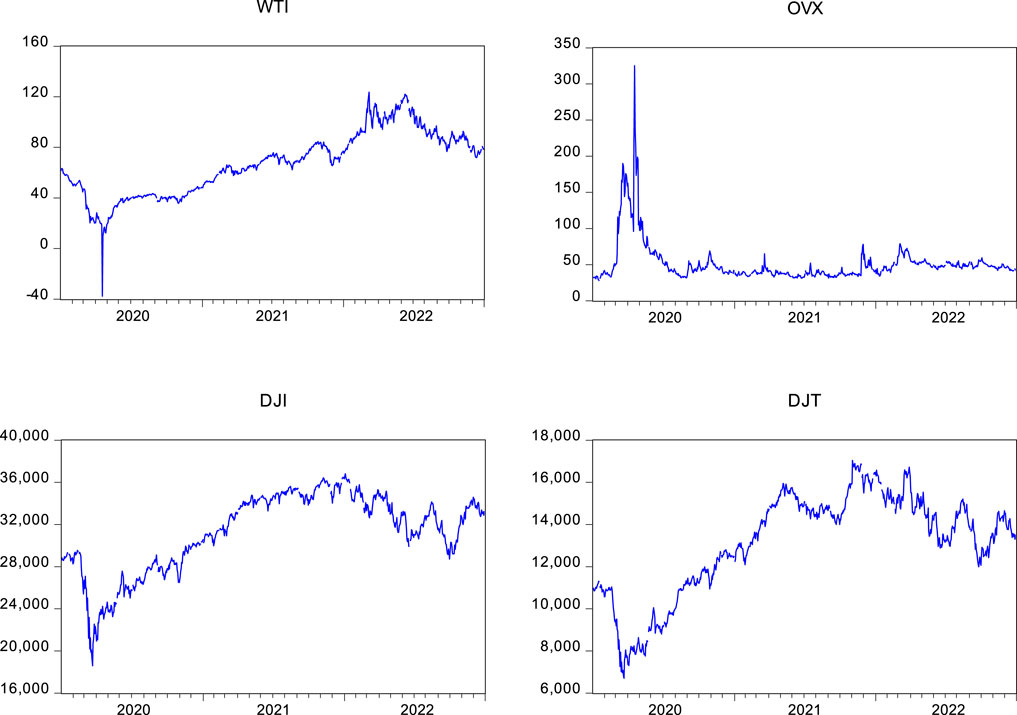
FIGURE 1. Time series plots.
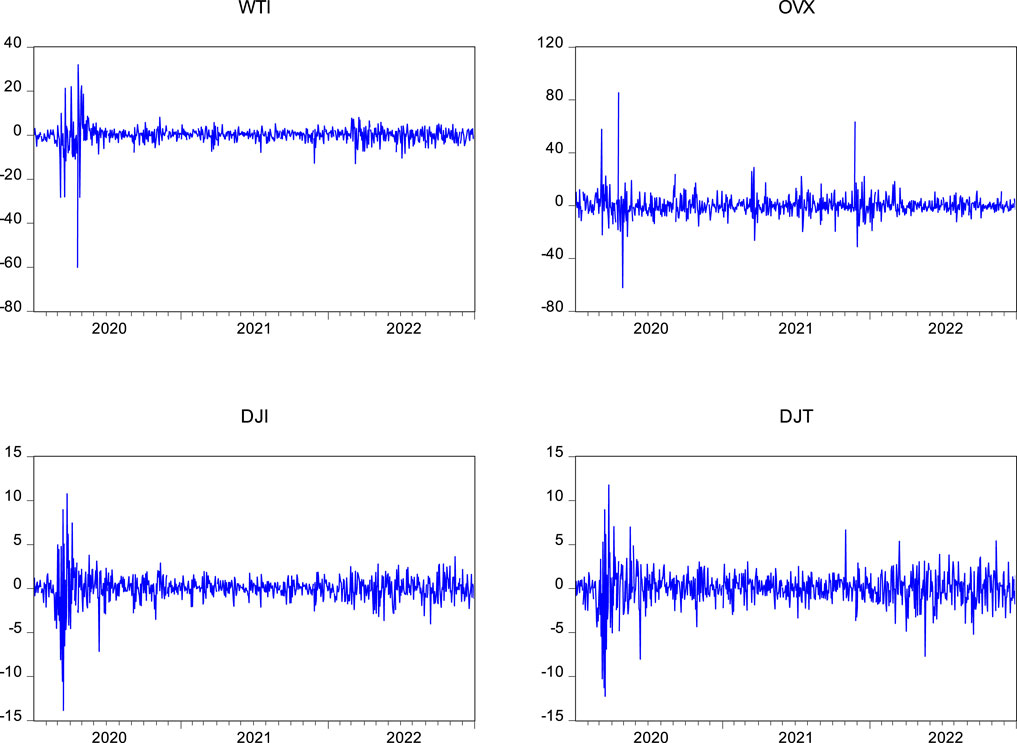
FIGURE 2. Returns plots.
Furthermore, Table 1 presents the descriptive statistics of the returns for each series. Oil implied volatility exhibits the highest mean and standard deviation of returns, while the lowest mean and standard deviation are observed in US industrial equity. The Jarque-Bera test reveals that none of the series follows a normal distribution.
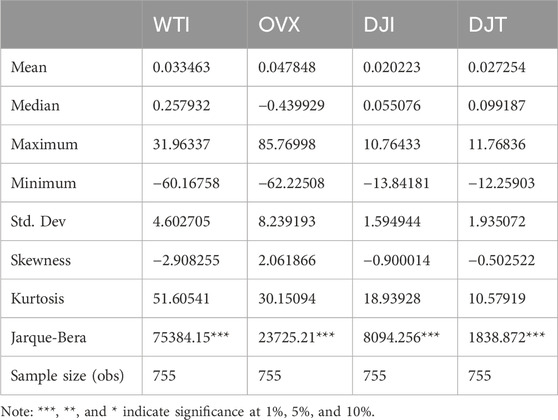
TABLE 1. Sumary statistic.
Additionally, we investigate the linear correlation between all the indices under study. Table 2 presents the Pearson correlation results. WTI is significantly negatively correlated with the OVX index and positively correlated with US stock returns. However, no significant linkage exists between OVX and US equities.
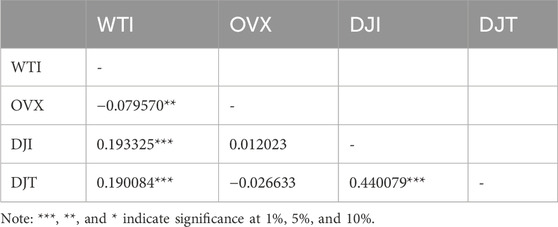
TABLE 2. Pearson correlation.
4 Results and discussion
This study explores the relationship between crude oil, oil implied volatility, and U.S. stock markets using a wavelet-based Granger causality test, wavelet coherence, and wavelet-based quantile-on-quantile regression.
4.1 Frequency-based causality and coherence analysis
We initiate our analysis by conducting initial tests on the causal relationship across eight investment horizons using wavelet-based Granger causality tests. Based on the wavelet decomposition of the series, Table 3 presents the results of the Granger causality test from the D1 to D8 scales. Firstly, we observe a bidirectional causality between crude oil and US industrial indices over D1, D5, and D7 horizons. Conversely, at D3 and D8 frequencies, the DJI is found to cause movements in the oil market. No identifiable linkage is detected over the D2, D4, and D6 horizons. Furthermore, a bidirectional causality relationship is revealed between oil and US transportation indices over both short- (D1) and long-run perspectives (D8), while in D2, the DJT index is causing fluctuations in the oil market. D4, D6, and D7 indicate that oil affects the DJI index. Furthermore, a bidirectional causality nexus is observed between oil implied volatility and US industrial indices across the short-term (D1–D2), the medium-term (D5), as well as the long-term (D7 and D8). In contrast, causality is found to run from DJI to the OVX index for the D3, D4, and D6 frequencies. Additionally, OVX and DJT also exhibit a bidirectional linkage for the D1 and D4 horizons, with causality from DJT to the oil uncertainty index over the D2, D3, and D5 frequencies.
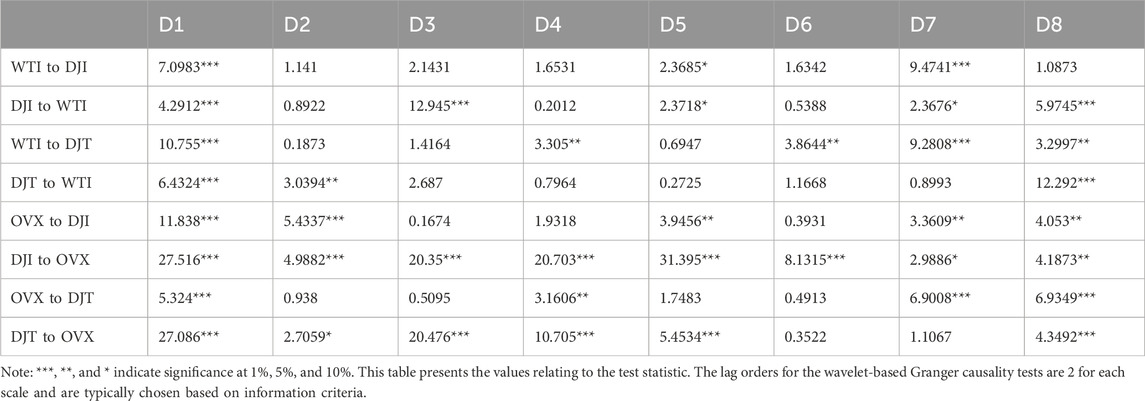
TABLE 3. Wavelet-Based Granger causality tests.
These results underscore the complex and dynamic nature of the relationship between crude oil prices and industrial indices, highlighting the importance of considering multiple time scales in analyzing their interactions. For instance, the findings indicate bidirectional causality between crude oil and industrial index at certain scales (D1, D5, and D7), while showing no identifiable linkage at other scales (D2, D4, and D6). This diversity can be explained as follows: bidirectional causality at the shortest scale (D1) suggests that in the very short term, changes in crude oil prices can affect the industrial indices and vice versa. This may reflect immediate reactions to news, supply disruptions, or other short-term shocks in either market. However, the presence of bidirectional causality at D5 suggests that over a slightly longer time horizon, both crude oil and industrial indices influence each other. This could imply that factors such as changes in production, global demand, or economic policies have a mutual impact on both oil prices and industrial activity. Meanwhile, bidirectional causality at D7 indicates that over a more extended period, there are persistent interactions between crude oil and industrial indices. This might reflect deeper structural relationships, such as energy consumption patterns in industrial production or the influence of industrial output on oil demand over longer economic cycles. In contrast, the lack of identifiable linkage at D2, D4, and D6 scales suggests that at certain intermediate and longer time horizons, there may be other factors dominating the behavior of either crude oil or industrial indices independently. This could be due to market-specific factors, regulatory changes, or other external shocks that temporarily decouple the two markets.
Indeed, understanding the causal relationships between crude oil and industrial indices at different scales is crucial for investors and portfolio managers, given their often heterogeneous investment horizons. In summary, the results of the wavelet-based Granger causality test affirm the existence of a causal linkage between oil prices, oil uncertainty, and US equities across various investment horizons. Consistent with prior research [34,85,87], our findings shed light on the impact of oil instability on US equities. It is noteworthy that, on certain scales, we fail to identify causal relationships between the oil market, oil uncertainty, and both US stocks, suggesting that equities may not be highly sensitive to oil shocks, particularly in medium- and long-term horizons. The results of the study reveal that the connectedness between oil and equities depends on the frequency and varies across various investment horizons. These findings could inform portfolio diversification strategies and risk management practices. Moreover, investors should consider frequently rebalancing the portfolio structure rather than adopting a static method such as buy and hold.
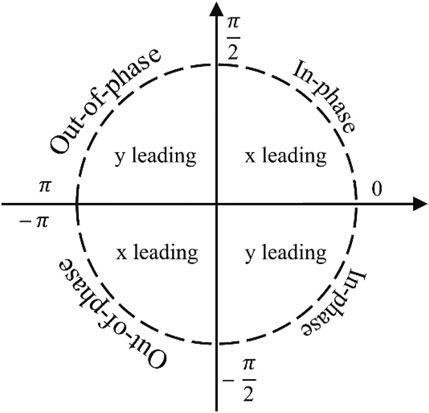
Indeed, through Granger causality analysis in frequency domains, we substantiate the existence of a causal effect between the oil market, oil uncertainty, and US industrial and transportation equities. It is noteworthy, however, that this approach may not precisely pinpoint when and over which horizons the pairs are linked, as the causality is estimated based on the sample average. To address this limitation, we employed wavelet coherence, a method capable of exploring the co-movement lead/lag relationships between two series across both time and frequency domains. To assess the statistical significance of these relationships, we conducted Monte Carlo simulations following the methodology outlined by [77]. The wavelet coherence analysis enables us to discern the impact of turbulent periods on the connectedness between the selected variables, as illustrated in Figure 3. The direction of the arrows in the coherence charts provides insight into whether the co-movement is positive (in phase) or negative (out of phase), along with the causality linkage direction (lead/lag), as outlined3 by [76].
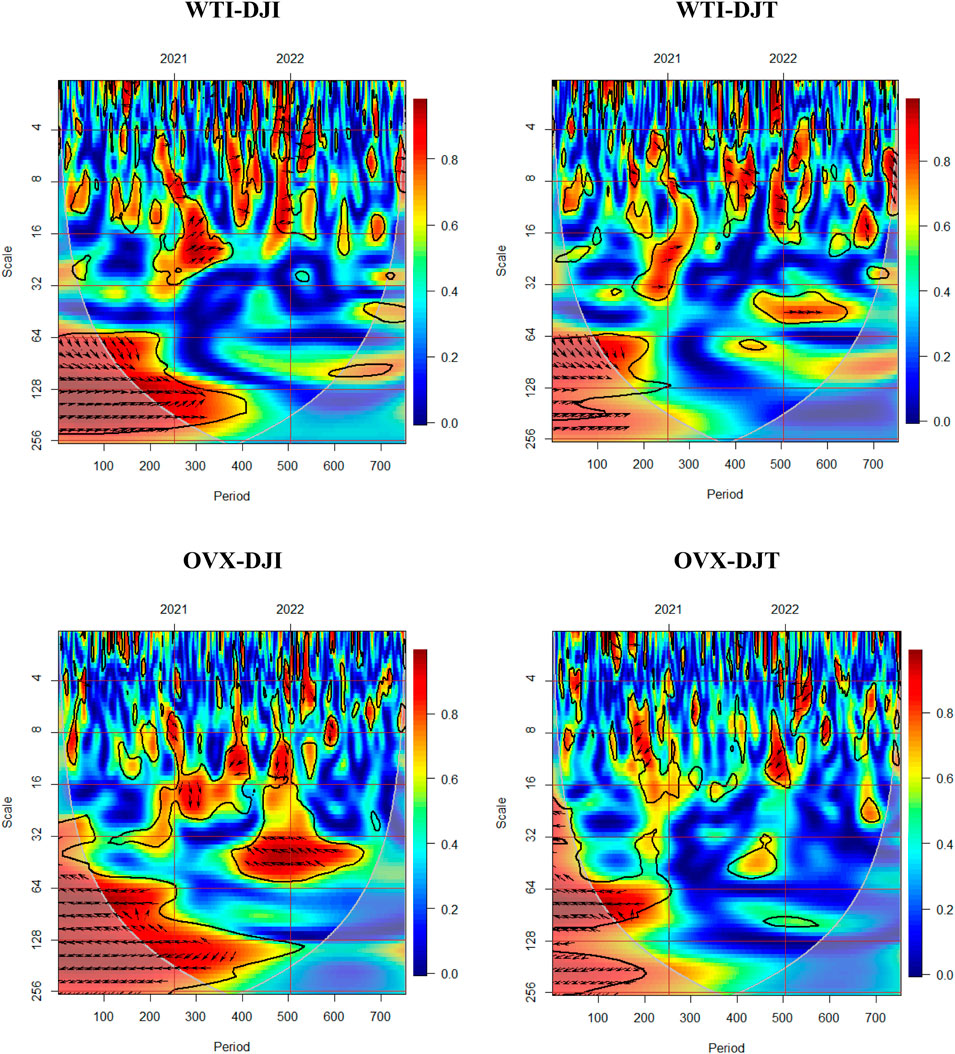
FIGURE 3. Wavelet coherence. Note: The black contours have a significance level of 5%. Red and blue colors correspond to higher and weaker co-movements.
In general, we observe a high degree of co-movement among all pairs across various horizons, especially during turbulent periods. Specifically, we identify a robust positive dependence between the oil market and both US equities from the onset of the COVID-19 pandemic until the end of 2020, particularly over the long run (from 64 to more than 256 days’ frequency bands). Notably, the causality between the oil market and equities is found to be bidirectional during this period. In contrast, oil implied volatility demonstrates a negative correlation with both equities throughout the year 2020.
Furthermore, in 2021, we identified small regions of strong positive linkage for the WTI/DJI and WTI/DJT pairs, respectively, occurring over short and medium frequencies. Notably, WTI leads DJI, and DJT leads WTI in these pairs. For the OVX/DJI pair, we observed both positive and negative connectedness during the first half of 2021 over the medium horizon, indicating a bidirectional causality. Conversely, the OVX/DJT pair demonstrates negative co-movement between the 8 and 16 days’ frequency bands, with OVX leading equities. Additionally, coinciding with the onset of the Ukraine invasion in the first quarter of 2022, we observe a small region of high inverse co-movement on short scales (four to eight days’ frequencies). This can be attributed to the decline in US stock prices juxtaposed with the rise in oil prices and oil uncertainty amid the energy crisis triggered by Russia’s invasion of Ukraine. Notably, since 2021 over the medium to long term, the prevalence of the blue color in this region suggests an absence of co-movement and causal linkage between oil and stock markets, aligning with the findings in Table 3. Therefore, we can conclude that WTI holds potential as a hedge and diversification asset. The time-frequency analysis reveals that the co-movement between oil, as well as oil implied volatility indices, and US equities is particularly sensitive to crises, with the COVID-19 pandemic having a more pronounced impact than the geopolitical conflict between Russia and Ukraine. As indicated in recent literature, the heightened positive correlation, especially during tumultuous periods, signifies contagion or risk transmission between various financial markets due to the elevated systematic risk during crisis situations, such as the COVID-19 crisis [22,34,88–90]. On the other hand, the negative or weak co-movement between oil and equities suggests diversification benefits for investors between both assets during calmer periods. Furthermore, the negative connectedness between oil uncertainty and both equities indicates that bad oil news can impact stock returns negatively. However, we note that the causality linkage varies depending on both the time and frequency domains, as well as market circumstances influenced by crises.
Overall, findings of wavelet coherence indicate that the relationship is particularly sensitive to the risk of an extreme tail event. Consequently, we are keen on conducting a thorough examination of the linkage between the oil market and the implied volatility index with US equity across various frequencies and tails. This will be achieved through a wavelet-based quantile-on-quantile approach.
4.2 Frequency-based quantile dependence analysis
For a more in-depth analysis and robust results, we conducted an examination of tail dependence across various investment horizons using a wavelet-based quantile-on-quantile approach. This method allows us to identify dependence within the conditional distribution of crude oil, oil volatility, and US stock markets across short, medium, and long-term frequency bands. In Figure 4, tail-frequency plots are presented in panels A and B. Based on the bar color on the right of each plot, representing the degree and sign of the identified dependence4, we observed that tail dependence is not uniform or symmetric across all horizons. In fact, we noticed an asymmetry in the tail dependency structure between each pair across the left and right tails.
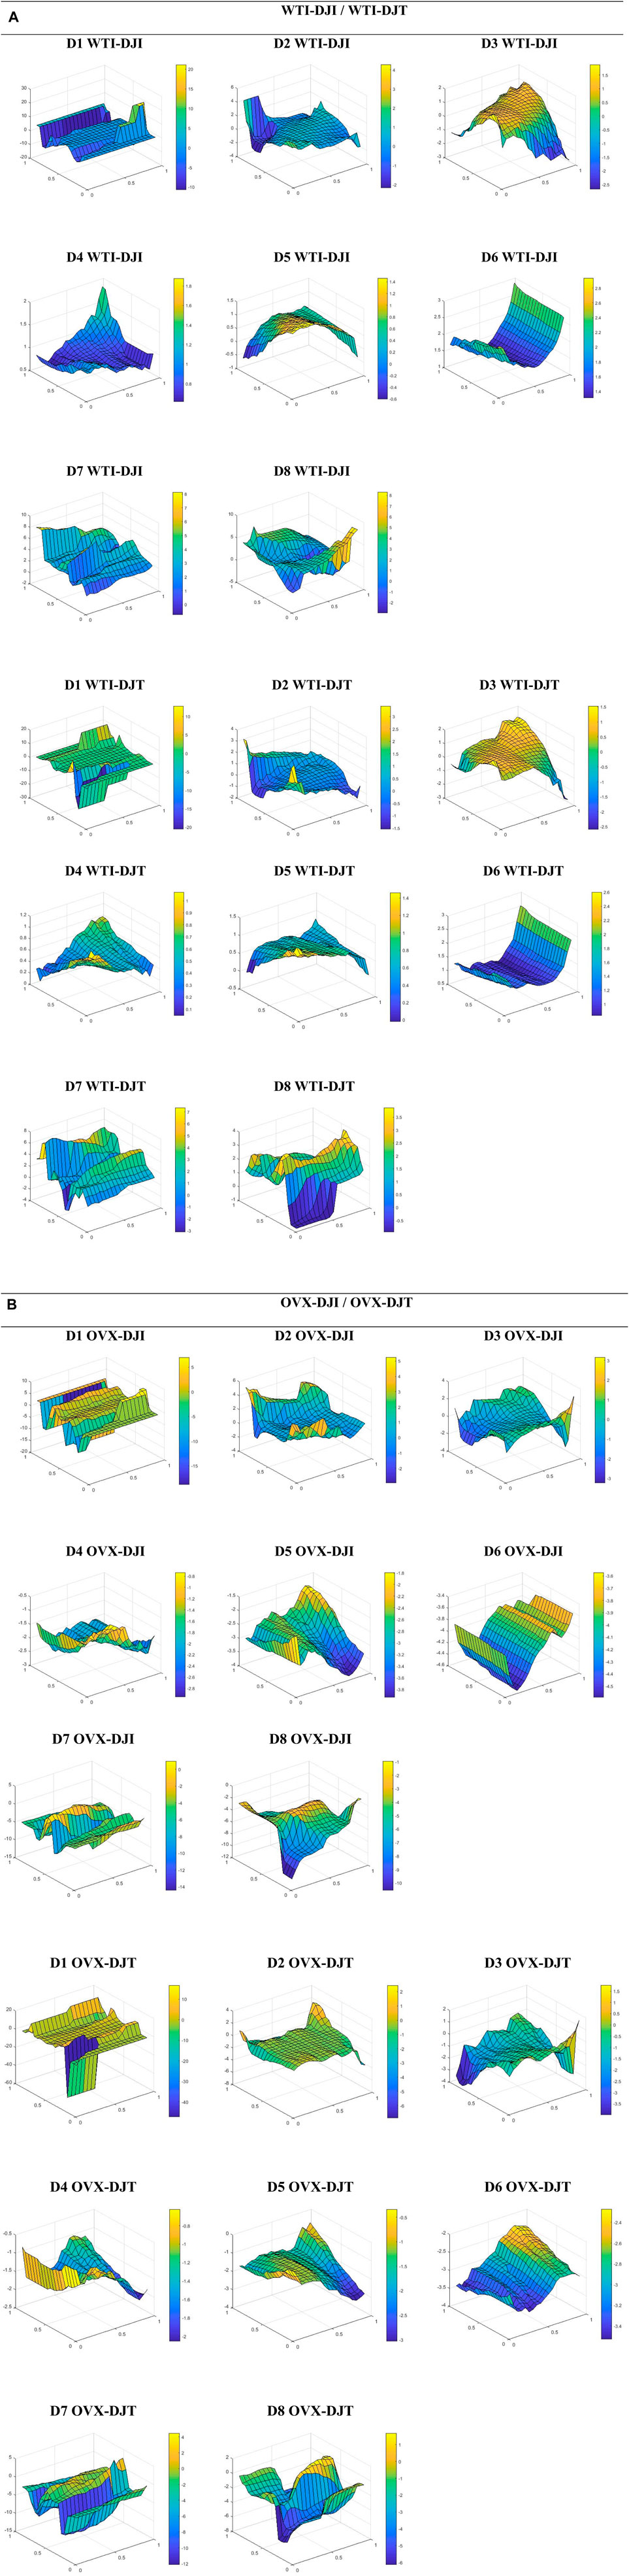
FIGURE 4. Wavelet-based Quantile-on-quantile dependence. Note: The slope coefficient, β1 (
We begin our examination with the tail-frequency dependence between crude oil and US equities (Panel A). For D1 and D8 horizons, a high positive dependence is observed when DJI is in the high range (60%–95% quantiles) and WTI is in the low range (20% quantile). The D8 plot shows another positive interdependence over high quantiles of WTI and low/medium quantiles of DJI. Conversely, a negative dependence emerges across low quantiles for both assets. Additionally, we identify another robust negative relationship when WTI is in the high range (approximately 80% quantile) and across most quantiles of DJI. Similar tail dependence patterns are observed for D2 and D3. A pronounced negative linkage is found when WTI is high and both US stock markets are low. Another strong inverse relationship is observed when the oil market is bearish and stocks are bullish. Positive dependence is noted across the extreme tails of the oil and US stock markets. However, for D4, D5, D6, and D7 scales, we observe that oil is positively correlated with both US stock markets across various quantiles, except in the case of the WTI/DJT pair for the D5, and D7 horizons, which exhibits results similar to those observed over D2 and D3 frequencies.
On the other side, panel B illustrates the tail-frequency dependence of OVX/US stock pairs. On the high scale (D1), the results reveal a predominantly negative nexus across most quantiles. The strongest inverse linkage is observed across low quantiles for both OVX and US stock markets, as well as when OVX is bearish, regardless of the quantiles of DJI. Meanwhile, the D2 horizon indicates a positive link between OVX and DJI when both are bearish, as well as when OVX is bearish and across various quantiles of DJI. However, negative linkage is observed over the remaining quantiles. For the OVX/DJT pair, the dominant linkage is negative, with a positive nexus observed only when OVX is high and at the extreme tails of DJT. Indeed, at the medium frequency (D3), OVX and both stock markets exhibit positive dependence across low quantiles of OVX and various quantiles of equities. Another positive linkage emerges when OVX and stock markets are higher, while a negative linkage is observed across the high quantiles of OVX and the low quantiles of stock markets. Finally, an inverse relationship is identified between oil implied volatility and DJI across all quantiles for the D4, D5, D6, D7, and D8 investment horizons. The same findings were observed for OVX/DJT for D4, D5, and D6 frequencies. For D7 and D8 scales, we find that the negative dependence appears when both OVX and DJI stock market are low, as well as when OVX is bearish, regardless of the quantiles of DJI.
From a portfolio management perspective, the wavelet-based quantile-on-quantile analysis provides portfolio implications for heterogeneous investors. The findings reveal that the oil index serves as an effective risk management asset against risks in US equities, as evidenced by the negative tails dependence across various quantiles and horizons. However, when positive interdependence is confirmed, suggesting high-risk transmission between oil and US equities, oil becomes a less favorable investment option. Additionally, the positive tail dependence observed between OVX and US equity markets suggests that equities can act as a hedge against oil uncertainty across various investment horizons, while the negative dependence indicates that oil uncertainty negatively impacts US stock markets. These findings align with previous wavelet coherence results.
The combination of the wavelet approach and the quantile-on-quantile technique can provide new insights and more detailed information about the complex interdependence between oil shocks and equity markets. While wavelets decompose our variables into several frequencies, the quantile-on-quantile approach not only models the heterogeneous relationship between oil (OVX) and equities at various points of the conditional distribution of the former, similar to typical quantile regression, but it also models the quantile of oil (OVX) and its various frequencies as a function of the quantile of the equity markets. As such, the quantile-on-quantile approach allows the relationship between the two examined variables to vary at each point of their respective distributions.
Our interesting results add more details and new insights to prior studies that investigate the linkage between oil shocks and equities, in particular those studies only applying time-frequency analysis such as [31, 34, 52], among others, which indicate that the connection between oil and financial markets varies across different scales. However, other researchers like [30, 50, 51], among others, employ quantile-based regressions and show that the tail dependence structure between crude oil and various financial asset classes changes from one quantile to another. What distinguishes our research from previous studies is the assessment of the linkage between crude oil, oil uncertainty, and equity markets through the unique methodological approach that combines the wavelet method with quantile-on-quantile regression, called wavelet-based quantile-on-quantile regression. This approach provides a comprehensive framework for investors to gain deeper insights into the underlying dynamics of financial assets and make more informed investment decisions.
Considering both time-frequency and dependence structure analysis, the results derived from the aforementioned empirical methodologies regarding the relationships between oil price fluctuation, its uncertainty, and stock markets offer fresh insights into the sensitivity of equities to oil shocks across diverse frequencies, and quantiles simultaneously. Our analysis indicate that the linkage differ across investment horizons and conditional distribution. Indeed, we identify a heterogeneous and asymmetric linkage between each pair across various tail dependence structure and investment horizons. Specifically, we demonstrate that the relationships at the left and right tails of both assets in each pair are asymmetric, particularly over the short and long term. Moreover, we demonstrate that the degree and the sign of linkage between oil (oil uncertainty) and equity pairs vary from one quantile to another across various horizons, suggesting that the connectivity between variables is dependent on both frequency and quantiles. Nevertheless, in addition to the previous conclusions, we can add that the frequency-quantile linkage offers several portfolio implications useful for heterogeneous investors and portfolio managers, suggesting that risk management options are also frequency-quantile-dependent. Therefore, investors should opt for frequent adjustments to the portfolio structure rather than adopting a buy and hold strategy, based on market conditions and investment horizons.
5 Conclusion
Recently, oil prices have exhibited significant fluctuations in response to the COVID-19 crisis and geopolitical tensions, impacting global economic activities and financial markets. This study explores the relationship between crude oil prices, oil uncertainty, and the US industrial and transportation stock markets. The analysis spans from January 2020 to December 2022, encompassing the recent crises of the COVID-19 pandemic and the Ukrainian war. Initially, each time series was decomposed into eight horizons to examine causality relationships across various frequencies using a wavelet-based Granger causality test. Subsequently, we investigate the co-movement between WTI, oil implied volatility, and both US equities through wavelet coherence. Finally, we examine tail dependence between financial assets across various quantiles and frequencies using a wavelet-based quantile-on-quantile approach. Through these econometric approaches, our aim is to provide detailed insights into the nature of the nexus between oil price fluctuations, oil uncertainty, and US equities, considering diverse investment horizons and tail dependence.
Our findings can be summarized as follows: The wavelet-based Granger causality analysis reveals a causal linkage between oil prices, oil uncertainty, and both US equities across most scales, with causality varying between unidirectional and bidirectional relationships. These findings align with prior research, such as [34, 86, 87]. Similarly, the wavelet coherence analysis confirms a high level of co-movement between financial assets over short- and long-term investment horizons. Specifically, WTI is predominantly positively correlated with both US stock markets, particularly during periods of turmoil, indicating risk transmission between these asset pairs. Our findings align with the studies of [23, 24, 37, 86]. Conversely, the presence of weak, negative, or absent co-movement between oil and equities suggests that investors may benefit from the diversification option to reduce portfolio-specific risk, especially during certain periods. This finding is in line with [28] and [29], where they indicate that oil acts as a risk management asset to mitigate portfolio risks. Furthermore, the coherence between OVX and US stock markets is varied, with positive and negative connectedness identified across different time-frequency domains. Our findings add to previous research by [17-19]. The negative correlation implies that the US stock market is sensitive to adverse oil news, while the positive nexus suggests that equities can serve as a hedge against oil uncertainty.
Finally, considering both tail and frequency domains through wavelet-based quantile-on-quantile regression, our analysis offers new insights and details about the nature of the relationship between oil shocks and equity markets compared to prior research, such as [24, 28, 34, 86], among others. Overall, the results highlight a heterogeneous and asymmetric linkage between each pair across various market conditions and investment horizons. Specifically, we demonstrate that the relationships at the left and right tails of both assets in each pair are asymmetric, particularly over the short and long term. Consistent with the wavelet coherence results, the positive and negative tails-frequencies linkage further supports the notion that WTI can function as a risk management asset against US equity markets, as indicated by the negative dependence. The confirmation of risk transmission between assets is evident across quantiles with positive dependence. The same conclusion extends to the relationship between OVX and stock markets: the negative nexus suggests that US markets are influenced by oil uncertainty, while the positive correlation implies that US equity markets can withstand the impact of rising oil uncertainty. This suggests that US markets have the potential to hedge against oil implied volatility.
Our study has numerous implications for policymakers, financial regulators, and diverse investors, emphasizing the need to closely monitor oil shocks and their potential impact on financial markets, particularly during turbulent periods. By examining and confirming the persistent interdependence between oil prices, their uncertainty, and industrial and transportation stock markets, especially during recent crises, our research contributes to the existing literature on the linkage between oil shocks and the financial markets. We have employed a comprehensive set of econometric approaches, considering time, frequency, and tail analyses, to offer nuanced insights into the nature of these relationships. However, it is important to acknowledge certain limitations and potential areas for improvement. One such limitation is the omission of economic factors and geopolitical risks in our analysis of the linkage between oil shocks and US stock markets. As a direction for future research, we aim to address this gap by focusing on the role of geopolitical tensions and other relevant factors in influencing the connectivity between oil and equities. This expanded analysis could offer a more comprehensive understanding of the complex relationship between oil shocks and financial markets.
Data availability statement
The raw data supporting the conclusion of this article will be made available by the authors, without undue reservation.
Author contributions
MY: Writing–original draft, Software, Methodology, Formal Analysis, Data curation. HB: Writing–review and editing, Validation, Supervision, Investigation, Conceptualization.
Funding
The author(s) declare that no financial support was received for the research, authorship, and/or publication of this article.
Conflict of interest
The authors declare that the research was conducted in the absence of any commercial or financial relationships that could be construed as a potential conflict of interest.
Publisher’s note
All claims expressed in this article are solely those of the authors and do not necessarily represent those of their affiliated organizations, or those of the publisher, the editors and the reviewers. Any product that may be evaluated in this article, or claim that may be made by its manufacturer, is not guaranteed or endorsed by the publisher.
Footnotes
1The range of the last scale D8 does not span from 256 to 512 days; it is just slightly more than 256 days, based on the number of observations.
2The Morlet wavelet stands out as an excellent option for wavelet-based feature extraction, given its effective localization in both time and frequency domains. Additionally, Morlet
3See the phase difference circle presented in Appendix A.
4Appendix B explains how to correctly read the QQR plot.
References
1. Nandha M, Brooks R. Oil prices and transport sector returns: an international analysis. Rev Quantitative Finance Account (2009) 33:393–409. doi:10.1007/s11156-009-0120-4
2. Arouri MEH, Nguyen DK. Oil prices, stock markets and portfolio investment: evidence from sector analysis in Europe over the last decade. Energy policy (2010) 38(8):4528–39. doi:10.1016/j.enpol.2010.04.007
3. Xu B. Oil prices and UK industry-level stock returns. Appl Econ (2015) 47(25):2608–27. doi:10.1080/00036846.2015.1008760
4. Elyasiani E, Mansur I, Odusami B. Oil price shocks and industry stock returns. Energ Econ (2011) 33(5):966–74. doi:10.1016/j.eneco.2011.03.013
5. Aggarwal R, Akhigbe A, Mohanty SK. Oil price shocks and transportation firm asset prices. Energ Econ (2012) 34(5):1370–9. doi:10.1016/j.eneco.2012.05.001
6. Sadorsky P. Oil price shocks and stock market activity. Energ Econ (1999) 21(5):449–69. doi:10.1016/s0140-9883(99)00020-1
7. Narayan PK, Sharma SS. New evidence on oil price and firm returns. J Banking Finance (2011) 35(12):3253–62. doi:10.1016/j.jbankfin.2011.05.010
8. Kilian L, Park C. The impact of oil price shocks on the US stock market. Int Econ Rev (2009) 50(4):1267–87. doi:10.1111/j.1468-2354.2009.00568.x
9. Park J, Ratti RA. Oil price shocks and stock markets in the US and 13 European countries. Energ Econ (2008) 30(5):2587–608. doi:10.1016/j.eneco.2008.04.003
10. Kang W, Ratti RA, Yoon KH. The impact of oil price shocks on the stock market return and volatility relationship. J Int Financial Markets, Institutions Money (2015) 34:41–54. doi:10.1016/j.intfin.2014.11.002
11. Kang W, Ratti RA, Vespignani J. The impact of oil price shocks on the US stock market: a note on the roles of US and non-US oil production. Econ Lett (2016) 145:176–81. doi:10.1016/j.econlet.2016.06.008
12. Mahmoudi M, Ghaneei H. Detection of structural regimes and analyzing the impact of crude oil market on Canadian stock market: markov regime-switching approach. Stud Econ Finance (2022) 39(4):722–34. doi:10.1108/sef-09-2021-0352
13. Dhaoui A, Goutte S, Guesmi K. The asymmetric responses of stock markets. J Econ Integration (2018) 33(1):1096–140. doi:10.11130/jei.2018.33.1.1096
14. Reboredo JC, Rivera-Castro MA. Wavelet-based evidence of the impact of oil prices on stock returns. Int Rev Econ Finance (2014) 29:145–76. doi:10.1016/j.iref.2013.05.014
15. Bouri E. Return and volatility linkages between oil prices and the Lebanese stock market in crisis periods. Energy (2015) 89:365–71. doi:10.1016/j.energy.2015.05.121
16. Huang S, An H, Gao X, Huang X. Identifying the multiscale impacts of crude oil price shocks on the stock market in China at the sector level. Physica A: Stat Mech its Appl (2015) 434:13–24. doi:10.1016/j.physa.2015.03.059
17. Bašta M, Molnár P. Oil market volatility and stock market volatility. Finance Res Lett (2018) 26:204–14. doi:10.1016/j.frl.2018.02.001
18. Lin B, Su T. The linkages between oil market uncertainty and Islamic stock markets: evidence from quantile-on-quantile approach. Energ Econ (2020) 88:104759. doi:10.1016/j.eneco.2020.104759
19. Joo YC, Park SY. The impact of oil price volatility on stock markets: evidences from oil-importing countries. Energ Econ (2021) 101:105413. doi:10.1016/j.eneco.2021.105413
20. Liu Z, Shi X, Zhai P, Wu S, Ding Z, Zhou Y. Tail risk connectedness in the oil-stock nexus: evidence from a novel quantile spillover approach. Resour Pol (2021) 74:102381. doi:10.1016/j.resourpol.2021.102381
21. Fang S, Egan P. Measuring contagion effects between crude oil and Chinese stock market sectors. Q Rev Econ Finance (2018) 68:31–8. doi:10.1016/j.qref.2017.11.010
22. Yousfi M, Dhaoui A, Bouzgarrou H. Risk spillover during the COVID-19 global pandemic and portfolio management. J Risk Financial Manag (2021) 14(5):222. doi:10.3390/jrfm14050222
23. Wen F, Liu Z, Dai Z, He S, Liu W. Multi-scale risk contagion among international oil market, Chinese commodity market and Chinese stock market: a MODWT-Vine quantile regression approach. Energ Econ (2022) 109:105957. doi:10.1016/j.eneco.2022.105957
24. Fang T, Wang D, Lin Z, Wang X. Extreme risk measurement for the oil and China’s sectors system-network-based approach and machine learning methods. Front Phys (2023) 11:1292418. doi:10.3389/fphy.2023.1292418
25. Yousfi M, Farhani R, Bouzgarrou H. From the pandemic to the Russia–Ukraine crisis: dynamic behavior of connectedness between financial markets and implications for portfolio management. Econ Anal Pol (2024) 81:1178–97. doi:10.1016/j.eap.2024.02.001
26. Arouri MEH, Jouini J, Nguyen DK. On the impacts of oil price fluctuations on European equity markets: volatility spillover and hedging effectiveness. Energ Econ (2012) 34(2):611–7. doi:10.1016/j.eneco.2011.08.009
27. Sadorsky P. Modeling volatility and correlations between emerging market stock prices and the prices of copper, oil and wheat. Energ Econ (2014) 43:72–81. doi:10.1016/j.eneco.2014.02.014
28. Basher SA, Sadorsky P. Hedging emerging market stock prices with oil, gold, VIX, and bonds: a comparison between DCC, ADCC and GO-GARCH. Energ Econ (2016) 54:235–47. doi:10.1016/j.eneco.2015.11.022
29. Batten JA, Kinateder H, Szilagyi PG, Wagner NF. Hedging stocks with oil. Energ Econ (2021) 93:104422. doi:10.1016/j.eneco.2019.06.007
30. Chang BH, Sharif A, Aman A, Suki NM, Salman A, Khan SAR. The asymmetric effects of oil price on sectoral Islamic stocks: new evidence from quantile-on-quantile regression approach. Resour Pol (2020) 65:101571. doi:10.1016/j.resourpol.2019.101571
31. Managi S, Yousfi M, Zaied YB, Mabrouk NB, Lahouel BB. Oil price, US stock market and the US business conditions in the era of COVID-19 pandemic outbreak. Econ Anal Pol (2022) 73:129–39. doi:10.1016/j.eap.2021.11.008
32. Zhang W, Hamori S. Crude oil market and stock markets during the COVID-19 pandemic: evidence from the US, Japan, and Germany. Int Rev Financial Anal (2021) 74:101702. doi:10.1016/j.irfa.2021.101702
33. Heinlein R, Legrenzi GD, Mahadeo SM. Crude oil and stock markets in the COVID-19 crisis: evidence from oil exporters and importers. Q Rev Econ Finance (2021) 82:223–9. doi:10.1016/j.qref.2021.09.007
34. Sharif A, Aloui C, Yarovaya L. COVID-19 pandemic, oil prices, stock market, geopolitical risk and policy uncertainty nexus in the US economy: fresh evidence from the wavelet-based approach. Int Rev financial Anal (2020) 70:101496. doi:10.1016/j.irfa.2020.101496
35. Salisu AA, Ebuh GU, Usman N. Revisiting oil-stock nexus during COVID-19 pandemic: some preliminary results. Int Rev Econ Finance (2020) 69:280–94. doi:10.1016/j.iref.2020.06.023
36. Kumeka TT, Uzoma-Nwosu DC, David-Wayas MO. The effects of COVID-19 on the interrelationship among oil prices, stock prices and exchange rates in selected oil exporting economies. Resour Pol (2022) 77:102744. doi:10.1016/j.resourpol.2022.102744
37. Yousfi M, Bouzgarrou H. Geopolitical risk, economic policy uncertainty, and dynamic connectedness between clean energy, conventional energy, and food markets. Environ Sci Pollut Res (2023) 31:4925–45. doi:10.1007/s11356-023-31379-7
38. Basdekis C, Christopoulos A, Katsampoxakis I, Nastas V. The impact of the Ukrainian war on stock and energy markets: a wavelet coherence analysis. Energies (2022) 15(21):8174. doi:10.3390/en15218174
39. Cheikh NB, Zaied YB. Investigating the dynamics of crude oil and clean energy markets in times of geopolitical tensions. Energ Econ (2023) 124:106861. doi:10.1016/j.eneco.2023.106861
40. Adekoya OB, Asl MG, Oliyide JA, Izadi P. Multifractality and cross-correlation between the crude oil and the European and non-European stock markets during the Russia-Ukraine war. Resour Pol (2023) 80:103134. doi:10.1016/j.resourpol.2022.103134
41. Bagchi B, Paul B. Effects of crude oil price shocks on stock markets and currency exchange rates in the context of Russia-Ukraine conflict: evidence from G7 countries. J Risk Financial Manag (2023) 16(2):64. doi:10.3390/jrfm16020064
42. Hashmi SM, Ahmed F, Alhayki Z, Syed AA. The impact of crude oil prices on Chinese stock markets and selected sectors: evidence from the VAR-DCC-GARCH model. Environ Sci Pollut Res (2022) 29(35):52560–73. doi:10.1007/s11356-022-19573-5
43. Singhal S, Ghosh S. Returns and volatility linkages between international crude oil price, metal and other stock indices in India: evidence from VAR-DCC-GARCH models. Resour Pol (2016) 50:276–88. doi:10.1016/j.resourpol.2016.10.001
44. Ahmad W, Sadorsky P, Sharma A. Optimal hedge ratios for clean energy equities. Econ Model (2018) 72:278–95. doi:10.1016/j.econmod.2018.02.008
45. Kirkulak-Uludag B, Safarzadeh O. The interactions between OPEC oil price and sectoral stock returns: evidence from China. Physica A: Stat Mech Its Appl (2018) 508:631–41. doi:10.1016/j.physa.2018.02.185
46. BenMabrouk H, HadjMohamed W. Oil shocks and the volatility of BRICS and G7 markets: SVAR analysis. Cogent Econ Finance (2022) 10(1):2068241. doi:10.1080/23322039.2022.2068241
47. Arampatzidis I, Panagiotidis T. On the identification of the oil-stock market relationship. Econ Model (2023) 120:106157. doi:10.1016/j.econmod.2022.106157
48. Hashmi SM, Chang BH, Huang L, Uche E. Revisiting the relationship between oil prices, exchange rate, and stock prices: an application of quantile ARDL model. Resour Pol (2022) 75:102543. doi:10.1016/j.resourpol.2021.102543
49. Chang BH. Oil prices and E7 stock prices: an asymmetric evidence using multiple threshold nonlinear ARDL model. Environ Sci Pollut Res (2020) 27(35):44183–94. doi:10.1007/s11356-020-10277-2
50. Mokni K. A dynamic quantile regression model for the relationship between oil price and stock markets in oil-importing and oil-exporting countries. Energy (2020) 213:118639. doi:10.1016/j.energy.2020.118639
51. Naeem MA, Hasan M, Arif M, Balli F, Shahzad SJH. Time and frequency domain quantile coherence of emerging stock markets with gold and oil prices. Physica A: Stat Mech Its Appl (2020) 553:124235. doi:10.1016/j.physa.2020.124235
52. Jiang Z, Yoon SM. Dynamic co-movement between oil and stock markets in oil-importing and oil-exporting countries: two types of wavelet analysis. Energ Econ (2020) 90:104835. doi:10.1016/j.eneco.2020.104835
53. Zhang D. Oil shocks and stock markets revisited: measuring connectedness from a global perspective. Energ Econ (2017) 62:323–33. doi:10.1016/j.eneco.2017.01.009
54. Adekoya OB, Akinseye AB, Antonakakis N, Chatziantoniou I, Gabauer D, Oliyide J. Crude oil and Islamic sectoral stocks: asymmetric TVP-VAR connectedness and investment strategies. Resour Pol (2022) 78:102877. doi:10.1016/j.resourpol.2022.102877
55. Adekoya OB, Oliyide JA, Yaya OS, Al-Faryan MAS. Does oil connect differently with prominent assets during war? Analysis of intra-day data during the Russia-Ukraine saga. Resour Pol (2022) 77:102728. doi:10.1016/j.resourpol.2022.102728
56. Cui J, Goh M, Li B, Zou H. Dynamic dependence and risk connectedness among oil and stock markets: new evidence from time-frequency domain perspectives. Energy (2021) 216:119302. doi:10.1016/j.energy.2020.119302
57. Hussain M, Rehman RU. Volatility connectedness of GCC stock markets: how global oil price volatility drives volatility spillover in GCC stock markets? Environ Sci Pollut Res (2023) 30(6):14212–22. doi:10.1007/s11356-022-23114-5
58. Akkoc U, Civcir I. Dynamic linkages between strategic commodities and stock market in Turkey: evidence from SVAR-DCC-GARCH model. Resour Pol (2019) 62:231–9. doi:10.1016/j.resourpol.2019.03.017
59. Hu C, Liu X, Pan B, Chen B, Xia X. Asymmetric impact of oil price shock on stock market in China: a combination analysis based on SVAR model and NARDL model. Emerging Markets Finance and Trade (2018) 54(8):1693–705. doi:10.1080/1540496x.2017.1412303
60. Tarchella S, Dhaoui A. Chinese jigsaw: solving the equity market response to the COVID-19 crisis: do alternative asset provide effective hedging performance? Res Int Business Finance (2021) 58:101499. doi:10.1016/j.ribaf.2021.101499
61. Abdulkarim FM, Akinlaso MI, Hamid BA, Ali HS. The nexus between oil price and islamic stock markets in Africa: a wavelet and Multivariate-GARCH approach. Borsa Istanbul Rev (2020) 20(2):108–20. doi:10.1016/j.bir.2019.11.001
62. Mamipour S, Yazdani S, Sepehri E. Examining the spillover effects of volatile oil prices on Iran’s stock market using wavelet-based multivariate GARCH model. J Econ Finance (2022) 46(4):785–801. doi:10.1007/s12197-022-09587-7
63. Zaighum I, Aman A, Sharif A, Suleman MT. Do energy prices interact with global Islamic stocks? Fresh insights from quantile ARDL approach. Resour Pol (2021) 72:102068. doi:10.1016/j.resourpol.2021.102068
64. Wang KH, Su CW, Xiao Y, Liu L. Is the oil price a barometer of China’s automobile market? From a wavelet-based quantile-on-quantile regression perspective. Energy (2022) 240:122501. doi:10.1016/j.energy.2021.122501
65. Sim N, Zhou H. Oil prices, US stock return, and the dependence between their quantiles. J Banking Finance (2015) 55:1–8. doi:10.1016/j.jbankfin.2015.01.013
66. Bouri E, Gupta R, Tiwari AK, Roubaud D. Does Bitcoin hedge global uncertainty? Evidence from wavelet-based quantile-in-quantile regressions. Finance Res Lett (2017) 23:87–95. doi:10.1016/j.frl.2017.02.009
67. Mishra S, Sharif A, Khuntia S, Meo MS, Khan SAR. Does oil prices impede Islamic stock indices? Fresh insights from wavelet-based quantile-on-quantile approach. Resour Pol (2019) 62:292–304. doi:10.1016/j.resourpol.2019.04.005
68. Mo B, Chen C, Nie H, Jiang Y. Visiting effects of crude oil price on economic growth in BRICS countries: fresh evidence from wavelet-based quantile-on-quantile tests. Energy (2019) 178:234–51. doi:10.1016/j.energy.2019.04.162
69. Huo C, Hameed J, Sharif A, Albasher G, Alamri O, Alsultan N, et al. Recent scenario and nexus of globalization to CO2 emissions: evidence from wavelet and Quantile on Quantile Regression approach. Environ Res (2022) 212:113067. doi:10.1016/j.envres.2022.113067
70. Ren X, Li Y, Wen F, Lu Z. The interrelationship between the carbon market and the green bonds market: evidence from wavelet quantile-on-quantile method. Technol Forecast Soc Change (2022) 179:121611. doi:10.1016/j.techfore.2022.121611
71. Mestre R. A wavelet approach of investing behaviors and their effects on risk exposures. Financial Innovation (2021) 7(1):24–37. doi:10.1186/s40854-021-00239-z
72. Michis AA. Multiscale partial correlation clustering of stock market returns. J Risk Financial Manag (2022) 15(1):24. doi:10.3390/jrfm15010024
73. Athari SA, Hung NT. Time–frequency return co-movement among asset classes around the COVID-19 outbreak: portfolio implications. J Econ Finance (2022) 46(4):736–56. doi:10.1007/s12197-022-09594-8
74. Mestre R. Stock profiling using time–frequency-varying systematic risk measure. Financial Innovation (2023) 9(1):52. doi:10.1186/s40854-023-00457-7
75. Gençay R, Selçuk F, Whitcher BJ. An introduction to wavelets and other filtering methods in finance and economics. Amsterdam, Netherlands: Elsevier (2001).
76. Aguiar-Conraria L, Azevedo N, Soares MJ. Using wavelets to decompose the time–frequency effects of monetary policy. Physica A: Stat Mech its Appl (2008) 387(12):2863–78. doi:10.1016/j.physa.2008.01.063
77. Grinsted A, Moore JC, Jevrejeva S. Application of the cross wavelet transform and wavelet coherence to geophysical time series. Nonlinear Process Geophys (2004) 11(5/6):561–6. doi:10.5194/npg-11-561-2004
78. Torrence C, Compo GP. A practical guide to wavelet analysis. Bull Am Meteorol Soc (1998) 79(1):61–78. doi:10.1175/1520-0477(1998)079<0061:apgtwa>2.0.co;2
79. Addison PS. The illustrated wavelet transform handbook: introductorytheory and applications in science engineering, medicine and finance. Bristol: Institute of Physics Publishing (2002).
80. Bouzgarrou H, Ftiti Z, Louhichi W, Yousfi M. What can we learn about the market reaction to macroeconomic surprise? Evidence from the COVID-19 crisis. Res Int Business Finance (2023) 64:101876. doi:10.1016/j.ribaf.2023.101876
81. Yousfi M, Brahim M, Farhani S, Bouzgarrou H. Revisiting the relationship between business conditions, climate policy uncertainty, and environmental pollution: evidence from the USA. Environ Sci Pollut Res (2023) 30(41):94334–46. doi:10.1007/s11356-023-28869-z
82. Torrence C, Webster PJ. The annual cycle of persistence in the El Nino/Southern Oscillation. Q J R Meteorol Soc (1998) 124(550):1985–2004. doi:10.1256/smsqj.55009
83. Koenker R, Bassett G. Regression quantiles. Econometrica: J Econometric Soc (1978) 46:33–50. doi:10.2307/1913643
84. Raza SA, Zaighum I, Shah N. Economic policy uncertainty, equity premium and dependence between their quantiles: evidence from quantile-on-quantile approach. Physica A: Stat Mech its Appl (2018) 492:2079–91. doi:10.1016/j.physa.2017.11.125
85. Shahbaz M, Zakaria M, Shahzad SJH, Mahalik MK. The energy consumption and economic growth nexus in top ten energy-consuming countries: fresh evidence from using the quantile-on-quantile approach. Energ Econ (2018) 71:282–301. doi:10.1016/j.eneco.2018.02.023
86. Wu K, Zhu J, Xu M, Yang L. Can crude oil drive the co-movement in the international stock market? Evidence from partial wavelet coherence analysis. North Am J Econ Finance (2020) 53:101194. doi:10.1016/j.najef.2020.101194
87. Torun E, Chang TP, Chou RY. Causal relationship between spot and futures prices with multiple time horizons: a nonparametric wavelet Granger causality test. Res Int Business Finance (2020) 52:101115. doi:10.1016/j.ribaf.2019.101115
88. Yousfi M, Zaied YB, Cheikh NB, Lahouel BB, Bouzgarrou H. Effects of the COVID-19 pandemic on the US stock market and uncertainty: a comparative assessment between the first and second waves. Technol Forecast Soc Change (2021) 167:120710. doi:10.1016/j.techfore.2021.120710
89. Yousfi M, Bouzgarrou H. Financial contagion among stock markets and portfolio risk during the COVID-19 crisis. Int J Monetary Econ Finance (2023) 16(2):121–38. doi:10.1504/ijmef.2023.10055427
90. Yousfi M, Zaied YB, Tliche Y. US stock market and cryptocurrencies during the COVID-19 pandemic outbreak. In: Crises and uncertainty in the economy. Singapore: Springer Nature Singapore (2023). p. 171–86.
91. Amar AB, Belaid F, Youssef AB, Chiao B, Guesmi K. The unprecedented reaction of equity and commodity markets to COVID-19. Finance Res Lett (2021) 38:101853. doi:10.1016/j.frl.2020.101853
92. Shahzad SJH, Nor SM, Kumar RR, Mensi W. Interdependence and contagion among industry-level US credit markets: an application of wavelet and VMD based copula approaches. Physica A: Stat Mech its Appl (2017) 466:310–24. doi:10.1016/j.physa.2016.09.008
Appendix A Phase difference circle [90]
Appendix B Explanation of how to correctly read the QQ 3D plot, as outlined by [64]
• The color bar indicates the degree and sign of correlation, with yellow and blue representing higher and weaker correlations, respectively.
• The z-axis presents slope coefficient β1 (
• The x-axis displays the
• The y-axis corresponds to the
Keywords: oil prices, oil uncertainty, US equities, wavelet analysis, quantile-on-quantile regression
Citation: Yousfi M and Bouzgarrou H (2024) On the linkage of oil prices and oil uncertainty with US equities: a combination analysis based on the wavelet approach and quantile-on-quantile regression. Front. Phys. 12:1357366. doi: 10.3389/fphy.2024.1357366
Received: 18 December 2023; Accepted: 28 February 2024;
Published: 14 March 2024.
Edited by:
Matthieu Garcin, Pôle Universitaire Léonard de Vinci, FranceReviewed by:
Roman Mestre, Université de Montpellier, FranceStephan Bales, University of Hohenheim, Germany
Copyright © 2024 Yousfi and Bouzgarrou. This is an open-access article distributed under the terms of the Creative Commons Attribution License (CC BY). The use, distribution or reproduction in other forums is permitted, provided the original author(s) and the copyright owner(s) are credited and that the original publication in this journal is cited, in accordance with accepted academic practice. No use, distribution or reproduction is permitted which does not comply with these terms.
*Correspondence: Mohamed Yousfi, yousfimohamed128@gmail.com