 Shixin Peng
 Xiaoshu Wang
 Gui Jin
 Feng Wang2
 Rui Xu
- 1Department of Neurosurgery, The First Affiliated Hospital of Chongqing Medical University, Chongqing, China
- 2College of Biomedical Engineering, Third Military Medical University, Army Medical University, Chongqing, China
- 3Department of Radiology, Chongqing Red Cross Hospital, Jiangbei District People’s Hospital, Chongqing, China
Introduction: Current detection of intracerebral hemorrhage (ICH), whether employing Electrical Capacitance Tomography (ECT) or other electrical imaging techniques, rely on time-difference measurements. The time-difference methods necessitate baseline measurements from the patient in a non-hemorrhagic state, which is impractical to obtain, rendering rapid detection of ICH unfeasible.
Methods: This study introduces a novel approach that capitalizes on the distinct dispersion characteristics of the permittivity in brain tissue and the spectral variance of the permittivity between blood and other brain components. Specifically, the frequency-dependent variations in the permittivity are employed to achieve absolute detection of ICH, thereby eliminating the need for non-hemorrhagic baseline data. The methodology entails identification of two frequency points that the frequency-dependent variation in the permittivity at these two frequency points manifest the maximal difference between blood and other brain tissues. Subsequently, this permittivity differential at the two identified frequency points is utilized for hemorrhage detection. Experimental measurements were conducted using an impedance analyzer and a parallel plate capacitor to capture the capacitance in four single-component substances—distilled water, sheep blood, isolated pig fat, and isolated pig brain—as well as three mixed blood compounds—distilled water enveloping sheep blood, pig fat encapsulating sheep blood, and pig brain surrounding sheep blood—across a frequency range of 10 kHz to 20 MHz.
Results: The results show that in different frequency bands, it is indeed possible to distinguish single-component substances from mixed substances by the frequency difference of capacitance variation. Comparative analysis reveals that the 1 MHz to 5 MHz frequency range is most effective for detecting blood in distilled water. For blood detection in pig fat, a 10 kHz to 1 MHz frequency range is identified as optimal, while a 10 kHz to 0.5 MHz frequency range is advantageous for blood detection in pig brain tissue.
Discussion: The findings confirm that absolute detection of ICH is achievable through frequency-dependent variations in the permittivity. However, this necessitates the identification of the frequency band manifesting the largest difference of frequency-dependent variation between single-component and mixed substances. The study acknowledges limitations primarily due to the use of anticoagulant-altered sheep blood, which exhibits permittivity divergent from those of natural blood. Additionally, the in vitro pig fat and pig brain samples, having been subjected to freeze-thaw cycles, also demonstrate permittivity unrepresentative of in vivo tissue.
Introduction
Intracerebral hemorrhage (ICH) is an acute cerebrovascular disorder precipitated by the rupture of cerebral vessels, leading to blood accumulation within the brain parenchyma [1]. Characterized by rapid onset and elevated mortality, ICH poses a significant public health concern. Among cerebrovascular events, it is second only to ischemic stroke in incidence, with a rate of 12–15 cases per 100,000 person-years [2]. In Western countries, ICH comprises approximately 15% of all stroke cases, whereas in China, this figure varies between 18% and 47% [3]. The ailment exhibits a substantial 30-day mortality rate of 35%–52%. Moreover, a mere 20% of affected individuals regain self-care capabilities within a 6-month period, thereby exerting a considerable socioeconomic burden. ICH can be classified into primary and secondary types; primary ICH accounts for 80%–85% of all instances and is predominantly associated with hypertension, thereby termed as hypertensive intracerebral hemorrhage. Presently, China’s hypertensive population approximates 245 million, establishing hypertension as the principal risk factor for ICH [4]. Timely identification and intervention are pivotal for enhancing therapeutic success and postoperative outcomes. For cases with minimal bleeding and relative clinical stability, intervention within 6 hours post-onset is recommended. In contrast, for cases with extensive bleeding and critical status, emergency intervention within 1 hour is imperative. Currently, computed tomography (CT) scanning is considered the diagnostic gold standard for ICH. However, substantial delays occur in the period between patient transport to the hospital, CT examination, and the receipt of diagnostic results. These delays often lead to a missed therapeutic window for effective ICH treatment. Furthermore, the bulky nature of existing diagnostic equipment precludes its use for pre-hospital triage and bedside monitoring. Consequently, there is an urgent need for a portable, cost-effective, non-invasive, and rapid detection technology for ICH.
The detection of ICH using the electrical characteristics of biological tissues is a new type of measurement technology, especially represented by Electrical Impedance Tomography (EIT) and Magnetic Induction Tomography (MIT) [5, 6]. Studies on the permittivity of brain tissues have indicated a significantly higher permittivity for blood compared to other cerebral constituents. Specifically, at a frequency of 1 MHz, the permittivity values for blood, gray matter, and cerebrospinal fluid are 3,000, 990, and 108, respectively [7]. Although permittivity across all brain tissues declines as frequency increases, blood consistently exhibits elevated permittivity levels. Therefore, theoretically, monitoring alterations in cerebral permittivity offers a more effective approach to ICH detection. Electrical Capacitance Tomography (ECT) serves as a technique to map the permittivity distribution within an object, reliant on multi-electrode capacitance measurements. Originally developed for applications in oil industry multiphase flow measurements and fluidized bed evaluations within the pharmaceutical sector [8, 9], ECT has demonstrated promise in ICH detection. In prior experiments, a parallel-plate capacitor was employed to directly measure capacitance changes within the brain due to hemorrhage. Animal experiments revealed a positive correlation between injected blood volume and induced cerebral capacitance alterations [10]. Subsequently, a 16-channel ECT system was developed and successfully utilized for in vitro imaging of hemorrhagic events within porcine cerebral tissue [11].
The outcomes of these experiments substantiate the feasibility of utilizing capacitance changes in brain tissue as a marker for the detection of ICH. While the latter experiment successfully employed ECT for in vitro ICH imaging, the methodology was reliant on time-difference imaging. Specifically, this involved subtracting reference data obtained prior to the hemorrhagic event from post-bleed measurements, an approach commonly employed in contemporary electrical imaging modalities [12, 13]. However, this time-difference detection strategy necessitates baseline measurements from the patient prior to the onset of ICH, which is operationally challenging. As such, this method is unsuitable for rapid ICH detection and is limited to monitoring temporal variations in ICH. To achieve rapid ICH detection, it is imperative to obtain absolute distribution data, akin to the information provided by CT and MRI. Traditional electrical imaging faces several limitations in this context. First, the subtle differences in permittivity between ICH-affected tissue and normal brain tissue are difficult to discern, particularly given the diminutive volume of ICH relative to overall brain tissue. Consequently, the weak electrical or magnetic signals emitted from hemorrhagic regions are often masked by signals from other normal brain tissues, thereby complicating the separation of weak ICH signals from dominant background signals [14]. Second, the sensitivity of traditional electrical imaging techniques for biological tissue detection is markedly inferior to that of CT and MRI. These challenges collectively hinder the application of traditional electrical imaging for the acquisition of absolute ICH distribution within the brain, relegating it to the role of monitoring dynamic ICH changes over time.
Due to the dispersion characteristics inherent in biological tissues, they exhibit varying electrical properties across different frequencies [15]. Gabrel et al. assessed the electrical conductivity and permittivity distribution of diverse brain tissues within the frequency range of 10 Hz–20 GHz [16]. The findings revealed that although the permittivity of all brain tissues decreases with increasing frequency, the rate of this decrease varies among tissues and frequency bands. Importantly, the permittivity of blood consistently surpassed that of other brain tissues across all frequencies, displaying a larger range of change in specific frequency bands. Consequently, these changes of permittivity with frequency can be harnessed for the detection of ICH. To address the limitations of time-difference methods, the current study employed a parallel plate capacitor coupled with an impedance analyzer. This configuration facilitated the measurement of capacitance distribution in both blood and normal brain tissue, within a frequency span of 10 kHz–20 MHz. The measured capacitance is proportional to the permittivity of the substance under test. The objective was to identify a frequency band where the difference of permittivity frequency change between ICH-affected and normal brain tissues is maximized. Subsequently, capacitance changes in this identified frequency band were analyzed for both ICH and non-ICH models. The aim was to evaluate the feasibility of leveraging these differences for ICH detection. To validate the applicability of this approach, the permittivity frequency spectrum of various substances—namely distilled water, sheep blood, pig fat, and pig brain—was measured. Utilizing the frequency-dependent differences in permittivity, we conducted assessments on three distinct models: blood suspended in distilled water, blood encased in pig fat, and blood embedded in pig brain. The results of these experiments are expected to corroborate the viability of this frequency-specific detection method for ICH.
Methods and materials
Capacitance measurement system based on a parallel plate capacitor
The measurement system for the capacitance is shown in Figure 1, including a parallel plate capacitor and a 4294A impedance analyzer manufactured by Agilent. The capacitor employs two identical copper foils, each with a thickness of 0.1 mm, affixed to the exterior of a 3D-printed, cuboid-shaped barrel. Specific dimensions of the capacitor are presented in Figure 2. The electrodes measure 50 mm × 50 mm, with an inter-electrode distance of 44 mm and a barrel wall thickness of 2 mm. Connection wires are soldered centrally to each plate and subsequently interfaced with the measurement fixture of the impedance analyzer. The Agilent 4294A impedance analyzer operates within a test frequency range of 40 Hz–110 MHz and utilizes four-port measurement technology. This facilitates the assessment of impedance parameters such as resistance, inductance, and capacitance with a test accuracy up to 0.05% [17]. A 16047E two-port fixture, specifically designed for dual-port component parameter measurement, is used as the measurement fixture. During the evaluation, the subject under investigation is positioned between the two plates of the parallel plate capacitor. According to Figure 2, let the capacitance between the two plates be C, then:
where εr is the equivalent permittivity of the contents between the two plates, ε0 is the vacuum permittivity, S and d are the surface area of the plate and the distance between the two plates respectively. Given constant plate area and distance, capacitance is directly proportional to the relative permittivity of the material situated between the plates. Thus, the capacitance values obtained from this parallel plate capacitor system serve as reliable metrics for gauging the permittivity of the examined material.
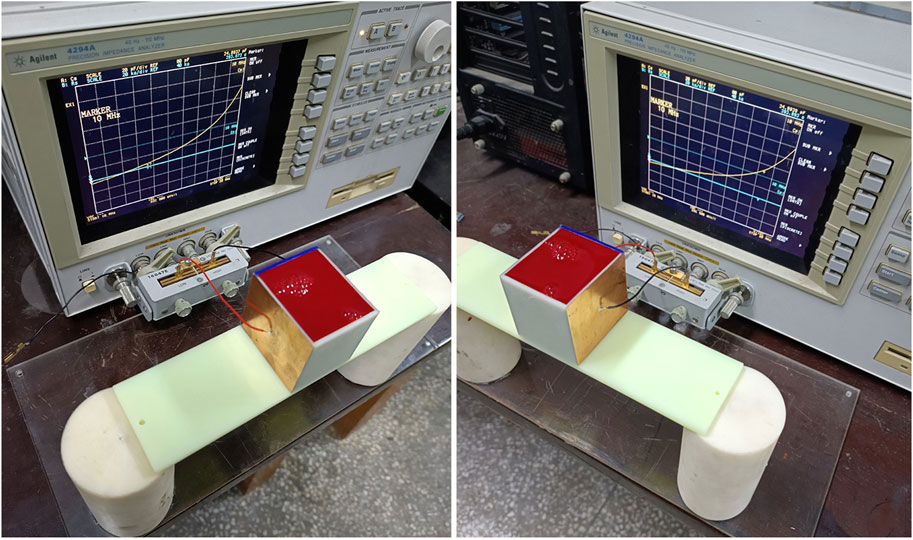
FIGURE 1. Capacitance measurement system based on a parallel plate capacitor.
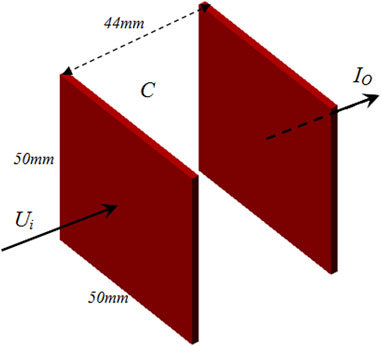
FIGURE 2. Schematic diagram of the parallel plate capacitor.
Capacitance frequency sweep measurements of single-component substance
The previously described parallel plate capacitor measurement system was employed to conduct frequency-dependent capacitance measurements on four single-component substances: distilled water, anticoagulant-treated sheep blood, pig fat, and pig brain. These substances were placed in the 3D-printed cuboid barrel shown in Figure 1, which has dimensions of 50 mm × 44 mm × 50 mm and a wall thickness of 2 mm. Photographic evidence of these measurements is provided in Figure 3. For the substances in liquid form, namely, water and blood, the barrel was filled to capacity. Solid pig fat was acquired commercially and cut into a cuboid measuring 46 mm × 40 mm × 50 mm before placement in the measurement barrel. Pig brain was gently stacked and compressed to fill the barrel. The fresh sheep blood was purchased from Alibaba’s Taobao shopping app, and the seller has a license to sell animal blood. Fresh pig brain was purchased from Wal-Mart Supermarket in Chongqing. Fresh pig brain is a kind of fresh ingredient in China that can be freely bought and sold without ethical certification.
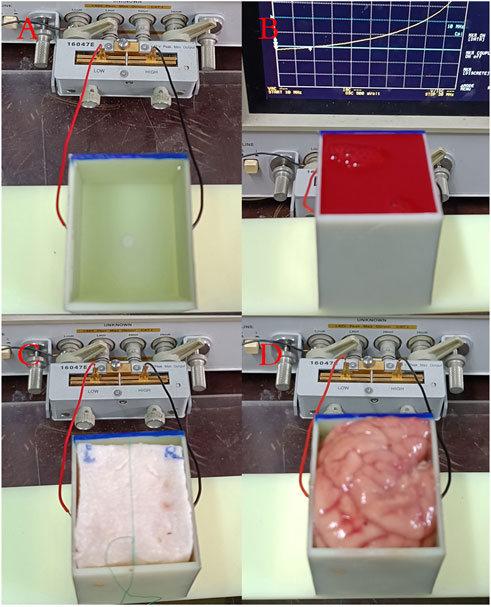
FIGURE 3. Measurement photos of four single-component substances. (A) Distilled water. (B) Sheep blood. (C) Pig fat. (D) Pig brain.
The impedance analyzer was configured with a frequency measurement range of 10 KHz–20 MHz. Measurement parameters were set to series capacitance, the data collection points were set at 150, and the accuracy level was maximized. For each substance, the measurement protocol involved initially filling the barrel and executing a single frequency sweep measurement with the impedance analyzer. Subsequently, the barrel was emptied and another measurement was taken. The data from these two steps were then subtracted to derive the change in capacitance (∆C) at each frequency point. This procedure was repeated thrice for each substance to calculate the average ∆C at each frequency point. The four substances were evaluated in a sequential manner, adhering to the outlined protocol.
Capacitance frequency sweep measurements of mixed substances containing blood
Capacitance frequency sweep measurements were conducted on mixtures of blood with distilled water, pig fat, and pig brain, in accordance with the method delineated in Section 2. Photographic documentation of these experiments is presented in Figure 4. For the water-blood mixture (A), a needle tube with a 15 mm diameter (needle head removed) was positioned centrally within the distilled water. Sheep blood was then introduced into this tube until it reached the same height as the surrounding distilled water. For the fat-blood combination (B), a cylindrical hole with a 15 mm diameter was carved into the center of the cuboid pig fat sample and subsequently filled with sheep blood. Finally, in the brain-blood model (C), a 15 mm diameter needle tube was inserted centrally into the pig brain, and sheep blood was injected until the blood level equated that of the surrounding pig brain tissue. The measurement protocol remained consistent with that described in Section 2, thus ensuring uniformity in data acquisition across different experimental setups.
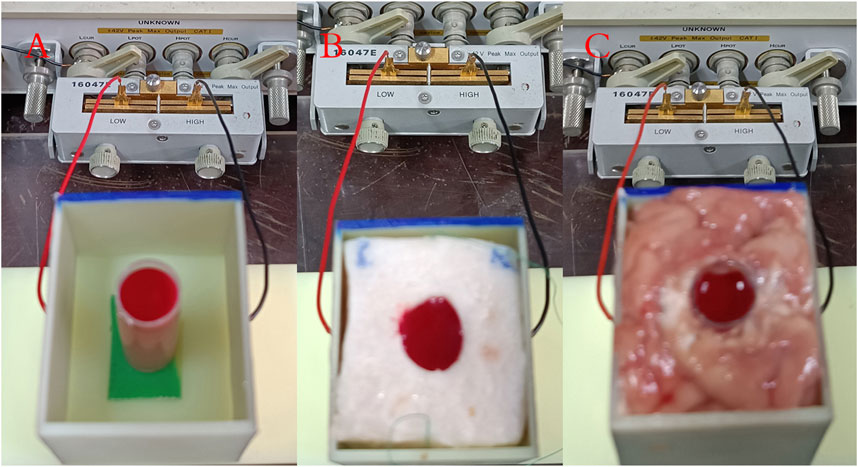
FIGURE 4. Measurement photos of three mixed blood substance models. (A) Water-blood mixture. (B) Fat-blood combination. (C) Brain-blood model.
Results and discussions
Capacitance sweep measurement results of single-component substance
Figure 5 presents the results of raw ∆C measurements across three frequency ranges—10 KHz–1 MHz (A), 1 MHz–10 MHz (B), and 10 MHz–20 MHz (C)—for distilled water, sheep blood, pig fat, and pig brain. Subfigures D, E, and F depict normalized data of the raw data in A, B, and C, scaled to the initial frequency data.
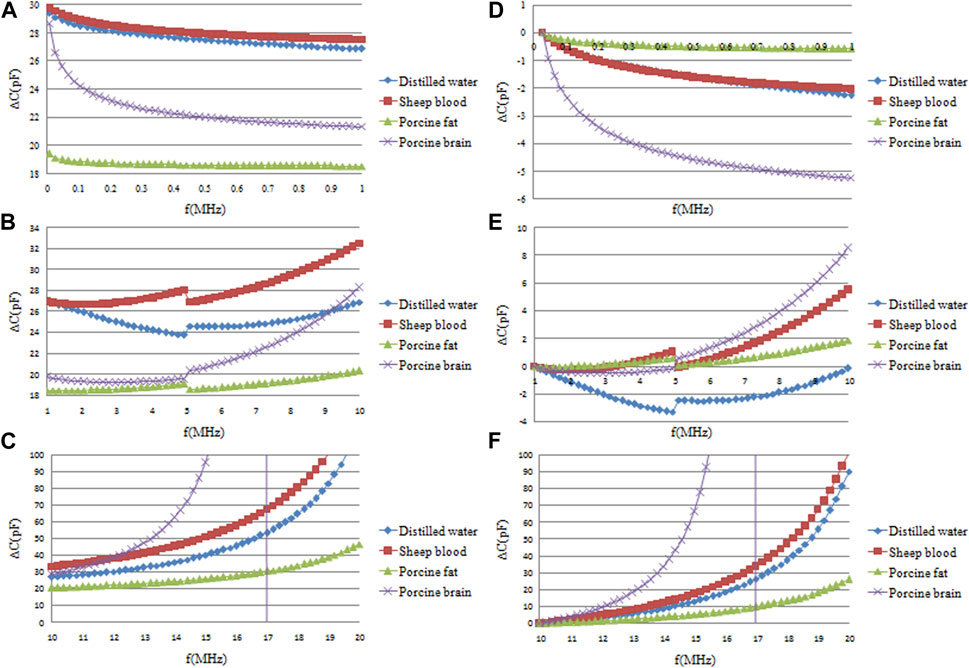
FIGURE 5. Frequency sweep measurement results of capacitance changes (∆C) of four single-component substances: distilled water, sheep blood, pig fat and pig brain. (A, B, C) are the original ∆C in the three frequency ranges of 10 KHz–1 MHz, 1 MHz–10 MHz and 10 MHz–20 MHz, respectively. (D, E, F) are the normalized data of the original data in (A, B, C) relative to the ∆C data of the initial frequency.
In the 10 KHz–1 MHz frequency range (A), the greatest ∆C is observed in sheep blood, followed by distilled water, with the smallest ∆C seen in pig fat. These results indicate a marginally higher permittivity for sheep blood relative to distilled water. This observation deviates from existing literature, which can be attributed primarily to the dilution effect of the added heparin sodium anticoagulant in the sheep blood used, bringing its permittivity closer to that of a liquid medium.
Moreover, both pig brain and pig fat exhibited smaller permittivity than water. This reduction is ascribed to the pre-experimental conditions—namely, the freezing and subsequent thawing of these tissues, leading to a significant incorporation of melted ice water, thereby diminishing the permittivity.
Analysis of A and D reveals that, within the frequency range of 10 KHz–1 MHz, the most pronounced decrement in ∆C is seen in pig brain, followed by distilled water and blood. Pig fat exhibits negligible frequency-dependent change, as indicated by an almost horizontal trend line. Consequently, while the difference in this frequency range between distilled water and blood is negligible, distinctions between blood, pig fat, and pig brain are readily discernible.
Analysis of data sets B and E indicates a discernible discontinuity at approximately 5 MHz across all four substances under investigation. Upon measuring the impedance of an unoccupied parallel plate capacitor, this irregularity was identified to emanate from a circuit resonance at around 5 MHz, resulting from the capacitance of the parallel plate capacitor and the circuit’s parasitic inductance. In the 1 MHz–5 MHz frequency window, the ∆C of blood exhibits a gradual increase, whereas that of distilled water shows a decline; the changes for pig fat and pig brain are inconsequential in this range. Thus, differentiation between distilled water and blood becomes feasible in this specific frequency domain. The 5 MHz–10 MHz frequency span sees a general upward trend in ∆C for all substances. Pig brain registers the most significant increment, followed by blood. Distilled water’s ∆C remains virtually static initially but starts ascending after surpassing the 8 MHz threshold. Data sets C and F provide insights into the 10 MHz–20 MHz range. In this frequency span, pig brain’s ∆C skyrockets, eventually surpassing that of blood and inducing a new circuit resonance around 15 MHz. Across this frequency range, all substances exhibit a positive correlation between frequency and ∆C, albeit at varying magnitudes. Specifically, the values for blood and distilled water closely align, while pig fat shows the least amplitude variation. The data corroborate that the ∆C fluctuations differ among the four substances depending on the frequency range in question. Accordingly, frequency intervals manifesting the most substantial divergences may be leveraged for the effective discrimination of these substances.
However, the measurement results given in Figure 5 seems to be different from the data in Ref. [16]. According to the results in Ref. [16], the permittivity of blood and other brain tissues decrease gradually with increasing frequency. However, Figure 5 shows that the measurement results of blood, pig fat and pig brain all increase with increasing frequency in the 1 MHz–20 MHz frequency range. This is mainly because the measurement results in Figure 5 are the capacitance values, but the data in Ref. [16] are the permittivity values. Although it was mentioned earlier that the capacitance of a parallel plate capacitor is directly proportional to the dielectric constant of the material between the plates, this is conditional and only applies to low-frequency electrostatic fields. Therefore, in the frequency range of 10 kHz to 1 MHz, as shown in Figures 5A, D, the capacitance changes of the blood, pig fat, and pig brain—indeed decrease with increasing frequency. However, at higher frequencies, the impact of stray inductance and capacitance in the measuring circuit becomes more significant, and the capacitance measured by the impedance analyzer then shows certain discrepancies from the dielectric constant. Particularly when the frequency increases to a certain value, the entire measuring circuit undergoes resonance, as evidenced by the resonance occurring around 5 MHz in Figure 5B. After resonance, the direction of capacitance change measured also varies. Although at high frequencies, the capacitance measured by the impedance analyzer differs from the permittivity of the material being tested, this discrepancy is consistent across all materials tested. Therefore, the capacitance measured by the impedance analyzer and the parallel plate capacitor can be used to assess the differences in the permittivity of different materials.
Capacitance sweep measurement results of three kinds of mixed blood substances
The ∆C measurement results for both pure distilled water and its mixtures with blood are illustrated in Figure 6. Subsets A, B, and C depict raw ∆C measurement data across three frequency bands: 10 KHz–1 MHz, 1 MHz–10 MHz, and 10 MHz–20 MHz. D, E, and F represent the normalized versions of these data, scaled to the initial frequency ∆C. Data sets A and D indicate that both solutions display almost the same ∆C variations across the 10 KHz–1 MHz frequency range, rendering the identification of blood presence in distilled water challenging at these lower frequencies. In contrast, subsets B and E, which focus on the 1 MHz–5 MHz range, demonstrate a decreasing trend in ∆C as frequency escalates. Importantly, the magnitude of this decrement differs significantly between the two solutions. Specifically, the ∆C changes within the 1 MHz–5 MHz frequency range are quantified as 3.287 ± 0.11pF and 4.275 ± 0.18 pF for the two solutions, as shown in Figure 7. This implies that the blood-induced increment in the ∆C decrement is approximately 30% of that observed in pure distilled water, a differential that is easy to detect. Lastly, subsets C and F, which encompass the 10 MHz–20 MHz frequency range, reveal an increasing trend in ∆C for both solutions. However, the magnitude of this increase is largely comparable, resulting in closely aligned values. Upon a comprehensive analysis of the data, it can be concluded that the most favorable frequency domain for the differentiation of blood presence in distilled water lies between 1 MHz and 5 MHz.
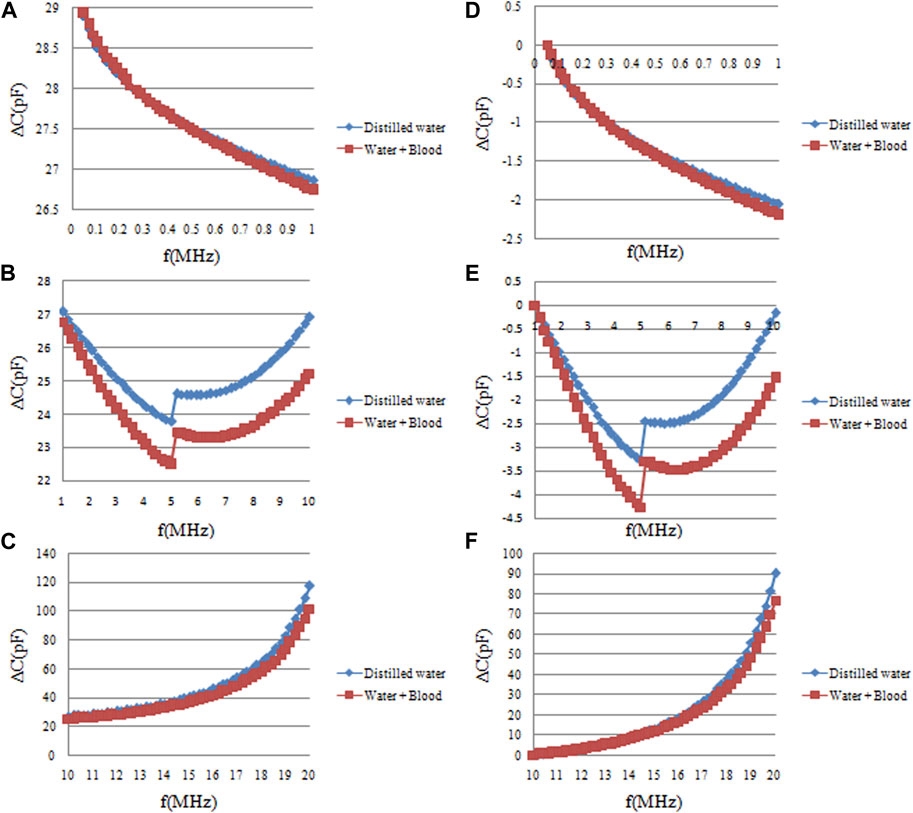
FIGURE 6. The frequency sweep measurement results of capacitance changes (∆C) of pure distilled water and distilled water mixed blood. (A, B, C) are the original ∆C measurement data in the three frequency ranges of 10 KHz–1 MHz, 1 MHz–10 MHz, and 10 MHz–20 MHz, respectively. (D, E, F) are the normalized data of the original data in (A, B, C) relative to the data of the initial frequency of each frequency band.
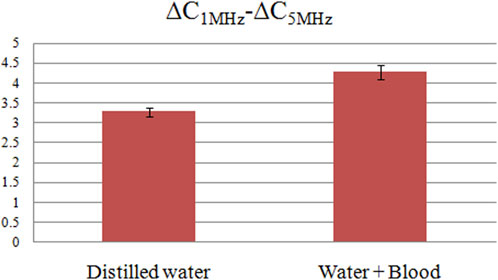
FIGURE 7. The ∆C differences between 1 MHz and 5 MHz for pure distilled water and distilled water mixed blood solution.
There is a aberration in the results shown in Figure 6. The results in Figure 5 indicates that the ∆C measurement results of pure sheep blood is larger than that of pure distilled water. So the permittivity of a water-blood solution should be greater than that of distilled water alone theoretically, but the results presented in Figure 6 show the opposite. The reason lies in the methodology described in the article: as shown in Figure 4A, the water-blood solution was not created by directly dissolving blood in water. Instead, the blood was first placed in a plastic tube, which was then placed in distilled water. Thus, there was a plastic film (1 mm thick) separating the blood from the distilled water. This plastic tube effectively isolates the distilled water and blood, acting as a capacitor. Although the dielectric constant of the plastic tube is very low, at higher frequencies, its capacitive effect becomes quite significant, thereby altering the overall capacitance value of the distilled water-blood solution.
The ∆C measurement results across various frequency bands for pure fat and fat-encapsulated blood are shown in Figure 8. Subsets A, B, and C are the raw ∆C measurement data in the frequency bands of 10 KHz–1 MHz, 1 MHz–10 MHz, and 10 MHz–20 MHz, respectively. D, E, and F represent the normalized data, scaled according to the initial frequency-specific ∆C. Subsets A and D reveal that in the 10 KHz–1 MHz frequency domain, both substances exhibit a declining trend in ∆C as frequency escalates. However, the magnitude of this decline differs substantially between the two, with a more pronounced decrement evident upon blood addition. Quantitative data, elaborated in Figure 9, establish ∆C changes for these substances in the 10 KHz–1 MHz range as 0.577 ± 0.041pF and 0.670 ± 0.036pF, respectively. The blood-induced augmentation in ∆C decline constitutes 16% of that of the pure fat, a differential that is discernible. In the 1 MHz–10 MHz frequency band, represented by subsets B and E, the differential in ∆C changes between the substances is marginal. While a larger ∆C change in the fat-encapsulated blood model is observed within the 5 MHz–10 MHz subset, the differential is not markedly pronounced. Subsets C and F, capturing data in the 10 MHz–20 MHz band, indicate almost identical ∆C changes between the substances, negating the possibility of discerning blood presence in fat at these frequencies. A holistic analysis suggests that the 10 KHz–1 MHz frequency range is the most efficacious for detecting the presence of blood in pig fat through frequency differential analysis.
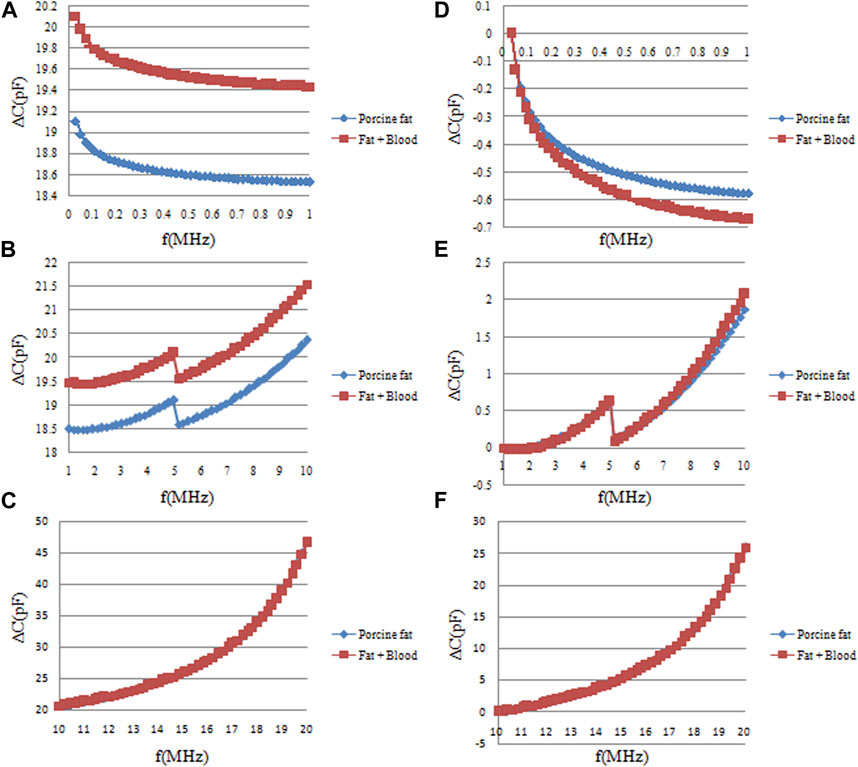
FIGURE 8. The frequency sweep measurement results of capacitance changes (∆C) of pure fat and fat-wrapped blood. (A, B, C) are the original ∆C measurement data in the three frequency ranges of 10 KHz–1 MHz, 1 MHz–10 MHz, and 10 MHz–20 MHz, respectively. (D, E, F) are the normalized data of original data in (A, B, C) relative to the data of the initial frequency of each frequency band.
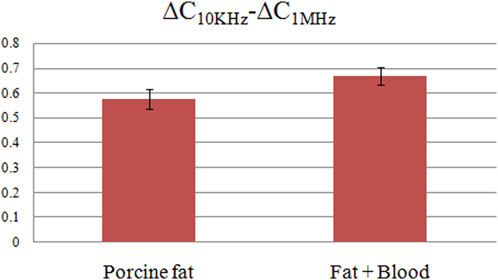
FIGURE 9. The ∆C differences between 10 KHz and 1 MHz for pure pig fat and pig fat wrapped blood.
The ∆C measurement results for both pure pig brain and blood-infused pig brain are shown in Figure 10. Subsets A, B, and C represent the raw ∆C measurement data across three distinct frequency bands: 10 KHz–1 MHz, 1 MHz–10 MHz, and 10 MHz–20 MHz. Subsets D, E, and F provide normalized data corresponding to the raw measurements in A, B, and C, scaled relative to the initial frequency data. Within the 10 KHz–1 MHz range, subsets A and D indicate a frequency-dependent decrease in ∆C for both pure pig brain and blood-infused pig brain. However, the magnitude of this decline differs between the two, with a more modest reduction observed post-blood infusion. This observation is corroborated by frequency sweep data of pure pig brain and pure blood depicted in Figure 5; within the same frequency range, the rate of ∆C decline in pure pig brain substantially exceeds that of pure blood. Consequently, the introduction of blood into the pig brain reduces the overall decline in ∆C, yet this alteration does not impede its detect ability. Figure 10 subsets A and D further reveal relatively large difference of ∆C decline between the two materials in the 10 KHz–0.5 MHz range, but negligible difference in the 0.5 MHz–1 MHz range. These quantitative differences are documented in Figure 11, with values of 4.576 ± 0.12pF and 4.048 ± 0.05pF, respectively. Therefore, the reduced ∆C decline due to the infusion of blood represents 11.5% of the ∆C decline observed in pure pig brain, a difference that remains within detectable limits. Subsets B and E indicate almost the same ∆C fluctuations in the frequency band of 1 MHz–10 MHz for two materials. Subsets C and F delineate that within the frequency range of 10 MHz–15 MHz, the divergence in ∆C fluctuations between pure pig brain and blood-infused pig brain remains minimal. It should be noted that at approximately 16 MHz, the measurement circuit exhibited resonance, a factor which necessitates consideration in future experimental setups. Continuing from the previous data analysis, Upon aggregating the data, it is concluded that the most effective frequency domain for ascertaining the presence of blood in pig brain is between 10 KHz and 0.5 MHz. However, within this specified range, the decrease in ∆C decline due to blood infusion amounts to only 11.5% of the ∆C decline observed in the pure pig brain. This percentage is markedly lower than the 16% registered in pig fat and the 30% observed in distilled water, as per previous studies. Hence, the task of detecting blood in pig brain via frequency-dependent capacitance changes proves more challenging compared to the other models.
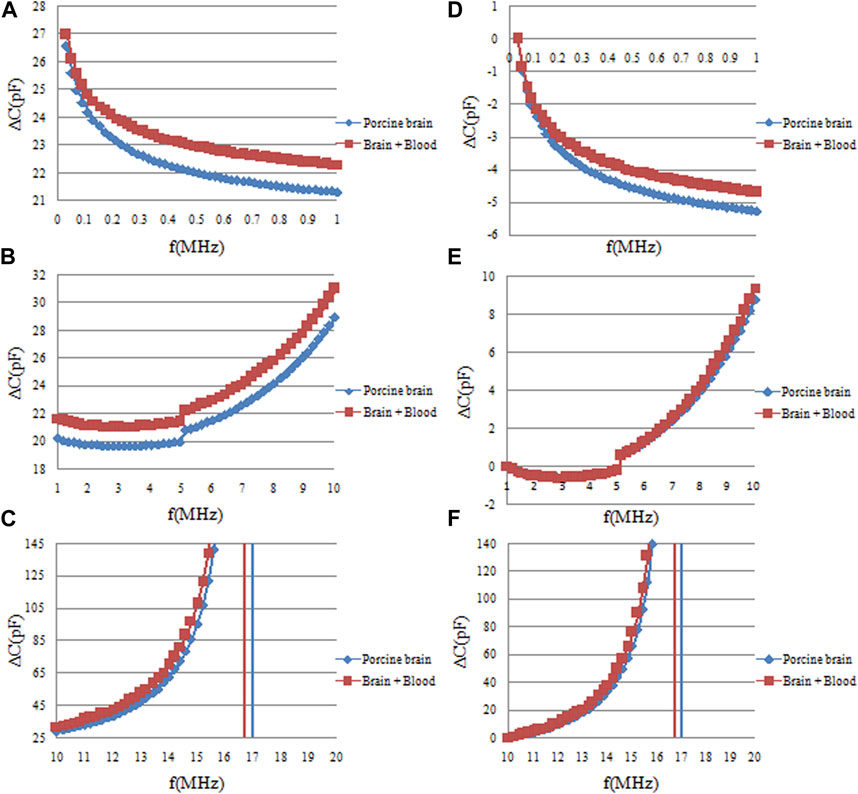
FIGURE 10. The frequency sweep measurement results of capacitance changes (∆C) of pure pig brain and pig brain wrapped blood. (A, B, C) are the original ∆C measurement data in the three frequency ranges of 10 KHz–1 MHz, 1 MHz–10MHz, and 10 MHz–20 MHz, respectively. (D, E, F) are the normalized data of the original data in (A, B, C) relative to the data of the initial frequency of each frequency band.
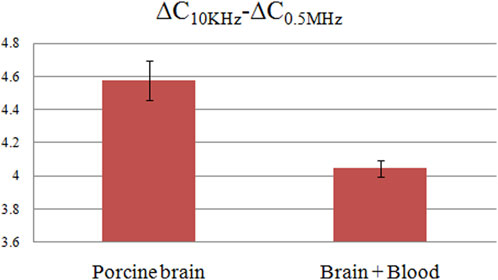
FIGURE 11. The ∆C differences between 10 KHz and 0.5 MHz for pure pig brain and pig brain wrapped blood.
Conclusion
At present, whether ECT or other electrical imaging, ICH can only be detected by time-difference measurements. Such an approach necessitates baseline, non-hemorrhagic measurements data from the patient, which is often impracticable to acquire in a clinical setting. To address this shortfall, the present study advocates for the utilization of frequency-dependent permittivity variations as an alternative modality for the absolute identification of ICH. This strategy leverages the distinct dispersion properties of the permittivity in brain tissue, along with the spectral disparity in permittivity between blood and other cerebral tissues. Notably, this frequency-based approach obviates the need for non-hemorrhagic reference data. It mandates only the acquisition of measurement data at specific frequency points post-hemorrhage, thereby rectifying the limitations inherent to time-difference imaging techniques. Initial steps in this method involve identifying two critical frequency points at which the permittivity frequency difference of blood and surrounding brain tissues exhibit maximum variations. Subsequently, the differential permittivity at these frequencies are employed to detect ICH. In the scope of this paper, the capacitance variations of four individual substances and three composite materials were quantified using an impedance analyzer in conjunction with a parallel plate capacitor.
The study confirms that distinct frequency bands can effectively discriminate between single-component and mixed substances based on variations in capacitance with frequency. Comparative analysis reveals that the frequency range between 1 MHz and 5 MHz is most efficacious for the detection of blood in distilled water. For the identification of blood in pig fat, the optimal frequency range is between 10 KHz and 1 MHz. When isolating blood within pig brain tissue, the frequency range of 10 KHz to 0.5 MHz demonstrates optimal results. Thus, the study establishes that the absolute detection of ICH is feasible through frequency-differential measurements of the permittivity. Nonetheless, this research is not without limitations. The sheep blood used in the experiments of this paper was diluted with sodium heparin anticoagulant, resulting in its permittivity being significantly lower than in vivo blood, only slightly higher than that of water. This was proven in our preliminary experiments. The use of such treated blood was a necessary compromise, as fresh blood coagulates very quickly. The pig fat and pig brain used in the experiments were also previously frozen in a refrigerator. Before the experiments, they were thawed out, and during this process, melting ice water was also mixed in. Therefore, the permittivity of these ex vivo pig fat and pig brain tissues differs greatly from that of in vivo tissues. The primary objective of this paper was to verify the feasibility of using the frequency differences in permittivity to detect cerebral hemorrhage. Therefore, we initially conducted verification through experiments with ex vivo tissues, with plans to validate further through in vivo animal experiments in the later stages. Additionally, there is a divergence in the capacitance sweep measurements obtained in this study compared to those reported in existing literature. This discrepancy can be largely attributed to the measurement circuitry. The parallel plate capacitor, along with parasitic inductance within the circuit, manifests varying impedances at different frequencies, leading to resonance at specific frequencies.
Data availability statement
The raw data supporting the conclusion of this article will be made available by the authors, without undue reservation.
Author contributions
SP: Investigation, Methodology, Writing–original draft. XW: Data curation, Formal Analysis, Investigation, Methodology, Resources, Software, Writing–original draft. GJ: Conceptualization, Methodology, Supervision, Writing–review and editing. FW: Conceptualization, Resources, Supervision, Visualization, Writing–review and editing. JZ: Data curation, Supervision, Validation, Writing–review and editing. XZ: Supervision, Validation, Visualization, Writing–review and editing. NL: Conceptualization, Funding acquisition, Methodology, Project administration, Writing–review and editing. RX: Funding acquisition, Methodology, Writing–review and editing.
Funding
The author(s) declare financial support was received for the research, authorship, and/or publication of this article. This work was supported by the 2023 Chongqing Technology Innovation and Application Development Special Science and Technology Assistance to Tibet and Xinjiang Project (CSTB2023TIAD-KPX0001), and 2023 Natural Science Foundation of Xizang Autonomous Region [XZ2023ZR-ZY67 (Z)].
Conflict of interest
The authors declare that the research was conducted in the absence of any commercial or financial relationships that could be construed as a potential conflict of interest.
Publisher’s note
All claims expressed in this article are solely those of the authors and do not necessarily represent those of their affiliated organizations, or those of the publisher, the editors and the reviewers. Any product that may be evaluated in this article, or claim that may be made by its manufacturer, is not guaranteed or endorsed by the publisher.
References
1. Neurology CSO, Society CS. Chinese guidelines for diagnosis and treatment of cerebral venous thrombosis 2019 (2020). doi:10.3760/cma.j.cn113694-20200225-00113
2. Thrift AG, Thayabaranathan T, Howard G, Howard VJ, Rothwell PM, Feigin VL, et al. Global stroke statistics[J]. Int J Stroke: official J Int Stroke Soc (2017) 12:13–32. doi:10.1177/1747493016676285
3. Wang L, Liu J, Yang G, Peng B, Wang Y. The prevention and treatment of stroke in China is still facing great challenges—summary of China Stroke Prevention report 2018. Chin Circ J (2019) 34(02):6–20.
4. Cheng J, Wang W, Xu J, Yin L, Liu Y, Wu J. Trends in Stroke Mortality Rate-China, 2004–2019[J]. Chinese Center for Disease Control and Prevention Weekly Report (2022) (024):004.
5. Bodenstein M, David M, Markstaller K. Principles of electrical impedance tomography and its clinical application. Crit Care Med (2010) 37(2):713–24. doi:10.1097/ccm.0b013e3181958d2f
6. Griffiths H. Magnetic induction tomography. Meas Sci Techn (2001) 12:1126–31. doi:10.1088/0957-0233/12/8/319
7. Sasaki K, Wake K, Watanabe S Development of best fit Cole-Cole parameters for measurement data from biological tissues and organs between 1 MHz and 20 GHz. Radio ence (2015) 49(7):459–72. doi:10.1002/2013RS005345
8. Warsito W, Marashdeh Q, Fan LS. Electrical capacitance volume tomography. IEEE Sensors J (2007) 7(4):525–35. doi:10.1109/jsen.2007.891952
9. Wang H, Yang W. Application of electrical capacitance tomography in pharmaceutical fluidised beds – a review. Chem Eng Sci (2020) 231:116236. doi:10.1016/j.ces.2020.116236
10. Bai Z, Li H, Chen J, Zhuang W, Li G, Chen M, et al. Research on the measurement of intracranial hemorrhage in rabbits by a parallel-plate capacitor. PeerJ (2021) 9(99):e10583. doi:10.7717/peerj.10583
11. Xu R, Zhuang W, Bai Z, Wang F, Jin G, Liu N, et al. A pilot study on intracerebral hemorrhage imaging based on electrical capacitance tomography. Front Phys (2023) 3(11). doi:10.3389/fphy.2023.1165727
12. Chen Q, Liu R, Wang C, Liu RJMS Real-time in vivo magnetic induction tomography in rabbits: a feasibility study. Meas Sci Technol (2020) 32(3):035402. doi:10.1088/1361-6501/abc579
13. Holder D, Saulnier G. Electrical impedance tomography methods history and applications series in medical Physics and biomedical engineering by david holder. England, UK: Routledge (2020).
14. Watson SR, Williams JW, Gough A, Griffiths H. A magnetic induction tomography system for samples with conductivities below 10 S m−1. Meas Sci Techn (2008) 19(4):045501. doi:10.1088/0957-0233/19/4/045501
15. Malikov V, Tihonsky NN, Kozlova DV, Ishkov AV. Computer-aided study of the impedance dispersion of biological tissues. J Phys Conf Ser (2021) 2142:012012. doi:10.1088/1742-6596/2142/1/012012
16. Gabriel S, Lau RW, Gabriel S, Lau RW. The dielectric properties of biological tissues: II. Measurements in the frequency range 10 Hz to 20 GHz. Phys Med Biol (1996) 41:2251–69. doi:10.1088/0031-9155/41/11/002
Keywords: intracerebral hemorrhage, ECT, permittivity, frequency-differential, capacitance
Citation: Peng S, Wang X, Jin G, Wang F, Zhu J, Zhang X, Liu N and Xu R (2023) Study on detection of intracerebral hemorrhage based on frequency difference of permittivity. Front. Phys. 11:1333185. doi: 10.3389/fphy.2023.1333185
Received: 04 November 2023; Accepted: 23 November 2023;
Published: 19 December 2023.
Edited by:
Guanqiu Qi, Buffalo State College, United StatesReviewed by:
Yiyao An, Chongqing University of Posts and Telecommunications, ChinaShuai Zhou, Kunming University of Science and Technology, China
Dahong Gao, henna finance university, China
Copyright © 2023 Peng, Wang, Jin, Wang, Zhu, Zhang, Liu and Xu. This is an open-access article distributed under the terms of the Creative Commons Attribution License (CC BY). The use, distribution or reproduction in other forums is permitted, provided the original author(s) and the copyright owner(s) are credited and that the original publication in this journal is cited, in accordance with accepted academic practice. No use, distribution or reproduction is permitted which does not comply with these terms.
*Correspondence: Nan Liu, natasha0902@sina.com; Rui Xu, xurui203389@hospital.cqmu.edu.cn
†These authors have contributed equally to this work