A compact portable photoacoustic sensor for sub-ppm level SO2 detection with a DUV-LED and a non-resonant photoacoustic cell
 Yujing Jing
 Chaofan Feng1,2
  Lei Dong
 Hongpeng Wu
- 1State Key Laboratory of Quantum Optics and Quantum Optics Devices, Institute of Laser Spectroscopy, Shanxi University, Taiyuan, China
- 2Collaborative Innovation Center of Extreme Optics, Shanxi University, Taiyuan, China
A photoacoustic module based on a novel 273 nm deep-ultraviolet light-emitting diode (DUV-LED) was developed for sulfur dioxide (SO2) detection. The DUV-LED with an emission angle of 60° emitted a power of 10 mW. A high-sensitivity non-resonant photoacoustic cell with a gas chamber volume of only 0.39 mL was introduced to reduce the thermal noise generated by the contact of scattered DUV light with the photoacoustic cell. Assembly of the DUV-LED with the non-resonant photoacoustic cell resulted in a robust and portable photoacoustic module without any moving parts. The minimum detection limit of 725 ppb was achieved with 1s integration time at room temperature and atmospheric pressure. Furthermore, the photoacoustic module performance was evaluated in terms of DUV modulation frequency, linearity and the long-term stability.
1 Introduction
Sulfur dioxide (SO2) is a colorless yet vexatious gas that exerts a potent toxic impact on the respiratory system. It has the potential to induce respiratory tract inflammation, acute poisoning, bronchitis, asthma, emphysema, and even fatality. Moreover, SO2 can infiltrate the human body through skin pores or the digestive tract via food and beverages, thereby posing a significant health hazard. Upon reacting with water vapor, SO2 generates sulfuric acid fog, a form that is approximately tenfold more toxic than gaseous SO2. This haze can persist in the atmosphere for extended durations and descend to the ground through precipitation, inducing the occurrence of acid rain. As a common industrial gas pollutant, SO2 emitted mainly from thermal power plants, non-ferrous metal smelters, sulfuric acid plants, and industrial boilers and stoves fueled by coal or oil [1, 2]. As industrial modernization advances and living standards elevate, the demand for oil and coal fuels is on the rise. Hence, within sectors like secure manufacturing, especially during furnace desulfurization procedures, monitoring SO2 concentrations and diligently curbing pollutant discharges are imperative. This approach aligns with the escalating demand for a salubrious living environment. Therefore, in industries like secure manufacturing, especially during furnace desulfurization procedures, monitoring the concentration of SO2 [3] are imperative. As a result, the development of a portable, real-time, and high-sensitivity SO2 gas concentration sensor is of great significance.
In recent years, numerous optical methods have been employed for SO2 detection, including differential optical absorption spectroscopy (DOAS) [4], photoacoustic spectroscopy (PAS) [5–8], fluorescence spectroscopy [9], and Fourier transform infrared spectroscopy (FTIR) [10]. Out of these methods, absorption spectroscopy stands out due to its benefits of rapid response time, uncomplicated structure, and elevated accuracy. These attributes have contributed to its extensive utilization in gas pollutant emission detection. Photoacoustic spectroscopy (PAS) technology is a variant of laser absorption spectroscopy [11, 12]. When the gas to be measured is irradiated by a laser, its molecules undergo a transition from the ground state to the excited state. Due to the inherent instability of the excited state, the molecules return to the ground state by non-radiative transition, releasing energy in the process. By modulating the frequency of the laser, the gas molecules cyclically absorb and release energy, thereby generating acoustic waves. These acoustic signals are collected and analyzed by a microphone to invert the concentration of the gas being measured. PAS technology not only inherits all the merits of laser absorption spectroscopy but also features advantages such as signal amplitude directly proportional to laser intensity and absence of wavelength selectivity. Consequently, this technology has garnered increasing attention in recent years [13–19].
In 2014, Waclawek et al. [20] developed a quartz-enhanced PAS (QEPAS)-based sensor system for SO2 detection by using a mid-infrared distributed feedback quantum cascade (DFB-QCL) operating at 7.24 μm, and a minimum detection limit of 63 ppb was achieved. In 2020, Yin et al. [21] proposed a method for detecting ppb-level SO2 using a 7.41 μm external cavity quantum cascade laser as a light source, 2.45 ppb detection limit was achieved. However, the cost of the sensor system is increased due to the expense of light sources in the mid-infrared band. The HITRAN database reveals that sulfur dioxide gas molecules exhibit heightened absorption in the ultraviolet band in comparison to the near-infrared band [22]. This disparity imparts a more cost-efficient edge to ultraviolet band light sources. In 2005, Somesfalean et al. [23] applied a tunable ultraviolet laser, emitting between 302 nm and 303 nm with an output of 6.9 mW, for SO2 detection. The detection limit measured at atmospheric pressure was 20 ppm. However, the size of the ultraviolet laser results in the bulk of the gas sensor. Additionally, ultraviolet laser typically possesses larger divergence angles, thus necessitating optical systems to achieve collimation of the light. These optical collimation systems further increase the overall device size, imposing greater constraints on the widespread deployment of associated sensors. In the PAS detection system, the volume of the non-resonant photoacoustic cell is smaller than that of the resonant photoacoustic cell, making the corresponding gas detection platform easy to carry [24, 25]. This makes it a good choice for reducing the overall size of the detection device.
In recent years, owing to advancements in UV-LED technology [26], opting for Deep Ultraviolet Light-Emitting Diodes (DUV-LEDs) as excitation light sources holds the potential to diminish both the comprehensive expense and volume of photoacoustic sensor systems. To address the challenge posed by the excessive divergence angle of LED light sources and the difficulty in achieving optical collimation, we have devised a high signal-to-noise ratio non-resonant photoacoustic cell. In contrast to resonant photoacoustic cells, the non-resonant photoacoustic cell detects planar waves, obviating the requirement for beam shaping and resulting in a significantly smaller volume compared to resonant photoacoustic cells. Consequently, a compact, inexpensive, and highly sensitive non-resonant photoacoustic (PAS) gas sensor with a commercial DUV-LED was developed in this manuscript.
2 Selection of SO2 detection wavelength and excitation light source
According to the HITRAN database, SO2 gas exhibits a high absorption intensity in some range, as shown in Figure 1 [27]. The absorption line intensity of the gas at DUV is two orders of magnitude stronger than at Mid-IR. This indicates that using laser wavelengths at DUV as the excitation light source for photoacoustic signal can enhance the sensitivity limitation of the device. The inset of the Figure 1 presents the absorption spectrum of the gas in the DUV region, where the red line denotes the wavelength of the DUV-LED utilized in this experiment. In the application field, H2S is commonly present in environments where SO2 is found. Therefore, when selecting spectral lines, we considered the influence of H2S on SO2 detection. The excitation light source employed in this study coincides precisely with the gas’s highly absorptive region, within this absorption region, the excitation light source exhibits absorption levels for H2S, H2O, and CO2 two orders of magnitude lower than that for SO2, effectively avoiding interference from H2S and atmospheric constituents such as H2O and CO2. Therefore, for this experiment, a DUV-LED lamp bead (LS10QAA) with a central wavelength of 273 nm was selected as the excitation light source. The spectral characteristics of the DUV-LED was measured by AvaSpec-2048 spectrometer, as shown in Figure 2. The FWHM (Full Width at Half Maximum) of the absorption line was 11 nm, which region corresponding to the gray section in the inset of Figure 1.
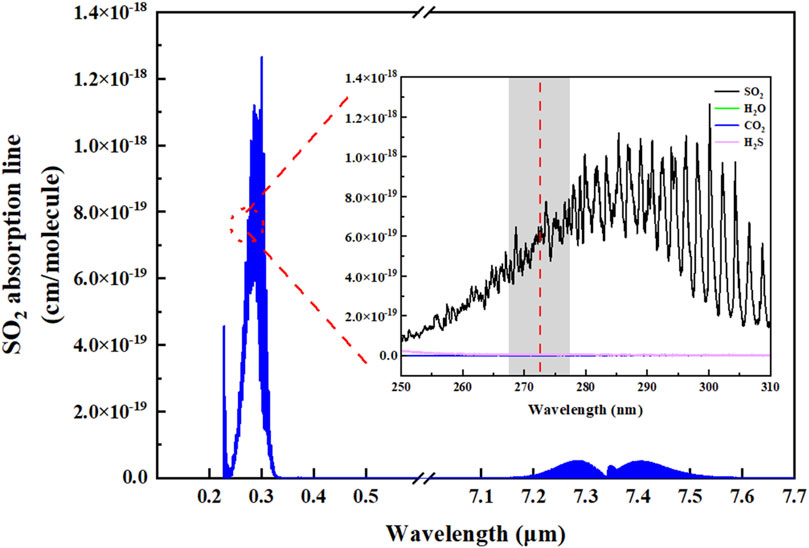
FIGURE 1. Absorption line intensity of SO2 in deep ultraviolet and mid-infrared region. Inset: Absorption spectrum of SO2, H2O, CO2, and H2S gas in the ultraviolet (250 nm–310 nm) band.
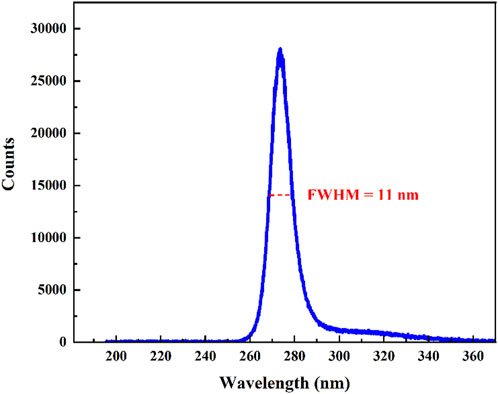
FIGURE 2. DUV-LED spectral characteristics.
The pictures of the lamp bead were shown in the inset of the Figure 3A. It confers a multitude of advantages, encompassing cost-effectiveness, diminished size, energy efficiency, and user-friendly operation. Figure 3A elucidates the interrelation between the operational current and the emitted wavelength of the excitation light source at different operating temperatures. Figure 3B demonstrates the correlation between the operational current and the output power of the excitation light source. The figure displays that the maximum output power of the excitation light source reaches 10 mW when operated at a current of 150 mA. When the operating current is below 100 mA, different ambient temperatures can lead to variations in the laser wavelength output from the DUV-LED. Although the temperature-induced changes in the optical wavelength are less than 1 nm, due to the varying absorption line intensities of the gas at different wavelengths, measurement inaccuracies can still occur. Therefore, in this study, the DUV-LED’s operating current was set at 150 mA. This ensures not only a stable laser output wavelength from the LED but also aids in achieving higher output power.
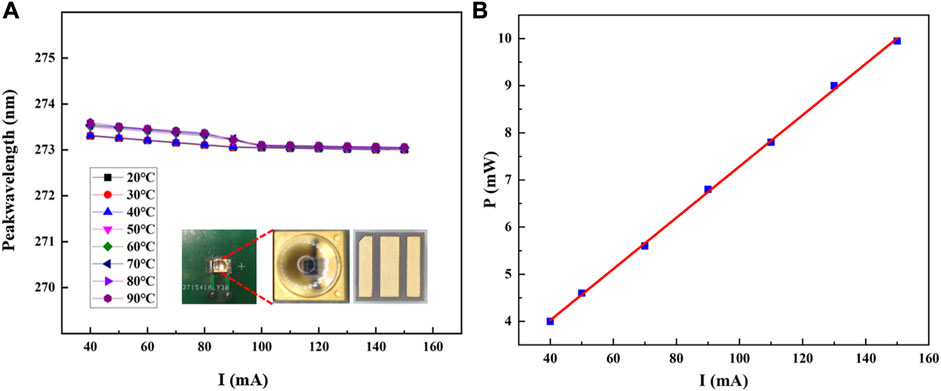
FIGURE 3. (A) Diagram of the relationship between operating current and emission wavelength of excitation light source at different ambient temperatures. Inset: Physical diagram of the excitation light source; (B) Diagram of the operating current and output power of the excitation light source.
3 Design of photoacoustic detection module
The reported in the literature for measuring SO2 using photoacoustic spectroscopy typically employ resonant photoacoustic cells to achieve higher detection sensitivity and immunity to environmental noise [20, 23, 28]. However, for the development of low-cost portable SO2 detectors, non-resonant photoacoustic cells offer distinct advantages. Firstly, non-resonant photoacoustic cells do not require the fulfillment of resonance conditions, thereby eliminating the need for precise optical systems to match specific frequencies. This reduces the complexity and cost of system design. Furthermore, since the operation of non-resonant photoacoustic cells is not contingent upon resonance conditions, they generate signals at any position where light is absorbed, mitigating noise caused by light absorption at the cell walls. Therefore, leveraging the characteristics of DUV-LED, this paper designs and fabricates a compact, high signal-to-noise ratio non-resonant photoacoustic cell.
For non-resonant photoacoustic cells, the noise caused by absorption in the photoacoustic cell wall is directly proportional to the surface area of the cell structure [29]. Therefore, a larger surface area results in greater noise generation. To address this, the photoacoustic cell structure was designed as a cylinder since cylinders have smaller surface areas compared to other volume shapes, thereby reducing noise [30]. The photoacoustic signal is produced by the absorption of a periodically modulated light beam. When the light beam is incident on PAC, the gas molecules absorb the modulated light energy, forming a thermal power source
According to Eq. 1, the radius among the structural parameters (length and radius) of the photoacoustic cell affects the magnitude of the photoacoustic signal in the non-resonant photoacoustic cell. The photoacoustic signal will decrease as the radius of the photoacoustic cell increases. However, when the radius is too small, the additional noise introduced by the photoacoustic cell wall through light absorption will increase. Therefore, this paper selects a cylindrical non-resonant photoacoustic cell with an inner cavity radius of 2.5 mm.
As shown in the Figure 4, as the radius of the photoacoustic cell decreases, the amplitude of the photoacoustic signal gradually increases. Reducing the radius is advantageous for enhancing the photoacoustic signal, thereby improving the gas detection performance of the sensor. However, excessively small radius can lead to increased excitation light losses at the cell walls. By taking into account both the excitation amplitude of the photoacoustic signal and the losses incurred by the excitation light at the cell walls, the diameter of the photoacoustic cell was determined to be 5 mm. In addition, for the non-resonant photoacoustic cell, the relationship between the amplitude of the photoacoustic signal and the length of the non-resonant cavity is given by Eq. 1. In order to maximize the intensity of the photoacoustic signal while maintaining a relatively small sensor volume and rapid gas equilibrium, the length of the photoacoustic cell was chosen as 20 mm.
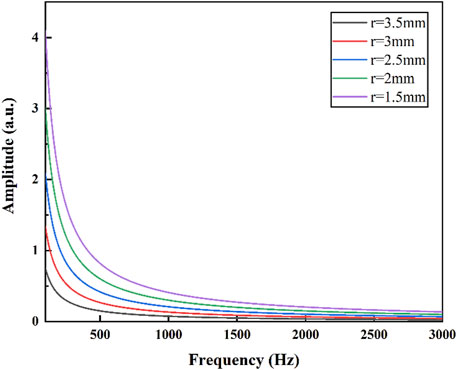
FIGURE 4. The relationship between the photoacoustic signals excited at different radius and frequency.
Furthermore, to minimize light loss and noise due to the absorption of the photoacoustic cell wall, the interior of the non-resonant photoacoustic cell was polished. Additionally, the non-resonant photoacoustic cell was sealed with a pair of calcium fluoride (CaF2) windows. This not only ensures the efficient transmission of ultraviolet light into the non-resonant photoacoustic cell but also prevents the internal acoustic waves from dissipating outward.
The structural diagram and the photograph of the non-resonant photoacoustic cell were presented in Figures 5A,B, respectively. As shown in the figures, the sample gas can enter and exit the non-resonant photoacoustic cell through designated inlet and outlet of the cell. Since acoustic waves in the non-resonant photoacoustic cell do not resonate to produce standing waves, it is necessary to ensure the sealed condition of the non-resonant photoacoustic cell during measurements. Therefore, two solenoid valves are respectively installed at the inlet and outlet positions of the gas path to control the circulation and closure of gases inside and outside the non-resonant photoacoustic cell. Additionally, for the purpose of researching the effects of gas flow velocity and pressure on SO2 sensor performance, a gas mass flow meter and a pressure controller are linked to the ends of the solenoid valves, as shown in Figure 6. It should be noted that the gas mass flow meter and pressure controller can be removed after completing the optimization study of the apparatus performance, ensuring overall convenience, low power consumption, and cost-effectiveness of the sensor.
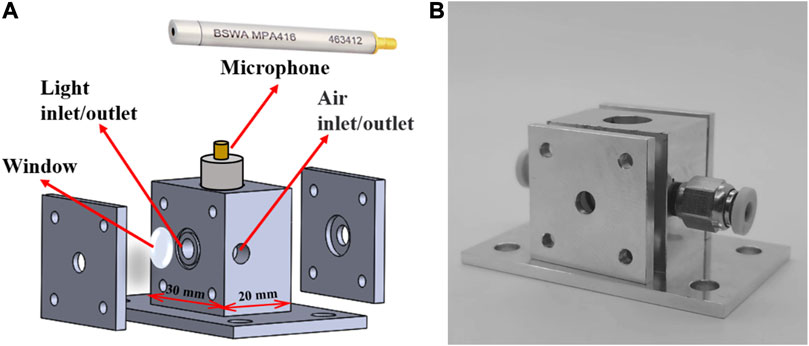
FIGURE 5. (A) Non-resonant photoacoustic cell structure; (B) Physical diagram of the non-resonant photoacoustic cell.
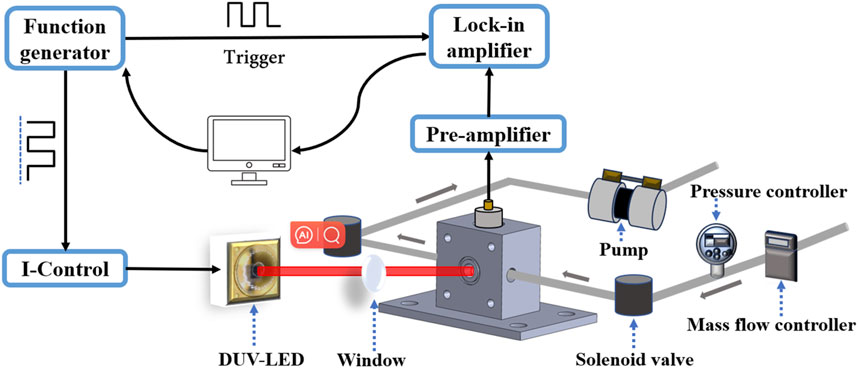
FIGURE 6. Schematic diagram of the sulfur dioxide gas photoacoustic sensor system.
4 Construction of sensing system
Figure 6 depicts the experimental setup of the photoacoustic sensor system employed for the detection of SO2 gas. The experimental platform comprises various components, including a function generator (Tektronix, Inc. Model AFG 3022), a current controller (ILX Lightwave LDX-3232), DUV-LED lamp beads (LS10QAA), a non-resonant photoacoustic cell, a microphone (MPA410), and a lock-in amplifier (Stanford Research Systems Model SR830). The DUV-LED driving current consists of an offset current and a modulation current. When the driving current exceeds 40 mA, the DUV-LED starts emitting light; conversely, when it's below 40 mA, the DUV-LED turns off. Exploiting its intrinsic property, DUV-LED intensity modulation can be achieved by controlling the driving current. The DUV-LED offset current and the modulation current with a square signal and 50% duty cycle was produced by the same function generator. The injection current was modulated between 30 mA and 150 mA with a fixed frequency. The total output power of the DUV-LED is 10 mW. After processes such as focusing and transmission during the experiment, the power that actually interacts with the gas is approximately 5 mW.
Additionally, the function generator produces a TTL synchronization signal, which serves as the reference signal for the lock-in amplifier. Experimental investigations demonstrate that under ambient conditions, the chip temperature of the DUV-LED remains below 50 C even after prolonged continuous operation. Figure 3A reveal that at operating currents exceeding 100 mA, the wavelength emitting from DUV-LED remains constant despite temperature variations. As a result, the developed SO2 sensor does not incorporate temperature sensing and control components. This further ensures the compactness and cost-effectiveness of the sensor design.
The highly sensitive microphone, continuously installed at the central position of the sidewall of the non-resonant photoacoustic cell, converts the detected acoustic wave signal into a weak electrical signal, which is then externally output via the electrodes at the end of the microphone. The collected weak signal is then amplified by the preamplifier before being inputted into the lock-in amplifier for demodulation. The time constant and filter slope of the lock-in amplifier were set to 1 s and 12 dB/otc, corresponding to a detection bandwidth of 0.25 Hz. The demodulated signal was recorded by a computer and the data was processed with a LabView software program.
5 Optimization and testing of sensing system
In comparison to the resonant photoacoustic cell, a notable characteristic of the non-resonant photoacoustic cell is its broader response bandwidth. However, there is a significant variation in response levels to acoustic signals of different frequencies for the non-resonant photoacoustic cell. To achieve optimal detection performance, it is imperative to experimentally ascertain the optimal response frequency of the custom-designed non-resonant photoacoustic cell proposed in this study. The plot of modulation frequency versus SNR was measured at room temperature and atmospheric pressure, as shown in Figure 7. The non-resonant photoacoustic cell was filled with a volume concentration of 50 ppm of SO2 as the target gas. The modulation frequency of the excitation light source was changed by varying the frequency of the square wave output signal of the function generator. The results indicated that the sensor’s SNR was optimal at a modulation frequency of 6 Hz. Hence, the modulation frequency of the DUV-LED was configured at 6 Hz in the following optimizing experiments.
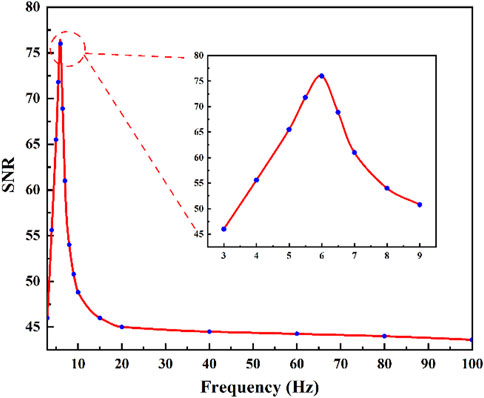
FIGURE 7. Response relationship between SNR and laser modulation frequency of SO2 gas photoacoustic sensor.
6 Results and discussion
To evaluate the SO2 photoacoustic sensor’s detection performance, a gas mixer was used to create different concentrations of SO2 gas ranging from 10 ppm to 50 ppm. These gases were sequentially introduced into the non-resonant photoacoustic cell, and the photoacoustic signal was continuously recorded for 200 s at each concentration, with a standard gas introduced for 10 min after each concentration change. Figure 8A displays the photoacoustic signals for various SO2 concentrations as well as pure nitrogen gas when the laser emission wavelength is set to the absorption characteristic peak at 36,630 cm−1 (273 nm). The measured signal amplitudes at each concentration were aver-aged and plotted in Figure 8B. Linear regression was applied to the 200 average data points, with an R-square value of approximately 0.998 indicating the photoacoustic sensor system’s linear response to the SO2 concentration level within the studied range. The sensor system sensitivity of 2.9 μV/ppm was obtained from the linear fitting.
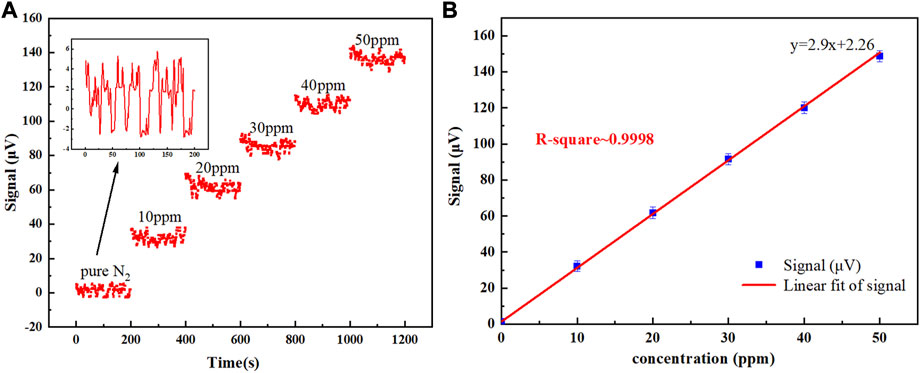
FIGURE 8. (A) 200 s-long measurement of the photoacoustic signal acquired for SO2 gas concentrations from 0 to 50 ppm. Inset: photoacoustic signal acquired when pure nitrogen was flushed into the photoacoustic cell, (B) 200 s-averaged photoacoustic signals as a function of SO2 concentration (blue data points) and linear fit (red solid line).
The signal amplitude observed for a 10 ppm SO2/N2 mixture was 32 μV. Based on the 1σ standard deviation of 2.32 μV, the detection SNR is derived to be 13.79, which corresponds to a minimum SO2 detection limit of 725 ppb.
To analysis the long-term stability of the SO2 photoacoustic sensor, an Allan-Werle deviation analysis was performed. The pure N2 was injected into the non-resonant photoacoustic cell and the laser was locked on the absorption line of SO2 at 36,630 cm−1 (273 nm). As show in Figure 9, the white noise remained as the dominant noise source until 400 s later. It reached the ultimate detection limit of 285 ppb. After that, the instrumental drift started dominating. The initial rise for the Allan plot is caused by the effect of gas fluctuations due to limitations in the gas dilution system and the solenoid valve. This is the direct result of the filter time constant reduction in the short-term noise present in the acquired data.
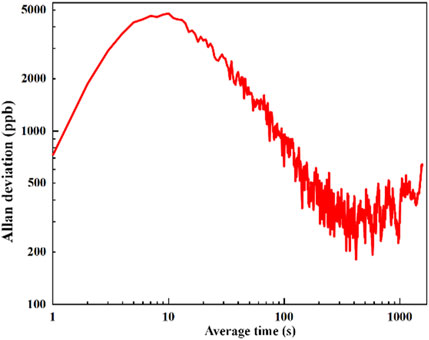
FIGURE 9. Allan-Werle deviation as a function of the integration time. The experimental data were obtained under the conditions of atmospheric pressure and room temperature.
7 Conclusion
This paper incorporated a DUV-LED that generates 10 mW of optical power into a compact non-resonant photoacoustic cell designed for sensitive SO2 detection. Because the DUV-LED is unsuitable for traditional photoacoustic spectroscopic trace gas detection techniques which based on a resonant photoacoustic cell or a quartz tuning fork, due to its divergent beam, we designed a non-resonant photoacoustic cell that accommodates the emission profile and suppresses background noise. The DUV-LED’s and the non-resonant photoacoustic cell’s small footprint makes it possible to assemble all of the photoacoustic components into an enclosed, compact unit with no moving parts, ultra-stability, and high portability. The assembled system displays a minimum detection limit of 725 ppb for SO2, with a 1s integration time, which can be optimized to 285 ppb when the integration time is extended. Further improvement should be possible by enhancing the power of the photoacoustic excitation source. The methods employed include strategies to enhance the output power of individual DUV-LEDs and to transition the excitation source from a single DUV-LED to an array comprised of multiple DUV-LEDs.
Data availability statement
The original contributions presented in the study are included in the article/Supplementary Material, further inquiries can be directed to the corresponding authors.
Author contributions
YJ: Data curation, Investigation, Validation, Writing–original draft, Writing–review and editing. CF: Validation, Writing–review and editing. RC: Writing–review and editing. JX: Writing–review and editing. LD: Conceptualization, Funding acquisition, Methodology, Project administration, Resources, Writing–review and editing. HW: Conceptualization, Funding acquisition, Project administration, Resources, Writing–review and editing.
Funding
The author(s) declare financial support was received for the research, authorship, and/or publication of this article. This work was supported by National Natural Science Foundation of China (NSFC) (Nos 62122045, 62075119, 62235010, and 62175137); National Key R&D Program of China, code: 2019YFE0118200; The High-end Foreign Expert Program (No. G2023004005L); The Shanxi Science Fund for Distinguished Young Scholars (20210302121003).
Conflict of interest
The authors declare that the research was conducted in the absence of any commercial or financial relationships that could be construed as a potential conflict of interest.
Publisher’s note
All claims expressed in this article are solely those of the authors and do not necessarily represent those of their affiliated organizations, or those of the publisher, the editors and the reviewers. Any product that may be evaluated in this article, or claim that may be made by its manufacturer, is not guaranteed or endorsed by the publisher.
Supplementary material
The Supplementary Material for this article can be found online at: https://www.frontiersin.org/articles/10.3389/fphy.2023.1328256/full#supplementary-material
References
1. Wang S, Zhang Q, Martin RV, Philip S, Liu F, Li M, et al. Satellite measurements oversee China’s sulfur dioxide emission reductions from coal-fired power plants. Environ Res Lett (2015) 10:114015. doi:10.1088/1748-9326/10/11/114015
2. Fioletov V, McLinden CA, Krotkov NA, Moran MD, Yang K. Estimation of SO2 emissions using OMI retrievals. Geophys Res Lett (2011) 38:21. doi:10.1029/2011gl049402
3. Yue T, Wang K, Tong Y, Gao J, Zhang X, Zuo P, et al. Emission characteristics of hazardous atmospheric pollutants from ultra-low emission coal-fired industrial boilers in China. Aerosol Air Qual Res (2020) 20:877–88. doi:10.4209/aaqr.2019.10.0531
4. Zhang X, Xiao H, Li X, Zhang L. Ultraviolet differential spectroscopy quantitative analysis of SF6 decomposition component SO2. IET Sci Meas Technol (2017) 12:328–34. doi:10.1049/iet-smt.2017.0225
5. Yin X, Dong L, Wu H, Zheng H, Ma W, Zhang L, et al. Highly sensitive SO2 photoacoustic sensor for SF6 decomposition detection using a compact mW-level diode-pumped solid-state laser emitting at 303 nm. Opt Express (2017) 25:32581. doi:10.1364/oe.25.032581
6. Zhang Z, Xu Y, Chen K, Wang Y, Tang Y, Zhao R, et al. Silicon cantilever-enhanced single-fiber photoacoustic acetylene gas sensor. Sensors (2023) 23:7644. doi:10.3390/s23177644
7. Luo H, Yang Z, Zheng H, Lv H, Wang C, Lin H, et al. Ppbv-level mid-infrared photoacoustic sensor for mouth alcohol test after consuming lychee fruits. Photoacoustics (2023) 33:100559. doi:10.1016/j.pacs.2023.100559
8. Sun B, Patimisco P, Sampaolo A, Spagnolo V, Wu H, et al. Light-induced thermoelastic sensor for ppb-level H2S detection in a SF6 gas matrices exploiting a mini-multi-pass cell and quartz tuning fork photodetector. Photoacoustics (2023) 33:100553. doi:10.1016/j.pacs.2023.100553
9. Weng W, Aldén M, Li Z. Quantitative SO2 detection in combustion environments using broad band ultraviolet absorption and laser-induced fluorescence. Anal Chem (2019) 91:10849–55. doi:10.1021/acs.analchem.9b02505
10. Zhang X, Liu H, Ren J, Li J, Li X. Fourier transform infrared spectroscopy quantitative analysis of SF6 partial discharge decomposition components. Spectrochim Acta A Mol Biomol Spectrosc (2015) 136:884–9. doi:10.1016/j.saa.2014.09.109
11. Li S, Yuan Y, Shang Z, Yin X, Wu H, Patimisco P, et al. Ppb-level NH3 photoacoustic sensor combining a hammer-shaped tuning fork and a 9.55 µm quantum cascade laser. Photoacoustics (2023) 33:100557. doi:10.1016/j.pacs.2023.100557
12. Feng C, Shen X, Li B, Spagnolo V, Dong L, Wu H, et al. Carbon monoxide impurities in hydrogen detected with photoacoustic detection. Photoacoustics (2023). doi:10.2139/ssrn.4596620
13. Patimisco P, Scamarcio G, Tittel FK, Spagnolo V. Quartz-enhanced photoacoustic spectroscopy: a review. Sensors (2014) 14:6165–206. doi:10.3390/s140406165
14. Sampaolo A, Patimisco P, Giglio M, Zifarelli A, Wu H, Dong L, et al. Quartz-enhanced photoacoustic spectroscopy for multi-gas detection: a review. Analytica Chim Acta (2022) 1202:338894. doi:10.1016/j.aca.2021.338894
15. Wu H, Dong L, Zheng H, Yu Y, Ma W, Zhang L, et al. Beat frequency quartz-enhanced photoacoustic spectroscopy for fast and calibration-free continuous trace-gas monitoring. Nat Commun (2017) 8:15331. doi:10.1038/ncomms15331
16. Wei T, Zifarelli A, Russo SD, Wu H, Menduni G, Sampaolo A, et al. High and flat spectral responsivity of quartz tuning fork used as infrared photodetector in tunable diode laser spectroscopy. Appl Phys Rev (2021) 8:041409. doi:10.1063/5.0062415
17. Yin X, Dong L, Wu H, Zheng H, Ma W, Zhang L, et al. Ppb-level H2S detection for SF6 decomposition based on a fiber-amplified telecommunication diode laser and a background-gas-induced high-Q photoacoustic cell. Appl Phys Lett (2017) 111:031109. doi:10.1063/1.4987008
18. Hu Y, Qiao S, He Y, Lang Z, Ma Y. Quartz-enhanced photoacoustic-photothermal spectroscopy for trace gas sensing. Opt Express (2021) 29:5121–7. doi:10.1364/oe.418256
19. Payimisco P, Sampaolo A, Dong L, Tittel FK, Spagnolo V. Recent advances in quartz enhanced photoacoustic sensing. Appl Phys Rev (2018) 5:011106. doi:10.1063/1.5013612
20. Waclawek JP, Lewicki R, Mose H, Brandstetter M, Tittel FK, Lendl B. Quartz-enhanced photoacoustic spectroscopy-based sensor system for sulfur dioxide detection using a CW DFB-QCL. Appl Phys B (2014) 117:113–20. doi:10.1007/s00340-014-5809-y
21. Yin X, Wu H, Dong L, Li B, Ma W, Zhang L, et al. Ppb-level SO2 photoacoustic sensors with a suppressed absorption–desorption effect by using a 7.41 μm external-cavity quantum cascade laser. ACS Sens (2020) 5:549–56. doi:10.1021/acssensors.9b02448
22. Hitran . The HITRAN database (2023). Available online: http://www.hitran.com.
23. Somesfalean G, Zhang ZG, Sjöholm M, Svanberg S. All-diode-laser ultraviolet absorption spectroscopy for sulfur dioxide detection. Appl Phys B (2005) 80:1021–5. doi:10.1007/s00340-005-1835-0
24. Wang Z, Wang Q, Zhang H, Borri S, Galli I, Sampaolo A, et al. Doubly resonant sub-ppt photoacoustic gas detection with eight decades dynamic range. Photoacoustics (2022) 27:100387. doi:10.1016/j.pacs.2022.100387
25. Yang S, Qiao S, Liu X, Ma Y. Highly sensitive measurement of oxygen concentration based on reflector-enhanced photoacoustic spectroscopy. Sensors (2022) 22:5087. doi:10.3390/s22145087
26. Chen T, Ma F, Zhao Y, Liao Z, Qiu Z, Zhang G. Cantilever enhanced based photoacoustic detection of SF6 decomposition component SO2 using UV LED. Sensor Rev (2022) 42:70–5. doi:10.1108/sr-12-2020-0292
27. Li C, Chen K, Zhao J, Qi H, Zhao X, Ma F, et al. High-sensitivity dynamic analysis of dissolved gas in oil based on differential photoacoustic cell. Opt Lasers Eng (2023) 161:107394. doi:10.1016/j.optlaseng.2022.107394
28. El-Safoury M, Dufner M, Weber C, Schmitt K, Pernau HF, Willing B, et al. On-board monitoring of SO2 ship emissions using resonant photoacoustic gas detection in the UV range. Sensors (2021) 21:4468. doi:10.3390/s21134468
29. Fu L, Lu P, Sima C, Zhao J, Pan Y, Li T, et al. Small-volume highly-sensitive all-optical gas sensor using non-resonant photoacoustic spectroscopy with dual silicon cantilever optical microphones. Photoacoustics (2022) 27:100382. doi:10.1016/j.pacs.2022.100382
30. Lu Y, Li Y, Song F, Zhang Y, Li X, Zheng C, et al. Development of a mid-infrared early fire detection systembased on dual optical path non-resonant photoacoustic cell. Microwave Opt Tech Lett. (2023) 1–8. doi:10.1002/mop.33758
31. Miklós A, Hess P, Bozóki Z. Application of acoustic resonators in photoacoustic trace gas analysis and metrology. Rev Sci Instrum (2001) 72:1937–55. doi:10.1063/1.1353198
32. Schfer S, Miklós A, Hess P. Quantitative signal analysis in pulsed resonant photoacoustics. Appl Opt (1997) 36:3202–11. doi:10.1364/ao.36.003202
Keywords: sulfur dioxide, trace gas detection, photoacoustic spectrometry, non-resonant photoacoustic cell, deep-ultraviolet light-emitting diode
Citation: Jing Y, Feng C, Cui R, Xue J, Dong L and Wu H (2023) A compact portable photoacoustic sensor for sub-ppm level SO2 detection with a DUV-LED and a non-resonant photoacoustic cell. Front. Phys. 11:1328256. doi: 10.3389/fphy.2023.1328256
Received: 26 October 2023; Accepted: 04 December 2023;
Published: 21 December 2023.
Edited by:
Kaijie Xu, University of Alberta, CanadaCopyright © 2023 Jing, Feng, Cui, Xue, Dong and Wu. This is an open-access article distributed under the terms of the Creative Commons Attribution License (CC BY). The use, distribution or reproduction in other forums is permitted, provided the original author(s) and the copyright owner(s) are credited and that the original publication in this journal is cited, in accordance with accepted academic practice. No use, distribution or reproduction is permitted which does not comply with these terms.
*Correspondence: Hongpeng Wu, wuhp@sxu.edu.cn; Lei Dong, donglei@sxu.edu.cn