Amplitude and phase noise in two-membrane cavity optomechanics
 Francesco Marzioni1,2,3†
  Francesco Rasponi1†
  Paolo Piergentili1,2 Riccardo Natali1,2 Giovanni Di Giuseppe1,2
  David Vitali1,2,4*
- 1School of Science and Technology, Physics Division, University of Camerino, Camerino, Italy
- 2INFN, Sezione di Perugia, Perugia, Italy
- 3Department of Physics, University of Naples “Federico II”, Napoli, Italy
- 4CNR-INO, Firenze, Italy
Cavity optomechanics is a suitable field to explore quantum effects on macroscopic objects and develop quantum technology applications. A perfect control of the laser noise is required to operate the system in such extreme conditions necessary to reach the quantum regime. In this paper, we consider a Fabry–Perót cavity, driven by two laser fields, with two partially reflective SiN membranes inside it. We describe the effects of amplitude and phase noise on the laser introducing two additional noise terms in the Langevin equations of the system’s dynamics. Experimentally, we add an artificial source of noise on the laser. We calibrate the intensity of the noise, inject it into the system, and check the validity of the theoretical model. This procedure provides an accurate description of the effects of a noisy laser in the optomechanical setup and allows for quantifying the amount of noise.
1 Introduction
In cavity optomechanics, a number of mechanical degrees of freedom is coupled by a dispersive parametric coupling, typically due to the radiation pressure interaction, to one or more driven modes of an optical cavity [1]. Such a configuration can be realized on a large variety of platforms, with different cavity geometries, as well as very different kinds of mechanical modes, ranging from vibrational modes of 1D, 2D, or 3D systems to the center-of-mass motion of trapped nanoparticles and to bulk and surface acoustic waves of properly designed materials. Despite their macroscopic nature, these devices can now be operated in a quantum regime for a number of relevant applications in quantum technologies and for answering fundamental physics questions. For example, entangled states of radiation modes [2, 3] and mechanical modes [4, 5] and hybrid optomechanical entanglement [6], as well as squeezed states of optical [7–9] and mechanical [10] modes, have been generated. Detection of displacements and forces below the standard quantum limit (SQL) has been demonstrated [11], and also, microwave-optical transduction with added noise very close to the quantum limit has been demonstrated [12, 13].
In all these experiments, the required effective interaction between the mechanical and the cavity modes is obtained by engineering the amplitudes and the frequencies of the driving sources, which have to be phase-locked and stabilized as much as possible. In fact, as can be easily expected, both the amplitude and phase noise of the laser driving are detrimental for any quantum effects, as it has already been theoretically suggested [14, 15] and experimentally verified. In fact, analyses of the effect of the laser phase noise on the cooling of the mechanical mode appeared in [16–18], while its effect on squeezing was analyzed in [19]. On the one hand, one has to minimize these technical noise sources as much as possible, for example, by using filter cavities or moving to higher mechanical resonance frequencies where these noises become less relevant; on the other hand, it would be useful to develop a procedure for modeling and quantifying the effect of these noises in a simple way. Here, we provide such a procedure by considering a multimode cavity optomechanical system in which two silicon nitride (SiN) membranes are placed within a Fabry–Perót cavity and driven by two laser fields, which has been considered for a large number of physical processes, such as synchronization of mechanical modes [20, 21], mechanical state swapping [22], heat transfer [23], cooperativity competition [24], and enhancement of single-photon optomechanical coupling [25, 26]. Here, we artificially add amplitude and phase noise to one of the driving fields, the pump beam controlling the interaction in the linearized regime of cavity optomechanics [1], and show how one can calibrate and quantify the corresponding noise spectra and describe it in terms of the size of the noise spectra of additional amplitude and phase noise terms in the Langevin equations describing the dynamics.
The calibration and modelization of the laser noise presented here is general and can be applied to a generic optomechanical system. For its experimental verification, we consider here the so-called “membrane-in-the-middle” [27, 28] configuration of cavity optomechanics, which has been employed by many groups since 2008 [17, 20–23, 27, 28] and presents many advantages. In fact, thin semitransparent Si3N4 membranes are commercially available and present a very high mechanical quality factor due their intrinsic high stress [29]. Moreover, they are characterized by a negligible absorption at optical wavelengths [30] so that if they are placed near the waist of an optical Fabry–Perót cavity, losses due to scattering are negligible, and the cavity decay rate is mostly determined by the empty cavity finesse only [17, 27, 28, 30]. Furthermore, the single-photon optomechanical coupling with a given optical cavity mode can be fine-tuned by controlling the longitudinal and transversal positions of the membrane within the cavity [27, 28, 31]. These facts make membrane-in-the-middle optomechanical setups particularly suitable for operating in the resolved sideband regime and for reaching a very large optomechanical cooperativity, which are fundamental conditions for the realization and manipulation of quantum states of the cavity mode and of the mechanical resonator [1] and witnessed, for example, by the results of [3, 9, 11, 12]. Recent advances have shown that SiN membranes are particularly suitable for further engineering and suppression of clamping losses, either via the use of the on-chip seismic filtering stage [32] or phononic bandgap crystal designs [33], which have allowed very large mechanical quality factors, even at room temperature [33, 34].
This paper is organized as follows. In Section 2, we present the model Hamiltonian and show how one can modify the standard QLE treatment in order to include the effects of laser noise. In Section 3, we describe the experimental setup and show the detected noise spectra, either the output spectrum in transmission and the homodyne detection of the mechanical motion of the two membranes. In addition, we show how one can reconstruct and model the effect of the amplitude and phase noise of the driving fields. Section 4 presents the concluding remarks.
2 The model
The system is composed of two mechanical resonators which are effectively coupled through two driven optical cavity modes, as described in Figure 1, namely, the pump mode that is responsible for the optomechanical interaction and the probe mode to perform the spectral analysis. The Hamiltonian, hence, includes several components as follows:
where the first term describes the energy of the cavity modes represented by the bosonic annihilation operator
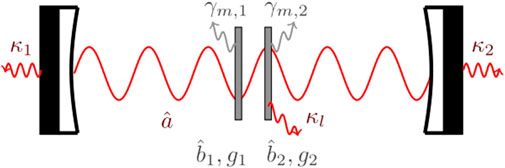
FIGURE 1. Two SiN membranes within a Fabry–Perót cavity. The two mechanical resonators
We considered
where we defined the detuning
The Langevin equation for the optical mode takes into account the optical noise operators related to the input mirror
where the l index refers to the input or output port of interest. Both optical and mechanical noises are thermal and, hence, proportional to the thermal boson number given by the Bose–Einstein statistics
where Γϵ,k is a dimensionless parameter that quantifies the intensity of the laser amplitude fluctuations and γϵ,k corresponds to the bandwidth of the amplitude noise spectrum; analogously, ΓL,k denotes the strength of the laser phase noise but has the dimension of a frequency, and γϕ,k represents the bandwidth of the phase noise. More precisely, ΓL,k stands for the linewidth of the laser that characterizes the laser spectrum itself, and typical values span in the range ∼ (1–100) kHz [15]. Performing the Fourier transform of such correlations, one obtains the following spectra for the noises:
Therefore, we consider the amplitude and phase noises as colored noises with a Lorentzian spectrum that are different from the Markovian vacuum optical and thermal mechanical noises, which have a flat frequency noise spectrum. Indeed, a flat spectrum tends to overestimate the effect of laser noises [14]. However, we note that when γϵ ≫ ωm,j or γϕ ≫ ωm,j, we recover a flat frequency spectrum situation.
2.1 Linearized quantum Langevin equations
We focus on the stationary state of the system, and our purpose is to investigate the dynamics of the membranes around the equilibrium positions due to several noise sources. Hence, we consider the annihilation operators of the quantum Langevin equations as composed by a mean amplitude term and a fluctuation term around that value, so that the optical annihilation operator can be written as
Here, we introduced a new detuning
We have omitted all the second-order terms, which are negligible when |α|≫ 1. From these equations, it is evident that in the linearized regime, the effect of the laser phase noise can be more relevant than that of the amplitude noise, since it is multiplied by the intracavity amplitude α. By switching to the frequency domain by performing the Fourier transform of Eqs 14, 15, we obtain
The previous equations refer to the fluctuation operators, and we dropped out the fluctuation symbol δ for convenience. We introduced the optical and mechanical bare susceptibilities which are
In particular, for the probe field, we consider from now on a detuning Δ1 = 0. By inserting Eqs 16, 17 into Eq. 18, one obtains the equation for one mechanical annihilation operator as a function of the other mechanical operators and noises:
where we have defined
where the effective susceptibility in rotating-wave approximation is
The first term of Eq. 23 takes into account the phase noise contributions for both the probe and pump laser beams, and the second one refers to the vacuum optical and amplitude laser noises for the input and output ports, while the latter term is related to the mechanical thermal noise.
2.2 Output quadrature spectrum
We detect the noise spectrum of the general amplitude quadrature
so that inserting Eq. 23 for the mechanical annihilation and creation operators in Eq. 25, one gets the full, but cumbersome, expression in terms of the noises. The related spectrum can be calculated as
Similarly, the general phase quadrature
One can derive the expression in terms of the noises and the related spectrum through the aforementioned method.
3 Materials and methods
3.1 Description of the experimental setup
The optomechanical setup is constituted by two Si3N4 square membranes within an optical cavity [21, 25, 35, 36]. A laser beam at wavelength λ = 1064 nm is split into a probe beam and a pump beam. The first one has power Ppr = 3.8 µW, and it is modulated by using an electro-optical modulator (EOM). It is locked to the cavity resonance frequency by means of the Pound–Drever–Hall (PDH) technique. The fraction of the beam reflected by the cavity is revealed by homodyne detection, yielding an effective measurement of the motion of the membranes. The pump beam is more intense, and its power can be controlled. It is employed to realize the optomechanical interaction. The pump beam is also suitable to inject the amplitude and phase noise into the system and scan the cavity linewidth.
Amplitude and phase noise can be controlled by adding a modulation to the pump beam. The light modulation is implemented through an acousto-optic modulator (AOM), which is driven by a voltage-controlled oscillator (VCO). We control the frequency and the amplitude of the modulation feeding the VCO with DC signals. The frequency modulation (FM) is useful to detune the pump beam with respect to the cavity. The amplitude and phase modulation is used to introduce a seed beam into the cavity. We can evaluate the response function of the system to the amplitude and phase noise modulation, respectively, by measuring the light transmitted by the cavity at different frequencies of the seed. A schematic view of the experimental setup is depicted in Figure 2. The light transmitted by the cavity is collected on a PIN photodiode. The photocurrent is then amplified by using a FEMTO DHPCA-100 transimpedance amplifier with 1 × 10⁶ V/A gain and 3.5 MHz bandwidth.
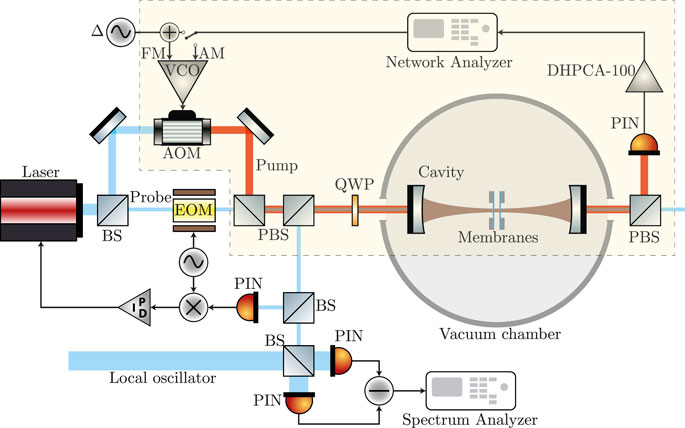
FIGURE 2. Schematic of the experimental setup. The laser is split into a probe beam and a pump beam. The probe is modulated by an EOM. A fraction of the reflected component is measured to implement the PDH technique. The remaining field is mixed with a local oscillator to obtain the homodyne signal. The pump beam, whose path is highlighted by the yellow-dashed poligon, is modulated through an AOM. The AOM is driven by a VCO. The frequency modulation allows the pump to be detuned in a controlled way from the cavity resonance frequency. The input ports of the VCO allow injecting amplitude and phase noise into the system. The cavity-transmitted light is detected directly by a PIN photodiode. The photocurrent is amplified using a FEMTO DHPCA-100 transimpedance amplifier.
3.2 Experimental parameters
The two membranes form themselves an inner cavity Lc = 53.571(9) μm long, the thickness of the Si3N4 layer is Lm = 106(1) nm, and the transverse dimensions were estimated from the normal mode spectrum to be
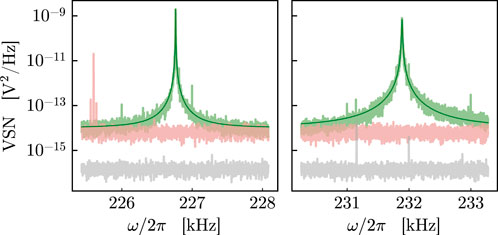
FIGURE 3. Homodyne voltage spectral noise (VSN) around mechanical fundamental mode frequencies. The light green curve shows the thermal noise of the mechanical oscillators. The mechanical parameters are estimated using the Lorentzian functions represented in green. The red curve indicates the shot noise level, and the black one is the electronic noise of the device.
The effective mass of the fundamental mode for both membranes is meff = 174 ng. The first oscillator is centered around ωm,1 = 2π × 226.764581(1) kHz, with a bandwidth (i.e., the mechanical damping rate) γm,1 = 2π × 1.44(1) Hz, yielding a mechanical quality factor
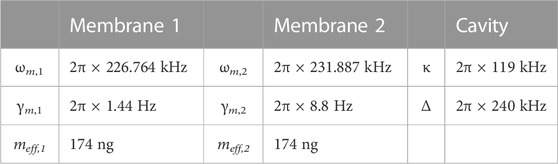
TABLE 1. Optical and mechanical parameters.
3.3 Amplitude and phase noise calibration
We have experimentally verified the theoretical model by measuring the response of the optomechanical system to amplitude noise modulations on the pump beam. The pump beam transmitted by the cavity, around the mechanical frequencies, is detected with the schematic presented in Figure 2. To calibrate the quadrature spectrum, we have to point out the relationship between the theoretical spectrum, i.e., the spectrum of Eq. 25, and the measured data. Experimentally, a lock-in amplifier (LIA) is used to probe the response of the system at the modulation frequency Ωm. We can calibrate the noise impinging on the cavity by measuring the ratio between the amplitude of the field sidebands, generated by the AOM modulation at frequency ±Ωm, and the amplitude of the field at the carrier frequency. A heterodyne scheme can be easily obtained by mixing the pump beam and the probe beam polarizations. The amplitude of the pump field modulated by the AOM is written as
where
The intensity of the light impinging on the photodiode is given by
assuming a small modulation ϵm ≪ϵa. This form clearly reveals a DC signal and oscillating components at Ωm, Δ, and Ωm ±Δ, respectively. We can measure the amplitude of the signal at different frequencies by means of an LIA. After the demodulation, the signal is passed through a fourth-order band-pass filter with 19 Hz bandwidth. We perform the demodulation at frequencies Δ, Ωm + Δ, and Ωm, to measure Vcar, Vsb, and
The calibration for different values of the modulation input voltage is presented in Figure 4A. The interference between the modulated pump and the probe also contains a component at frequency Ωm, which is proportional to
where
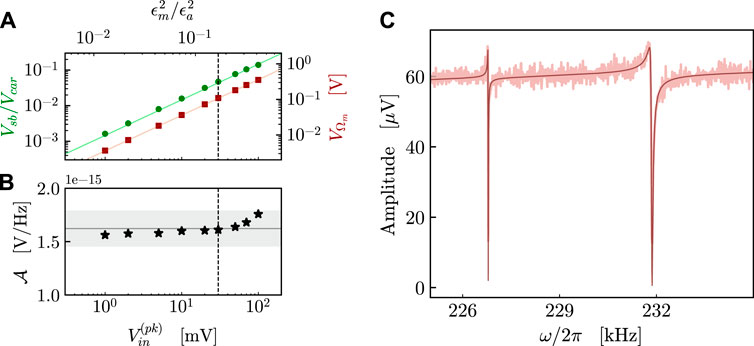
FIGURE 4. Calibration of the noise and transmitted seed spectrum around the mechanical frequency. (A) The green dots represent the measured ratio between sideband and carrier amplitudes, while the red squares are the amplitude of the signal at frequency Ωm. The calibration is performed for different input voltages. (B) Calculated detection factors for different seed amplitudes. The horizontal line indicates the average of the points, with the shadow area representing ± 10% of variation from the mean value. (C) The seed is injected as the amplitude modulation of the pump beam, using an input voltage
The measured points for
The spectrum in Figure 4C shows two Fano resonances with an asymmetric shape, which is a typical manifestation of interference, and its possible occurrence in optomechanical systems has been described, for example, in [37, 38]. In this case, the two dips in correspondence to the mechanical resonance frequencies of the membranes are due to the destructive interference between the amplitude noise of the driving pump directly transmitted by the cavity and the optical output associated with the effective response of each mechanical resonator to the same amplitude noise. In the experiment, the two oscillators have different bare mechanical quality factors and optomechanical couplings, resulting in two distinct effective responses, which appear in the spectrum as different shapes of the two dips. This output field cancellation is similar to optomechanically induced transparency (OMIT) [39, 40], stimulated in this case by the amplitude noise term.
Alternatively, we can inject noise on the phase of the pump beam. We have described previously a method to evaluate the amount of amplitude noise on the beam and introduced the factor
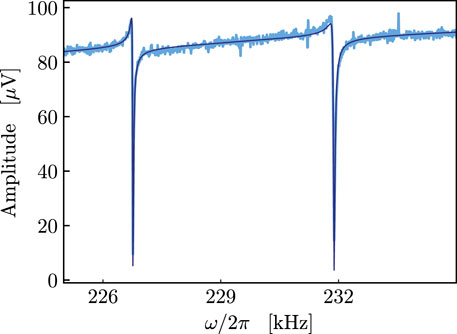
FIGURE 5. Seed is injected as phase modulation of the pump beam, and the output of the optical cavity is detected. The lighter curve represents the experimental data, with the darker one representing the best-fitting function. Knowing the detection factor
The two dips in Figure 5 are again addressed to an OMIT-like behavior, here stimulated by the phase noise seed.
3.4 Noise cancellation
Eventually, we can detect the mechanical displacement noise by means of homodyne detection of the reflected probe beam while injecting amplitude noise in the system through the pump beam. The detection reveals the phase quadrature of the probe field in the presence of amplitude noise on the pump. The same detection can be carried out also by adding phase noise, obtaining almost identical results for the detected spectra. The noise calibration described in the previous section remains valid. The first excited modes of one membrane, labeled as (12) and (21), have resonance frequencies
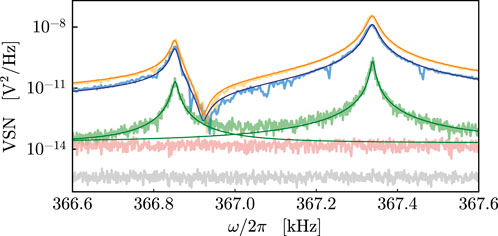
FIGURE 6. Homodyne voltage spectral noise around the first excited mechanical mode frequencies of one membrane. The lighter curves represent the measured data, and the solid darker lines represent the theoretical best-fitting functions. The green curve represents the thermal noise of the membrane, i.e., the homodyne signal spectrum when the pump beam is switched off. We estimate the mechanical parameters by fitting it with Lorentzian peaks. The orange and blue lines are measured injecting a seed of intensity
The orange and blue curves in Figure 6 refer to the case when amplitude noise is much larger than the other noise sources. As a consequence, the two mechanical modes are excited via radiation pressure by the same fluctuating force. In the spectral region between the resonances, the two mechanical responses are out of phase and destructively interfere, yielding visible noise cancellation. Similar noise cancellation phenomena have been observed in different experimental setups, and these features can be engineered to improve the sensitivity of the measurement within the cancellation’s bandwidth [41, 42].
4 Conclusion
In this work, we considered a multimode cavity optomechanical system in which two SiN membranes are placed within a Fabry–Perót cavity and driven by two laser fields. We provided a description of the effects of the laser’s amplitude and phase noises, which are introduced in the system’s equations of motion as an additive term and a multiplicative term, respectively. Moreover, we have used an artificial source of white noise to prove experimentally the validity of the model. We evaluated the equivalent noise spectral density when the artificial noises overwhelm the other sources of noise. Finally, the effective displacement spectral noise of the membranes in the presence of amplitude noise has been measured; a cancellation window within the mechanical resonance frequencies arises due to the opposite sign of the phases in the mechanical response. The theoretical model with the calibrated value of the noise provided an accurate description in this case as well.
Data availability statement
The raw data supporting the conclusion of this article will be made available by the authors, without undue reservation.
Author contributions
All authors conceived the experiment. FM, RN, PP, and GDG performed the experiment. FR, FM, PP, GDG, and DV analyzed the data, and all authors wrote the paper. All authors contributed to the article and approved the submitted version.
Acknowledgments
The authors acknowledge financial support from the NQSTI within PNRR MUR project PE0000023-NQSTI.
Conflict of interest
The authors declare that the research was conducted in the absence of any commercial or financial relationships that could be construed as a potential conflict of interest.
Publisher’s note
All claims expressed in this article are solely those of the authors and do not necessarily represent those of their affiliated organizations, or those of the publisher, the editors, and the reviewers. Any product that may be evaluated in this article, or claim that may be made by its manufacturer, is not guaranteed or endorsed by the publisher.
References
1. Aspelmeyer M, Kippenberg TJ, Marquardt F. Cavity optomechanics. Rev Mod Phys (2014) 86:1391–452. doi:10.1103/revmodphys.86.1391
2. Barzanjeh S, Redchenko ES, Peruzzo M, Wulf M, Lewis DP, Arnold G, et al. Stationary entangled radiation from micromechanical motion. Nature (London) (2019) 570:480–3. doi:10.1038/s41586-019-1320-2
3. Chen J, Rossi M, Mason D, Schliesser A. Entanglement of propagating optical modes via a mechanical interface. Nat Commun (2020) 11:943. doi:10.1038/s41467-020-14768-1
4. Ockeloen-Korppi CF, Damskägg E, Pirkkalainen JM, Asjad M, Clerk AA, Massel F, et al. Stabilized entanglement of massive mechanicaloscillators. Nature (London) (2018) 556:478–82. doi:10.1038/s41586-018-0038-x
5. Kotler S, Peterson GA, Shojaee E, Lecocq F, Cicak K, Kwiatkowski A, et al. Direct observation of deterministic macroscopic entanglement. Science (2021) 372:622–5. doi:10.1126/science.abf2998
6. Palomaki TA, Teufel JD, Simmonds RW, Lehnert KW. Entangling mechanical motion with microwave fields. Science (2013) 342:710–3. doi:10.1126/science.1244563
7. Brooks DWC, Botter T, Schreppler S, Purdy TP, Brahms N, Stamper-Kurn DM. Non-classical light generated by quantum-noise-driven cavity optomechanics. Nature (2012) 488:476–80. doi:10.1038/nature11325
8. Safavi-Naeini AH, Gröblacher S, Hill JT, Chan J, Aspelmeyer M, Painter O. Squeezed light from a silicon micromechanical resonator. Nature (2013) 500:185–9. doi:10.1038/nature12307
9. Purdy TP, Yu PL, Peterson RW, Kampel NS, Regal CA. Strong optomechanical squeezing of light. Phys Rev X (2013) 3:031012. doi:10.1103/PhysRevX.3.031012
10. Pirkkalainen JM, Damskägg E, Brandt M, Massel F, Sillanpää MA. Squeezing of quantum noise of motion in a micromechanical resonator. Phys Rev Lett (2015) 115:243601. doi:10.1103/PhysRevLett.115.243601
11. Mason D, Chen J, Rossi M, Tsaturyan Y, Schliesser A. Continuous force and displacement measurement below the standard quantum limit. Nat Phys (2019) 15:745–9. doi:10.1038/s41567-019-0533-5
12. Brubaker BM, Kindem JM, Urmey MD, Mittal S, Delaney RD, Burns PS, et al. Optomechanical ground-state cooling in a continuous and efficient electro-optic transducer. Phys Rev X (2022) 12:021062. doi:10.1103/PhysRevX.12.021062
13. Seis Y, Capelle T, Langman E, Saarinen S, Planz E, Schliesser A. Ground state cooling of an ultracoherent electromechanical system. Nat Commun (2022) 13:1507. doi:10.1038/s41467-022-29115-9
14. Rabl P, Genes C, Hammerer K, Aspelmeyer M. Phase-noise induced limitations on cooling and coherent evolution in optomechanical systems. Phys Rev A (2009) 80:063819. doi:10.1103/PhysRevA.80.063819
15. Abdi M, Barzanjeh S, Tombesi P, Vitali D. Effect of phase noise on the generation of stationary entanglement in cavity optomechanics. Phys Rev A (2011) 84:032325. doi:10.1103/PhysRevA.84.032325
16. Schliesser A, Riviere R, Anetsberger G, Arcizet O, Kippenberg TJ. Resolved-sideband cooling of a micromechanical oscillator. Nat Phys (2008) 4:415–9. doi:10.1038/nphys939
17. Jayich AM, Sankey JC, Børkje K, Lee D, Yang C, Underwood M, et al. Cryogenic optomechanics with a si3n4 membrane and classical laser noise. New J Phys (2012) 14:115018. doi:10.1088/1367-2630/14/11/115018
18. Meyer N, de Los Rios Sommer A, Mestres P, Gieseler J, Jain V, Novotny L, et al. Resolved-sideband cooling of a levitated nanoparticle in the presence of laser phase noise. Phys Rev Lett (2019) 123:153601. doi:10.1103/physrevlett.123.153601
19. Pontin A, Biancofiore C, Serra E, Borrielli A, Cataliotti FS, Marino F, et al. Frequency-noise cancellation in optomechanical systems for ponderomotive squeezing. Phys Rev A (2014) 89:033810. doi:10.1103/physreva.89.033810
20. Sheng J, Wei X, Yang C, Wu H. Self-organized synchronization of phonon lasers. Phys Rev Lett (2020) 124:053604. doi:10.1103/physrevlett.124.053604
21. Piergentili P, Li W, Natali R, Malossi N, Vitali D, Di Giuseppe G. Two-membrane cavity optomechanics: Nonlinear dynamics. New J Phys (2020) 23:073013. doi:10.1088/1367-2630/abdd6a
22. Weaver MJ, Buters F, Luna F, Eerkens H, Heeck K, de Man S, et al. Coherent optomechanical state transfer between disparate mechanical resonators. Nat Commun (2017) 8:824. doi:10.1038/s41467-017-00968-9
23. Yang C, Wei X, Sheng J, Wu H. Phonon heat transport in cavity-mediated optomechanical nanoresonators. Nat Commun (2020) 11:4656–6. doi:10.1038/s41467-020-18426-4
24. Jong MD, Li J, Gärtner C, Norte R, Gröblacher S. Coherent mechanical noise cancellation and cooperativity competition in optomechanical arrays. Optica (2022) 9:170–6. doi:10.1364/optica.446434
25. Piergentili P, Catalini L, Bawaj M, Zippilli S, Malossi N, Natali R, et al. Two-membrane cavity optomechanics. New J Phys (2018) 20:083024. doi:10.1088/1367-2630/aad85f
26. Li J, Xuereb A, Malossi N, Vitali D. Cavity mode frequencies and strong optomechanical coupling in two-membrane cavity optomechanics. J Opt (2016) 18:084001. doi:10.1088/2040-8978/18/8/084001
27. Thompson JD, Zwickl BM, Jayich AM, Marquardt F, Girvin SM, Harris JGE. Strong dispersive coupling of a high-finesse cavity to a micromechanical membrane. Nature (London) (2008) 452:72–5. doi:10.1038/nature06715
28. Wilson DJ, Regal CA, Papp SB, Kimble HJ. Cavity optomechanics with stoichiometric sin films. Phys Rev Lett (2009) 103:207204. doi:10.1103/PhysRevLett.103.207204
29. Southworth DR, Barton RA, Verbridge SS, Ilic B, Fefferman AD, Craighead HG, et al. Stress and silicon nitride: A crack in the universal dissipation of glasses. Phys Rev Lett (2009) 102:225503. doi:10.1103/PhysRevLett.102.225503
30. Serra E, Bawaj M, Borrielli A, Di Giuseppe G, Forte S, Kralj N, et al. Microfabrication of large-area circular high-stress silicon nitride membranes for optomechanical applications. AIP Adv (2016) 6. doi:10.1063/1.4953805
31. Biancofiore C, Karuza M, Galassi M, Natali R, Tombesi P, Di Giuseppe G, et al. Quantum dynamics of an optical cavity coupled to a thin semitransparent membrane: Effect of membrane absorption. Phys Rev A (2011) 84:033814. doi:10.1103/PhysRevA.84.033814
32. Borrielli A, Marconi L, Marin F, Marino F, Morana B, Pandraud G, et al. Control of recoil losses in nanomechanical sin membrane resonators. Phys Rev B (2016) 94:121403. doi:10.1103/PhysRevB.94.121403
33. Tsaturyan Y, Barg A, Polzik ES, Schliesser A. Ultracoherent nanomechanical resonators via soft clamping and dissipation dilution. Nat Nanotechnology (2017) 12:776–83. doi:10.1038/nnano.2017.101
34. Serra E, Borrielli A, Marin F, Marino F, Malossi N, Morana B, et al. Silicon-nitride nanosensors toward room temperature quantum optomechanics. J Appl Phys (2021) 130:064503. doi:10.1063/5.0055954
35. Piergentili P, Li W, Natali R, Vitali D, Di Giuseppe G. Absolute determination of the single-photon optomechanical coupling rate via a hopf bifurcation. Phys Rev Appl (2021) 15:034012. doi:10.1103/PhysRevApplied.15.034012
36. Piergentili P, Natali R, Vitali D, Di Giuseppe G. Two-membrane cavity optomechanics: Linear and non-linear dynamics. Photonics (2022) 9:99. doi:10.3390/photonics9020099
37. Elste F, Girvin SM, Clerk AA. Quantum noise interference and backaction cooling in cavity nanomechanics. Phys Rev Lett (2009) 102:207209. doi:10.1103/PhysRevLett.102.207209
38. Qu K, Agarwal GS. Fano resonances and their control in optomechanics. Phys Rev A (2013) 87:063813. doi:10.1103/PhysRevA.87.063813
39. Weis S, Rivière R, Deléglise S, Gavartin E, Arcizet O, Schliesser A, et al. Optomechanically induced transparency. Science (2010) 330:1520–3. doi:10.1126/science.1195596
40. Karuza M, Biancofiore C, Bawaj M, Molinelli C, Galassi M, Natali R, et al. Optomechanically induced transparency in a membrane-in-the-middle setup at room temperature. Phys Rev A (2013) 88:013804. doi:10.1103/PhysRevA.88.013804
41. Caniard T, Verlot P, Briant T, Cohadon PF, Heidmann A. Observation of back-action noise cancellation in interferometric and weak force measurements. Phys Rev Lett (2007) 99:110801. doi:10.1103/PhysRevLett.99.110801
Keywords: cavity optomechanics, radiation pressure, membranes, laser noise, calibration
Citation: Marzioni F, Rasponi F, Piergentili P, Natali R, Di Giuseppe G and Vitali D (2023) Amplitude and phase noise in two-membrane cavity optomechanics. Front. Phys. 11:1222056. doi: 10.3389/fphy.2023.1222056
Received: 13 May 2023; Accepted: 05 July 2023;
Published: 24 July 2023.
Edited by:
Paweł Jarka, Silesian University of Technology, PolandReviewed by:
Giuseppe Brunetti, Politecnico di Bari, ItalyLu Zhou, East China Normal University, China
Copyright © 2023 Marzioni, Rasponi, Piergentili, Natali, Di Giuseppe and Vitali. This is an open-access article distributed under the terms of the Creative Commons Attribution License (CC BY). The use, distribution or reproduction in other forums is permitted, provided the original author(s) and the copyright owner(s) are credited and that the original publication in this journal is cited, in accordance with accepted academic practice. No use, distribution or reproduction is permitted which does not comply with these terms.
*Correspondence: David Vitali, david.vitali@unicam.it
†These authors have contributed equally to this work