Intertrack interaction at ultra-high dose rates and its role in the FLASH effect
 Alexander Baikalov1,2,3*
  Ramin Abolfath3
  Emil Schüler3,4
  Radhe Mohan3
  Jan J. Wilkens1
  Stefan Bartzsch1,2
- 1Department of Radiation Oncology, School of Medicine and Klinikum rechts der Isar, Technical University of Munich, Munich, Germany
- 2Institute of Radiation Medicine, Helmholtz Zentrum München GmbH, German Research Center for Environmental Health, Neuherberg, Germany
- 3Department of Radiation Physics, The University of Texas MD Anderson Cancer Center, Houston, TX, United States
- 4Graduate School of Biomedical Sciences, University of Texas, Houston, TX, United States
Background: The mechanism responsible for the FLASH effect remains undetermined yet critical to the clinical translation of FLASH radiotherapy. The potential role of intertrack interactions in the FLASH effect, arising from the high spatio-temporal concentrations of particle tracks at UHDRs, has been widely discussed but its influence is unknown.
Methods: We construct an analytical model of the distribution, diffusive evolution, and chemical interaction of particle tracks in an irradiated target. We fit parameters of the model to Monte Carlo (MC) simulations of electron tracks, and include the effects of scavenging capacities of different target media. We compare the model’s predictions to MC simulations of many interacting electron tracks, and use the comparison to predict the prevalence of intertrack interactions in the parameter space where the FLASH effect is observed in vivo, and where differential reactive species (RS) yields have been observed in aqua.
Results: MC simulations of interacting electron tracks demonstrate negligible changes in RS yields at 12 Gy both in oxygenated water and in cellular scavenging conditions, but significant changes at 58 Gy in oxygenated water. The model fits well to the simulation data, and predicts that pulse doses
Conclusion: The results of the MC simulations indicate that intertrack interactions do not play a role in the parameters space where the FLASH effect is observed. However, potentially critical limitations in the simulations performed provide the possibility that intertrack interactions occur much more readily than predicted. More accurate simulations, as well as experimental characterization of RS yields across the pulse parameter space, are necessary to more confidently confirm or deny the role of intertrack interactions in the FLASH effect.
1 Introduction
The past decade has witnessed a surge in investigations into the effects of high dose rate irradiation on tissue toxicity. Many in vitro and in vivo studies have reported a “FLASH effect”, that is, normal tissue sparing by irradiation at ultra-high dose rates (UHDRs,
The time scale of FLASH irradiations hints at the source of the FLASH effect. Induction of the FLASH effect has been linked to a decrease in the overall irradiation time to less than 0.5 s. Examining the spatial and temporal separation of particle tracks for a typical electron FLASH delivery1, direct physical interactions of individual tracks, which take place in ps after irradiation and in a few nm around each track, are probably unaffected. Biological responses, although certainly subsequently affected by FLASH irradiation, are also unlikely to be the direct source of the FLASH effect, as they occur at much larger time scales (e.g., after ms for DNA repair [6]). Chemical interactions though, which take place on the ns − ms and μm scales, could be sensitive to this change in beam parameters. This hypothesis is supported by a long history of experiments demonstrating a dose rate dependence of chemical radiolysis yields in water in this parameter space [7]. However, the effect of the cellular chemical environment on these reactions as opposed to a pure water environment must not be neglected [7].
Many potential chemical mechanisms of normal tissue sparing at UHDR have since been proposed, mostly pertaining to the modified reaction kinetics of radiolytic reactive species between CDRs and UHDRs [8–18]. Theoretical models and experimental data have been presented to both support and refute these mechanisms, although no proposed mechanism has been proven valid to date [19, 20].
From a chemical perspective, irradiation of a biological target comprises the spatially and temporally separated arrival of multiple particle tracks, each consisting of a trail of radiolytic reactive species (RS) (Figure 1). The RS of a track diffuse and interact with each other and their immediate environment (e.g., water, dissolved oxygen, cellular antioxidants, cellular macromolecules), resulting in the simultaneous spatial expansion and concentration decay of the track (Figure 2). Traditionally, at CDRs, each track is assumed to evolve independently of other tracks; i.e., the chemical influence of the track on its immediate environment does not affect that of any other tracks as their arrivals are greatly separated by time. However, at UHDRs, the temporal separation of tracks is substantially reduced, and the assumption that individual tracks evolve independently of each other breaks down [12, 22]. In this case, the effect of one track on its immediate environment may indirectly affect the dynamics of a following or neighboring track by, for example, transient local oxygen depletion. Alternatively, the RS of one track may directly interact with the RS of another track (intertrack interaction). In either case, the resulting chemical yields no longer depend solely on the deposited dose, but now also depend on the dose rate.
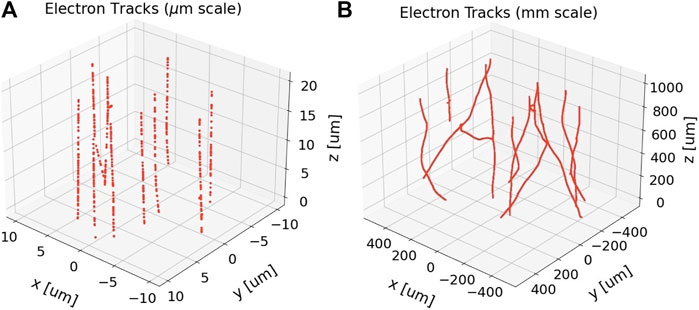
FIGURE 1. Reactive species (red points) produced by 10 uniformly-randomly distributed 1 MeV electron tracks at 1 ps after passage of the primary electrons, before any species diffusion processes are simulated. The electrons were set to impinge on a cylindrical simulation volume with length and diameter both at (A) 20 μm and (B) 1 mm. The beam axis is the z-axis. This energy was chosen owing to the high-energy limit of 1 MeV of the electron physics processes in the simulation toolkit used, TOPAS n-Bio [21], but is nonetheless clinically relevant as higher energy electrons would have even straighter tracks. The differences in straightness along each track at these different spatial scales is evident. For reference, the particle fluence depicted in (A) is approximately 2.5 × 10⁵ times lower than the expected particle fluence from 10 Gy in the whole brain irradiation study by Montay-Gruel et al. [5].
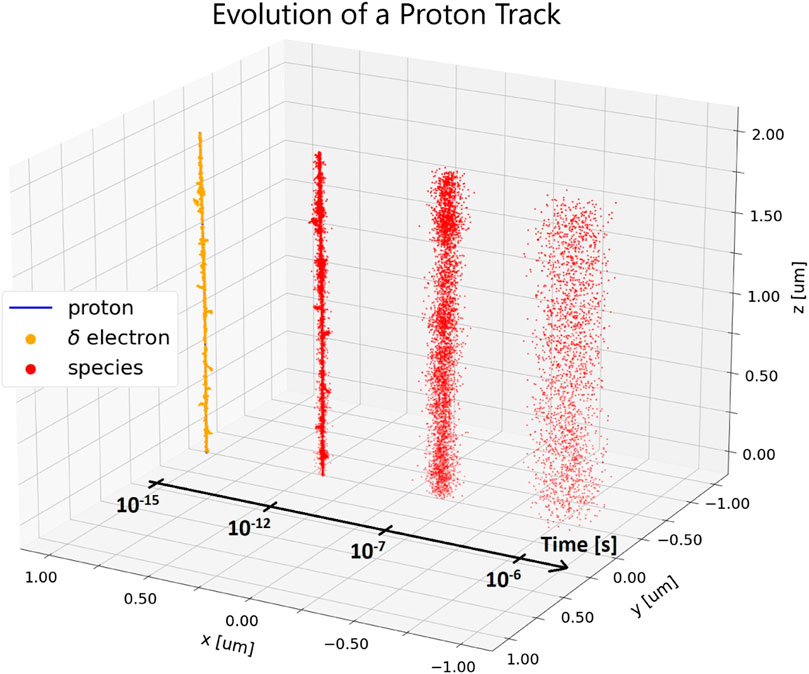
FIGURE 2. A small section of a simulated proton track in a 2 μs side length pure water cube. The energy and LET of the proton within this volume are 1 MeV and 26 keV/μm, respectively. At 10−15s, the individual ionization events of the primary proton (blue, hidden) and its secondary electrons (yellow) are shown. Reactive species (red) created by these ionization events are shown undergoing thermal diffusion at different time points (10−12s - 10−6s). The track is shifted spatially along the x-axis for each time point for better visualization. The beam axis is the z-axis. Simulations were performed with TOPAS n-Bio [21].
Discussion of intertrack effects on high dose rate radiation chemistry [23–25] began long before its more recent discussions in the context of a FLASH mechanism [12, 22, 26–31]. The effect is commonly investigated by Monte Carlo (MC) simulation of varying spatio-temporal distributions of particle tracks and their resulting RS yields [22, 29, 31]. MC simulations suffer from high computational load, often limiting the extent of the analyses to short time scales (≤1 μs), which may neglect relevant interactions of longer-lived RS, and to small spatial scales of only a few adjacent tracks, neglecting the full 3D distribution of tracks and their overlaps. MC simulations are also typically done in a pure water medium, neglecting the chemical scavenging effects of the full cellular environment.
Here, we seek to answer the question of to what extent intertrack interactions occur in the parameter space where the FLASH effect is observed. Our model addresses the shortcomings of the aforementioned approaches by 1) taking an analytical approach, thereby avoiding the computational burden of MC simulations and 2) incorporating the effects of the cellular chemical environment. The spatio-temporal distribution, evolution, and interaction of tracks are presented as a function of beam parameters, and the implications of intertrack interactions on the radiation chemistry of the irradiated target are discussed.
2 Methods
We began by developing a model that geometrically describes the initial distributions of RS around tracks in an irradiated target, their evolution, and their chemical interactions. We used MC simulations of electron tracks for fitting certain parameters of this model, and we used the completed model to predict the influence of intertrack interactions in an irradiated target as a function of beam parameters (e.g., dose, dose rate, linear energy transfer [LET]) and the scavenging capacity of the target medium. Finally, we compared the model’s predictions to MC simulations of interacting tracks and to experimental data in aqua and in vivo conditions.
2.1 Development of a model of track interaction
2.1.1 Track definition
In this model, particle tracks are assumed to be perfectly straight and homogeneous along the beam axis, and can thus be described in the 2-dimensional plane orthogonal to the beam axis with the position vector
Track-track interactions are assumed to have a net reductive effect on the total number of RS, since they mostly comprise primary radical combination into secondary molecules. The track-track interaction term can be decomposed into an intratrack interaction term (where i = j) and an intertrack interaction term (where i ≠ j). Since the model follows track dynamics up till the point at which intertrack interactions become significant, it is assumed that intertrack interactions negligibly affect the evolution dynamics of individual tracks up until that point. Thus, the intertrack interaction term is neglected, and intertrack interaction is quantified separately in Section 2.1.3.
The intratrack interaction term and the environmental scavenging term, both of which contribute to a decline in the number of RS in the track, are combined into one decay term with effective decay constant ks. This is done in order to keep Eq. 1 linear and thus allow for an analytical solution. Thus, the simplified diffusion-decay reaction defining individual tracks in this model is
Setting c0 to be the initial total number of RS in the track, the solution to this partial differential equation (see Supplementary Appendix SA1) yields the PDF of an arbitrary track centered at
Here, we applied a temporal shift parameter τ0, such that the track has a finite width upon its arrival t = ti, which represents the spatial variance along the primary particle’s path.
2.1.2 Track distribution
The beam is assumed to have a constant dose rate over the exposure time T, and thus the PDF of the arrival time ti of the ith track at time t is
The expected total number of tracks on the target over time N(t) can be expressed with the total energy deposited in the target E and the average energy deposited per track Et for a target of density ρ, depth z (measured along the beam axis), and cross-sectional area A.
The LET (L = Et/z) is introduced in the last step and will depend on the radiation quality.
Assuming a spatially homogeneous beam across the target area A, the expected number of tracks within any circular area of radius R can be expressed as a fraction of the total number of tracks on the target:
The PDF of the displacement s between one arbitrary track and any other track within a radius R is given by the ratio between the area element 2πs and the total area πR2:
2.1.3 Track-track interaction
The quantification of track-track interaction is a critical component of this model. A measure is needed that accounts for the spatial variations of different tracks, and reflects a physical quantity relevant to the radiation chemistry at hand. To this end, first the interaction rate ω is first defined, which yields the rate of change of the quantity of species at time t due to the interaction of two tracks assuming second order reactions with reaction rate kr.
Different reaction rates will be specified for intertrack interactions kr,inter and intratrack interaction kr,intra.
Integrating the interaction rate in Eq. 11 over time yields the total track-track conversion I, which represents the net change in the quantity of species due to the interaction over the relevant time period:
I is the measure of interest in this model, as it represents an empirically measurable quantity.
2.1.4 Intertrack interaction
The expected interaction rate of an arbitrary track a with all neighboring tracks within an interaction volume of radius R can be found by multiplying the number of tracks inside that interaction volume NR by the expected interaction rate between one arbitrary track and another within that volume:
The total intertrack conversion of all tracks in the target volume is then
where R approaches infinity under the assumption that each track is effectively within an infinite isotropic volume. The factor
Evaluating this expression (see Supplementary Appendix SA2) yields
where
and Γ(s, x) is the incomplete upper gamma function given by
2.1.5 Intratrack interaction
The total intratrack conversion across the entire target volume is simply a sum of each track’s self-interaction
This expression can be simplified with a suitable approximation, removing the need for tedious summation over all tracks. A track’s outward diffusion means that the amount of intratrack conversion of a single track asymptotically converges over time to a maximum value. If the time it takes for the amount of conversion to almost fully converge is negligible relative to the total exposure time, the total intratrack conversion can be approximated as a linear increase over the exposure time towards the total maximum amount of intratrack conversion of all tracks on the target.
If the convergence time is long relative to the total exposure time, this approximation will underestimate the amount of intratrack interaction at short time scales, but will converge on the correct value at longer time scales.
2.1.6 Quantifying the influence of intertrack interaction
Although Iinter gives the absolute effect of intertrack interaction, we were interested in quantifying its relative effect on the total ongoing radiation chemistry, which normally consists of only intratrack interactions. We therefore calculated the relative change that intertrack interactions cause to the total radiation chemistry.
Φ(t) thus remains 0 until intertrack interactions begin to affect the radiation chemistry; once Φ(t) has surpassed some critical value Φc, we may consider intertrack interactions to be significant. Φ(t) is the main measure of interest in this model.
Evaluating this measure with Eqs 7, 14, 18 yields
where
K = kr,inter/kr,intra is the ratio of reaction rates between intertrack and intratrack interactions, and Γ(s, x) is defined as in Eq. 17. Table 1 summarizes all variables and their definitions.
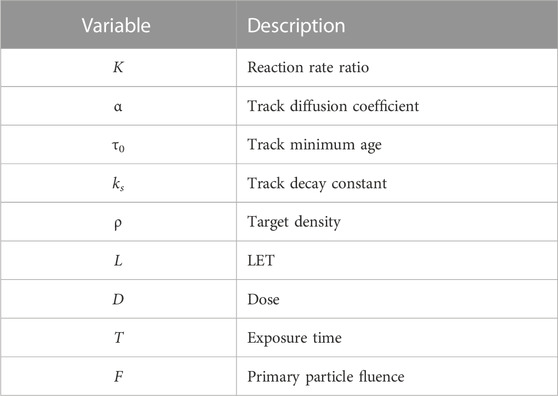
TABLE 1. Variables described in this model.
The primary particle fluence can be expressed using Eq. 7 as.
The value of Φ(t) for t ≫ T is of interest for analyzing the final ratio of intertrack-to-intratrack interactions after all tracks have decayed and no more interactions can occur. This value, using Eqs 24, 27, is given by.
where
2.2 Consideration of pulsed beams
UHDR beamlines are often pulsed, which contrasts with the constant dose rate assumption of the model detailed in Section 2.1.2. For example, linear accelerators typically deliver electrons in microsecond-long pulses with pulse repetition frequencies, f, on the order of 10–100 Hz. Intertrack interaction may occur within each pulse, but may also occur between pulses if the time between pulses is shorter than the decay of tracks, i.e., if 1/f is of the same order of magnitude or smaller than the effective track decay constant ks. However, as shown in Section 3.2, typically ks ≫ 1/f and it is safe to assume that no intertrack interaction occurs between pulses. In that case, each pulse can be considered independently of the other pulses, and the dose per pulse Dp and pulse width w become the only relevant parameters with regards to intertrack interaction. This concept is considered in the model by viewing each pulse as an effectively constant-dose-rate exposure with a duration T = w and a dose D = Dp.
2.3 Monte Carlo simulation
MC simulations were performed with the MC radiolysis toolkit TOPAS n-Bio [21] to estimate values of the model parameters α, τ0, and ks, which modulate the radial diffusion and the decay rate of each track. A 1 MeV electron beam was set to impinge on the face of a cylindrical target volume made of anoxic water. The depth and diameter of the target volume differed for different simulations depending on the type of analysis needed and the amount of computational load. The beam’s average energy loss through the water volume in all cases was negligible. The physics modules g4em-dna was used to simulate the physical interactions of the beam with the target, and the step-by-step chemistry module TsEmDNAChemistryExtended was used to simulate the production, diffusion, and interaction of resulting RS through the end of the chemical stage (1 μs). The simulation time steps were set as follows: 1 ps for the first 1 ns, then 10 ps until 10 ns, 100 ps until 100 ns, and 1 ns until the end of the simulation at 1 μs. Replicate simulations were performed with different random seeds; the mean and its standard error across these replicates is reported in the subsequent analysis for any computed values.
Although the simulation medium was pure water, the effects of scavenging in different target media were simulated by removing select RS at a specified rate throughout the simulation; the resulting reaction product was not simulated and thus did not undergo subsequent reactions. Table 2 details these different scavenging modes. The complete spectrum of RS and their reactions included in the TOPAS n-Bio chemistry module were simulated; however, only a select few RS were considered in the subsequent analysis in order to focus the analysis on the RS deemed most important for biological damage. These selected RS are: •OH,
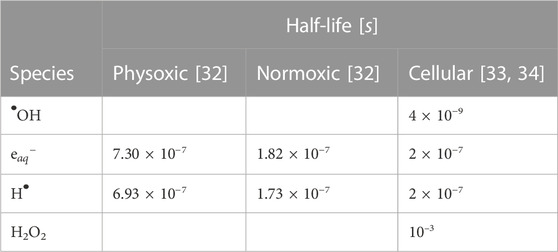
TABLE 2. Simulated half-lives of reactive species (RS) for different scavenging modes. The physoxic and normoxic scavenging modes represent pure water at 4% and 21% O2, respectively. The half-life τ1/2 is related to the first-order scavenging rate k by: k ⋅ τ1/2 = ln (2). Empty values indicate no scavenging reaction was defined for that species.
2.3.1 Simulation of a single particle track
To analyze the spatio-temporal evolution of a single track, modulated by the model parameters α and τ0, the radial variance of the first 1 μm of a simulated track in a 10 μm diameter water volume is compared with its variance over time as predicted by the model: 2α(t + τ0). Only the first 1 μm of the simulated track is analyzed to avoid the effects of beam straggling deeper in the target, which would erroneously affect the analysis of the track’s variance due to RS diffusion.
To analyze the decay in number of RS caused by the combination of intratrack interactions and scavenging, modulated by the model parameter ks, the number of RS of the first 20 μs of the simulated track in a 10 μm diameter water volume is compared with the model’s simplified decay term,
2.3.2 Simulation of interacting particle tracks
MC simulations of multiple particles and their interacting tracks were performed to compare with the model’s estimation of intertrack interaction. The impinging particles were distributed uniformly randomly across the face of the 1 μs diameter, 1 μs deep cylindrical target volume. Other than the stated differences, all other simulation parameters remained equal to those in the aforementioned simulations (Section 2.3.1). Two different doses, 12 Gy and 58 Gy, were simulated by adjusting the number of primary electrons to 393 and 1963, respectively. The CPU times for these simulations are reported in Table 3. The exposure time did not vary because within TOPAS n-Bio, all tracks arrive in the target simultaneously, yielding an effectively infinite dose rate. These simulations were repeated for all three scavenging modes.
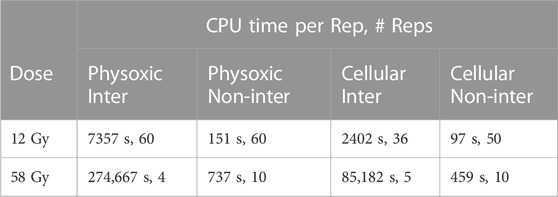
TABLE 3. The number of replicate simulations and the average CPU time per replicate for different simulation modes. ‘Inter’ and Non-inter’ refer to the interacting and non-interacting simulations respectively.
Two otherwise identical simulations were performed: one in which tracks were simulated independently of one another and thus unable to interact, and one in which all tracks were simulated together, such that tracks were able to chemically interact. These simulation modes are referred to as ‘non-interacting’ and ‘interacting’, respectively. The ‘non-interacting’ simulations represent the radiation chemistry at the low-dose-rate limit, where interactions consist only of intratrack and scavenging interactions. The ‘interacting’ simulations add on the effects of intertrack interactions. The number of RS in each simulation type was recorded over time and compared.
3 Results
An analytical model was developed that describes the spatio-temporal distribution of RS in a particle track, the spatio-temporal distribution of multiple particle tracks in a target as a function of beam parameters, and the expected values of intertrack and intratrack interaction as a function of time during and after irradiation. The model measures the influence of intertrack interactions with the variable Φ, which gives the ratio between the amount of intertrack and intratrack interaction during and after an irradiation. Φ is initially 0, but grows as intertrack interaction begins to increase.
3.1 Model parameter dependencies
Eq. 29 demonstrates that the final value Φ approaches after an irradiation of exposure time T, Φt≫T, depends on only two physical beam parameters: the fluence F and the exposure time T, which respectively yield the spatial and the temporal separation of tracks. The fluence then depends on the dose and the LET as expressed in Eq. 27. All other dependencies pertain to parameters specific to the track or target: the reaction rate ratio between intertrack and intratrack reactions K, the track diffusion constant α, the minimum track age τ0, and the effective track decay constant ks (which may depend on the target medium).
Φt≫T is linearly dependent on K and α, and increases with increasing τ0 or decreasing ks. Numerical values of α and τ0 can be easily estimated by fitting the radial variance of the model’s track to that of MC simulations (Section 3.2). ks can be fit in a similar fashion (Section 3.2), although it could vary widely depending on which RS are being considered and on the scavenging capacity of the target. Thus, results are shown for different values of ks to better understand its effect on Φt≫T. A numerical value of K is difficult to determine, as it effectively represents all differences in reaction dynamics between intertrack and intratrack interactions for which the model does not otherwise account, which likely depends on the RS considered, the scavenging capacity of the target, and even the amount of intertrack interaction that occurs. We thus left K as a free model parameter to be fit to experimental data.
Focusing on the beam parameter dependencies, Φt≫T is essentially controlled by the spatial and the temporal concentration of tracks; an increase in either increases Φt≫T. The spatial concentration is modulated by the fluence F, which is linearly dependent on the dose D and inversely dependent on the LET L. A higher LET beam requires fewer particles, and thus fewer tracks, to achieve the same dose, resulting in less intertrack interaction. The temporal concentration is determined solely by T; Φt≫T strictly decreases with increasing T.
Figure 3A depicts the dependence of Φt≫T on T for a constant dose (the dose rate is given by D/T). Φt≫T increases from 0 as the dose rate increases but eventually reaches an asymptotic plateau at very high dose rates. This occurs once all tracks arrive almost instantaneously relative to their decay lifetimes. Here, the amount of intertrack interaction is limited solely by their spatial separation and is unaffected by any further increase in dose rate. An increasing ks delays the onset of intertrack interaction and diminishes its final asymptotic value as tracks decay more quickly before interacting. This plateau occurs in all cases, but is only visible in this figure for the higher LET.
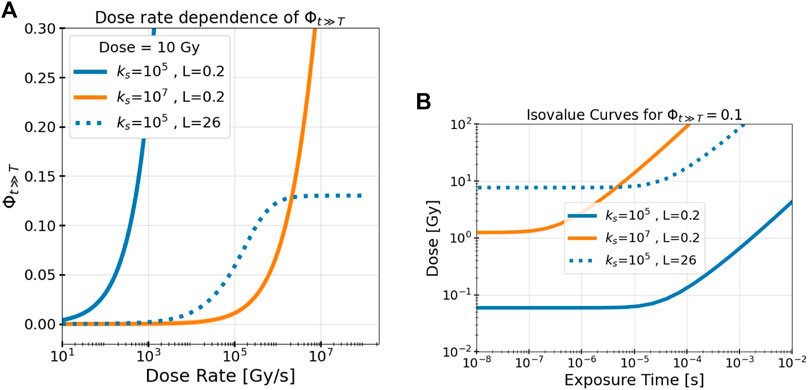
FIGURE 3. The model’s measure of intertrack interaction, Φt≫T, depends on the dose, the dose rate, the LET L, and the effective track decay constant ks. (A) Dose rate dependence of Φt≫T and (B) isovalue curves at Φt≫T = 0.1 for different values of ks and L illustrate these dependencies. Results are shown for different track decay constants ks (indicated by color, given in s−1) and beam LET (indicated by line style, given in keV/μm).
To visualize the space and time dependencies of Φt≫T simultaneously, Figure 3B depicts the isovalue curve where Φt≫T = 0.1 over the dose/exposure time parameter space for different values of ks and L. The isovalue of 0.1 represents where 10% of the interactions of RS are between tracks, but notably these results are shown only to demonstrate the beam parameter dependencies; the precise location of the isovalue curve also depends on the values of other model parameters (K, α, τ0, and ks) which are determined in the following section. Evidently, for any set of irradiation parameters, there is a minimum dose (fluence) and a maximum exposure time necessary to achieve a given value of intertrack interaction. Again, as in Figure 3A, once the temporal separation is low enough, there is no more dependency on the temporal domain and only a dose dependency remains.
3.2 Model parameter fitting to simulations
MC simulations of a 1 MeV electron track were obtained to determine numerical values for the model parameters describing the spatio-temporal evolution of a track, α and τ0, and the rate of decay of the track, ks. Figure 4A depicts the radial variance of a simulated track over time compared with the model’s prediction with the fitted model parameters α and τ0. These results differ slightly for different scavenging modes (see Table 4) but remain good fits to the simulation data in all cases. The minimum track age parameter τ0 clearly improves the model’s description of the track, especially at short time scales.
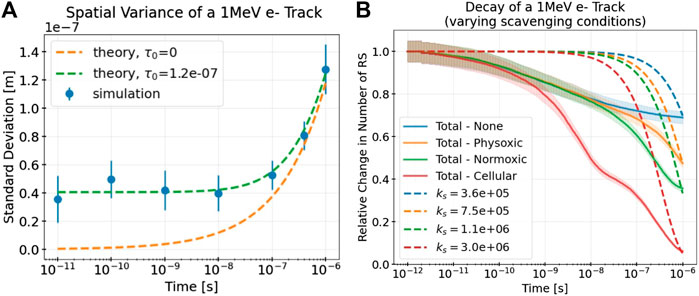
FIGURE 4. (A) Standard deviations of the radial displacements (a measure of radial track width) of select RS (•OH,
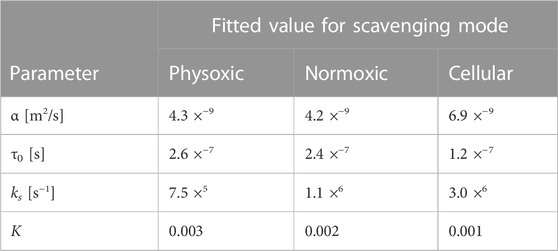
TABLE 4. Best fit values for different model parameters for different scavenging modes (see Table 2) based on MC simulations of a single track (for α and τ0 and ks) and of multiple interacting tracks (for K).
Figure 4B depicts the decay in number of RS of the simulated track due to intratrack interactions and scavenging and compares this decay with the decay as predicted by the exponential decay term of the model, with different effective decay constants ks. Even with no simulated scavenging reactions (see the line labeled “None”), the track still decays owing to intratrack recombination. As expected, the higher the simulated levels of scavenging, the larger the decay and thus the larger the corresponding value of ks. Notably, even in the cellular scavenging mode, the track does not completely decay within nanoseconds because several different RS are being tracked, some of which are long-lived.
The values of ks were chosen to best match the simulated decay at the longest simulated time of 10−6s. As the plot is depicted with a logarithmic time scale, this long time scale value is close to what the simulated decay converges to, despite the seemingly rapid declines seen in the plot. Clearly, the exponential decay term underestimates the simulated decay at short time scales, because of rapid initial intratrack recombination, and overestimates it at longer time scales. This is preferable, however, because the relative error of this initial underestimation does not exceed 50% at any time point, even for the highest scavenging levels (cellular). On the other hand, a better fit at short time scales would result in a severe, orders of magnitude larger overestimation of the decay at longer time scales owing to the nature of exponential decay.
3.3 Model comparison to simulations of interacting tracks
3.3.1 Simulation results
MC simulations of many interacting tracks were used for comparison with the model’s estimation of influence of intertrack interaction. This was repeated for two doses, 12 Gy and 58 Gy, and all three scavenging modes. Figures 5A, B show the numbers of the different RS of interest during a simulation where tracks were not allowed to interact (solid lines) or allowed to interact (dotted lines). Results are shown here only for the 58 Gy simulations and the physoxic and cellular scavenging modes. The normoxic scavenging mode results tended to lie between the physoxic and cellular results (Supplementary Appendix SA3, Supplementary Figures S7A, B), whereas the 12 Gy simulation showed far smaller differences between the interacting and non-interacting simulations for all scavenging modes.
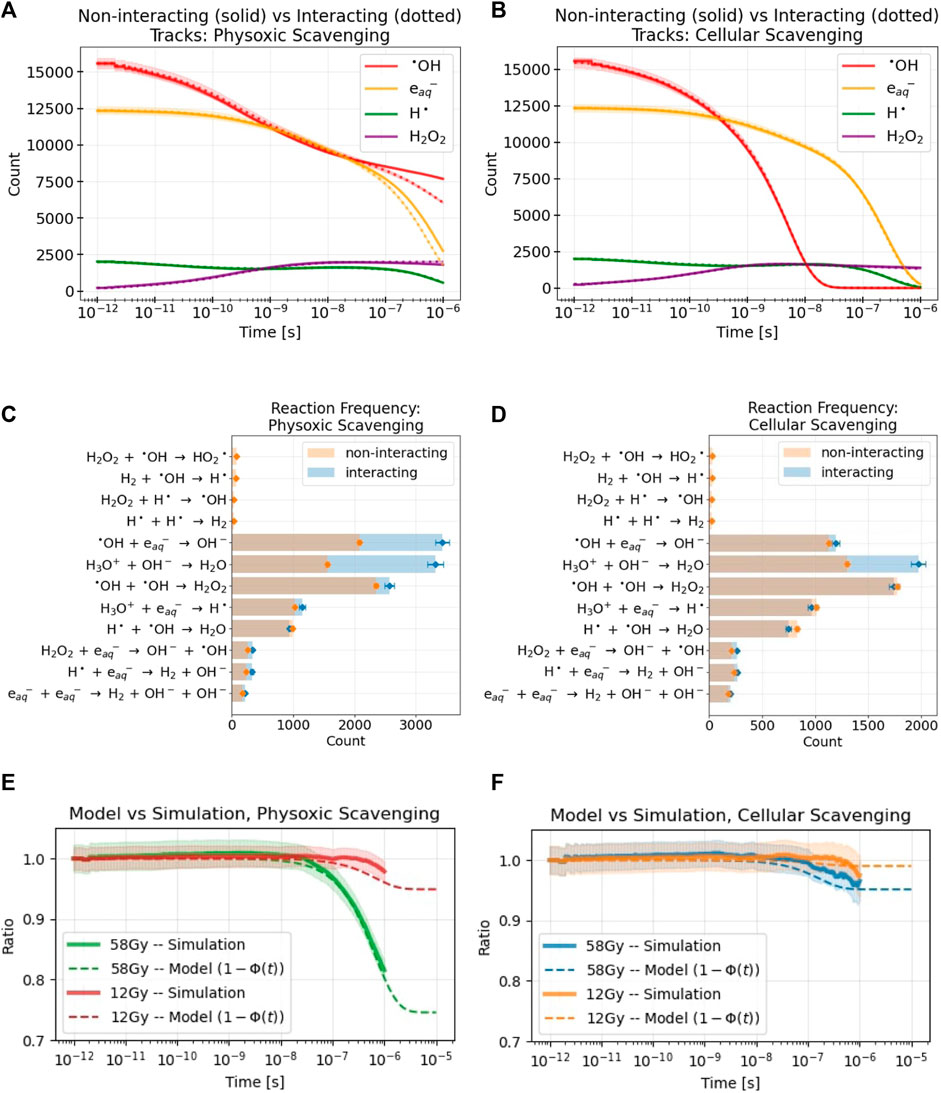
FIGURE 5. Results are shown from MC simulations of multiple tracks delivering 58 Gy to a water volume under physoxic (A,C,E) and cellular (B,D,F) scavenging conditions. For all simulation results, the standard error across replicate simulations is denoted with either shaded regions (A,B,E,F) or error bars (C,D). (A,B) the difference in yields of select RS over time between non-interacting tracks (solid lines) and interacting tracks (dotted lines) simulations (C,D) The frequencies of different reactions between the two simulation types. The background scavenging that removes select RS at a specified rate (see Table 2) is not included in this plot. Also, any reaction occurring less than 20 times during the simulation was omitted (E,F) Comparison of the simulation results, the ratio of sums of the counts of the RS between the interacting and non-interacting tracks simulations shown in (A,B), for both simulated doses to the model’s analogous measure. The model parameter K was used to fit the model’s results to the simulation’s with values of 0.003 and 0.001, respectively. Although the simulations were stopped at 10−6s, the model results are shown to 10−5s to examine the value that 1− Φ finally approaches. Values for the model parameters used in these results are listed in Table 4.
For the physoxic scavenging mode, intertrack interactions resulted in a decrease in the yields of •OH and
3.3.2 Comparison to model
To compare the simulation results with those of the model, the ratio of the sums of the RS of the two simulation types shown in Figures 5A, B are taken and depicted by the solid lines with shaded in errors in Figures 5E, F. This ratio is a measure of the influence of intertrack interactions; it yields the relative difference of the RS counts caused solely by intertrack interactions. At very short time scales, this ratio remains 1 as there is no difference between the simulation types. At longer time scales, once intertrack interactions begin to affect RS yields, this ratio deviates from 1. Unsurprisingly, the higher the dose and the lower the amount of scavenging, the larger the effect of intertrack interactions. Notably, the slight deviation from 1 in the cellular scavenging results is almost entirely due to the change in H3O+ yields, as shown in Figure 5D. Results for the normoxic scavenging mode are not shown for brevity; as expected, they tended to fall between the results of the cellular and physoxic scavenging modes, remaining closer to the physoxic results (Supplementary Appendix SA3, Supplementary Figure S7C).
This ratio is directly compared with an analogous measure from the model, that is, 1 − Φ(t). The ratio aligns quite well with what 1 − Φ of the model actually represents based on Eq. 23. Φ is subtracted from 1 because intertrack interactions resulted in a net decrease in the number of the selected RS. The final free parameter of the model, the reaction rate ratio K, was adjusted to fit 1 − Φ to the simulation results. The variables used to calculate Φ(t) (see Eq. 24) were: T = 10−15s, L = 0.14 keV/μm, ρ = 997 kg/m3, D was adjusted to match the simulation dose, and K, α, τ0, and ks were adjusted depending on the scavenging mode to the values in Table 4. The value of T was chosen to simulate an effectively infinite dose rate since all particles arrived simultaneously in the simulation; decreasing T to even lower values had negligible effects on the resulting values of Φ(t).
3.4 Model extrapolation to experimental results
3.4.1 In aqua conditions
The model output was shown to align well with MC simulation data when fitted with the variable K = 0.001. We also performed a similar comparison, now with experimental results of H2O2 yields after electron irradiation of physoxic water. Kacem et al irradiated 4% O2 water with a pulsed electron beam in 3 different setups, which we labeled A-C, and observed a decrease in the resultant G-value of H2O2
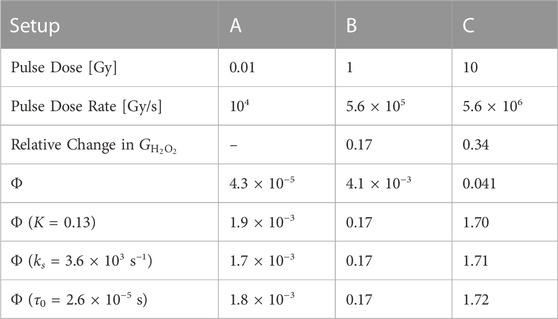
TABLE 5. Pulse parameters and the absolute value of the relative change in the G-values of H2O2 relative to Setup A for different setups of electron irradiation of physoxic water by [35]. Below these are the value of Φ for each setup calculated with the model parameters in Table 4 for physoxic conditions. Below that is the value for Φ for each setup when one model parameter is changed (indicated by the parentheses) in order to match the value of Φ at Setup B to the observed relative change in
Φ was calculated for these pulse parameters by using the values for model parameters α, τ0, ks, and K derived in the above sections for physoxic scavenging conditions, and its value is compared with the measured change in
In the case the derived values for the model parameters are off, we examined what changes to these parameters could result in a fit to this experimental data; i.e., Φ = 0.17. We saw that either increasing K, increasing τ0, or decreasing ks could yield agreement between the value of Φ and the experimentally observed changes. We are not as interested in matching the values at Setup C because we expect Φ to be overestimated as intertrack interaction increases, due to the weakly-interacting tracks assumption made in Section 2.1.1.
The pulse parameters of this study can also be visualized on the heatmap (Figure 6) introduced in the following section, which displays Φ over the pulse parameter space for cellular scavenging conditions. The heatmap of Φ for physoxic scavenging conditions looks similar, but the isovalue curve is shifted slightly down towards lower doses and to the right towards higher exposure times. The ‘corner’ of the white isovalue curve occurs in this case at 13 Gy and 2 μs for K = 0.003, and 0.3 Gy and 2 μs for K = 0.13.
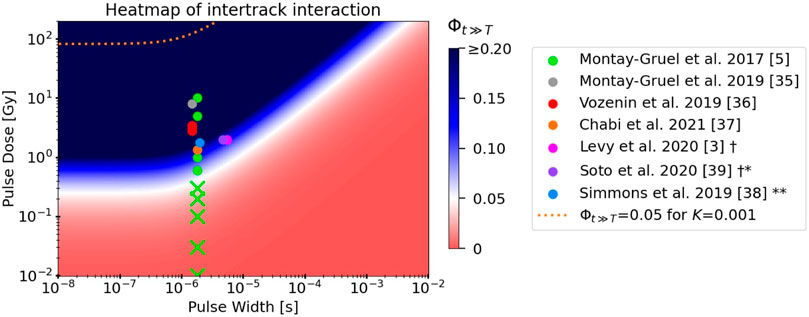
FIGURE 6. Heatmap depicting the value of Φt≫T, the model’s measure of intertrack interaction, as a function of dose per pulse and pulse width. All model parameters used reflect those of a 1 MeV electron beam in cellular scavenging conditions, except for the parameter K = 0.33 which was fitted to the experimental electron FLASH data displayed. The isovalue curve at Φt≫T = 0.05 for K = 0.001 (from fits to MC simulations) is indicated by the orange dashed line. The pulse parameters of electron FLASH studies from the literature that observed the FLASH effect (solid circles) or did not observe the FLASH effect (“Xs”) are superimposed on the heatmap [3, 5, 36–40]. The conventional dose rates in most studies involved doses per pulse that were too low to be depicted on this plot. † Both studies used the same parameters; their respective points on the plot were slightly horizontally shifted for better visualization. * FLASH normal tissue sparing was observed only for total doses ≥30 Gy ** FLASH normal tissue sparing was observed only when the pulse repetition frequency was above a certain value.
3.4.2 In vivo conditions
To compare the predictions of the model with experimental in vivo data from the literature, we used a heatmap of the value of Φ over the dose and exposure time parameter space (Figure 6). Again, by following the argument in Section 2.2, we can consider this to be the pulse dose and pulse width of each pulse in a pulsed electron delivery. Results are shown using the values for model parameters α, τ0, and ks derived in the above sections for cellular scavenging conditions, with the notable exception of K = 0.33, which was chosen as it best fits these experimental data. The white and blue regions of the heatmap indicate where the model predicts intertrack interaction to have a
4 Discussion
The model fit well to the results of the MC simulations of interacting tracks (Figures 5E, F), yielding values for the model’s fitting parameter K that were between 0.001–0.003, depending on the scavenging mode. These findings gives credence to the model’s ability to replicate the results of MC simulations, although the simulations themselves suffer from limitations (discussed in detail in Section 4.2 below). In addition, because the simulations were limited to 1 μs, it is not clear if the model fits would remain accurate beyond 1 μs to the final value of the ratio, Φt≫T. Further work on this topic should prioritize extending the simulation times to provide more accurate fits at longer time scales. Regardless, assuming that the complete model with all fitted parameters is accurate, the model predicts that intertrack interactions are completely negligible in the parameter space where 1) decreased H2O2 yields are observed (first row of values of Φ in Table 5) and 2) where the FLASH effect is observed (dashed orange line in Figure 6). In fact, the model predicts that doses per pulse in excess of 90 Gy at pulse widths ≤1 μs would be necessary for intertrack interactions to induce a consequential change in the radiation chemistry. In that case, clearly some other mechanism must be responsible for the observed UHDR effects.
Alternatively, one or a combination of the fitted model parameters could be incorrect, thus yielding erroneously low predictions of intertrack interaction. The bottom three rows of Table 5 show how an increased reaction rate ratio K, an increased minimum track age τ0, or a decreased track decay constant ks could cause the model predictions to align with the experimental data. A similar approach was taken to create the heatmap in Figure 6, where a value of K = 0.33 was chosen as it fits well to the experimental data. How these inaccurate fits could have come about is explored below (Section 4.2).
4.1 Application to FLASH RT
Before discussing the limitations of the model and simulations, we investigated the implications of the model for FLASH RT if indeed one or more of the model’s parameters were found to be inaccurate, and the updated parameter resulted in the model’s predictions aligning with what is shown in the heatmap in Figure 6. Here, the model demonstrates that induction of the FLASH effect coincides with the regions of the parameter space where intertrack interactions significantly affect the radiation chemistry, the extent of which decreases with increasing scavenging capacity. It is clear that, although the doses per pulse vary over a large range throughout the data, the range of pulse widths is very narrow because all presented data used linear accelerators. Interestingly, it appears that lowering the pulse width below ≈0.5 μs would have no benefit to increasing intertrack interactions, as they depend solely on the dose per pulse in this parameter space range.
The argument presented in Section 2.2 states that if the RS created by a pulse have all been scavenged in the ≈0.01 s that typically separate linac electron pulses, each pulse can be considered independently of the others. Although that almost certainly holds for the primary RS like •OH and
In fact, even within a single electron pulse, which has thus far been assumed to have a constant dose rate across the ≈2 μs pulse, there is a micro-pulse structure [26]. This structure is on the order of 30 ps pulses at 3 GHz, and may have serious implications for the fast reactions of species like •OH. However, one must bear in mind that the model suggests that further temporal bunching below ≈0.5 μs (the specific value will depend on the model parameters) is negligible; thus, the micro-pulse structure may be irrelevant.
Proton FLASH RT also raises similar concerns. Depending on the proton source, the pulse structure of proton delivery varies widely [26], and the potential for interpulse effects remains significant. In addition, the commonly used scanning pencil beam method of proton delivery presents a challenge to modeling intertrack interaction because of the beam’s spatial inhomogeneity [43]. Regardless, even at the infinite dose rate limit, where all protons are delivered simultaneously, the model predicts (with the simulation-derived fit parameter K = 0.001) that again doses upwards of 90 Gy would be necessary for low-LET protons, which is much higher than the doses for which the FLASH effect has been observed [44]. For higher LET protons, proportionately higher doses would be necessary. In agreement with these simulation-derived predictions, Thompson et al. observed negligible changes in radical yields in Monte Carlo simulations of interacting low-LET proton tracks at 8 Gy in pure water [31]. Again, however, the MC simulations on which these predictions are made harbor potentially critical limitations which are addressed in Section 4.2.
Lastly, even if intertrack interactions were significant in the parameter space where the FLASH effect is observed, the mechanism by which such interactions could cause differential sparing of normal and tumor tissue is not obvious. One hypothesis for this mechanism is that of reduced indirect damage due to reduced primary radical yields, like those of •OH. Alternatively, many higher order processes have been proposed [12, 16–18]. As for the differential effect, the higher scavenging capacity of tumor tissue could reduce intertrack interaction [45]. None of these proposed mechanisms indicate an effect of intertrack interactions on direct damage, responsible for
4.2 Simulation limitations
The MC simulations done for comparison with the model results also have limitations. For instance, the simulated medium is pure anoxic water. To simulate the effects of different scavenger concentrations, affected species were removed from the simulation at a given rate. However, this approach ignores the products of these reactions while also ignoring spatio-temporal inhomogeneities in the scavenger concentration, which would surely occur owing to local scavenger depletion in and near the track. Research into the FLASH mechanism continues to underscore the importance of detailed modeling of varying oxygen concentrations and other chemical differences between normal and tumor tissue, as well as morphological/structural differences between the tissue types [20, 47]. Another limitation of the MC simulations due to their inherently large computational load is the total time scale, which was limited in this case to 1 μs. Figures 5E, F indicate that intertrack interactions were perhaps only beginning to become significant at 1 μs, and carrying the simulations out to longer time scales would be quite informative. Also, because all particles arrive simultaneously, the effects of varying the dose rate could not be studied and compared with the model’s predictions.
These MC simulations also ignore some potentially critical microscopic effects of water radiolysis. Abolfath et al. demonstrated that, for example, local temperature increases in the core of particle tracks due to non-ionizing excitations of water molecules may temporarily elevate diffusion constants and reaction rates, boosting the initial radial diffusion of track RS [48]. This could be represented in the model by a significant increase in the parameter τ0, which modulates the initial width of each track. Also, interactions between RS like electrostatic shielding, which are ignored by the MC simulation, may significantly affect the ability of RS to diffuse and damage biomolecules [12].
In fact, the MC simulations quite clearly do not perfectly reflect all the chemical dynamics of water radiolysis. Kacem et al. demonstrated that increasing dose rates resulted in lower
4.3 Model outlook
In order to address the concerns of interpulse interactions, the pulse structure of proton beamlines, and the micro-pulse structure of electron linacs, the model could be adjusted relatively easily to describe pulsed beams by adjustment of Eq. 4. The model could also be edited to describe spatially inhomogeneous beams, such as in scanning pencil beams or even spatially fractionated radiation therapy. However, this would require significant reworking of the model’s foundations as the assumption of a homogeneous and isotropic radiation field significantly simplifies the model.
Currently, the model does not differentiate between different RS in a track, and instead applies effective reaction and decay constants for all different RS. This was done as a first order approximation of track interaction, without considering the different types of possible reactions and their respective rates. In order to better describe the reactions of the different RS that make up a track, the model could be bifurcated into a two-compartment model, one which describes the initial fast reaction of primary RS, and one which tracks the accumulation and interpulse interaction of longer lived RS. Alternatively, the model could track each RS individually, each with its own diffusion and reaction constants, and sum over the total amount of measured interaction.
Such an approach could also be used to model downstream reaction products, such as organic peroxides formed by primary radical reactions with cellular macromolecules. These longer lived RS, in combination with other important environmental reagents like oxygen, may play a vital role in the dose rate dependent chemical dynamics that are neglected by the current model.
5 Conclusion
An analytical model was developed that describes the spatio-temporal distribution, diffusive evolution, and chemical interaction of RS in particle tracks in an irradiated target with different scavenging capacities. The model measures the expected relative change in the radiation chemistry due to intertrack interactions with the parameter Φ. Φ increases with increasing spatial concentration of tracks, either by increasing the dose or decreasing the LET. Φ also increases with increasing temporal concentrations of tracks, but below a certain exposure time (which depends on the decay rate of the tracks), further decreases in the exposure time have no effect.
The model parameters describing the diffusive broadening of each track, as well as those describing the track’s decay due to intratrack and scavenging reactions, were fit to MC simulations of electron tracks. Significant reductions in •OH and
Multiple limitations of the simulations were presented which, if rectified, could potentially lead to much higher model predictions of intertrack interactions. In this case, intertrack interaction could coincide with the observed FLASH effect in the dose and exposure time parameter space. However, extensive follow up analysis would be necessary to verify such claims. Additionally, a complete mechanism for how intertrack interactions could result in a differential sparing effect between normal and tumor tissue remains to be elucidated.
The analysis in this work assumes pulses in a typical pulsed electron delivery from a linac can be considered independently, and thus the only important beam parameters are the pulse dose and pulse width, as all relevant RS decay in the typical times between pulses (≈10 ms). However, evidence in support of a two-step mechanism is discussed in which the initial fast reaction dynamics of primary radicals and the following, slower reaction dynamics of secondary molecules are considered separately. This consideration indicates the possibility of interpulse interactions in pulsed electron beam deliveries, whereby more beam parameters such as the pulse repetition frequency and the number of pulses would become important.
Data availability statement
The raw data supporting the conclusion of this article will be made available by the authors, without undue reservation.
Author contributions
AB wrote the manuscript, performed the mathematical derivations and computational simulations, and prepared all figures. The rest of the authors contributed to the development of the model and the discussion of the results. All authors contributed to the article and approved the submitted version.
Funding
The authors acknowledge funding from the German Research Foundation (Deutsche Forschungsgemeinschaft, DFG) through the Emmy Noether Programme (grant number 416790481 and the research grant 389238549), from the DFG Research Training Group 2274 (grant number 299102935), and from the Klinikum rechts der Isar of the Technical University of Munich.
Acknowledgments
We thank Christine F. Wogan, MS, ELS, of MD Anderson’s Division of Radiation Oncology, for editorial contributions to this article.
Conflicts of interest
The authors declare that the research was conducted in the absence of any commercial or financial relationships that could be construed as a potential conflict of interest.
Publisher’s note
All claims expressed in this article are solely those of the authors and do not necessarily represent those of their affiliated organizations, or those of the publisher, the editors and the reviewers. Any product that may be evaluated in this article, or claim that may be made by its manufacturer, is not guaranteed or endorsed by the publisher.
Supplementary material
The Supplementary Material for this article can be found online at: https://www.frontiersin.org/articles/10.3389/fphy.2023.1215422/full#supplementary-material
Footnotes
1For comparison, we examine an in vivo study by Montay-Gruel et al. in which mice were exposed to a total of 10 Gy from a 100 Hz, 1.8 μs pulse-width pulsed electron beam [5]. Induction of the FLASH effect was observed when the beam parameters changed from roughly 50 0.2 Gy pulses to 17 0.6 Gy pulses. From the dimensions of the target we can estimate an average deposition of 1.28 nGy per primary electron. Within each pulse, this corresponds to an increase of 6–19 electrons per μm−2 and 87 to 260 electrons per ps. The temporal spacing between pulses remained constant at 10 ms.
References
1. Favaudon V, Caplier L, Monceau V, Pouzoulet F, Sayarath M, Fouillade C, et al. Ultrahigh dose-rate FLASH irradiation increases the differential response between normal and tumor tissue in mice. Sci translational Med (2014) 6(245):245ra93. doi:10.1126/scitranslmed.3008973
2. Bourhis J, Montay-Gruel P, Jorge PG, Bailat C, Petit B, Ollivier J, et al. Clinical translation of FLASH radiotherapy: Why and how? Radiother Oncol (2019) 139:11–7. doi:10.1016/j.radonc.2019.04.008
3. Levy K, Natarajan S, Wang J, Chow S, Eggold JT, Loo PE, et al. Abdominal FLASH irradiation reduces radiation-induced gastrointestinal toxicity for the treatment of ovarian cancer in mice. Scientific Rep (2020) 10(1):21600–14. doi:10.1038/s41598-020-78017-7
4. Montay-Gruel P, Acharya MM, Gonçalves Jorge P, Petit B, Petridis IG, Fuchs P, et al. Hypofractionated FLASH-RT as an effective treatment against glioblastoma that reduces neurocognitive side effects in mice. Clin Cancer Res (2021) 27:775–84. doi:10.1158/1078-0432.ccr-20-0894
5. Montay-Gruel P, Petersson K, Jaccard M, Boivin G, Germond JF, Petit B, et al. Irradiation in a flash: Unique sparing of memory in mice after whole brain irradiation with dose rates above 100 Gy/s. Radiother Oncol (2017) 124(3):365–9. doi:10.1016/j.radonc.2017.05.003
6. Joubert A, Foray N. Repair of radiation-induced DNA double-strand breaks in human cells: History, progress and controversies. New Res DNA Repair (2006) 2006. Published online. doi:10.1016/j.dnarep.2007.11.008
7. Wardman P. Radiotherapy using high-intensity pulsed radiation beams (FLASH): A radiation-chemical perspective. Radiat Res (2020) 194(2020):607–17. doi:10.1667/RADE-19-00016
8. Adrian G, Konradsson E, Lempart M, Bäck S, Ceberg C, Petersson K. The FLASH effect depends on oxygen concentration. Br J Radiol (2020) 92(1106):20190702. doi:10.1259/bjr.20190702
9. Petersson K, Adrian G, Butterworth K, McMahon SJ. A quantitative analysis of the role of oxygen tension in FLASH radiation therapy. Int J Radiat Oncology* Biology* Phys (2020) 107(3):539–47. doi:10.1016/j.ijrobp.2020.02.634
10. Pratx G, Kapp DS. A computational model of radiolytic oxygen depletion during FLASH irradiation and its effect on the oxygen enhancement ratio. Phys Med Biol (2019) 64(18):185005. doi:10.1088/1361-6560/ab3769
11. Durante M, Bräuer-Krisch E, Hill M. Faster and safer? FLASH ultra-high dose rate in radiotherapy. Br J Radiol (2018) 91(1082):20170628. doi:10.1259/bjr.20170628
12. Abolfath R, Grosshans D, Mohan R. Oxygen depletion in FLASH ultra-high-dose-rate radiotherapy: A molecular dynamics simulation. Med Phys (2020) 47(12):6551–61. doi:10.1002/mp.14548
13. Ling CC. Time scale of radiation-induced oxygen depletion and decay kinetics of oxygen-dependent damage in cells irradiated at ultrahigh dose rates. Radiat Res (1975) 63(3):455–67. doi:10.2307/3574097
14. Zakaria AM, Colangelo NW, Meesungnoen J, Azzam EI, Plourde MÉ, Jay-Gerin JP. Ultra-high dose-rate, pulsed (FLASH) radiotherapy with carbon ions: Generation of early, transient, highly oxygenated conditions in the tumor environment. Radiat Res (2020) 194(6):587–93. doi:10.1667/rade-19-00015.1
15. Spitz DR, Buettner GR, Petronek MS, St-Aubin JJ, Flynn RT, Waldron TJ, et al. An integrated physico-chemical approach for explaining the differential impact of FLASH versus conventional dose rate irradiation on cancer and normal tissue responses. Radiother Oncol (2019) 139:23–7. doi:10.1016/j.radonc.2019.03.028
16. Jansen J, Knoll J, Beyreuther E, Pawelke J, Skuza R, Hanley R, et al. Does FLASH deplete oxygen? Experimental evaluation for photons, protons, and carbon ions. Med Phys (2021) 48:3982–90. doi:10.1002/mp.14917
17. Koch CJ. Re: Differential impact of FLASH versus conventional dose rate irradiation: Spitz et al. Radiother Oncol (2019) 139:62–3. doi:10.1016/j.radonc.2019.07.004
18. Labarbe R, Hotoiu L, Barbier J, Favaudon V. A physicochemical model of reaction kinetics supports peroxyl radical recombination as the main determinant of the FLASH effect. Radiother Oncol (2020) 153:303–10. doi:10.1016/j.radonc.2020.06.001
19. Limoli CL, Vozenin M-C. Reinventing radiobiology in the light of FLASH radiotherapy. Annu Rev Cancer Biol (2023) 7:1–21. doi:10.1146/annurev-cancerbio-061421-022217
20. Del Debbio F, Maria Sofia B, Gonnelli A, Da Pazzo E, Tozzini V, Martini C, et al. An insight into hypothesized biological mechanisms contributing to the Flash effect. Front Phys (2023) 11:396. doi:10.3389/fphy.2023.1201708
21. Schuemann J, McNamara AL, Ramos-Méndez J, Perl J, Held KD, Paganetti H, et al. TOPAS-nBio: An extension to the TOPAS simulation toolkit for cellular and sub-cellular radiobiology. Radiat Res (2019) 191(2):125–38. doi:10.1667/rr15226.1
22. Ramos-Méndez J, Domínguez-Kondo N, Schuemann J, McNamara A, Moreno-Barbosa E, Faddegon B. LET-dependent intertrack yields in proton irradiation at ultra-high dose rates relevant for FLASH therapy. Radiat Res (2020) 194(4):351–62. doi:10.1667/rade-20-00084.1
23. Anderson AR, Hart EJ. Radiation chemistry of water with pulsed high intensity electron Beams1. J Phys Chem (1962) 66:70–5. doi:10.1021/j100807a014
24. Shiraishi H, Katsumura Y, Hiroishi D, Ishigure K, Washio M. Pulse-radiolysis study on the yield of hydrated electron at elevated temperatures. J Phys Chem (1988) 92:3011–7. doi:10.1021/j100321a061
25. Kreipl MS, Friedland W, Paretzke HG. Interaction of ion tracks in spatial and temporal proximity. Radiat Environ Biophys (2009) 48(4):349–59. doi:10.1007/s00411-009-0234-z
26. Kim MM, Darafsheh A, Schuemann J, Dokic I, Lundh O, Zhao T, et al. Development of ultra-high dose-rate (FLASH) particle therapy. IEEE Trans Radiat Plasma Med Sci (2021) 6(3):252–62. doi:10.1109/trpms.2021.3091406
27. Boscolo D, Scifoni E, Durante M, Krämer M, Fuss MC. May oxygen depletion explain the FLASH effect? A chemical track structure analysis. Radiother Oncol (2021) 162:68–75. doi:10.1016/j.radonc.2021.06.031
28. Lai Y, Jia X, Chi Y. Modeling the effect of oxygen on the chemical stage of water radiolysis using GPU-based microscopic Monte Carlo simulations, with an application in FLASH radiotherapy. Phys Med Biol (2021) 66(2):025004. doi:10.1088/1361-6560/abc93b
29. Alanazi A, Meesungnoen J, Jay-Gerin JP. A computer modeling study of water radiolysis at high dose rates. Relevance to FLASH radiotherapy. Radiat Res (2021) 195(2):149–62. doi:10.1667/rade-20-00168.1
30. Zhu H, Li J, Deng X, Qiu R, Wu Z, Zhang H. Modeling of cellular response after FLASH irradiation: A quantitative analysis based on the radiolytic oxygen depletion hypothesis. Phys Med Biol (2021) 66(18):185009. doi:10.1088/1361-6560/ac226d
31. Thompson SJ, Prise KM, McMahon SJ. Investigating the potential contribution of inter-track interactions within ultra-high dose-rate proton therapy. Phys Med Biol (2023) 68:055006. doi:10.1088/1361-6560/acb88a
32. Buxton GV, Greenstock CL, Helman WP, Ross AB. Critical Review of rate constants for reactions of hydrated electrons, hydrogen atoms and hydroxyl radicals (OH/O- in Aqueous Solution. J Phys Chem reference Data (1988) 17(2):513–886. doi:10.1063/1.555805
33. Roots R, Okada S. Estimation of life times and diffusion distances of radicals involved in X-ray-induced DNA strand breaks or killing of mammalian cells. Radiat Res (1975) 64(2):306–20. doi:10.2307/3574267
34. Andrés C, Curieses M, Juan CA, Plou FJ, Pérez-Lebeña E. Chemistry of hydrogen peroxide formation and elimination in mammalian cells, and its role in various pathologies. Stresses (2022) 2:256–74. doi:10.3390/stresses2030019
35. Kacem H, Psoroulas S, Boivin G, Folkerts M, Grilj V, Lomax T, et al. Comparing radiolytic production of H2O2 and development of Zebrafish embryos after ultra high dose rate exposure with electron and transmission proton beams. Radiother Oncol (2022) 175(2022):197–202. doi:10.1016/j.radonc.2022.07.011
36. Montay-Gruel P, Acharya MM, Petersson K, Alikhani L, Yakkala C, Allen BD, et al. Long-term neurocognitive benefits of FLASH radiotherapy driven by reduced reactive oxygen species. Proc Natl Acad Sci (2019) 116(22):10943–51. doi:10.1073/pnas.1901777116
37. Vozenin MC, De Fornel P, Petersson K, Favaudon V, Jaccard M, Germond JF, et al. The advantage of FLASH radiotherapy confirmed in mini-pig and cat-cancer patients. Clin Cancer Res (2019) 25(1):35–42. doi:10.1158/1078-0432.ccr-17-3375
38. Chabi S, Van To TH, Leavitt R, Poglio S, Jorge PG, Jaccard M, et al. Ultra-high-dose-rate FLASH and conventional-dose-rate irradiation differentially affect human acute lymphoblastic leukemia and normal hematopoiesis. Int J Radiat Oncol Biol Phys (2021) 109(3):819–29. doi:10.1016/j.ijrobp.2020.10.012
39. Simmons DA, Lartey FM, Schüler E, Rafat M, King G, Kim A, et al. Reduced cognitive deficits after FLASH irradiation of whole mouse brain are associated with less hippocampal dendritic spine loss and neuroinflammation. Radiother Oncol (2019) 139:4–10. doi:10.1016/j.radonc.2019.06.006
40. Soto LA, Casey KM, Wang J, Blaney A, Manjappa R, Breitkreutz D, et al. FLASH irradiation results in reduced severe skin toxicity compared to conventional-dose-rate irradiation. Radiat Res (2020) 194(6):618–24. doi:10.1667/rade-20-00090
41. Dal Bello R, Becher T, Fuss MC, Kramer M, Seco J. Proposal of a chemical mechanism for mini-beam and micro-beam efficacy. Front Phys (2020) 8:564836. doi:10.3389/fphy.2020.564836
42. Blain G, Vandenborre J, Villoing D, Fiegel V, Fois GR, Haddad F, et al. Proton irradiations at ultra-high dose rate vs. conventional dose rate: Strong impact on hydrogen peroxide yield. Radiat Res (2022) 198(2022):318–24. doi:10.1667/RADE-22-00021.1
43. Folkerts MM, Abel E, Busold S, Perez JR, Krishnamurthi V, Ling CC. A framework for defining FLASH dose rate for pencil beam scanning. Med Phys (2020) 47:6396–404. doi:10.1002/mp.14456
44. Diffenderfer ES, Sørensen BS, Mazal A, Carlson DJ. The current status of preclinical proton FLASH radiation and future directions. Med Phys (2022) 49(3):2039–54. doi:10.1002/mp.15276
45. Hu A, Qiu R, Li WB, Zhou W, Wu Z, Zhang H, et al. Radical recombination and antioxidants: A hypothesis on the FLASH effect mechanism. Int J Radiat Biol (2023) 99:620–8. doi:10.1080/09553002.2022.2110307
46. Santivasi WL, Xia F. Ionizing radiation-induced DNA damage, response, and repair. Antioxid Redox signaling (2014) 21:251–9. doi:10.1089/ars.2013.5668
47. Abolfath R, Baikalov A, Fraile A, Bartzsch S, Schüler E, Mohan R. A stochastic reaction–diffusion modeling investigation of FLASH ultra-high dose rate response in different tissues. Front Phys (2023) 11:1060910. doi:10.3389/fphy.2023.1060910
Keywords: FLASH radiotherapy, ultra-high dose rate, intertrack interaction, normal tissue sparing, oxygen, mechanism, simulation, model
Citation: Baikalov A, Abolfath R, Schüler E, Mohan R, Wilkens JJ and Bartzsch S (2023) Intertrack interaction at ultra-high dose rates and its role in the FLASH effect. Front. Phys. 11:1215422. doi: 10.3389/fphy.2023.1215422
Received: 01 May 2023; Accepted: 20 July 2023;
Published: 08 August 2023.
Edited by:
Emanuele Scifoni, Universities and Research, ItalyReviewed by:
Andrea Attili, National Institute of Nuclear Physics of Rome, ItalyMark A. Hill, University of Oxford, United Kingdom
Copyright © 2023 Baikalov, Abolfath, Schüler, Mohan, Wilkens and Bartzsch. This is an open-access article distributed under the terms of the Creative Commons Attribution License (CC BY). The use, distribution or reproduction in other forums is permitted, provided the original author(s) and the copyright owner(s) are credited and that the original publication in this journal is cited, in accordance with accepted academic practice. No use, distribution or reproduction is permitted which does not comply with these terms.
*Correspondence: Alexander Baikalov, a.baikalov@tum.de