Nitric oxide generation by microwave capillary discharges under thermal control at atmospheric pressure
 V. A. Sterie
  G. D. Stancu
- Laboratoire EM2C, CNRS, CentraleSupélec, Université Paris-Saclay, Gif-sur-Yvette, France
Nitric oxide (NO) was generated inside capillary microwave discharges of 1-mm diameter, operating at 2.4
1 Introduction
Among the key reactive species generated by plasmas, nitric oxide has received a particular attention. Numerous investigations were focused on its reduction as it is often regarded as an environmental pollutant released from combustion systems [1, 2]. Known to play a key role in the regulation of biological processes, studies have also been conducted for wound healing and sterilization applications [3–5]. Furthermore, its plasma generation efficiency was investigated for medical use and for fertilizer production [6–8]. Currently, the fixation of atmospheric nitrogen by nitric oxide plasma synthesis is considered as a complementary approach to the Haber-Bosch process, which is known to have a global ecological impact [9].
Till now various atmospheric pressure non-thermal plasma sources generated in air or in gas mixtures of air with argon or helium were investigated for the NO production. This includes jets driven by kHz or MHz EM excitations, DBDs, glows, sparks, arcs, nanosecond and microwave discharges, in which nitric oxides were detected by FTIR, gas analyzers, mass spectrometry, optical emission spectroscopy, laser induced fluorescence, tunable diode laser absorption spectroscopy, quantum cascade laser absorption spectroscopy and cavity-enhanced absorption spectroscopy [7, 8, 10–17].
Regarding microwave (mw) discharges, especially those sustained by surface waves inside dielectric tubes have proven to be very appealing for plasma applications. This is due to the electrodeless configuration (no plasma contamination), great flexibility and stability in operation conditions [18]. Recently, mw surface discharges within capillary diameters in the range of 1 mm–100 μm were efficiently generated by surfatron or stripline launchers. These capillary discharge sources are particularly attractive because they can produce high power density plasmas (up to 0.1 MW cm-3) for low power inputs (tens of W) in gas mixtures ranging from mbar to atmospheric pressures [19–22]. A noteworthy feature is the slight power required to sustain plasmas that can be as low as 1 W. Studies in dry air at intermediate pressures have shown large radical productions (e.g.,
Here, the nitric oxide production potential was investigated in a 1 mm mw capillary discharge generated using a surfatron launcher at atmospheric pressure in air/argon gas mixtures. Time-resolved Mid-IR quantum cascade laser absorption spectroscopy (QCLAS) was employed to measure the absolute densities and production rates of NO molecules in the discharge exhaust. For this, the Mid-IR QCLAS was tuned over the ro-vibrational absorption line of NO [X1/2, (0,1) R6.5] centered at 1900.076 cm−1. The NO density, flowrate and energy cost were evaluated for different discharge parameters. An airflow cooling system has been designed to significantly enhance the heat transfer through the capillary. A study of the generation of NO under thermal control was also carried out.
The article is organized as follows. In Section 2, the experimental set-up for plasma generation and infrared laser absorption is detailed. In Section 3, the QCLAS principle and the time-resolved absorbance assessment are specified. Results and discussions are given in Section 4. This includes the study of the plasma working range, the thermal control analysis, the plasma parametric studies for NO generation and the literature comparison presenting diagnostic methods, atmospheric plasma sources and the related nitric oxide density, flowrate and energy cost. The conclusions of these investigations are presented in Section 5.
2 Experiment
2.1 Microwave capillary plasmas
The plasma source used for present investigations is similar to the configuration employed in Ref. [21]. The cw-microwave micro-plasmas were produced using a surfatron launcher inside a fused silica capillary (0.5 and 1 mm, inner and outer radii) in mixtures of argon and dry air. The capillary outlet was connected to a 50-cm length White multi-pass cell of 4 L volume in which a constant pressure of 1 atm was maintained. The total flowrate was changed in the range of 0.1–12 Nl/min, with the air/argon molar ratio from 1% to 40%. Power was supplied to the surfatron by a microwave generator (Sairem GMS200WSM56) working in the frequency domain 2.4
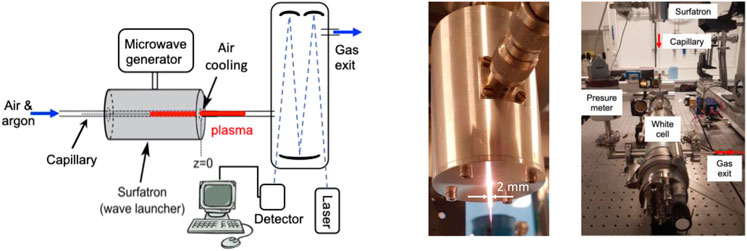
FIGURE 1. Experimental scheme including surfatron launcher and laser absorption system (left). Photo of the capillary microwave plasma (center). Picture of the White multi-pass cell connected to the capillary and the surfatron launcher (right).
2.2 Laser absorption set-up
Here is a brif description of the absorption set-up. More details can be found in Ref. [17]. The schematics of the QCLAS setup, which include the laser, the detector and a White multi-pass cell is shown in Figure 1 (left). An image of the White multi-pass cell connected by capillary to the surfatron launcher is presented in Figure 1 (right). The laser chip (Alpes Laser) was thermoelectrically cooled and driven by a Q-MACS system from Neoplas Control. The spectral resolution of the QCLAS system was 6 × 10⁻³ cm−1, the spectral scan was about 0.4 cm−1 centered at 1900.076 cm−1. Temporal resolutions down to 5 ms could be achieved. The output laser beam was collimated by a 90
3 QCLAS principle and time-resolved absorbance assessment
When passing through a uniform absorbing medium, the decay of monochromatic laser radiation is given by the Beer-Lambert’s law:
where
For a single ro-vibrational transition, the absorption coefficient can be expressed as a function of the temperature dependent line strength
where
Due to collisional broadening that dominates the NO absorption line profile at atmospheric pressure, only a single absorption line centered at 1900.076 cm−1 is observed over a spectral scan of 0.4 cm−1. The line strength at 296 K for this spectrally unresolved absorption is 1.22
The temperature of the exhaust gases that filled the White multi-pass cell was ambient temperature (i.e., 296 K). This was monitored using a thermocouple which was inserted inside the cell. In a continuous flow regime, the post-discharge gas cooled to room temperature due to the exposure to a large cell volume (4 L) of stainless-steel walls. Compared to direct absorption measurements in plasma, the use of the White cell here increases the measurement sensitivity by about three orders of magnitude.
At the beginning of each series of measurements, the laser intensity function of wavelength was recorded without plasma. This corresponds to the reference intensity
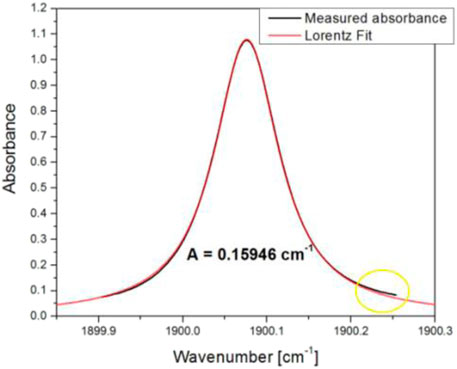
FIGURE 2. Absorbance profile fitted with a Lorentzian function. The difference on the right wing is due to overlapping with 1900.512 cm−1 line (not shown here).
For all measurements presented here, the laser intensity function of wavelength was recorder with or without plasma. Each spectrum was registered at a frequency of 200 Hz. To increase the signal to noise ratio, an integration time of 20 s was considered. This corresponds to 4,000 averaged spectra. In Figure 3, a typical time evolution of NO absorbance is plotted. The spectra are recorded in ex situ conditions, a few tens of cm from the discharge which ignites at the zero time reference.
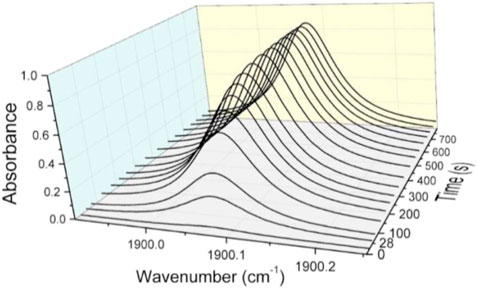
FIGURE 3. Absorbance profiles recorded during about 13 min for a discharge power of 70 W, total flow rate of 800 Nml/min and air/argon ratio of 4%.
4 Experimental data analysis and comparison
4.1 Plasma domain and thermal control
Prior to the NO density measurements by the QCLAS technique, the working domain of the plasma was investigated for various flowrates, air/argon molar fractions and input powers. The length of plasma observed outside the surfatron was typically between 1 and 6.5 cm, for input powers of 10 and 80 W, respectively. The total plasma length is about a factor two longer. Approximately the same discharge volume is covered by the surfatron launcher and it is optically inaccessible [19]. The plasma volume was observed to diminish significantly when air was added in the percentage range. Injecting 1% of air in argon reduces the plasma length by almost a factor two, whereas for 10% air, the plasma length decreases to a few mm. Consequently, the plasma power per unit volume increases up to more than an order of magnitude. Under conditions of high-power density, the plasma gas temperature can exceed the capillary melting point. This significantly limits the discharge working domain if no external cooling is provided.
In Figure 4, the plasma working domain was determined for various input powers, Ar and airflow rates. The air molar fraction in the mixture, computed by volume flowrates
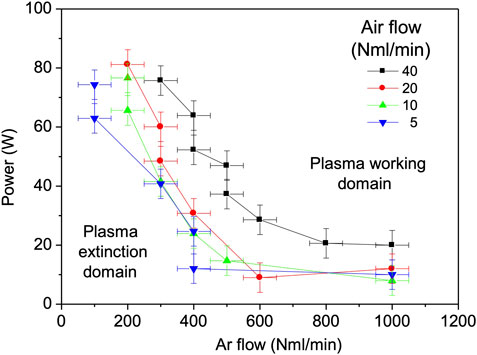
FIGURE 4. The minimum power to sustain plasma for Ar flowrates from 0.1 to 1 Nl/min, in mixture with 5, 10, 20 and 40 Nml/min air.
In Figure 5, the minimum power to sustain plasma inside the capillary was investigated for gas flows up to about one order of magnitude higher (12 Nl/min). The gas residence time in plasma is proportionally reduced. This adjustment is expected to decrease the plasma gas temperature and therefore expand the working range to higher air/argon fractions and powers. The last statement can be understood if one inspects the energy balance of an elementary fluid slab of length dx in steady state given by,
where
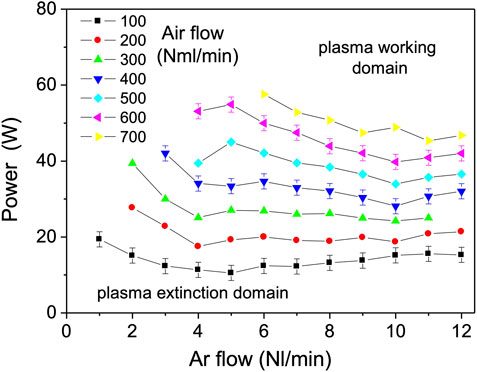
FIGURE 5. The minimum power to sustain plasma for Ar flowrates from 1 to 12 Nl/min, in mixture with 100–700 Nml/min air.
Here too, powers down to 10 W were sufficient to maintain the plasma at the lowest air molar fractions (
Although the plasma gas temperature is expected to be lower, for the flow rates above 1.5 Nl/min, which corresponds to the Reynolds number of ReD
where D is the capillary internal diameter and
where Pr is the Prandtl number for argon,
Higher powers and air/argon molar fractions are expected to contribute to efficient nitric oxide generation. However, in present experiments exceeding 85 and 60 W in Figures 4, 5, respectively for high air fractions and times longer than a few minutes resulted in partial damage or melting the capillary. To avoid this issue, reducing the heat flux generated by plasma or capillary cooling can be employed. Pulsing the microwave power can reduce the heat flux because less average power is then delivered to the plasma. As shown in [26], the inter-pulse cooling is very beneficial for NO production. Here we have applied an air-cooling flow to reduce capillary and plasma temperatures by enhancing the thermal flux through the capillary.
To determine the characteristics of the external airflow necessary to significantly alter the heat flux through the capillary, a thermal resistance model for heat transfer in steady state regime was analyzed. Since the radial temperature gradient is much larger than the axial gradient
According to Eq. 7, a significant change in heat power through the capillary can be attained by substantially varying the total thermal resistance. The thermal resistance circuit for heat transfer from plasma to the external environment is shown below.
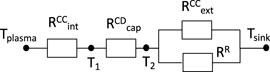
From the plasma to the internal capillary surface at temperature T1, the heat is transferred by forced conducto-convection, with the corresponding resistance,
The thermal resistances mentioned above are determined by,
Where the conducto-convective transfers coefficients,
Thermal resistances change significantly for conditions under present investigations. In the following, a range of values was determined for each resistance component using Eq. 8. The conductive capillary resistance is estimated as
from [30], where
from [31]. Because the thermal radiation that occurs in parallel with the external conducto-convective phenomenon is not linearizable (
Based on the resistance circuit, by changing the air-cooling thermal resistance from natural to forced convection, it ultimately reduces the total resistance on average by a factor 2.5. Therefore, applying an airflow with velocities of 10
Appling this procedure allowed the plasma working domain to extend for air/argon ratios up to 40% (air molar fraction of 28.6%) and for powers up to 84 W. As discussed in the following subsections, this triggers a significant increase in NO density and an important reduction in energy cost per molecule.
4.2 NO parametric studies
The NO generation was investigated under variations in discharge power, gas flowrate, air/argon molar fraction and using an external capillary air cooling system. As shown in Figure 3, the NO absorbance increases with time and reaches a steady state regime at about 500 s. To ensure steady state conditions, measurements were performed for extended durations for each plasma parameter study.
The first parametric study included the variation of the discharge power while keeping constant the total flowrate (990 Nml/min) and the air/argon molar fraction (4%). For each change in the input power, measurements were taken over a period of about 13 min. In Figure 6 the integrated NO absorbance function of time for powers from 25 to 85 W are presented. It is observed that NO integrated absorbance is close to zero at 25 W and increases monotonically with the discharge power. In the inset of Figure 6, the 40 and 85 W curves were normalized. However, all normalized curves exhibit identical behavior, namely, the time derivative is independent of the plasma power. Using the data from Figure 6, the absorbance values obtained at the steady state were used to compute NO absolute densities. This data are presented in Figure 7. The error bars are mainly determined from the data statistics of two series of measurements. A temperature variation of ± 2 K and an absorption length error of ± 5 cm were considered. A maximum NO density of 6.5 × 1015 cm−3 (260 ppm) and corresponding rate of 0.26 sccm are obtained at 85 W. The NO production flowrate in sccm units is computed as,
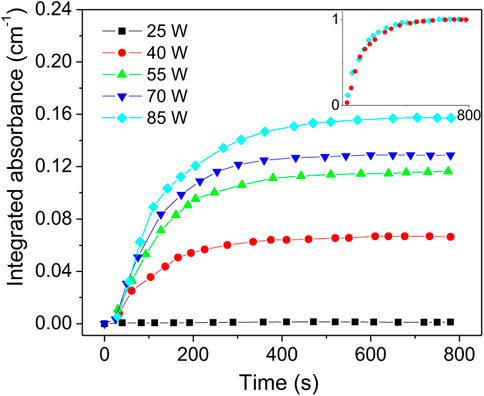
FIGURE 6. NO integrated absorbance vs. time at total flow of 990 Nml/min and air/argon molar ratio of 4%. Inset shows the normalized curves for 40 and 85 W.
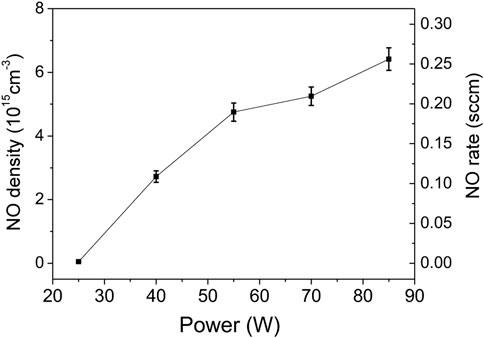
FIGURE 7. NO steady state density and flowrate function of power computed for conditions of data from Figure 6.
In the second experiment, the total gas flow varied between 500 and 1,000 Nml/min for a constant air/argon molar ratio of 4% and an input power of 70 W. In Figure 8, the integrated absorbance is plotted versus time for various total flows. NO absorbance reaches steady state after about 300 s for 1,000 Nml/min, while for 500 Nml/min steady state is reached after 700 s. In the inset of Figure 8, the curves of 500, 700 and 1,000 Nml/min were normalized. It is observed that the slopes at origin are increasing with the total flowrate. This different behavior compared to data in Figure 6 can be explained by the species convection phenomenon. The flow convection speed in the cell can be evaluated by
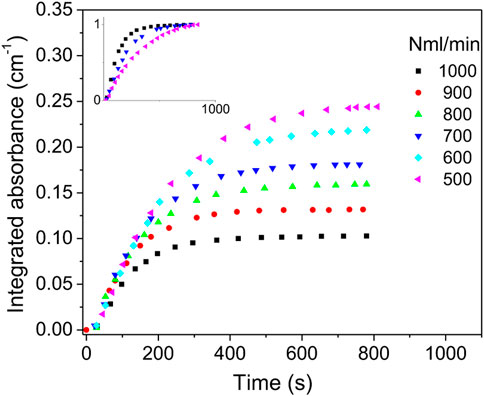
FIGURE 8. NO integrated absorbance vs. time at 70 W power and air/argon ratio of 4%. Inset shows normalized curves for total flows of 500, 700 and 1,000 Nml/min.
Nitric oxide is expected to be converted to the more stable nitric dioxide (NO2) by reaction, NO + NO + O2 → NO2 + NO2. The characteristic time of this reaction for the White cell conditions can be determined by,
To calculate the steady state NO density, the same procedure as above was followed. The NO density and flowrate results are shown in Figure 9. The NO density of up to 1016 cm−3 (400 ppm) is obtained at the lowest flow rate. The density increases by about a factor 2.3 when the flowrate is reduced by a factor 2. The increase in NO flow rate is relatively less important, i.e., from 0.17 sccm to 0.2 sccm, i.e., below 20%.
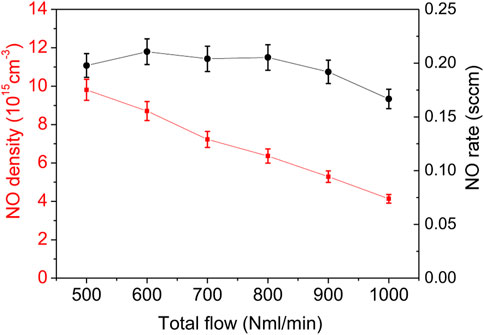
FIGURE 9. NO steady state density (red) and flowrate (black) function of the total flow computed for conditions of data from Figure 8.
In the next set of experiments, the air/argon molar ratio was varied, while keeping power and total gas flowrate constant at 70 W and 440 Nml/min, respectively. In Figure 10, the steady state density was measured for air molar ratio in the range 1%–8%. These investigations were done at the lowest gas flowrate for which plasma can be maintained with a wide range of air/argon molar fractions. Error bars are determined primarily by data statistics from two set of experiments. The NO density increases about three orders of magnitude when rising the air/argon fraction from 1% to 8%. The NO maximum density is found 1.5 × 1016 cm−3 (660 ppm) which corresponds to a maximum NO flow rate of 0.27 sccm.
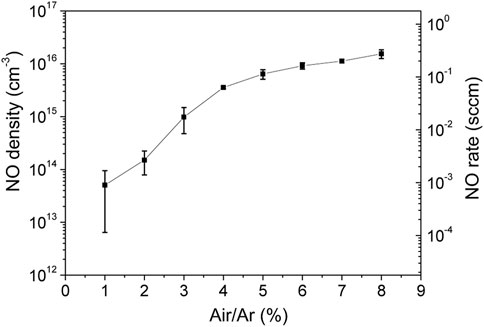
FIGURE 10. NO density and flowrate function of air/argon molar ratio at total flow of 440 Nml/min and power of 70 W.
These sets of experiments clearly indicate that higher powers and air/argon fractions lead to higher NO densities and production rates. The following experiments were carried out under the conditions shown in Figure 5. The NO density function of Ar flowrate from 1 to 6 Nl/min measured for a constant air/argon molar ratio of 5% and for 30, 35, 40 and 50 W is shown in Figure 11. As before, the highest density (
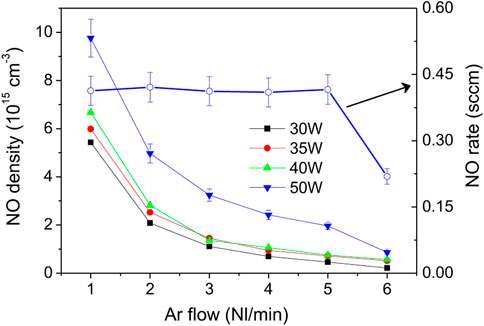
FIGURE 11. NO density function of Ar flowrate for air/argon molar ratio of 5%. For 50 W the NO flowrate values are plotted in blue circles.
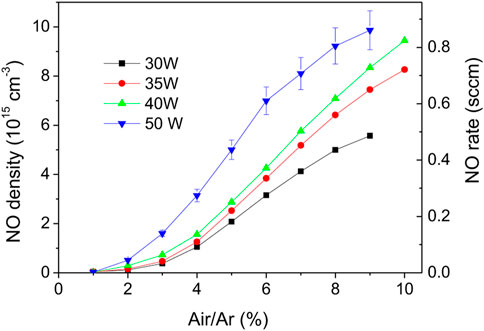
FIGURE 12. NO density and flowrate function of air/argon molar ratio for 2 Nl/min Ar flowrate.
The last set of experiments were performed using the air-cooling system applied to the outer surface of the capillary. The goal was to maximize the plasma power and the air/argon molar fraction while avoiding capillary thermal damage. In Figure 13, NO density was measured for powers up to 75 W for an air/Ar molar ratio of 10% and a total flow of 2 Nl/min. Here the maximum NO density and flowrate were increased by about 30% compared to previous studies. Note that the highest NO values were obtained in Figure 14, where for a power of 84 W, the air/argon ratio was varied between 10% and 40%. The maximum NO density measured in steady state reaches 7.1 × 1016 cm−3 (about 3,000 ppm) for a NO flowrate of 7.2 sccm. Compared to the uncooled capillary, this corresponds to an increase of almost an order of magnitude. Thus, the enhancement of the heat transfer through the capillary turns out to be another essential parameter to produce NO.
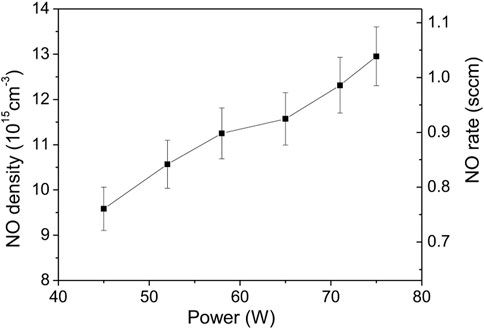
FIGURE 13. NO density function of power for air/Ar molar ratio of 10% and total flowrate of 2 Nl/min.
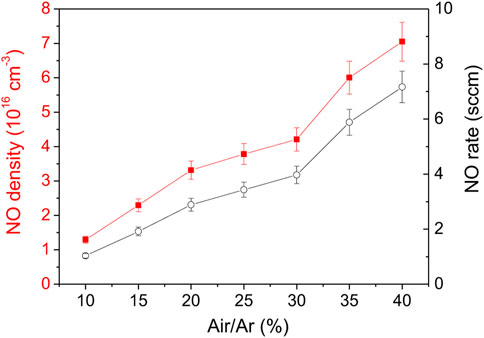
FIGURE 14. NO density function of air/Ar molar ratio for 1.8 Nl/min Ar flowrate and 84 W.
4.3 Literature comparison: NO density, flowrate, energy cost
There are many studies on nitric oxide generated by discharges at atmospheric pressure. Reviews on NO plasma sources, detection methods and production related to medical or nitrogen fixation applications can be found, for example, in Refs. [7, 35, 36]. However, data on NO flowrate and energy costs are fewer and comparison of literature results requires special attention. For instance, the power considered for the evaluation of the energy cost is generally that transferred to plasma and not the overall consumption of the power supply. The energy cost can vary by an order of magnitude depending on the power component taken into account [16]. Measurements in the effluent at different distances from plasmas, where chemical equilibrium is not reached can also yield an order of magnitude changes in NO density [37].
To compare current data with previous studies, energy efficiency was evaluated. The energy cost for NO generation by plasma can be expressed in units of eV/molecule and determined by,
For present experiments, the data in Figure 14 (84 W and 7.2 sccm) give the best NO production efficiency, namely, a cost of 160 eV/molecule. This corresponds to NO density of 7.1 × 1016 cm−3 and a molar fraction of 3,000 ppm. Note that this energy cost is much lower than the data recorded without the external cooling device. Figure 11 and Figure 13 give about 0.6 keV/molecule and 3.5 keV/molecule, respectively.
In Table 1, some representative data for NO generation by atmospheric pressure plasma sources and detection methods together with present results are shown. When data was available, NO flowrates were computed based on NO molar fractions and total flowrates. The energy costs were converted in eV/molecule units or evaluated using powers provided in publications. Compared to atmospheric pressure plasma jets (APPJ) and dielectric barrier discharges (DBD), the present mw capillary discharges demonstrate to be significantly superior. The NO density and flowrate are shown appreciably larger and the energy cost per molecule is found lower by about one order of magnitude. The mw capillary discharge show to be comparable with other microwave discharges and plasma sources such as pulsed or gliding arcs and sparks. However, with energy cost below 100 eV/molecule a few experiments are shown to perform better. Among them we can cite the near equilibrium microwave plasma of Taras et al. [50], which produces 2.5% NO for 6 J/Nml air, an equivalent of 56 eV/molecule. Plasma sources such as plasmatron or pulsed arcs performed even better with energy costs down to 16 and 35 eV/molecule [48, 49].
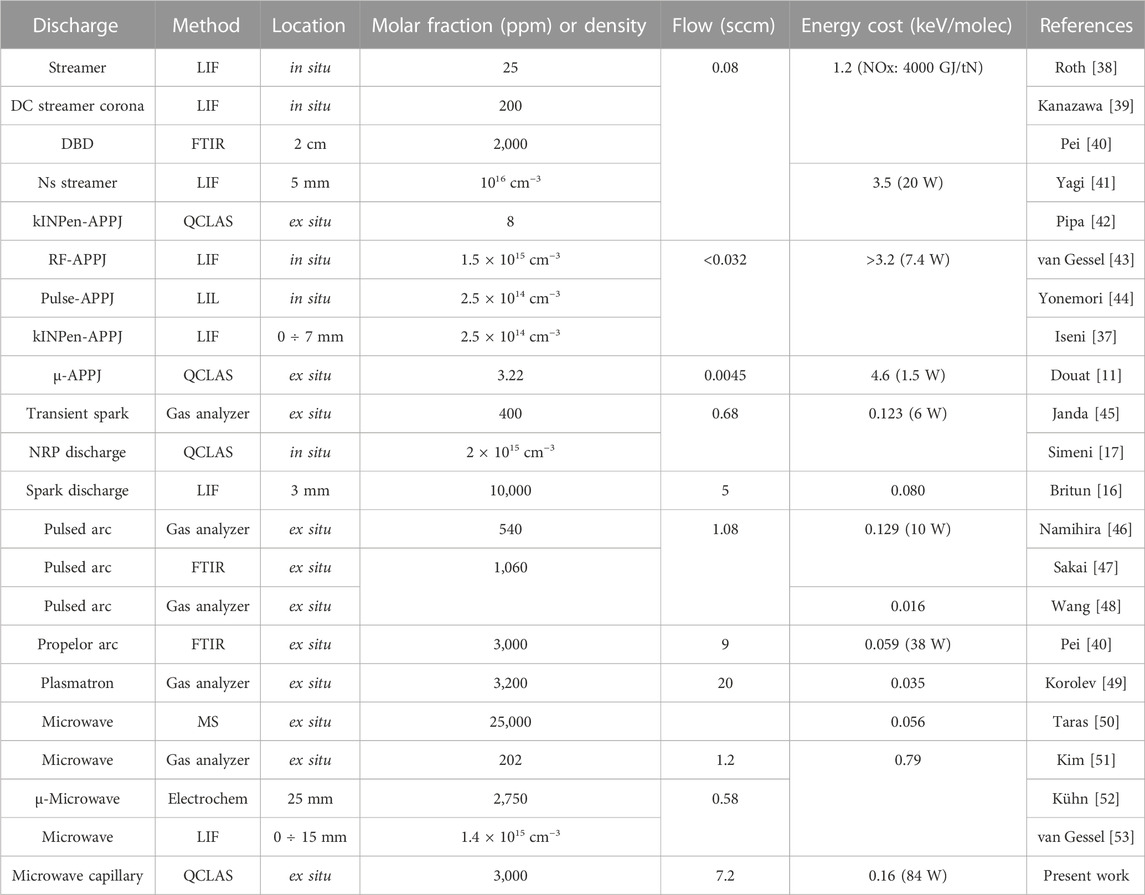
TABLE 1. Representative discharge sources, detection methods and NO generation characteristics at atmospheric pressure conditions.
Recently Britun et al. [16] and Verloessem et al. [26] using a spark discharge and a pulsed plasma jet announced record energy costs for NO (or NOx) production with values on the order of 4 eV/molecule. The high efficiency for NO generation was attributed to the non-thermal Zeldovich mechanism: 1) N2(X,v) + O
Concerning the present capillary microwave studies, we should mention that the NO energy cost was determined using ex situ conditions which is not always the case for experiments in Table 1. The density of NO was measured at tens of cm from the discharge zone and at room temperature conditions, therefore in a frozen chemical regime. Moreover, as shown in the recent paper of Coquery et al. [22] the actual coupled power in microwave capillary plasmas could be up to an order of magnitude less than the value given by the usual balance of incident and reflected powers. This method was retained here and is commonly employed in the literature. Thus, if only the power coupled to the plasma is considered, the energy cost can be significantly lower than the present value.
5 Conclusion
In this work nitric oxide was generated using microwave capillary discharges in air/argon mixtures under atmospheric pressure conditions. The Mid-IR quantum cascade laser absorption spectroscopy was used to measure time resolved NO absolute densities in ex situ conditions.
Parametric studies have shown that the highest NO production is obtained for the highest power and air/argon molar ratio. Mw capillary discharges have proven to be a robust source of nitric oxide with densities and flowrates tuned over three orders of magnitude. It was found that increasing the total mass flowrate in plasma significantly reduces the energy cost of NO. However, discharge operation was limited to lower input powers. The enhancement of the heat transfer in the turbulent regime explains the capillary thermal degradation.
By controlling the heat transfer through the capillary with an airflow cooling system, the discharge working domain was significantly extended. Nitric oxide density and flowrate increased near one order of magnitude, reaching a maximum of ×7.1 1016 cm-3 (3,000 ppm) and 7.2 sccm, for an input power of 84 W. Consequently, the energy cost per NO molecule was reduced by about an order of magnitude, to a minimum value of 160 eV/molecule.
Microwave capillary discharges have demonstrated about one order of magnitude higher NO efficiency than APPJ and DBD discharges and energy costs comparable to the top efficient plasma sources. Although the energy cost is still a factor higher than the best in the literature, the results are very encouraging for further developments. Recently, it was found that a large mw power contributes to the heating of the mw launcher. Thus, if the energy cost is evaluated using the absorbed plasma power, the value reported here will be considerably lower. Moreover, by further enhancing the heat transfer through the capillary (e.g., employing a cooling fluid with a better exchange coefficient or a thinner capillary) or by pulsing the discharge, efficiency improvements are expected.
Data availability statement
The raw data supporting the conclusion of this article are available from the corresponding author on reasonable request.
Author contributions
VS and YZ have substantially contributed to the data acquisition. GS has contributed to the conception, data analysis and interpretation and drafting the work.
Funding
This research was supported by Labex LaSIPS, University Paris-Saclay, Thermoplas project RD 73.
Conflict of interest
The authors declare that the research was conducted in the absence of any commercial or financial relationships that could be construed as a potential conflict of interest.
Publisher’s note
All claims expressed in this article are solely those of the authors and do not necessarily represent those of their affiliated organizations, or those of the publisher, the editors and the reviewers. Any product that may be evaluated in this article, or claim that may be made by its manufacturer, is not guaranteed or endorsed by the publisher.
References
1. Bowman CT. Control of combustion-generated nitrogen oxide emissions: Technology driven by regulation. Symp Combust (1992) 24:859–78.
2. Ju Y, Sun W. Plasma assisted combustion: Dynamics and chemistry. Prog Energ Combust. Sci. (2015) 48:21–83.
3. Liebmann J, Scherer J, Bibinov N, Rajasekaran P, Kovacs R, Gesche R, et al. Biological effects of nitric oxide generated by an atmospheric pressure gas-plasma on human skin cells. Nitric Oxide - Biol Chem (2011) 24:8–16. doi:10.1016/j.niox.2010.09.005
4. Kong MG, Kroesen G, Morfill G, Nosenko T, Shimizu T, Van Dijk J, et al. Plasma medicine: An introductory review. New J Phys (2009) 11:115012. doi:10.1088/1367-2630/11/11/115012
5. Kuwahara T, Kuroki T, Yoshida K, Saeki N, Okubo M. Development of sterilization device using air nonthermal plasma jet induced by atmospheric pressure corona discharge. Thin Solid Films (2012) 523:2–5. –5. doi:10.1016/j.tsf.2012.05.064
6. Qian L, Wenlu Z, Hong W, Juan D, Xinli T, Linlin W, et al. Design and study of nitric oxide portable producing device using continuous discharging arc plasma reaction keeping low energy efficiency for viral pneumonia emergency therapy. PLoS One (2020) 15:e0237604. doi:10.1371/journal.pone.0237604
7. Patil BS, Wang Q, Hessel V, Lang J. Plasma N2-fixation: 1900–2014. Catal Today (2015) 256:49–66. doi:10.1016/j.cattod.2015.05.005
8. Pei X, Gidon D, Graves DB. Specific energy cost for nitrogen fixation as NOxusing DC glow discharge in air. J Phys D Appl Phys (2020) 53:044002. doi:10.1088/1361-6463/ab5095
9. Cherkasov N, Ibhadon AO, Fitzpatrick P. A review of the existing and alternative methods for greener nitrogen fixation. Chem Eng Process (2015) 90:24–33. doi:10.1016/j.cep.2015.02.004
10. Pipa AV, Bindemann T, Weltmann K. Measurements of NO generated by atmospheric pressure plasma jet (APPJ) by absorption and emission spectroscopy 1614–7 (2007).
11. Douat C, Hübner S, Engeln R, Benedikt J. Production of nitric/nitrous oxide by an atmospheric pressure plasma jet. Plasma Sourc Sci. Technol. (2016) 25:025027. doi:10.1088/0963-0252/25/2/025027
12. Stancu GD, Simeni Simeni M, Laux CO. Study of nitric oxide and carbon monoxide production in plasma assisted combustion by QCLAS 21st International Symposium on Plasma Chemistry (Cairns, Australia) (2013).
13. Hong YJ, Lim J, Choi JS, Weltmann KD, Choi EH, Measurement of nitrogen dioxide and nitric oxide densities by using CEAS (cavity-enhanced absorption spectroscopy) in nonthermal atmospheric pressure air plasma Plasma Process Polym (2020) 18 2000168. doi:10.1002/ppap.202000168
14. Iséni S, Reuter S, Weltmann KD. NO2 dynamics of an Ar/Air plasma jet investigated by in situ quantum cascade laser spectroscopy at atmospheric pressure. J Phys D Appl Phys (2014) 47:075203. doi:10.1088/0022-3727/47/7/075203
15. Foltynowicz A, Masłowski P, Ban T, Adler F, Cossel KC, Briles TC, et al. Optical frequency comb spectroscopy Faraday Discuss (2011) 150 23–31.
16. Britun N, Gamaleev V, Hori M. Evidence of near-the-limit energy cost NO formation in atmospheric spark discharge. Plasma Sourc Sci. Technol. (2021) 30:08LT02. doi:10.1088/1361-6595/ac12bf
17. Simeni Simeni M, Laux CO, Stancu GD. High-spatial resolution measurements of NO density and temperature by Mid-IR QCLAS in open-air confined plasmas. J Phys D Appl Phys (2017) 50:274004. doi:10.1088/1361-6463/aa72ca
18. Ferreira CM, Moisan M. Microwave discharges fundamentals and applications (nato ASI series B: Physics. Springer Science+Business Media New York (1993).
19. Dap S, Leroy O, Andrieu J, Boisse-Laporte C, Leprince P, Stancu GD, et al. Hydrodynamic and thermal effects of continuous microwave-sustained plasma in capillary tubes. Plasma Sourc Sci. Technol. (2015) 24:065007. doi:10.1088/0963-0252/24/6/065007
20. Debord B, Alves LL, Gérôme F, Jamier R, Leroy O, Boisse-Laporte C, et al. Microwave-driven plasmas in hollow-core photonic crystal fibres. Plasma Sourc Sci. Technol. (2014) 23:015022. doi:10.1088/0963-0252/23/1/015022
21. Stancu GD, Leroy O, Coche P, Gadonna K, Guerra V, Minea T, et al. Microwave air plasmas in capillaries at low pressure II. Experimental investigation. J Phys D Appl Phys (2016) 49:435202. doi:10.1088/0022-3727/49/43/435202
22. Coquery F, Leroy O, Minea T, Stancu G. Plasma power balance: Methodology and investigations of microwave capillary discharges. Plasma Sourc Sci. Technol. (2022) 5:055003. doi:10.1088/1361-6595/ac6691
23. P Coche VG, Alves LL. Microwave air plasmas in capillaries at low pressure I. Self-consistent modeling. J Phys D Appl Phys (2016) 49:235207. doi:10.1088/0022-3727/49/23/235207
24. Rothman LS, Barbe A, Chris Benner D, Brown L, Camy-Peyret C, Carleer M, et al. The HITRAN molecular spectroscopic database: Edition of 2000 including updates through 2001. J Quant Spectrosc Radiat Transf (2003) 82:5–44. doi:10.1016/s0022-4073(03)00146-8
25. Dittus FW, Boelter LMK. Heat transfer in automobile radiators of the tubular type. Int Commun Heat Mass Transf (1985) 12:3–22. doi:10.1016/0735-1933(85)90003-x
26. Vervloessem E, Gorbanev Y, Nikiforov A, De Geyter N, Bogaerts A. Sustainable NOx production from air in pulsed plasma: Elucidating the chemistry behind the low energy consumption. Green Chem (2022) 24:916–29. doi:10.1039/d1gc02762j
28. Combis P, Cormont P, Gallais L, Hebert D, Robin L, Rullier JL. Evaluation of the fused silica thermal conductivity by comparing infrared thermometry measurements with two-dimensional simulations. Appl Phys Lett (2012) 101:211908. doi:10.1063/1.4764904
29. Chen SH, Saxena SC. Thermal conductivity of argon in the temperature range 350 to 2500 k. Mol Phys (1975) 29:455–66. doi:10.1080/00268977500100391
30. Churchill SW, Chu HHS. Correlating equations for laminar and turbulent free convection from a horizontal cylinder. Int J Heat Mass Transf (1975) 18:1049–53. doi:10.1016/0017-9310(75)90222-7
31. Churchill SW, Bernstein M. A correlating equation for forced convection from gases and liquids to a circular cylinder in crossflow. J Heat Transfer (1977) 99:300–6. doi:10.1115/1.3450685
32. Coquery F, Spectroscopic characterization and thermal coupling of microwave plasmas in capillaries (2021) CentraléSupélec, Université Paris-Saclay. PhD Thesis.
33. Gilmore FR. Equilibrium composition and thermodynamic properties of air to 24,000° Santa Monica. K U.S. Air Force (1955). RM-1543 1–75.
34. Atkinson R, Baulch DL, Cox RA, Crowley JN, Hampson RF, Hynes RG, et al. Evaluated kinetic and photochemical data for atmospheric chemistry: Volume I - gas phase reactions of Ox, HOx, NOx and SOx species. Atmos Chem Phys (2004) 4:1461.
35. Ono R. Optical diagnostics of reactive species in atmospheric-pressure nonthermal plasma. J Phys D Appl Phys (2016) 49:083001. doi:10.1088/0022-3727/49/8/083001
36. Malik MA. Nitric oxide production by high voltage electrical discharges for medical uses: A review. Plasma Chem Plasma Process (2016) 36:737–66. doi:10.1007/s11090-016-9698-1
37. Iseni S, Zhang S, Van Gessel AFH, Hofmann S, Van Ham BTJ, Reuter S, et al. Nitric oxide density distributions in the effluent of an RF argon APPJ: Effect of gas flow rate and substrate. New J Phys (2014) 16:123011. doi:10.1088/1367-2630/16/12/123011
38. Roth GJ, Gundersen MA. Laser-induced fluorescence images of NO distribution after needle-plane pulsed negative corona discharge. IEEE Trans Plasma Sci (1999) 27:28–9. doi:10.1109/27.763011
39. Kanazawa S, Ito T, Shuto Y, Ohkubo T, Nomoto Y, Mizeraczyk J. Two-dimensional distribution of ground-state NO density by LIF technique in DC needle-to-plate 37 1663 (2001).
40. Pei X, Gidon D, Yang YJ, Xiong Z, Graves DB. Reducing energy cost of NO production in air plasmas. Chem Eng J (2019) 362:217–28. doi:10.1016/j.cej.2019.01.011
41. Yagi I, Shirakawa Y, Hirakata K, Akiyama T, Yonemori S, Mizuno K, et al. Measurement of OH, O, and NO densities and their correlations with mouse melanoma cell death rate treated by a nanosecond pulsed streamer discharge. J Phys D Appl Phys (2015) 48:424006. doi:10.1088/0022-3727/48/42/424006
42. Pipa AV, Bindemann T, Foest R, Kindel E, Röpcke J, Weltmann KD. Absolute production rate measurements of nitric oxide by an atmospheric pressure plasma jet (APPJ). J Phys D Appl Phys (2008) 41:194011. doi:10.1088/0022-3727/41/19/194011
43. van Gessel AFH, Alards KMJ, Bruggeman PJ. NO production in an RF plasma jet at atmospheric pressure. J Phys D Appl Phys (2013) 46:265202. doi:10.1088/0022-3727/46/26/265202
44. Yonemori S, Ono R. Effect of discharge polarity on the propagation of atmospheric-pressure helium plasma jets and the densities of OH, NO, and O radicals Effect of discharge polarity on the propagation of atmospheric-pressure helium plasma jets and the densities of OH. N Biointerphases (2015) 10:029514.
45. Janda M, Martisovits V, Hensel K, Machala Z. Generation of antimicrobial NO x by atmospheric air transient spark discharge. Plasma Chem Plasma Process (2016) 36:767–81. doi:10.1007/s11090-016-9694-5
46. Namihira T, Katsuki S, Hackam R, Akiyama H, Okamoto K. Production of nitric oxide using a pulsed arc discharge. IEEE Trans Plasma Sci (2002) 30:1993–8. doi:10.1109/tps.2002.807502
47. Sakai S, Matsuda M, Wang D, Namihira T, Akiyama H, Okamoto K, et al. Nitric oxide generator based on pulsed arc discharge. ACTA Phys Pol A (2009) 115:1104–6. doi:10.12693/aphyspola.115.1104
48. Wang Y, Desilva AW, Goldenbaum GC, Dickerson RR. Nitric oxide production by simulated lightning: Dependence on current energy and pressure. J Geophys Res (1998) 103:19149–59. doi:10.1029/98jd01356
49. Korolev YD, Frants OB, Landl NV, Suslov AI. Low-current plasmatron as a source of nitrogen oxide molecules. IEEE Trans Plasma Sci (2012) 40:2837–42. doi:10.1109/tps.2012.2201755
50. Taras P, Dusek V, Vyskocil P. Study of the NO synthesis in a microwave plasma at atmospheric pressure. Acta Phys Slov (1985) 35:112.
51. Kim T, Song S, Kim J, Iwasaki R. Formation of NO x from air and N 2/O 2 mixtures using a nonthermal microwave plasma system. Jpn J Appl Phys (2010) 49:126201. doi:10.1143/jjap.49.126201
52. Kühn S, Bibinov N, Gesche R, Awakowicz P. Non-thermal atmospheric pressure HF plasma source: Generation of nitric oxide and ozone for bio-medical applications. Plasma Sourc Sci. Technol. (2010) 19:015013. doi:10.1088/0963-0252/19/1/015013
53. van Gessel AFH, Hrycak B, Jasiński M, Mizeraczyk J, van der Mullen JJAM, Bruggeman PJ. Temperature and NO density measurements by LIF and OES on an atmospheric pressure plasma jet. J Phys D Appl Phys (2013) 46:095201. doi:10.1088/0022-3727/46/9/095201
Keywords: nitric oxide production by microwave plasma, NO detection by QCLAS, discharge heat transfer, capillary microwave plasma, atmospheric pressure plasma
Citation: Sterie VA, Zhao Y and Stancu GD (2023) Nitric oxide generation by microwave capillary discharges under thermal control at atmospheric pressure. Front. Phys. 11:1188549. doi: 10.3389/fphy.2023.1188549
Received: 17 March 2023; Accepted: 24 April 2023;
Published: 10 May 2023.
Edited by:
XinPei Lu, Huazhong University of Science and Technology, ChinaReviewed by:
Jie Tang, Chinese Academy of Sciences (CAS), ChinaQI Xiong, China Three Gorges University, China
Copyright © 2023 Sterie, Zhao and Stancu. This is an open-access article distributed under the terms of the Creative Commons Attribution License (CC BY). The use, distribution or reproduction in other forums is permitted, provided the original author(s) and the copyright owner(s) are credited and that the original publication in this journal is cited, in accordance with accepted academic practice. No use, distribution or reproduction is permitted which does not comply with these terms.
*Correspondence: G. D. Stancu, gabi-daniel.stancu@centralesupelec.fr