The manufacture and reliability analysis of the all-rigid Fabry–Perot resonator for fiber-optic acoustic sensors
 Yongqiu Zheng1
  Xinyu Zhao
 Chenyang Xue
- 1State Key Laboratory of Dynamic Measurement Technology, North University of China, Taiyuan, China
- 2School of Software, North University of China, Taiyuan, China
By the continuous development of aerospace, petroleum exploration, and other industrial fields, the fiber-optic acoustic sensor (FOAS) with high reliability is a desideration sensor, which can be used for noise monitoring in the extremely harsh environment. The FOAS based on the all-rigid Fabry–Perot resonator (FPR) relies on the new acoustic sensitive principle, where the change in the air refractive index is induced by sound waves and gets rid of the distortion caused by the mechanical characteristics of the acoustic sensor based on the movable parts. So, the FPR-based FOAS is very suitable for acoustic sensing in the harsh environment. In this paper, the reliability of this kind of FOASs is simulated and analyzed. The modal and anti-vibration simulation results of FPR with different sizes show that the FPR has a high natural frequency, and the external vibration environment does not affect the acoustic sensitivity of the FPR. The micro and small-batch all-rigid FPR can be manufactured by the optical contact. Moreover, the FPR can withstand the high temperature of 500°C that is verified by rapid heat treatment equipment. In order to improve the reliability of the FOAS, the metal packing shell is designed and fabricated. Moreover, the vibration and high-temperature tests of the packaged sensor are carried out. The two groups of tests show that the sensor can work normally under 10 g of acceleration vibration and 200°C high temperature, respectively. Therefore, the FOAS based on the FPR has high reliability and is very suitable for noise monitoring in the extreme harsh environment of various industrial fields. Furthermore, the research results of this paper will enhance the competitiveness and influence of the commercialized FOAS.
1 Introduction
In recent years, due to the speedy development of micro-nano fabrication technology, optical technology, signal analysis, and processing technology, optical fiber sensing technology has developed rapidly [1, 2]. As a representative of new sensing technology, it is advancing to the field of physical parameter measurement in the extremely harsh environment of high temperature and strong vibration. For example, high-reliability acoustic sensors are urgently needed for noise monitoring in aerospace, energy exploitation, oil exploration, and other industrial fields [3–7], and there is an urgent demand for high-reliability acoustic sensors that can monitor noise in the extremely harsh environment. Conventional electrical microphones [8–11] cannot be used in the aforementioned harsh environment due to the limitation to sensor materials and electrical output lines. In comparison, fiber-optic acoustic sensors (FOASs) [12–14] not only have the advantages of small size [15–17], high sensitivity [18, 19], anti-electromagnetic interference [20, 21] but also can withstand extreme harsh conditions such as high temperature [22, 23].
There are many kinds of optical fiber acoustic sensors, among which the most representative ones are the fiber grating and Fabry–Perot interferometer. Although acoustic sensors based on fiber grating are easy to realize large bandwidth acoustic detection [24], their sensitivity and frequency response flatness are relatively low due to the limitation to the spectral sideband. At the same time, the spectral drift and reduced signal-to-noise ratio of the sensor are caused by the change in ambient temperature and low-frequency vibration. The sensor is mainly used in the field of fiber-optic hydrophones and structural health monitoring. The acoustic sensor based on the Fabry–Perot interferometer has high sensitivity and is suitable for air-acoustic measurement. Although limited by the mechanical characteristics of the sound-sensitive membrane, the frequency response flatness range of the acoustic sensor is narrow. At the same time, the membrane is easy to be damaged by strong sound pressure. However, the high-temperature application of the acoustic sensor can be realized by selecting the diaphragm material with high-temperature resistance. For example, based on the interference detection principle of sound-induced membrane displacement, J Konle et al. used the Fabry–Perot interferometer to realize acoustic sensing under high temperature, which was successfully applied in a combustion chamber [25]. The highest operating temperature of the sensor was measured to be up to 800°C. Wang et al. proposed a Fabry–Perot FOAS based on the sapphire film, which has a sensitivity of 13.58 mV/Pa at 10 kHz and a frequency band of 100–25 kHz [26]. At the same time, the temperature tolerance of the sensor is also verified, and the operating temperature can be as high as 800°C. However, most of the current research studies only focus on the high-temperature tolerance of FOASs [27, 28] because the mechanical characteristics of the acoustic sensitive membrane can affect the accuracy of the sensor in the vibration environment.
The FOAS based on the all-rigid Fabry–Perot resonator (FPR) is a new kind of acoustic sensing technology [29, 30]. The acoustic sensitive mechanism is used to detect the acoustic signal by the refractive index change in the air in the cavity caused by the sound wave disturbance, which can eliminate the sensor distortion resulting from the mechanical characteristics [31]. Moreover, the all-rigid acoustic sensitive structure greatly improves the application potential of the sensor in harsh environments [20]. XARION Inc. has developed a commercial FPR-based FOAS without the membrane [32]. Although the sensor can achieve good sound detection [33], the maximum operating temperature is only 100°C. However, in the aerospace industry, for example, the gas temperature in the combustion chamber of the gas turbine is as high as about 1100°C, and the temperature fluctuation produces high-sound–pressure noise, which causes the dynamic load of the structure resulting in the structure vibration. At the same time, the combustion instability that occurs in the combustion chamber leads to deterioration performance or even breakdown accidents. An effective approach to monitoring combustion conditions is to detect the noise signal generated in the combustion chamber with high temperature and vibration. Therefore, it is necessary and valuable to further study the reliability of this kind of acoustic sensors in the harsh environment.
In this paper, the high reliability of the FOAS based on the all-rigid FPR is simulated and tested. The modal and anti-vibration simulation results using COMSOL show that the acoustic sensitivity of the FPR is not affected by internal resonance and the external vibration environment. According to the simulation results, the appropriate FPR structure size is selected. The micro and small-batch all-rigid FPR is manufactured by the optical contact. The FPR can withstand high temperature of 500°C, and the performance has been verified by rapid heat treatment equipment. The FOAS based on the FPR was packed with a metal shell, and vibration and high temperature tests were carried out. Two groups of comparison tests showed that the sensor could work normally under 10 g of acceleration vibration and a high temperature of 200°C, respectively. The performance of the FOASs mentioned previously and proposed in this paper is summarized and compared, as shown in Table 1. It can be seen from the comparison of the listed performance indicators that the proposed sensor has higher reliability and better environmental adaptability. Moreover, it can be flexibly used in the extremely harsh environment of various industrial fields for noise monitoring.
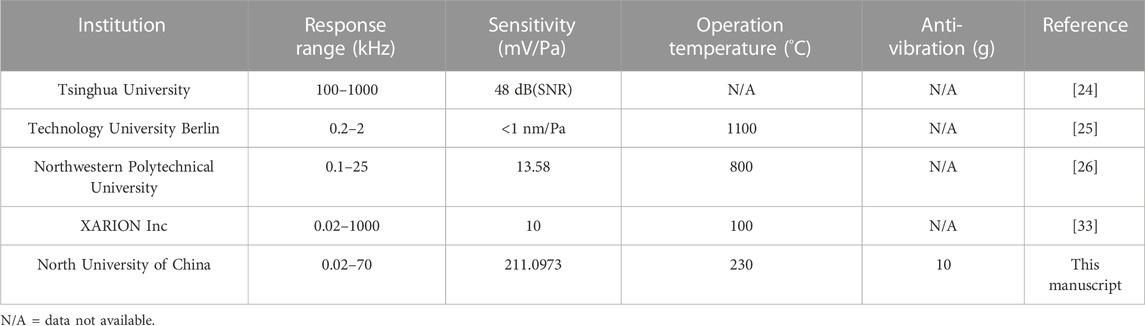
TABLE 1. Performance of selected acoustic sensors.
2 High-reliability design and analysis of micro-FPR
2.1 Modal and anti-vibration simulation
Modal is the natural vibration characteristics of mechanical structures, and modal analysis can improve the natural frequency of the structure by optimizing the structure size and so on. Each modal has a specific natural frequency, damping ratio, and modal shape. The main mode characteristics of the FPR in a certain susceptible frequency range can be understood through modal analysis, thereby the actual vibration response of the structure under the action of various external or internal vibration sources in this frequency band can be predicted, which is beneficial to avoid the generation of structural resonance and noise in practical applications. Therefore, the modal analysis of the FPR model is carried out using COMSOL. The structural model of the FPR is shown in Figure 1. The element attribute is defined as a solid element, and a single node is set at 2 degrees of freedom in the simulation state, which can be understood as the up and down vibrations inside the structure. At the same time, the FPR material is set at Corning ULE zero-expansion glass, with the density of 2.21 g/cm3, the Young’s modulus of 67600 MPa, the Poisson’s ratio of 0.17, and the specific stiffness of 3.12 × 10⁶ m. The COMSOL solution is based on the characteristic frequency research method of solid mechanics.
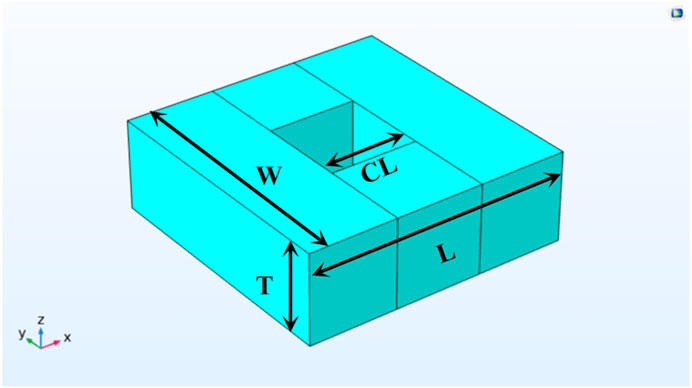
FIGURE 1. Structural model of the FPR. Among them, L is the length, W is the width, T is the thickness, and CL is the cavity length.
In modal analyses, FPR models with different sizes are established where the length (L), width (W), thickness (T), and cavity length (CL) are taken as variables, and their first six-order characteristic frequencies are calculated, respectively. The comparison shows that the overall characteristic frequency of the FPR is higher than 470 kHz, which is due to the high-specific stiffness of the ULE zero-expansion glass. As sound-sensitive elements, the acoustic response characteristics of the FPR will be affected by the change in the CL, while in the first six characteristic modes of the FPR with different sizes, not all modal shapes would change the CL of the FPR. Therefore, only the corresponding relationship between the characteristic frequency value and FPR size of each order characteristic mode shape that can change CL need to be discussed, as shown in Table 2. It can be seen that in order to obtain relatively large characteristic frequency, the size selection of the FPR should follow the principle of thick T, long CL, and short L and W. Moreover, the effect of T and CL on the characteristic frequency of the FPR is obviously weaker than that of L and W.
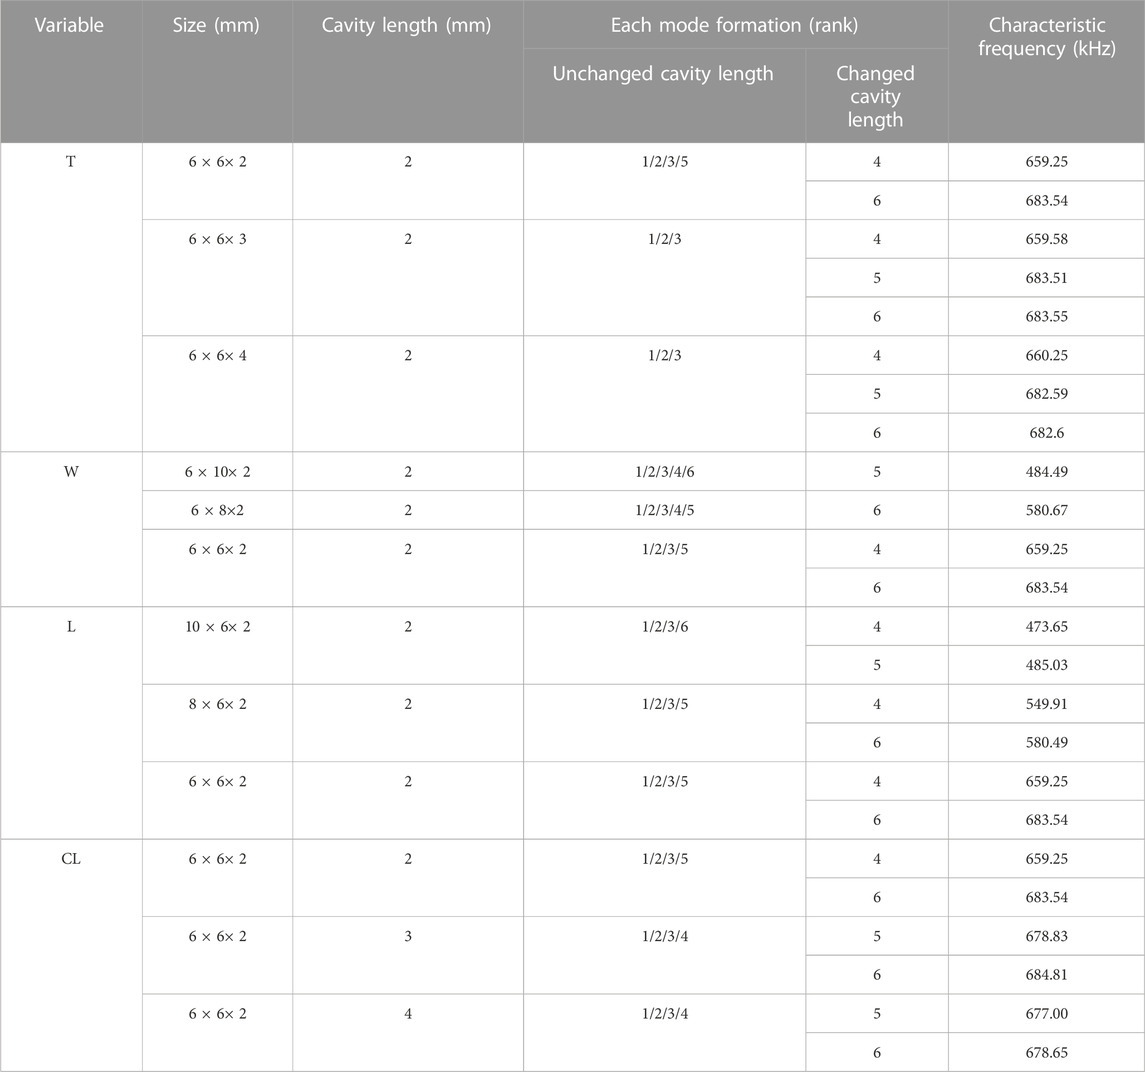
TABLE 2. Modal analysis of FPRs with different sizes.
When the device is in the vibration environment, in addition to resonance, there is also forced vibration caused by external vibration sources. In order to analyze the reliability of FPRs with different sizes more comprehensively, the anti-vibration characteristics of FPRs are simulated. A fixed acceleration of 10 g was applied to the upper surface of the FPR through the solid mechanic module using COMSOL to obtain the stress distribution and displacement changes of the FPR with different sizes, as shown in Table 3. The maximum stress of all sizes of FPRs is 2.18 × 10⁻³MPa, which is much smaller than the yield stress of ULE zero-expansion glass (7200 MPa), so the FPRs will not be damaged. Moreover, the vibration acceleration will not cause the CL change in the FPR, which can be seen from the surface stress distribution and the total body displacement corresponding to the stress of the FPR with the size of 6 × 6 × 2 mm (Figure 2). Therefore, the vibration with 10 g of acceleration will not affect the acoustic sensitivity of the FPR theoretically. However, considering the effects of vibration on the stability of the actual acoustic detection system, the stress and total body displacement of the FPR should be small, so the size selection of the FPR should follow the principle of thick T, short L and W, and long CL.
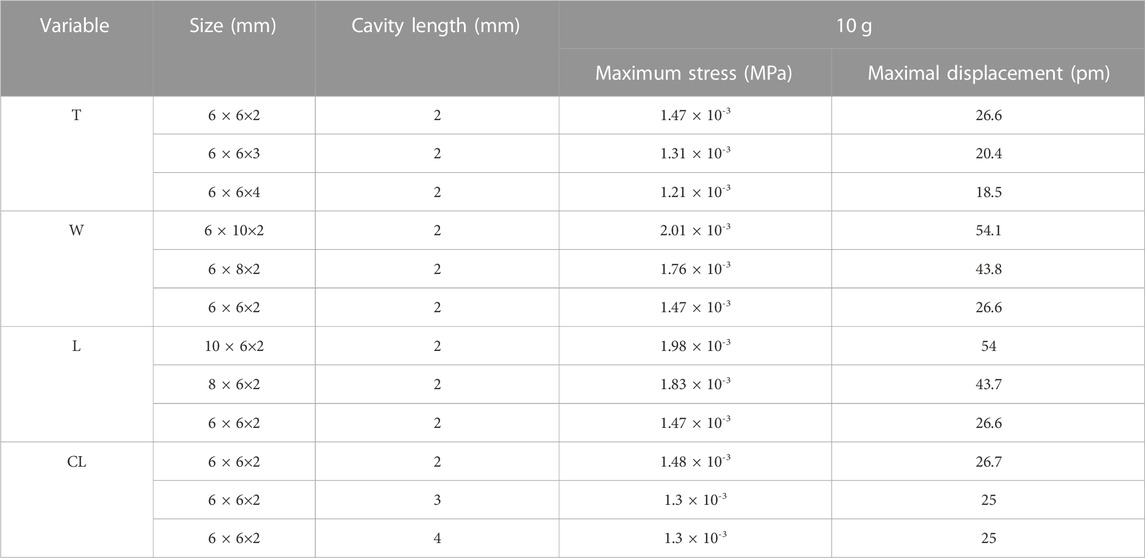
TABLE 3. Anti-vibration characteristics of etalons with different sizes at 10 g of acceleration.
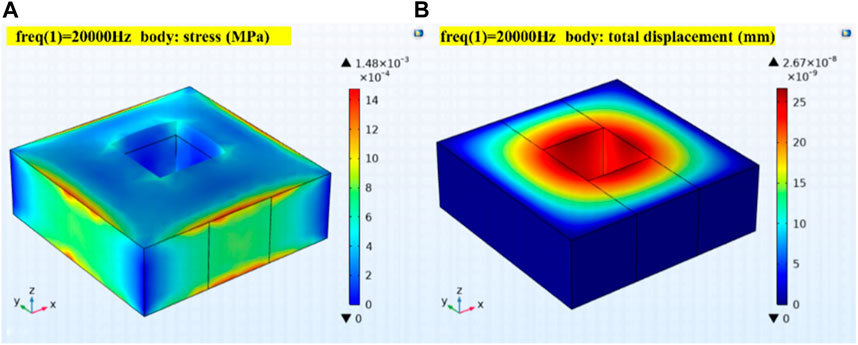
FIGURE 2. (A) Surface stress distribution and (B) total body displacement of the FPR with 6 × 6 × 2 mm at 10 g of acceleration.
Based on the aforementioned simulation analysis of the modal characteristics and anti-vibration characteristics of the FPR and considering the difficulty of the processing technology, the final size of the all-rigid FPR is defined as 6 × 6 × 2 mm (L×W×T), and the CL is 2 mm.
2.2 High-temperature tolerance design and analysis
The most common processing method of the all-rigid FPR is to use adhesive to bond two high-reflectance lenses. However, limited to the working temperature of the adhesive (about 100°C), this kind of FPR cannot withstand high temperature. Moreover, the lens surface is easy to be polluted by the adhesive so that the acoustic detection accuracy is affected. In order to obtain the all-rigid FPR with high reflectance and high-temperature tolerance, the optical contact is selected to manufacture the FPR. The optical contact is an optical micromachining process based on the van der Waals forces between molecules on smooth surfaces. Since no adhesive is introduced, the processed FPR has a wider operating temperature range. Here, the ULE zero-expansion glasses are selected as the cavity material of the FPR. The main reason to choose the material is to avoid the influence of the cavity length change on the accuracy of the acoustic detection at high temperature.
The technological process of the FPR manufactured by the optical contact is shown in Figure 3. The main processing steps are as follows: glass material preparation (spacer and wedge), deepening of the optical contact, high-temperature bonding, and then side leveling, cutting, and cleaning to obtain the finished product of the FPR (Figure 4). At the same time, the bonding strength of the optical contact is verified by the thrust test. Figure 5 shows that the FPR cracks randomly under the thrust value of 58.2N, instead of separating at the surface of the optical contact, which indicates that the bonding strength is higher than the thrust value.
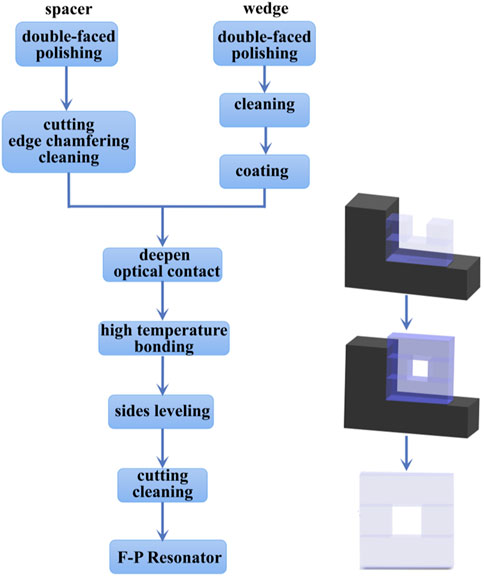
FIGURE 3. Optical contact technological process of the FPR.
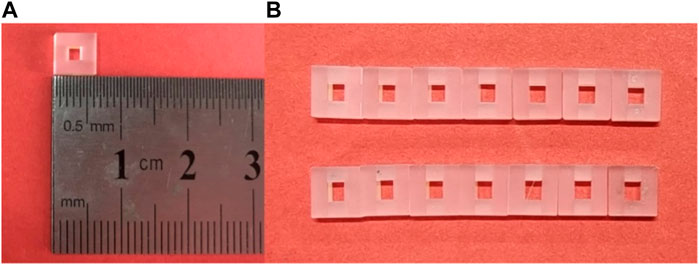
FIGURE 4. (A) Images of FPR and (B)small-batch FPRs with high consistency.
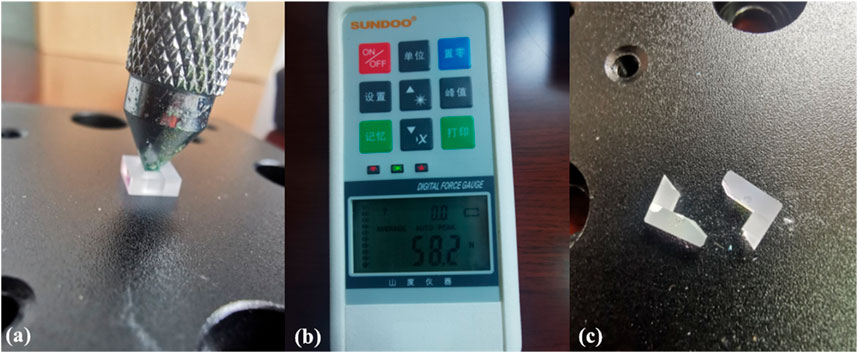
FIGURE 5. Schematic diagram of (A) thrust test, (B) maximum thrust test results, and (C) random cracking at maximum thrust.
In addition, the high-temperature tolerance of the FPR is characterized. The high-temperature test is completed in two steps. First, the resonance spectrum of the FPR is tested at 20°C. Then, the FPR is put into the rapid heat treatment equipment (RTP-500+), whose temperature is set at 500°C for 1 min. After cooling, the FPR is taken out, and its resonance spectrum is tested again for comparison. Figure 6A,B shows the schematic diagram of the sample placement and temperature setting. Figure 7A,B shows the performance comparison of the sensing unit before and after high temperature. It is shown that its resonance spectrum and quality factor are basically the same before and after high temperature, indicating that the FPR can withstand high temperature of 500°C. The annealing temperature and softening temperature of ULE zero-expansion glass used for the preparation of FPR are 1000°C and the softening temperature of ULE zero-expansion glass used for the preparation shows that the internal surface of the FPR cavity is coated with a high-reflective film with a reflectivity greater than 99%. Due to the limitation to the processing method of the reflective membrane and the material characteristics of the film system, very high temperature will result in the fall off of the film or the reflectivity change caused by the change in the film system, which further leads to the failure of the FPR to work normally or achieve the expected sensing performance.
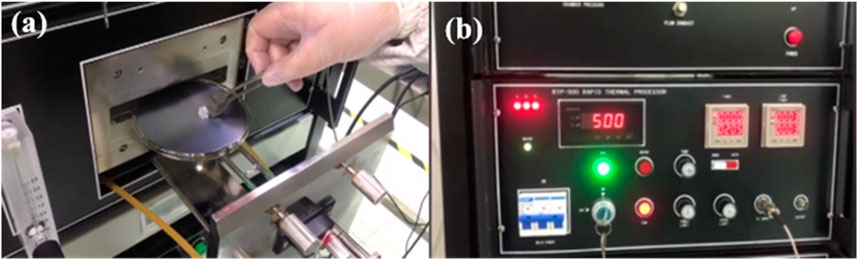
FIGURE 6. High-temperature test process, (A) sample placement, and (B) temperature setting diagram.
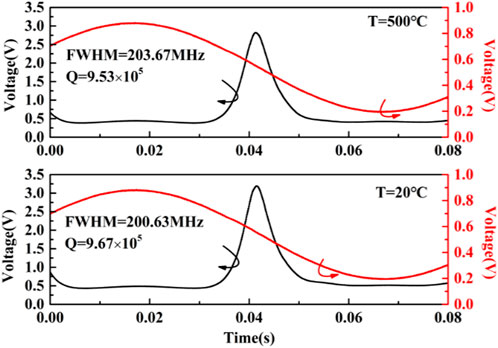
FIGURE 7. Performance comparison of the FOAS sensitive unit before and after 500°C of high temperature.
3 Reliability packaging and experimental verification of FOASs
3.1 Reliability packaging
An integrated FOAS is obtained by coupling the optical fiber collimator with the high quality factor FPR. In order to improve the reliability of the sensor and facilitate the experiment, it needs to be further packed. As shown in Figure 8A, the packaging structure is a cylindrical structure with acoustic holes in the middle. The inner walls of the cylindrical structure are processed with threads and slots for fixing optical fibers. Furthermore, the metal material selects high-temperature steel. During the actual encapsulation, the dust screen is installed in the position where the sound transmission hole is located. Then, the FOAS is placed into the metal cylindrical shell. Finally, both sides of the FOAS are secured using screws to complete encapsulation, as shown in Figure 8C,D.

FIGURE 8. (A) SolidWorks mechanical drawing of the metal packing shell, (B) image of the metal packing shell, (C) schematic diagram of the full packaging process of the FOAS, and (D) the FOAS with the metal packing shell.
3.2 Vibration test
The purpose of the vibration test is to verify the acoustic performance of the FOAS in the vibration environment. In order to increase the contrast, the FOAS was fixed on the modal shaker (JZK-10) (as shown in Figure 9), and the sensitivity and sound signal response of the FOAS before and after vibration are tested, respectively.
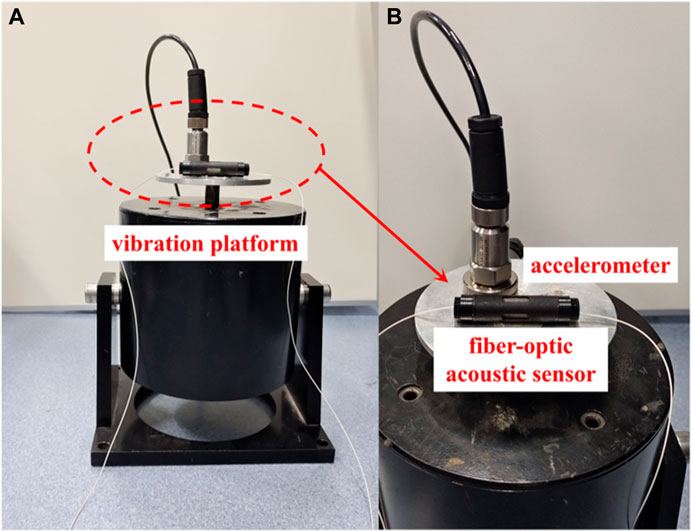
FIGURE 9. (A) Modal shaker and (B) schematic diagram of the placement of the FOAS and accelerometer on the shaker.
Under the static condition of the modal shaker, the sensitivity and acoustic signal response of the FOAS are measured, as shown in Figure 10. The sensitivity is 57.04 mV/Pa, the linear coefficient is 0.99693, and the response amplitude of the acoustic signal at 2 kHz is 0.14844. Sinusoidal vibration is selected for the acceleration vibration test. Moreover, the test conditions of sinusoidal vibration are determined by three parameters, namely, frequency, amplitude, and test duration. Here, the fixed-frequency test is selected, of which the frequency is 50 Hz, the acceleration amplitude is 10 g, and the test duration is 5 min. The test results are shown in Figure 11. The sensitivity is 56.09 mV/Pa, the linear coefficient is 0.98921, and the response amplitude to the 2 kHz acoustic signal is 0.1439. Compared with the performance of the FOAS in the static state, it is found that the vibration does not affect the sensitivity basically but will reduce the linear coefficient of the sensitivity. Vibration has little effect on the response amplitude of the 2-kHz acoustic signal, but the vibration noise is introduced into the response of the acoustic signal. However, the influence of the vibration noise can be solved by subsequent signal processing. Figure 11C shows the acoustic response signal after removing the background noise. It can be seen that although the signal response amplitude is slightly reduced, the vibration noise is basically eliminated. Therefore, the aforementioned comparative experiments prove that the FOAS is highly reliable.
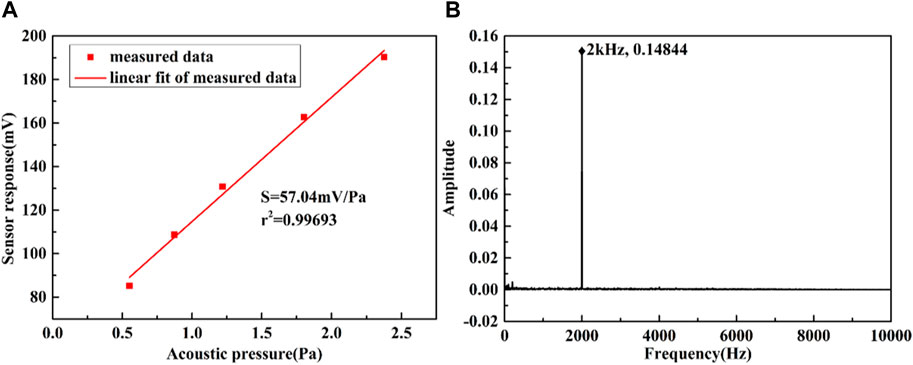
FIGURE 10. (A) Sensitivity and (B) 2 kHz acoustic response of the FOAS when the excitation table is standing still.
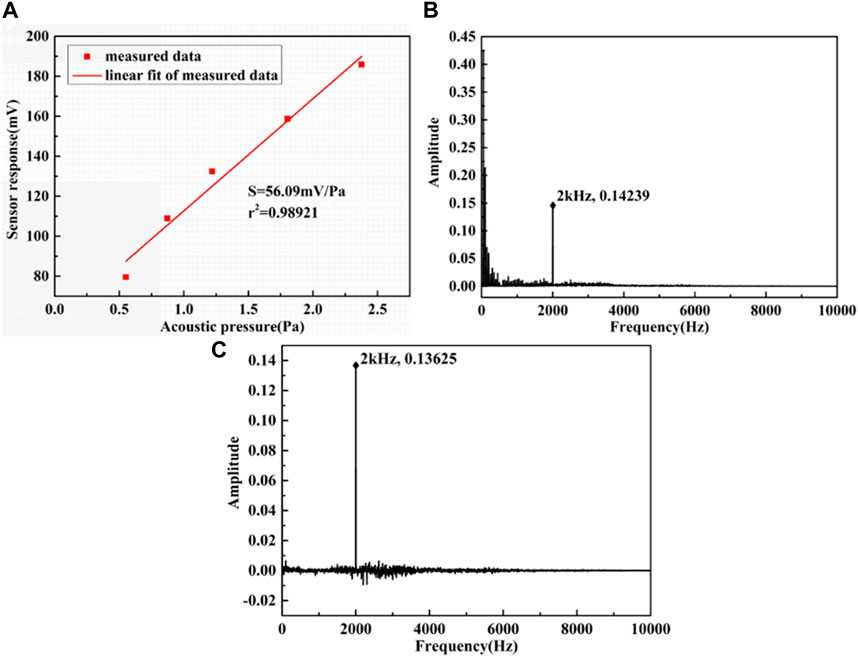
FIGURE 11. (A) Sensitivity of the FOAS in the vibration state, (B) the acoustic response of the FOAS to 2 kHz in the vibration state, and (C) the acoustic response of vibration removed the background noise.
3.3 High-temperature test
The high-temperature test of the FOAS is completed by annealing furnace. When the annealing furnace temperature is 20°C, 100°C, and 200°C, the frequency response and sensitivity of the FOAS are tested, respectively. The test results are shown in Figure 12. It can be concluded that the frequency response range is 20 Hz–70 kHz, and the flatness is ±2 dB at different temperatures. The sensitivity at the temperatures of 20°C, 100°C, and 200°C are 57.5148 mV/Pa, 124.6935 mV/Pa, and 211.0973 mV/Pa, respectively. The main reason for different sensitivities is that the air density in the FPR decreases with the increase in temperature, the refractive index decreases accordingly, and the slope and amplitude of the synchronous demodulation curve also increase accordingly. Therefore, the sensitivity increases with the increase in temperature. When the annealing furnace temperature rises to 230°C, as shown in Figure 13, the linear region of the demodulation curve corresponding to the optical fiber acoustic sensor is fission. In this case, the FOAS cannot perform acoustic demodulation and acoustic sensing. Therefore, FOASs can only work at temperatures below 230°C. The maximum working temperature of the FOAS is mainly limited by the coupling mode of the acoustic sensor. The ultraviolet optical adhesive is used for coupling between the optical fiber and acoustic sensitive unit, of which the maximum working temperature is 160°C. Furthermore, due to the protection of high-temperature-resistant ceramics during the high-temperature test, the optical adhesive fails at 230°C, resulting in the FOAS not working properly. In the future, a CO2 laser fusion system is designed to couple the optical fiber and the acoustic sensitive unit through laser welding so that the FOAS will have a higher application temperature range.
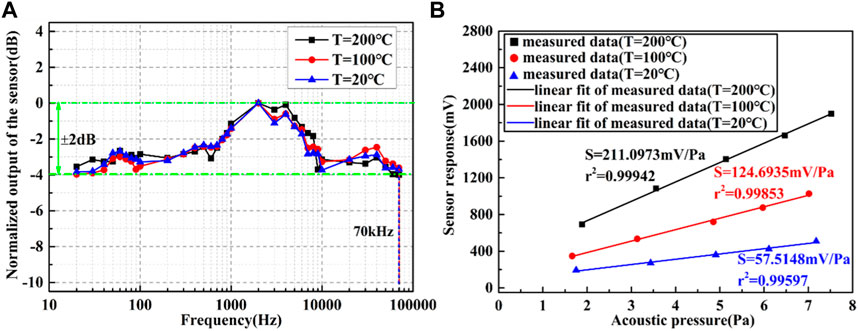
FIGURE 12. (A) Frequency response curve and (B) sensitivity of FOASs at different temperatures.
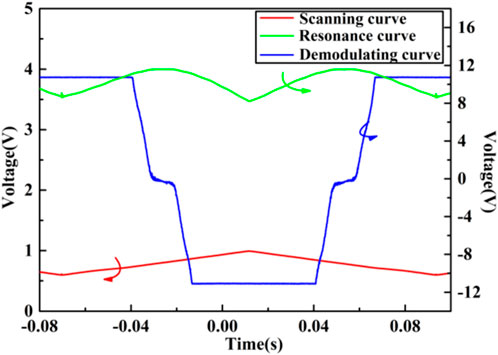
FIGURE 13. Spectrum curves and corresponding demodulation curves of FOASs at 230°C.
The vibration and high-temperature test results indicate that the FOAS with the metal packing shell has high reliability and can be used as noise monitoring equipment in extreme harsh environments.
4 Conclusion
The high reliability of FOASs determines its practical application values, especially its application potential in the extreme harsh environment. By means of modal and anti-vibration simulation, it can be seen that the all-rigid FPR has a high natural frequency, and the external vibration (10 g) will neither affect the acoustic detection performance of the FPR nor damage the structure of the FPR. In order to improve the temperature tolerance of the FPR, the optical contact is used to manufacture it. Moreover, the FPR can still maintain its original properties after high-temperature baking at 500°C. The FOAS based on the FPR is packed with a metal shell, and vibration and high- temperature experiments were carried out. Two groups of comparison experiments show that the sensor could work normally under 10 g of acceleration vibration and a high temperature of 200°C, respectively. Therefore, FOAS has high reliability and good environmental adaptability. Moreover, it can be used for noise monitoring in extremely harsh environments of aerospace, oil exploration, and other industrial fields. Meanwhile, the competitive advantage of commercializing FOASs has been further improved.
Data availability statement
The raw data supporting the conclusion of this article will be made available by the authors, without undue reservation.
Author contributions
YZ proposed the principle scheme and wrote the initial manuscript. JC contributed sections of the initial drafts and made graphs. JB critically read, discussed, and edited the content prior to submission. ZL contributed sections of model simulation and made graphs. XZ contributed sections of experiments, data acquisition, and made graphs. CX obtained funding, designed, and reviewed the manuscript. All authors read and approved the manuscript All authors contributed to the article and approved the submitted version.
Funding
This work was supported in part by the National Natural Science Foundation of China (Nos. 62131018 and 12104417), in part by the Fundamental Research Program of Shanxi Province (Nos. 202103021222012, 202103021223202 and 202203021222042), in part by Shanxi “1331 Project“ Key Subject Construction (1331KSC), and in part by the Shanxi Province Postgraduate Education Innovation Project (2021Y620).
Conflict of interest
The authors declare that the research was conducted in the absence of any commercial or financial relationships that could be construed as a potential conflict of interest.
Publisher’s note
All claims expressed in this article are solely those of the authors and do not necessarily represent those of their affiliated organizations, or those of the publisher, the editors, and the reviewers. Any product that may be evaluated in this article, or claim that may be made by its manufacturer, is not guaranteed or endorsed by the publisher.
References
1. Leal-Junior AG, Díaz CR, Marques C, Frizera A, Pontes MJ. Analysis of viscoelastic properties influence on strain and temperature responses of fabry-perot cavities based on uv-curable resins. Opt Laser Tech (2019) 120:105743. doi:10.1016/j.optlastec.2019.105743
2. Leal-Junior AG, Avellar LM, Díaz CAR, Frizera A, Marques C, Pontes MJ. Fabry–perot curvature sensor with cavities based on uv-curable resins: Design, analysis, and data integration approach. IEEE Sensors J (2019) 19(21):9798–805. doi:10.1109/JSEN.2019.2928515
3. Cui Y, Jiang Y, Zhang Y, Feng X, Hu J, Jiang L. Sapphire optical fiber high-temperature vibration sensor. Opt Express (2022) 30(2):1056–65. doi:10.1364/OE.447449
4. Pu J, Pu J, Wu Y, Xiao D, Wu X. Research on vibration measurement technology based on optical fiber fabry-perot cavity. Transducer Microsystem Tech (2022) 41(4):40–3. doi:10.13873/J.1000-9787(2022)04-0040-04
5. Ma W, Jiang Y, Gao H. Miniature all-fiber extrinsic fabry–pérot interferometric sensor for high-pressure sensing under high-temperature conditions. Meas Sci Tech (2019) 30(2):025104. doi:10.1088/1361-6501/aaf905
6. Yang S, Homa D, Heyl H, Theis L, Beach J, Dudding B, et al. Application of sapphire-fiber-bragg-grating-based multi-point temperature sensor in boilers at a commercial power plant. Sensors [Internet] (2019) 19(14):3211. doi:10.3390/s19143211
7. Yang Y, Cai J, Zhao J. Discussion on high temperature measurement technology for aero-engine development. Metrology Meas Tech (2009) 161(S1):46–8+51.
8. Zawawi SA, Hamzah AA. A review of MEMS capacitive microphones. Micromachines (Basel) (2020) 11(5):484. doi:10.3390/mi11050484
9. Kumar A, Prasad M, Janyani V, Yadav RP. Design, fabrication and reliability study of piezoelectric zno based structure for development of mems acoustic sensor. Microsystem Tech (2019) 25(12):4517–28. doi:10.1007/s00542-019-04524-x
10. Lang C, Fang J, Shao H, Ding X, Lin T. High-sensitivity acoustic sensors from nanofibre webs. Nat Commun (2016) 7(1):11108. doi:10.1038/ncomms11108
11. Fuji Y, Higashi Y, Kaji S, Masunishi K, Nagata T, Yuzawa A, et al. Highly sensitive spintronic strain-gauge sensor and spin-mems microphone. Jpn J Appl Phys (2019) 58(SD):SD0802. doi:10.7567/1347-4065/ab12c0
12. Wissmeyer G, Pleitez MA, Rosenthal A, Ntziachristos V. Looking at sound: Optoacoustics with all-optical ultrasound detection. Light: Sci Appl (2018) 7(1):53. doi:10.1038/s41377-018-0036-7
13. Dass S, Chatterjee K, Kachhap S, Jha R. In reflection metal-coated diaphragm microphone using PCF modal interferometer. J Lightwave Tech (2021) 39(12):3974–80. doi:10.1109/JLT.2021.3051951
14. Tu X, Wang Y, Guo Z, Chen Z, Huang T, Wu X, et al. Underwater acoustic wave detection based on packaged optical microbubble resonator. J Lightwave Tech (2022) 40:6272–9. doi:10.1109/JLT.2022.3187960
15. Gao S, Zhang W, Bai ZY, Zhang H, Lin W, Wang L, et al. Microfiber-enabled in-line fabry–pérot interferometer for high-sensitive force and refractive index sensing. J Lightwave Tech (2014) 32(9):1682–8. doi:10.1109/JLT.2014.2310205
16. Shao Z, Rong Q, Chen F, Qiao X. High-spatial-resolution ultrasonic sensor using a micro suspended-core fiber. Opt Express (2018) 26(8):10820–32. doi:10.1364/OE.26.010820
17. Lu X, Wu Y, Gong Y, Rao Y. A miniature fiber-optic microphone based on an annular corrugated mems diaphragm. J Lightwave Tech (2018) 36(22):5224–9. doi:10.1109/JLT.2018.2868964
18. Ma W, Shao Z, Zhang W, Qiao X. Sensitivity-enhanced fiber-optic sensor based on a drilled pdms diaphragm for ultrasound imaging of seismic physical model. IEEE Trans Instrumentation Meas (2022) 71:1–6. doi:10.1109/TIM.2022.3181267
19. Li C, Peng X, Zhang H, Wang C, Fan S, Cao S. A sensitivity-enhanced flexible acoustic sensor using side-polished fiber bragg grating. Measurement (2018) 117:252–7. doi:10.1016/j.measurement.2017.12.027
20. Chen Y, Wan H, Lu Y, Wang Z, Fan W, Zhang Z, et al. An air-pressure and acoustic fiber sensor based on graphene-oxide fabry-perot interferometer. Opt Fiber Tech (2022) 68:102754. doi:10.1016/j.yofte.2021.102754
21. Basiri-Esfahani S, Armin A, Forstner S, Bowen WP. Precision ultrasound sensing on a chip. Nat Commun (2019) 10(1):132. doi:10.1038/s41467-018-08038-4
22. Griffin BA, Mills DA, Schmitz T, Sheplak M. Fabrication and characterization of a sapphire based fiber optic microphone for harsh environments. The J Acoust Soc America (2010) 128(4):2444. doi:10.1121/1.3508740
23. Kadirvel K, Taylor RT, Horowitz SB, Hunt LJ, Sheplak M. Design and characterization of mems optical microphone for aeroacoustic measurement. In: 42nd AIAA Aerospace Sciences Meeting and Exhibit; 05 January 2004 - 08 January 2004; Reno, Nevada (2004).
24. Nadeem MD, Raghuwanshi SK, Kumar S. Recent advancement of phase shifted fiber bragg grating sensor for ultrasonic wave application: A review. IEEE Sensors J (2022) 22(8):7463–74. doi:10.1109/JSEN.2022.3158090
25. Konle HJ, Paschereit CO, Röhle I. A fiber-optical microphone based on a fabry–perot interferometer applied for thermo-acoustic measurements. Meas Sci Tech (2010) 21(1):015302. doi:10.1088/0957-0233/21/1/015302
26. Wang J, Li H, Tang L, Ma Z, Yuan X, Xi Q, et al. Au–Au bonding-associated lapping and polishing technique for sapphire-based fabry–perot acoustic sensor applied for harsh environment. IEEE Sensors J (2022) 22(19):18454–62. doi:10.1109/JSEN.2022.3201575
27. Liu X, Jiang J, Wang S, Liu K, Xue L, Wang X, et al. A compact fiber optic fabry–perot sensor for simultaneous measurement of acoustic and temperature. IEEE Photon J (2019) 11(6):1–10. doi:10.1109/JPHOT.2019.2948045
28. Pan H, Xinglin T, Minli Z, Chengwei D, Qian G, Yan M, et al. Study on high temperature fabry–perot fiber acoustic sensor with temperature self-compensation. Opt Eng (2015) 54(9):097104. doi:10.1117/1.OE.54.9.097104
29. Chen J, Xue C, Zheng Y, Wu L, Chen C, Han Y. Micro-fiber-optic acoustic sensor based on high-Q resonance effect using fabry-pérot etalon. Opt Express (2021) 29(11):16447–54. doi:10.1364/oe.418736
30. Chen J, Xue C, Zheng Y, Bai J, Zhao X, Chen C, et al. Fiber-optic acoustic sensor for flexibility and universality applications adopting phase modulation spectroscopy. IEEE Sensors J (2021) 21(19):21631–7. doi:10.1109/JSEN.2021.3104658
31. Wu L, Zheng Y, Xue C, Bai J, Chen J. Analysis and optimization of acoustic sensor based on fiber fabry-pérot etalon. IEEE Sensors J (2022) 22(5):4106–12. doi:10.1109/JSEN.2022.3144100
32. Fischer B. Optical microphone hears ultrasound. Nat Photon (2016) 10(6):356–8. doi:10.1038/nphoton.2016.95
Keywords: FOAS, membrane-free, environmental adaptability, Fabry–Perot resonator, antivibration, high-temperature resistance
Citation: Zheng Y, Chen J, Bai J, Li Z, Zhao X and Xue C (2023) The manufacture and reliability analysis of the all-rigid Fabry–Perot resonator for fiber-optic acoustic sensors. Front. Phys. 11:1172113. doi: 10.3389/fphy.2023.1172113
Received: 23 February 2023; Accepted: 24 April 2023;
Published: 11 May 2023.
Edited by:
Wenjun Ni, South-Central Minzu University, ChinaReviewed by:
Xin Cheng, Hong Kong Polytechnic University, Hong Kong, SAR ChinaCarlos Marques, University of Aveiro, Portugal
Copyright © 2023 Zheng, Chen, Bai, Li, Zhao and Xue. This is an open-access article distributed under the terms of the Creative Commons Attribution License (CC BY). The use, distribution or reproduction in other forums is permitted, provided the original author(s) and the copyright owner(s) are credited and that the original publication in this journal is cited, in accordance with accepted academic practice. No use, distribution or reproduction is permitted which does not comply with these terms.
*Correspondence: Chenyang Xue, xuechenyang@nuc.edu.cn