Research on elevated orbit noise propagation based on AI algorithm and propagation path analysis
 Weng Ling-Xiao
 Lei Xiao-Yan1*
 - 1Engineering Research Center of Railway Environment Vibration and Noise Ministry of Education, East China Jiaotong University, Nanchang, China
- 2Nanchang Normal College of Applied Technology, Nanchang, China
With the rapid development of high-speed railway, noise reduction is becoming more and more important. At the same time, the study of elevated rail noise is also very important for the engineering field. The noise reduction of elevated rail noise is a part of the engineering construction, which is conducive to the economic development and the improvement of people’s life, and the reduction of noise has an impact on residents’ life. This article aims to investigate the analysis of the vibration and noise transmission path of the elevated railway. An optimized transmission path analysis method, which is based on the artificial intelligence algorithms, is used to optimize the path analysis, so as to trace the source of the noise and analyze the noise reduction. This method performs well in the analysis of vibration and noise of elevated railways. After this optimization, the contribution degree and frequency response function in the path analysis have better analysis performance. Through the actual measurement and analysis of the noise of the elevated railway, it can be proved that the traditional path method can better analyze the noise source. The environmental noise caused by high-speed trains passing bridges easily exceeds the acoustic environmental standards. After noise reduction, it can be reduced by about 5–10 dB.
1 Introduction
With the rapid development of economy, the construction speed of high-speed railways is increasing rapidly. Compared with the other modes of transportation, high-speed railway has the characteristics of low energy consumption, less environmental pollution, less land occupation, large transportation capacity, comfort and safety, etc. In addition to the high speed of high-speed railways, the station structure is also different from the traditional station structure. In the traditional station structure, the track and the station are completely independent, and the vibration of the station structure caused by the train entering the station is almost negligible. The waiting hall of the high-speed railway elevated station is built on the viaduct structure. It is a structural system that couples the bridge and the waiting hall together. The interaction between the train tracks will have a vibration effect on the station structure.
As is known to all, noise draws considerable attention to the safety of daily life. There are many investigations on the analysis and processing of noise. For example, Tomita and his co-workers set the Tokyo metropolitan area as the research target. They believe that the construction of nursery schools in the harsh environment of sound and vibration under the elevated railway is problematic. They conducted surveys through questionnaires to measure the noise and vibration when passing trains [1]. Shiva et al. aimed to solve the Bourne vibration problem on the ground and the way humans and railway bridge structures respond to it, and discussed ways to reduce the vibration and noise of railway bridges. They introduced the latest findings regarding the causes and reduction of these noise and vibrations in bridges [2]. Julie and Brian discussed reducing noise and vibration in high-speed railways. Julie introduces the topic by looking at the historical background and the importance of noise and vibration (n&v) with increasing population growth, urbanization, and transportation [3]. Song et al. used finite element method and boundary element method to analyze the dynamic characteristics, local vibration and structural noise characteristics of a 40 m carriage based on the theory of vehicle-rail-bridge coupling dynamics [4]. Ji et al. analyzed the vibration and noise characteristics of the coaxial magnetic gear (CMG) based on the structure of the low speed rotor (LSR). Comparison models choose surface mount permanent magnet CMG (SPM_CMG) and Flux concentrated CMG (FC_CMG). They calculated the electromagnetic force distribution in the air gap adjacent to the LSR to predict the deformed shape of the LSR. They show through the vibration and noise analysis results that, compared with FC_CMG, SPM_CMG has smaller vibration and noise [5]. Yang et al. took an off-road high-pressure common rail diesel engine as the research object and studied the influence of different excitations on machine vibration and noise. The results show that with the application of load excitation, the surface vibration speed of the engine increases accordingly. After loading the valve train, the vibration speed of the engine slightly increases in the high frequency range [6]. Zhang et al. used the recursive least square method to update the capacity of the unit. Experimental results show that the proposed method can accurately estimate the battery state in actual operation [7].
Intellectualization and intelligence are the scientific and technological frontier of high-speed railway development, it is necessary to combine artificial intelligence algorithms to analyze the vibration and noise of elevated railways.
At present, artificial intelligence algorithm is widely used in various fields of railway. Xu, JP et al. use artificial intelligence to empower the power allocation for Smart Railway [8]. Cao uses artificial intelligence recognition technology and combines dynamic time warping distance to the accuracy evaluation of tram track recognition, which effectively improves the effect of railway transportation road condition recognition [9]. Andrea et al. integrated the prototype of the real-time monitoring Artificial intelligence Camera Prototype into the multi-sensor monitoring system to detect the falling rocks along the railway, so as to improve the early warning system for managing the landslide site risk, and carried out relevant tests prove that the system is reliability [10].
Through the analysis of related research, it can be found that most of the research is on the traditional processing methods of noise, and the application of artificial intelligence algorithms in railways is also mainly concentrated in other fields, but lacks the application in noise research.
In this study, we proposed a path analysis method which is based on the artificial intelligence algorithm. The effectiveness of the proposed method in noise analysis of elevated railways has been proved. The noise analysis of the elevated railway is mainly the actual measurement and analysis of the surrounding environment of the railway. Through the detection of the ground, the different heights and different distances of the track surface, the reliability of the data is fully proved. It mainly uses artificial intelligence algorithm and propagation path analysis, which can be beneficial to prove the reliability of the data. Through the analysis of different paths, it can better compare which such noise reduction has better effect and has high practical value.
2 Artificial intelligence algorithms and transmission path analysis
A flowchart of the overall study content of the article is shown in Figure 1.
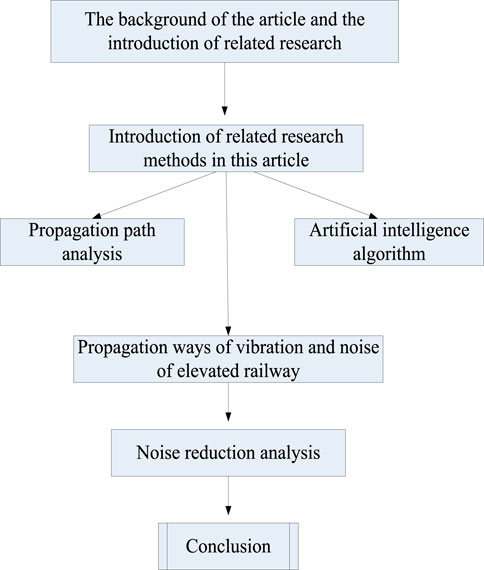
FIGURE 1. The overall flow chart of the article.
2.1 Artificial intelligence algorithm
There are several artificial intelligence algorithms applied to network reconstruction [11]. The widely-used algorithms include artificial neural networks, simulated annealing methods, genetic algorithms, particle swarm algorithms, expert systems, etc. Artificial intelligence algorithms have many similarities with meta-heuristic algorithms [12]. Under the simulation of multiple intelligent algorithms, many mathematical models can be analyzed in artificial intelligence operations [13, 14]. For simulation algorithms, the amount of calculation is large and the degree of calculation is high. With the top ten data processing technologies of artificial intelligence, many algorithms can be implemented in a computer easily [15, 16].
Apply artificial intelligence algorithm to the noise propagation, is can reduce the destruction of the noise propagation, can control on the exercise of the vehicle, using the algorithm to calculate the reasonable traffic, comprehensive control of vehicles, using artificial intelligence algorithm can simulate the performance of all kinds of materials, to carry out the comprehensive detection of related noise.
2.2 Transmission path analysis
Path analysis is popular in the analysis of noise. According to different characteristics and experimental requirements, it can be divided into five categories, as shown in Table 1. For convenience of description, the abbreviations are also provided in Table 1.

TABLE 1. List of abbreviations.
2.2.1 Traditional delivery path analysis method
The theoretical calculation formula of CTPA is as Eq. 1
where Q is the total response of vibration or noise at the target point,
2.2.2 Analysis method of working condition transmission path
OTPA is an improvement over CTPA, as shown in Eq. 2
where T is the transfer function from the sound pressure to the sound pressure of the target point, and X is the acceleration response of the structure transfer path on the passive side [18].
2.2.3. Analysis method of extended working condition transmission path
OPAX introduces the reference point, the target point and the reference point “source-transmission path-response” formulas are respectively Eqs 3, 4
2.2.4 Fast transmission path analysis method
In situations where it is not necessary to specifically analyze which transmission path or which transmission path contributes, but only need to identify the subsystem with the largest contribution, a fast transmission path analysis method is proposed [19, 20], the formula is as Eqs 5, 6.
The process is as follows.
Step 1 Measuring the frequency response function Ha at the input end of the subsystem and the frequency response function Hp at the output end.
Step 2 Using the working condition response a to identify the subsystem load
Step 3 Calculating the transmission path contribution Pc, as shown in Eq. 6.
Figure 2 is a schematic diagram of the principle of FTPA, in which the excitation group is driven by a hammer. This will be more convenient for analysis, but the calculated load quality is poor, so it cannot be applied to finite element analysis [21, 22].
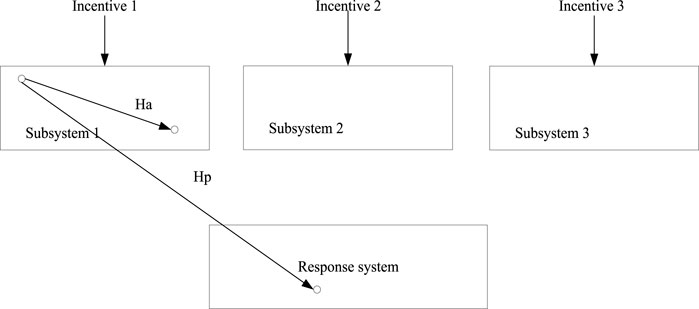
FIGURE 2. Schematic diagram of FTPA principle.
2.2.5 Multi-level transmission path analysis method
Figure 3 shows the steps of the MTPA method to analyze the three-level delivery system. The system shown in Figure 2 is in an un-decoupled state, and the frequency response functions H11, H21, H22, H32, H33 and H3 can be measured using methods such as the hammer excitation method. According to the FTPA mentioned above, measuring the working condition response acting on the subsystem 1, and the working load acting on the subsystem can be calculated by Eq. 7
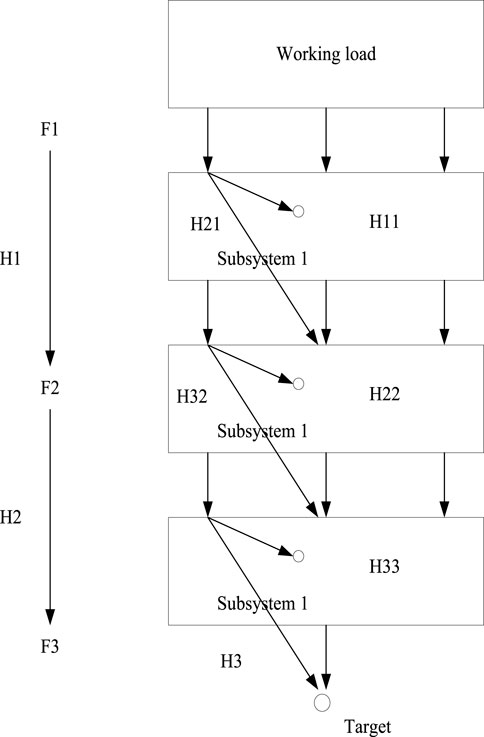
FIGURE 3. Schematic diagram of MTPA principle.
The contribution of F1 to subsystem 2 is shown in Eq. 8
Similarly, using FTPA again, according to the contribution
The force transfer rate from subsystem 1 to subsystem 2 can be obtained by Eqs 7, 9, as shown in Eq. 10
In the same way, the transfer relationship between subsystem 2 and subsystem 3 can be analyzed. Finally, the contribution of F1 to the target point can be obtained, as shown in Eq. 11
Eq. 12 is the force transfer rate from subsystem 2 to subsystem 3.
Rapid transmission path analysis method under bridge noise distribution and propagation law study is to help to achieve when the distance between the bridge and the ground is greater than from the ground height of noise. Traditional distribution path analysis method is beneficial to the elevated rail bridge structure near field noise characteristics study, can find the bridge plate near field noise is mainly by the corresponding plate radiation noise.
To more accurately measure the noise under the bridge at various heights and reflect the accuracy of the measured noise, the response function can be integrated with the fast transmission path analysis method. The correlation between the two measurements is also quite high. The research of elevated rail noise makes use of the response function. For noise in a particular frequency band, the size and relative position of each bridge plate, as well as the distance between the field point and the bridge, are important factors to consider when the structural noise spectrum characteristics of each plate are relatively near. Certain field points will experience interference under the influence of other elements, creating regional strengthening or weakening spots.
3 Transmission path of vibration and noise of elevated railway
3.1 Field test of environmental noise caused by high-speed railway vehicle-bridge coupling vibration
The layout of the measurement points for the on-site testing of the environmental noise caused by the high-speed train passing the bridge is shown in Figure 4. The acoustic sensor is arranged on the near-orbit side of the downward track. Six sets of data are taken for each measurement, and we conducted six tests on the noise of the elevated track structure, each lasting 10 s. It includes wheel/rail noise, pantograph noise and aerodynamic noise. The measured sound pressure levels of each measuring point caused by the vehicle-bridge coupling vibration are shown in Figures 5–7 respectively. In Figure 4, the traditional distribution path analysis method is used to study the noise propagation of the measuring point near the bridge. In Figures 5, 6, the noise propagation of different heights of the bridge deck and the noise propagation of the bridge deck section are studied.

FIGURE 4. Layout of measuring points for environmental noise caused by vehicle-bridge coupled vibration of high-speed railway.
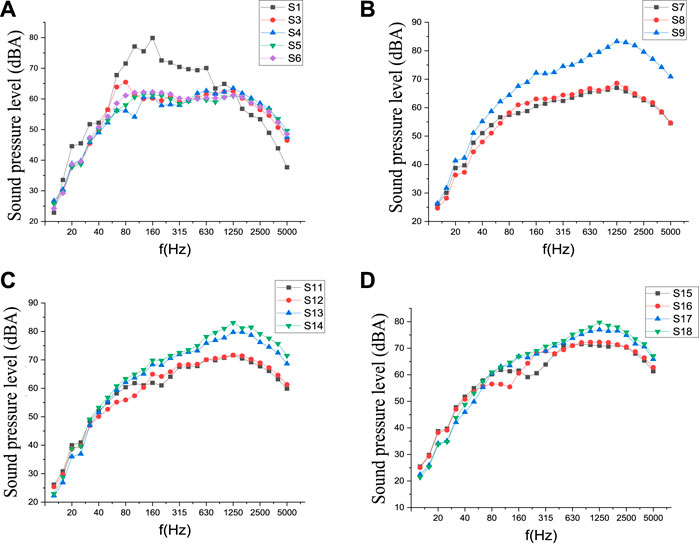
FIGURE 5. Curves of sound pressure level at different distances [(A): S1-S6; (B): S7-S9; (C): S11-S14; (D): S15-S18) from the outer rail at cross-section measurement points.
Figure 5 shows the sound pressure level curve diagram of each measuring point near the bridge, the sound pressure level curve diagram of each measuring point on the section 7.5 m away from the outer rail, the sound pressure level curve diagram of each measuring point on the section 15 m away from the outer rail, and the sound pressure level curve diagram of each measuring point on the section 30 m away from the outer rail.
Figures 5A is a graph of the sound pressure level at each measuring point of the adjacent bridge. The dominant frequency of sound pressure level is 80–2500 Hz, and the peak frequency is 63–160 Hz. Because the measuring point S1 is located in the inner cavity of the box beam, the sound pressure level distribution is different from the four measuring points S3-S6 due to the influence of reverberation; the measuring points S3-S6 are close to the position of the bridge bottom plate, web plate and wing plate. The noise source is mainly bridge structure noise, mainly in low frequency. The sound pressure level and distribution law of these four measuring points are basically the same. The measuring point S3 has a peak at the frequency of 80 Hz, which corresponds to the local vibration of the bottom plate.
Figures 5B is a curve diagram of the sound pressure level at each measuring point on a section 7.5 m away from the outer rail. The measuring points S7 and S8 are 1.2 m and 2.4 m away from the ground, respectively. The noise sources are bridge structure noise, partially diffracted wheel-rail noise and aerodynamic noise, and the dominant frequency is 80–2500 Hz; S9 is 1.2 m away from the track surface, and the noise source is mainly wheel-rail noise. Pantograph noise and aerodynamic noise, the dominant frequency is 160–5000 Hz; the peak frequency of 3 measuring points is 1250 Hz.
Figures 5C is a curve diagram of the sound pressure level of each measuring point on a section 15 m away from the outer rail. The sound pressure levels of measuring points S13 and S14 are higher than measuring points S11 and S12. The dominant frequency of the four measuring points is 160–5000 Hz, and the peak frequency is 1250 Hz.
Figure 5D is a graph of the sound pressure level at each measuring point on the section 30 m away from the outer rail. The 4 measuring points have the same changing trend, and the dominant frequency is 200–5000 Hz; the sound pressure levels of S17 and S18 are higher than the measuring points S15 and S16, and the peak frequency is 1,250 Hz.
Figure 6 provides the sound pressure level curve diagram of each measuring point at a height of 1.2 m from the ground, the sound pressure level curve diagram of each measuring point at a height of 2.4 m from the ground; the sound pressure level curve diagram of each measuring point at a height of 1.2 m from the track surface, and the sound pressure level curve diagram of each measuring point at a height of 3.5 m from the track surface.
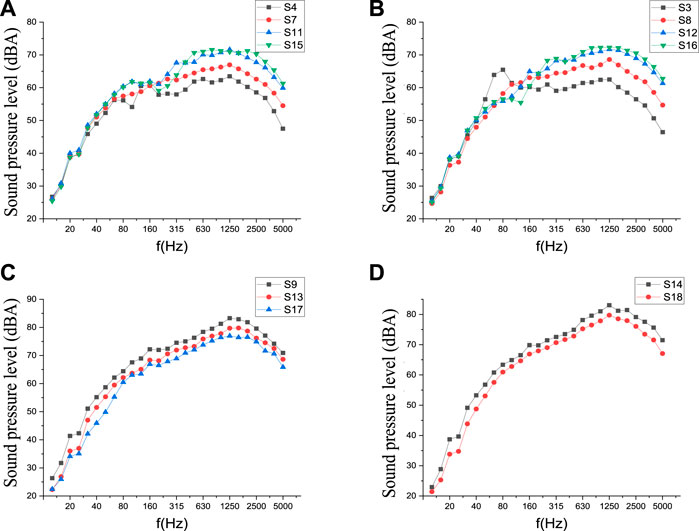
FIGURE 6. Curves of sound pressure levels [(A): S4,S7,S11,S15; (B): S3,S8,S12,S16; (C): S9,S13S,S17; (D): S14,S18] at various measuring points at different heights.
Figure 6A shows the sound pressure level of each measuring point 1.2 m above the ground. Below 40 Hz, the sound pressure levels of the 4 measuring points are highly consistent, indicating that low-frequency noise spreads far and attenuation is small. In the frequency range greater than 40 Hz, the measuring point S4 located directly under the bridge has the lowest sound pressure level because the bridge isolates wheel and rail noise and aerodynamic noise; the measuring points S7, S11 and S15 are far away from the track and are affected by wheel-rail noise and aerodynamic noise, and the sound pressure level is relatively high. The sound pressure level distribution law is: S15 > S11 > S7> S4.
Figure 6B shows the sound pressure level of each measuring point 2.4 m above the ground. The distribution law of the sound pressure level of the 4 measuring points is the same as that of the measuring point 1.2 m from the ground. In the frequency range greater than 200 Hz, the sound pressure level distribution law of each measuring point is: S16 > S12 > S8> S3; the measuring point S3 has a peak at a frequency of 80 Hz, which corresponds to the local vibration of the bridge floor.
Figure 6C shows the sound pressure level of each measuring point at a height of 1.2 m from the track surface. The changing trend of the sound pressure level at the 3 measuring points is the same. The sound pressure level of each measuring point is mainly affected by wheel/rail noise, pantograph noise and aerodynamic noise. The sound pressure level distribution law is: S9> S13 > S17, indicating that the sound pressure level decreases as the distance from the track increases.
Figure 6D shows the sound pressure level of each measuring point at a height of 3.5 m from the rail surface. The change trend of the sound pressure level of the two measuring points is highly consistent. The measuring point S14 is close to the track, and its sound pressure level is greater than that of the measuring point S18, and the peak frequency is 1,250 Hz.
Figure 7 shows the maximum measured sound pressure level at each measuring point of the bridge mid-span section. Table 2 shows the maximum measured sound pressure level at each measuring point and the corresponding frequency.
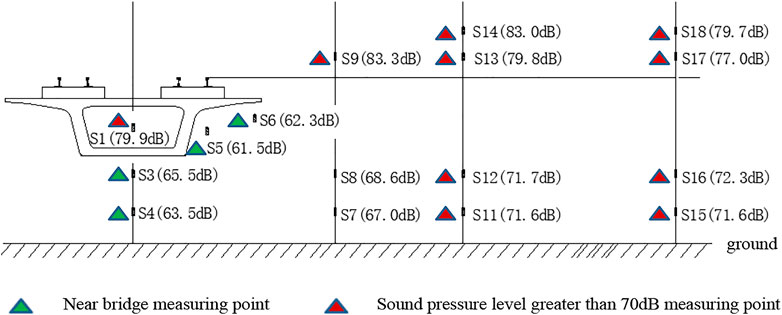
FIGURE 7. Maximum measured noise at each measuring point of the bridge mid-span section.
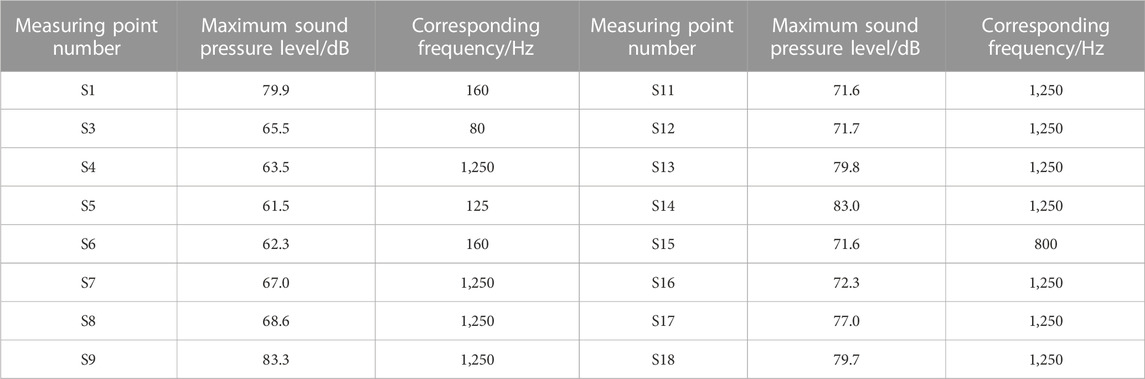
TABLE 2. Maximum measured sound pressure level and corresponding frequency of each measuring point.
Some conclusions can be obtained from Figure 7 and Table 2.
1) The measuring point S1 is located inside the box girder, and the reverberation in the cavity is louder. The maximum sound pressure level is 79.9dB, and the corresponding peak frequency is 160 Hz.
2) The measuring points S3, S5 and S6 are respectively close to the bridge bottom plate, web and wing plate. The noise source is mainly bridge structure noise. The maximum sound pressure levels are 65.5, 61.5, and 62.3dB, and the corresponding peak frequencies are 80, 125, and 160Hz, respectively. This shows that the environmental noise source near the bridge mainly comes from the bridge structure noise. Its distribution law is: bridge floor structure vibration noise > wing plate noise > web noise. The bottom plate structure has the largest vibration sound pressure level, and the bottom plate has the largest radiation area. Therefore, the vibration of the bottom plate contributes the most to the vibration of the bridge structure.
3) The measuring points S9, S13, and S17 are all higher than the top surface of the rail, and the noise sources are mainly wheel/rail noise, pantograph noise and aerodynamic noise. The maximum sound pressure level is 77–83.3dB, and the corresponding peak frequency is 1250 Hz.
4) In the section 30 m away from the outer rail of the track, the dominant frequency of the 4 measuring points is 200–5000Hz; the noise sources are mainly wheel-rail noise, pantograph noise and aerodynamic noise. The maximum sound pressure levels are 71.6, 72.3, 77 and 79.7dB, and the peak frequencies are 800 Hz (S15) and 1250 Hz (S16-S18). This shows that even at a distance of 30 m from the outer track of the track, the environmental noise caused by the high-speed train passing the bridge exceeds the acoustic environment limit of 70 dB [10].
5) As the train speed is greater than 300 km/h, wheel/rail noise, pantograph noise and aerodynamic noise are the main noise sources. The environmental noise caused by high-speed trains passing bridges easily exceeds the acoustic environment standards. Therefore, when high-speed railway bridges pass through urban areas, noise reduction measures must be taken.
3.2 Response function
3.2.1 Frequency response function
According to the formula of the transfer path analysis model, the accurate acquisition of the transfer function is one of the important tasks in the modeling process. In the process of obtaining the frequency response function, it is necessary to more or less consider the issues of efficiency and accuracy. According to many engineering practices and theoretical analysis: 1) The Hv transfer function estimation method can be used to obtain a high-precision transfer function by comprehensively considering the effects of noise at the input and output; 2) The principle of reciprocity is a commonly used reference principle for obtaining transfer functions in the NVH field, which can greatly improve the test efficiency of the transfer function; 3) The coherence function between the input and output signals can be used to evaluate the quality of the transfer function.
Because the frequency of this article is 20Hz–500 Hz, and the number of excitation points is large. Therefore, this article chooses the force hammer as the excitation system. The hammer is mainly composed of hammer head, force sensor and hammer handle, as shown in Figure 8.
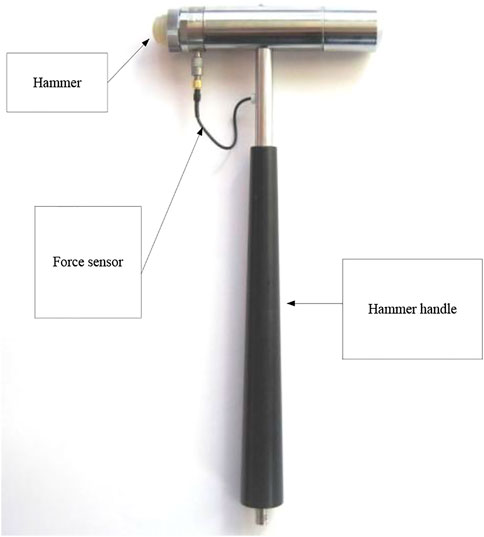
FIGURE 8. Schematic diagram of force hammer.
3.2.2 Test results
Since the estimation of the frequency response function adopts the approximate least square method, the correlation coefficient corresponding to the function can be defined. Abbreviated as the coherence function, the coherence function is a measure of the least squares error of the target frequency response function during the test, and the coefficient of the coherence function is generally within 0–1. If the coherence function is 1, it means that there is a good linear relationship between the input and output functions obtained by multiple tests after averaging; if the coherence function is less than 1, there are some common reasons: irrelevant noise interference; system nonlinearity is strong; analysis leakage is serious.
The coherence function can well reflect the degree of measurement quality. After the frequency response function test is over, the coherence corresponding to each function needs to be checked to see if the coherence function is greater than 0.95 in the frequency range of 20Hz–300 Hz.
It can be seen from Figure 9 that the coherence function of each excitation point is greater than 0.95 in the frequency range of 20Hz–300 Hz. It is even 0.99 at some frequencies, so the test result is valid.
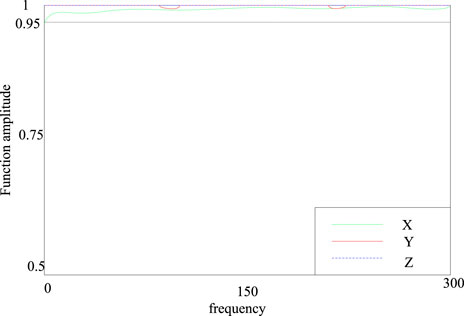
FIGURE 9. Coherence function curve.
4 Noise reduction analysis
4.1 Noise control
Noise is an example of auditory pollution, which is a different type of environmental pollution from other types. The noise’s singular attribute is its one-sidedness. Noise pollution has a brief duration, cannot go very far, and does not precipitate in the environment. With the management and control of the noise source, the noise pollution will end right away, and only transient noise from nature—without the matching residue—will be produced in the environment. A difficulty with managing noise on raised rail pavement involves local development, regulation, and noise management strategies. Technology-wise, the management of noise sources, the way to lessen noise during sound wave propagation, the proper planning and layout of elevated buildings, the management methods include detection and analysis, the drafting of various regulations, treaties, standards, and even the improvement of pavement materials. The majority of road noise is produced by moving cars. In contrast to conventional noise, the source of this noise is a moving vehicle, which creates random noise that affects a large area and is quite harmful.
Two things influence the bridge structure’s near-field noise. One way that the sound waves from the plate’s radiation will interact with one another is by diffraction or direct impact, and another way is through the plate’s unique sound radiation properties. Many factors influence the radiation noise of circuit boards. The wavelength of the vibration mode, the size, and the shape of the structure all affect the surface area of the plate, the mean square value of the surface normal vibration speed, and the radiation efficiency of the plate in a particular frequency band. As a result, even though the bridge deck has the highest radiation surface area, it frequently has lower radiation noise sound pressure levels than the other two measuring stations in specific frequency bands. With increasing transverse distance, the total sound pressure level of noise at each measurement point steadily falls, although the rate at which it does so varies depending on the height above the ground. The ground reflection wave therefore lateralizes at the near-Earth observation site.
4.2 Internal sound insulation and noise reduction
Some space on the elevated railway can be used to install sound-absorbing materials. In this sound insulation calculation, 0.01 m thick aluminum plates are selected to be installed on both sides of the elevated railway. It is impossible to use a whole piece of aluminum plate for sound insulation in actual projects, and the aluminum plate should be installed on the frame. The sound insulation frame in the picture is simulated by beam elements. However, since the rigidity of the frame is much greater than that of the aluminum plate, the material stiffness of the beam element is set to 2E12 to make the rigidity much greater than the rigidity of the aluminum plate. In Virtual. Lab, the acoustic finite element method is used to solve the sound pressure of the field point after the sound insulation treatment, and the vibration velocity of the elevated railway structure is used as the acoustic boundary condition. Then, it uses the acoustic-structure coupling method to calculate the noise reduction effect after sound insulation. The sound insulation calculation needs to calculate the structural mode of the sound insulation aluminum plate. The structural mode is calculated in ANSYS, and the boundary conditions are four-sided fixed constraints. The contact part between the sound insulation structure and the upper and lower acoustic cavities is used as the acoustic-solid coupling contact surface, and the vibration speed of the contact surface is the same as the vibration speed of the aluminum plate. The calculation frequency is 20–200 Hz, and the calculation step is 1 Hz. Figure 10 shows the comparison between the sound insulation treatment and the non-sound insulation treatment for each field point. The calculation result is shown in Figure 10.
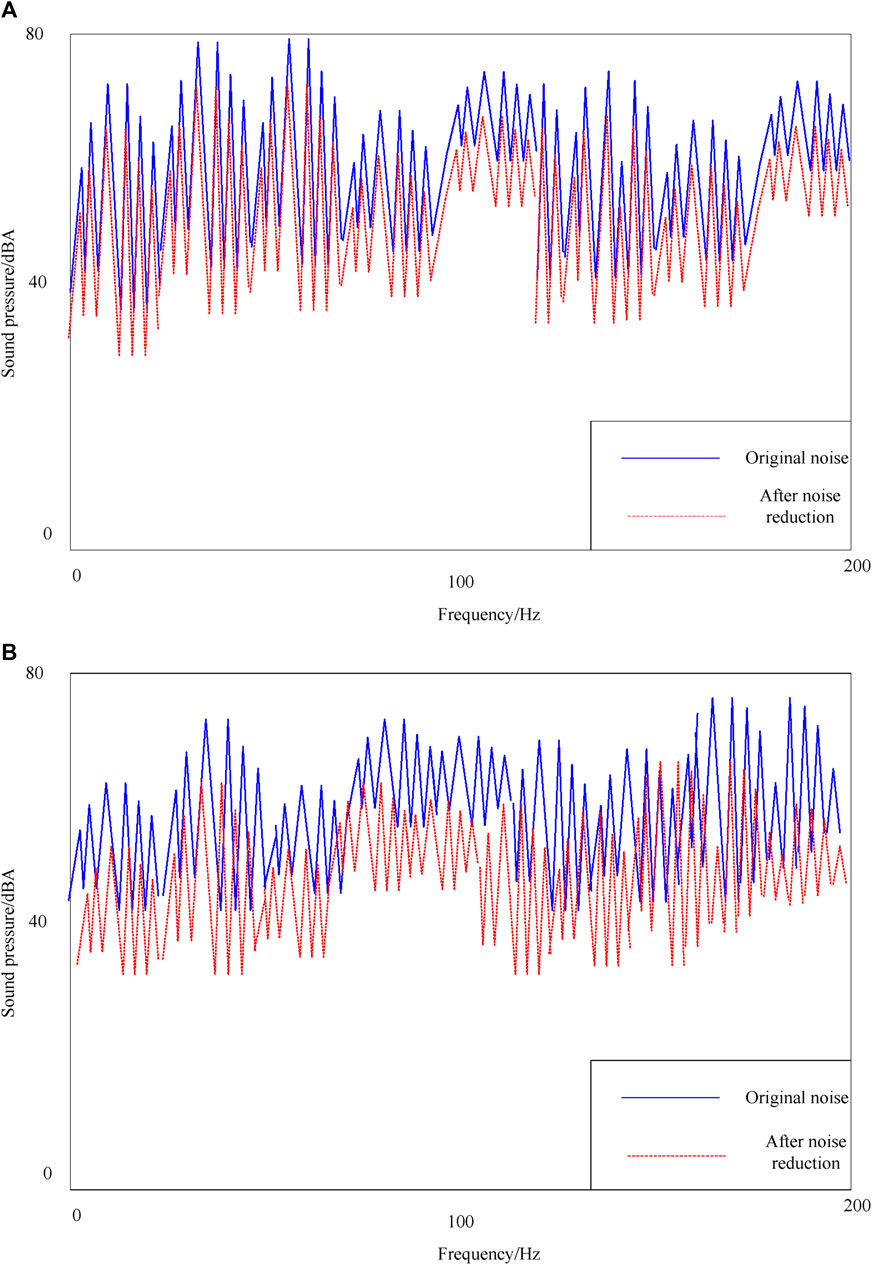
FIGURE 10. The low-frequency noise reduction effect of each field point with sound insulation (A) and noise reduction (B).
It can be seen from Figure 10 that sound insulation and noise reduction have obvious effects on low frequencies. The average amount of noise reduction in the low frequency band of each site is about 5dBA, and the highest noise reduction amount can reach 10dBA. Each acoustic cavity in the high frequency range also has a significant noise reduction effect. As the frequency increases, the amount of sound insulation decreases, which shows that the sound insulation aluminum plate works in the rigidity control area. However, the sound insulation aluminum plate needs to be installed in the entire ceiling position, and cannot be installed in the optimized noise reduction area. Because partial sound insulation will cause sound leakage, the noise reduction effect will be worse.
The term “sound barrier” refers to a mechanism that disrupts the noise propagation process in order to reduce noise in a particular location. In other terms, it was a strong wall that completely muffled outside noise. Compared to when there is no barrier, there is less cirraction, noise wave over the sound barrier’s maximum point, and sound energy produced by the sound point. When the sound barrier is parallelly installed on both sides of the road, reflection will frequently occur, and it will be accompanied by noise waves that cross the highest barrier. This will cause diffraction to the sound point phenomenon, which will, to some extent, lessen the sound barrier insertion loss.
In general, a sound barrier with a height of 3–6 m reduces noise in the surrounding region [23]. There are three ways for a sound wave to travel when it encounters a sound barrier during its course of propagation: first, it must cross the sound barrier at its highest point in order to reach the sound point; second, it must pass through the obstacle, in this case the sound barrier; and third, it must reflect off the wall surface of the sound barrier in order to change its course of travel [24, 25].
5 Conclusion
The development of high-speed railway has shortened the distance between cities, but the noise on the elevated railway will make people near the railway feel noisy. As the research on noise analysis becomes more and more in-depth, there are more and more related ideas and results, and there are more and more ways to deal with noise. This article mainly uses artificial intelligence algorithm as a breakthrough point to find a more convenient and effective way to solve the problem of elevated railway noise. In the article, the current situation of artificial intelligence algorithms and the background of the noise problem of elevated railways are explained, and the research purpose and significance of this article are put forward. After that, the artificial intelligence algorithm and the principle of path analysis are introduced, fully demonstrating the combination of artificial intelligence algorithm and traditional path analysis. Then the path analysis of the elevated railway noise studied in this paper is carried out. In the analysis, the noise of the elevated railway was measured at different heights and distances, which is very important for the analysis. Finally, through traditional path analysis, it is concluded that railway noise includes wheel/rail noise, pantograph noise and aerodynamic noise. By understanding the specific noise types, the noise reduction can be studied with more different noise types, to play a better noise reduction research, so that the noise in the way of transmission. It is necessary to conduct the noise reduction analysis. Therefore, this article has conducted two analyses of sound insulation and noise reduction for noise reduction, and the results show that the effect of sound insulation and noise reduction will be better, and the effect of noise reduction can reach 5–10 dB.
Data availability statement
The original contributions presented in the study are included in the article/Supplementary Material, further inquiries can be directed to the corresponding author.
Author contributions
WL-X: Methodology, Writing—original draft, Formal analysis. LX-Y: Conceptualization, Supervision. LK: Writing—review and editing. All authors contributed to the article and approved the submitted version.
Funding
The work described in this paper was supported by the Engineering Research Center of Railway Environment Vibration and Noise, the Ministry of Education, the Natural Science Foundation of China (51978264), the Science Research Project of Jiangxi Provincial Department of Education (GJJ219001), Project of science and technology plan of Nanchang Institute of Science and Technology (NGKJ-21-01), the Natural Science Foundation of Jiangxi Province (20223AEI91004).
Conflict of interest
The authors declare that the research was conducted in the absence of any commercial or financial relationships that could be construed as a potential conflict of interest.
Publisher’s note
All claims expressed in this article are solely those of the authors and do not necessarily represent those of their affiliated organizations, or those of the publisher, the editors and the reviewers. Any product that may be evaluated in this article, or claim that may be made by its manufacturer, is not guaranteed or endorsed by the publisher.
References
1. Tomita R, Inoue K. A questionnaire survey for childcare workers on noise and vibration of nursery schools located under the elevated railway[J]. AIJ J Technol Des (2019) 25(59):211–4. doi:10.3130/aijt.25.211
2. Shiva A, Purohit R, Rana RS, Koli DK. Noise and vibration emissions of railway bridges. Mater Today Proc (2017) 4(2):3745–53. doi:10.1016/j.matpr.2017.02.270
3. Dakin J, Stewart B. Reducing noise and vibration from the high speed railway[J]. Permanent Way Inst J Rep Proc (2017) 135(1):42.
4. Song R, Liu LY, Dong CY, Xu B, Liu QM. Comparative study on vibration and noise of 40 m and 32 m box girder in high-speed railway[J]. J Railway Eng Soc (2018) 35(4):54–59.
5. Ji YL, Chang JH. Vibration and noise characteristics of coaxial magnetic gear according to low-speed rotor structure[J]. J Mech Sci Technol (2017) 31(6):2723–2728. doi:10.1007/s12206-017-0515-4
6. Yang Y, Bi Y, Zhang N, Xiang R, Shen L, Tang M, et al. Influence of different loads and excitations on vibration and noise of off-highway high pressure common rail diesel engines[J]. Zhendong yu Chongji/Journal of Vibration and Shock (2018) 37(8):60–67.
7. Zhang X, Wang Y, Liu C, Chen Z. A novel approach of battery pack state of health estimation using artificial intelligence optimization algorithm. J Power Sourc (2018) 376(1):191–9. doi:10.1016/j.jpowsour.2017.11.068
8. Xu JP, Ai B. Artificial intelligence empowered power allocation for smart railway. IEEE Commun Mag (2021) 59(2):28–33. doi:10.1109/mcom.001.2000634
9. Cao L. Road condition judgment system of railway transportation based on artificial intelligence recognition technology. Int J Syst Assur Eng Manag (2022) 14:718–27. doi:10.1007/s13198-021-01509-w
10. Andrea F, Matteo F, Salvatore M. Rock falls impacting railway tracks: Detection analysis through an artificial intelligence Camera prototype. Wireless Commun Mobile Comput (2017) 2017:1–11. Article ID 9386928. doi:10.1155/2017/9386928
11. Polinski MP, Meyer GR, Lowe GJ, Abbott C. Seawater detection and biological assessments regarding transmission of the oyster parasite Mikrocytos mackini using qPCR. Dis Aquat Organisms (2017) 126(2):143–53. doi:10.3354/dao03167
12. Gong WD, Griffin MJ. Measuring, evaluating and assessing the transmission of vibration through the seats of railway vehicles. J rail Rapid transit (2018) 232(2):384–95. doi:10.1177/0954409716671547
13. Chen E, Jie JM, Rui SM, Gao M, Zhu S, Zhou J, et al. A new smart wristband equipped with an artificial intelligence algorithm to detect atrial fibrillation. Heart Rhythm (2020) 17(5):847–53. doi:10.1016/j.hrthm.2020.01.034
14. Wang FZ, Sohail A, Wong WK, Azim QUA, Farwa S, Sajad M. Artificial intelligence and stochastic optimization algorithms for the chaotic datasets. Fractals (2022). doi:10.1142/S0218348X22401752
15. Ciulla G, D'Amico A, Brano VL, Traverso M. Application of optimized artificial intelligence algorithm to evaluate the heating energy demand of non-residential buildings at European level. Energy (2019) 176(1):380–91. doi:10.1016/j.energy.2019.03.168
16. Wang Z, Fang B. Correction to: Application of combined kernel function artificial intelligence algorithm in mobile communication network security authentication mechanism. The J Supercomputing (2019) 75(9):5965. doi:10.1007/s11227-019-02949-9
17. Mazurowski MA. Artificial intelligence in radiology: Some ethical considerations for radiologists and algorithm developers. Acad Radiol (2020) 27(1):127–9. doi:10.1016/j.acra.2019.04.024
18. Mourad M, Hussein AI, Taha HA. Artificial intelligence based cooperative spectrum sensing algorithm for cognitive radio networks. Proced Comput Sci (2020) 163(C):19–29. doi:10.1016/j.procs.2019.12.081
19. Al-Obaidy F, Mohammadi FA. Predictions optimal routing algorithm based on artificial intelligence technique for 3D NoC systems. Microsystem Tech (2021) 27(9):3313–23. doi:10.1007/s00542-020-05084-1
20. Baldwin D, Gustafson J, Pickup L, Arteta C, Novotny P, Declerck J, et al. Development and external validation of a new convolutional neural networks algorithm derived artificial intelligence tool to predict malignancy in pulmonary nodules. Lung Cancer (2020) 139(1):S7–S8. doi:10.1016/s0169-5002(20)30045-3
21. Bhamidipati S, Kim KJ, Sun H, Orlik PV. Artificial-intelligence-based distributed belief propagation and recurrent neural network algorithm for wide-area monitoring systems. IEEE Netw (2020) 34(3):64–72. doi:10.1109/mnet.011.1900322
22.Artificial intelligence: Algorithm masters poker. Artificial intelligence: Algorithm masters poker. Nature (2017) 543(7644):153. doi:10.1038/543153e
23. John MM, Hanief M. Frictional noise mitigation using synergetic approach of laser surface texturing and bio-lubrication. Tribology Int (2023) 178(2023):108056. doi:10.1016/j.triboint.2022.108056
24. Hong Y, Sun C, Xiu S, Xu C, Ma L, Zou X. Strengthening surface generation mechanism of carburizing-assisted grinding. Tribology Int (2023) 180(2023):108300. doi:10.1016/j.triboint.2023.108300
Keywords: artificial intelligence algorithm, path analysis, noise analysis, noise reduction processing, noise transmission
Citation: Ling-Xiao W, Xiao-Yan L and Kun L (2023) Research on elevated orbit noise propagation based on AI algorithm and propagation path analysis. Front. Phys. 11:1161977. doi: 10.3389/fphy.2023.1161977
Received: 09 February 2023; Accepted: 09 May 2023;
Published: 25 May 2023.
Edited by:
Fei Yu, Changsha University of Science and Technology, ChinaReviewed by:
Xinbiao Xiao, Southwest Jiaotong University, ChinaZhongliang Xie, Northwestern Polytechnical University, China
Jie Jin, Hunan University of Science and Engineering, China
Copyright © 2023 Ling-Xiao, Xiao-Yan and Kun. This is an open-access article distributed under the terms of the Creative Commons Attribution License (CC BY). The use, distribution or reproduction in other forums is permitted, provided the original author(s) and the copyright owner(s) are credited and that the original publication in this journal is cited, in accordance with accepted academic practice. No use, distribution or reproduction is permitted which does not comply with these terms.
*Correspondence: Lei Xiao-Yan, 0494@ecjtu.edu.cn