Research on damage visualization of concrete structures based on electrical resistance tomography
 Chenhui Su
 Wenchao Zhang1
 - 1Shandong Key Laboratory of Intelligent Buildings Technology, School of Information and Electrical Engineering, Shandong Jianzhu University, Jinan, China
- 2School of Control Science and Engineering,University of Jinan, Jinan, China
Concrete is used in the construction of high-rise buildings, large bridges, viaducts and other structures for a wide range of applications, and damage to the internal structure of concrete may to lead to catastrophic accidents. In this paper, electrical resistance tomography is applied to concrete structural damage detection. The electrical resistance tomography imaging reconstruction algorithm is studied. The advantages and disadvantages of five image reconstruction algorithms are investigated through simulation experiments as well as experiments, and the improved normalized image reconstruction algorithm is selected. The feasibility of the used electrical resistance tomography system is explored by conducting imaging experiments with water bodies, and the results show that the built system is feasible. Finally, using the resistive chromatography imaging system, a current excitation is applied to the concrete, and the data acquisition system collects the boundary voltage values carrying the internal conductivity distribution of the concrete, and images its internal structure through the image reconstruction algorithm. It is achieved to detect damage inside the concrete and to visualize the imaging when there are pores in the concrete structure and when water penetrates in the concrete structure.
1 Introduction
The structure of concrete not only can reasonably play the excellent performance of steel but also can effectively play the characteristics of concrete, and combine the characteristics of both cleverly and efficiently [1]. Because of these advantages, it is widely used in civil engineering. For example, concrete structures are built in large numbers in high-rise buildings, large bridge structures, port terminals, piers of viaducts, urban roads, and nuclear facilities that are closely related to people’s lives. The infrastructure of these concrete structures faces severe tests throughout their service life [2]. The sudden failure of such concrete structures, especially of particularly significant civil structures, usually brings unpredictable disasters [3, 4].
In order to maintain the quality of the project to a certain extent under various natural and man-made destructive forces, in addition to the regular testing of the main building materials [5–7], the design often requires testing of certain important components. When quality problems occur in concrete structures during construction, for example, poured concrete test blocks fail to achieve the expected results, and buried reinforcement deviates from the required position of the design. When a concrete structure is subjected to an unavoidable natural disaster, it is necessary to determine whether the building is still serviceable and whether it needs to be reinforced. There are also other natural factors such as weathering and natural rusting.
At present, with the development of science and technology, considerable results have been achieved in the study of both theories and methods of structural health monitoring. The main theoretical methods to achieve health monitoring of concrete structures are [8]: 1) Detection of structural health status is achieved by loading mechanical waves in concrete structures, monitoring the propagation and response of mechanical waves in the structure; 2) The detection of the health status of concrete structures is achieved by applying electromagnetic waves or currents in concrete structures [9] to detect their conduction or response in concrete structures, and the health status of concrete structures can be reflected in the electrical parameters of the structure; 3) Heat propagation or response in concrete structures to detect structural health [10]; 4) The sensing material, device or structure itself is embedded in the concrete structure using functional materials [11] to achieve rapid and direct export detection of structural health-related parameters; 5) Other methods, such as direct observation method, X-ray CT method et al. [12].
In the above discussion, there are many methods to detect the health of concrete structural materials and structures, but because of the complexity of such things themselves, it is difficult to find a universally effective structural health monitoring method in the short term [13]. In this paper, Electrical Resistance Tomography (ERT) is proposed to monitor the health of concrete structures, which has rarely been reported in the application of concrete structures. ERT originated from the electrical impedance tomography technology in the medical field and is used in the research of medical detection. Since the British scholar Hounsfield g n and others manufactured X-ray scanners, ERT technology has rapidly appeared in the medical field. Metherall [14] used electrical resistance imaging technology to complete the scanning and detection of human organs. Later, ERT technology was applied from the medical field to the industrial field, such as detecting the characteristics of liquid velocity and flow in the pipeline. Wagner [15] et al. Used ERT technology to complete the detection of carbon dioxide content. Ruzinsky [16] designed and manufactured an 8-electrode signal acquisition array, and applied electrical resistance imaging technology to study and analyze the influence of impurities in the pipeline on fluid distribution. Zhejiang University [17] studied and analyzed the sensitive field distribution of gas-liquid two-phase flow by using ERT detection system with electrode array of 18. At present, ERT technology is also applied in the field of geological exploration. Yoon [18] uses electrical resistance imaging technology to detect the content of pollutants in soil. China University of mining and technology [19] used ERT technology to complete the study of detecting soil resistivity.
The ERT health monitoring method is to measure the boundary voltage of the concrete structure by applying current or voltage to the surface of the concrete structure to obtain the voltage value carrying its internal electrical information distribution, so that the image reconstruction technique can be used to reconstruct the composition reflecting the interface to be measured, thus realizing the health status monitoring of the concrete structure.
Based on the above characteristics and the basic theory of ERT imaging, a detailed study of multiple image reconstruction algorithms and a normalized imaging algorithm are proposed, and a better image reconstruction algorithm is selected for damage detection of concrete internal structure through simulation experiments. A good resistive chromatography imaging system was built, and a water body experiment was conducted. Firstly, the experimental object was used as a water body, and the image reconstruction of the foreign matter set in the water body was carried out. Using the built resistance chromatography imaging system to realize the damage detection of concrete structure, the damage of concrete holes and water penetration visualization imaging detection were realized.
2 Basic theory of ERT
The ERT imaging system generally consists of three major parts [20]: array electrodes, data acquisition system and computer, as shown in Figure 1. The information of the measured object is acquired by the data acquisition system through the array electrodes, such as conductivity, electrical impedance, etc., and then performs data processing and passes the digital information to the computer, which will reconstruct the image of the measured object according to the appropriate reconstruction algorithm.
1) Array electrode. Array electrodes can also be called sensors in electrical impedance imaging system. For ERT system, the function of array electrodes is to change the distribution of the measured surface into the potential information between each electrode pair. Array electrodes provide information for the system, which directly limits the quality of subsequent data processing and image reconstruction.
2) Data acquisition system. Through the collected data, the information of reactant field impedance parameter distribution is obtained and transmitted to the image reconstruction algorithm system.
3) Image reconstruction computer. Through the obtained data, the image reconstruction is completed. Dynamic imaging and static imaging are two imaging methods of ERT. This paper will focus on static imaging.
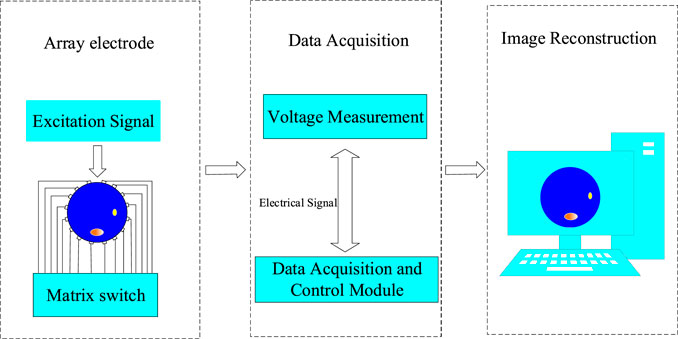
FIGURE 1. Block diagram of ERT system.
The mathematical theoretical basis of ERT [21] is the Radon transform and the Radon inverse transform. An array sensor is used to obtain projection data in all directions inside the object field of the interface to be measured in a non-invasive way (i.e., Radon transform is realized), and the image reflecting the distribution information of the substance to be measured in two or three dimensions is reconstructed through a certain reconstruction algorithm (i.e., Radon inverse transform is realized).
Let
is the Radon transform,
Let
Among them,
Substituting the above equation into Eq. 3, the expression for the
The
Among them,
The mathematical model of the sensitive field of the resistive laminar imaging system, calculated from the equation
Among them, D - electric induction strength,
In an isotropic medium, there are
Where
Since there is a current sink or current source in the sensitive field, namely the dispersion of the current density is zero everywhere in the field, the following equation holds for any point in the ERT field.
Where
In a uniform field,
3 Image reconstruction algorithm
The positive problem and the negative problem are the two main problems of ERT. Simply put, when a known current is injected into the interior of the object under study and the internal conductivity distribution of the object is known, solving the boundary voltage from it is the positive problem for ERT. When the boundary voltage is known and the injection current is known, calculating the resistivity distribution of the object of study is the negative problem, which is also called the inverse problem. The inverse problem is the problem of solving the internal conductivity distribution by the boundary voltage, which is a mathematical inverse problem and a physical inverse process, and is essentially a problem of finding the microquotient [22]. Currently, scholars generally consider the inverse problem of resistive tomography as pathological in the sense that the obtained internal resistivity distribution of the object has a very large gap in spite of the small variation of the measured boundary voltage. This characteristic is also the biggest problem that leads to resistive tomography imaging.
Generally speaking, image reconstruction algorithms are used to calculate the distribution of resistivity in the measured field through boundary conditions, which is the core problem of ERT imaging. The first problem that needs to be solved in order to implement resistivity tomography is the selection of the image reconstruction algorithm [23]. However, there are several difficulties in the image reconstruction of resistivity tomography, which are mainly reflected in nonlinearity, pathological, underqualification.
The “soft field” effect of the sensitive field is responsible for most of the difficulties in resistive tomography. On the physical level, because the direction of the current flow does not change abruptly, the precise discrimination of the physical boundaries of the internal medium to be measured is the most difficult aspect of resistive tomography imaging. The “soft field” effect in the measured field, i.e., the distribution of conductivity changes with the change of the measurement medium. Namely the distribution of conductivity, in addition to the location of the pixel point, is also related to the influence of the medium on conductivity throughout the interval [24]. This makes the solution of conductivity very complicated, making it a special nonlinear optimization problem.
Asymptotic methods and iterative methods are usually used to deal with complex nonlinear optimization problems. Typical representatives of iterative algorithms include Landweber algorithm [25], Newton-Raphson (NR) algorithm [26], and Conjugate Gradient (CG) algorithm [27]. The typical representatives of non-iterative algorithms are Linear back-projection (LBP) algorithm [28] and sensitivity coefficient method [29].
In order to discuss the imaging effect of the 5 algorithms, COMSOL3.5 simulation software was used to simulate and analyze the ERT system in this paper. In the design, five models were set up, as shown in the five models at the top of Figure 2. The first four were circular models, which contained one circle, two circles, three circles and half circles respectively. The fifth model was a square containing a circle, and the five models all used the same simulation conditions, 16 electrodes, adjacent excitation, and counterclockwise direction for data acquisition. The boundary voltage values collected by model 1 are shown in Figure 2. Each model used five image reconstruction algorithms, and the reconstruction results are shown in Figure 3.
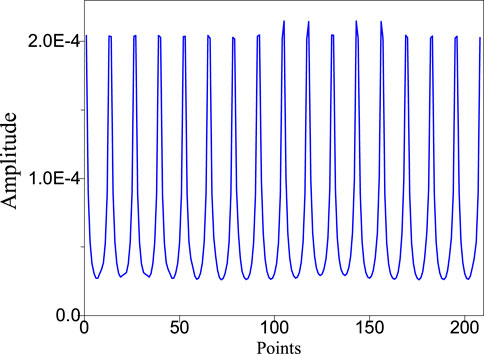
FIGURE 2. Boundary voltage values collected by model one.
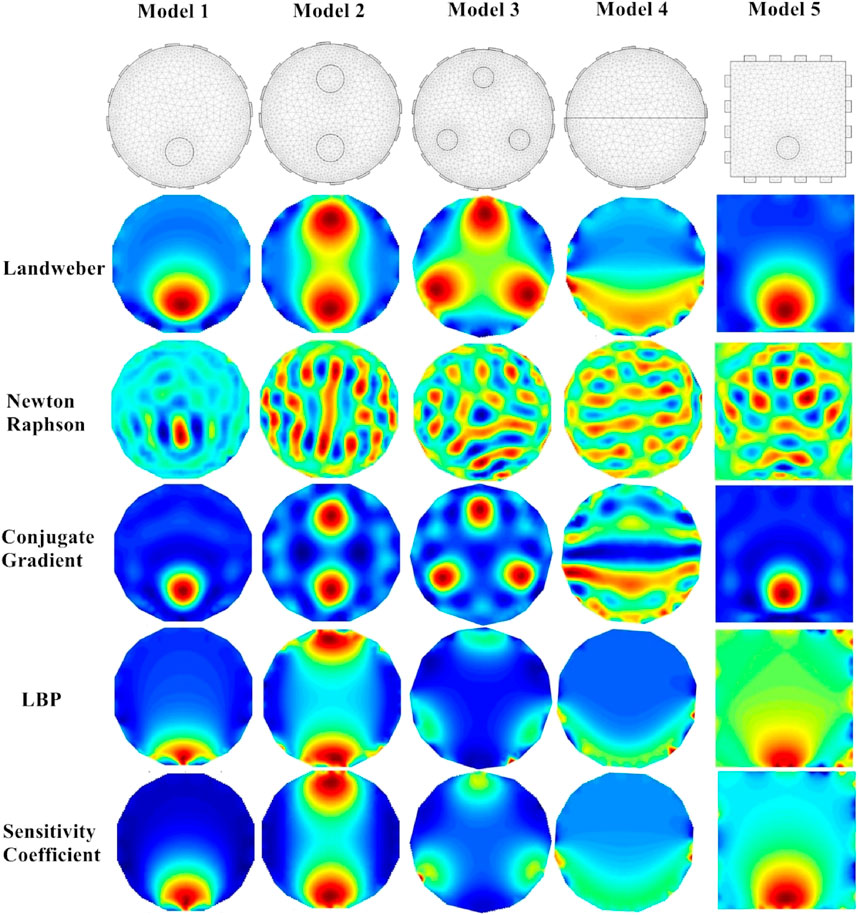
FIGURE 3. Reconstruction results of 5 models.
In Figure 3, it can be seen that the conjugate gradient method is the best reconstruction, followed by the Landweber method, then the sensitivity coefficient method, then the LBP algorithm, and finally the Newton-raphson algorithm.
In the ERT linearization algorithm, the construction of the sensitivity matrix directly affects the quality of the reconstructed image because of solving the inverse problem itself: nonlinearity, pathology and other problems. The normalization of the sensitivity matrix is a way to make the sensitivity field distribution more uniform, and the sensitivity matrix after being normalized increases the sensitivity at the center of the measured field, which can effectively improve the quality of the reconstructed image. Because the sensitivity matrix
Assume that the matrix
Where
By choosing the ideal diagonal element
Where
In this paper, the above five models were performed image reconstruction, and the image reconstruction algorithms were all normalized, and their image reconstruction results are shown in Figure 4.
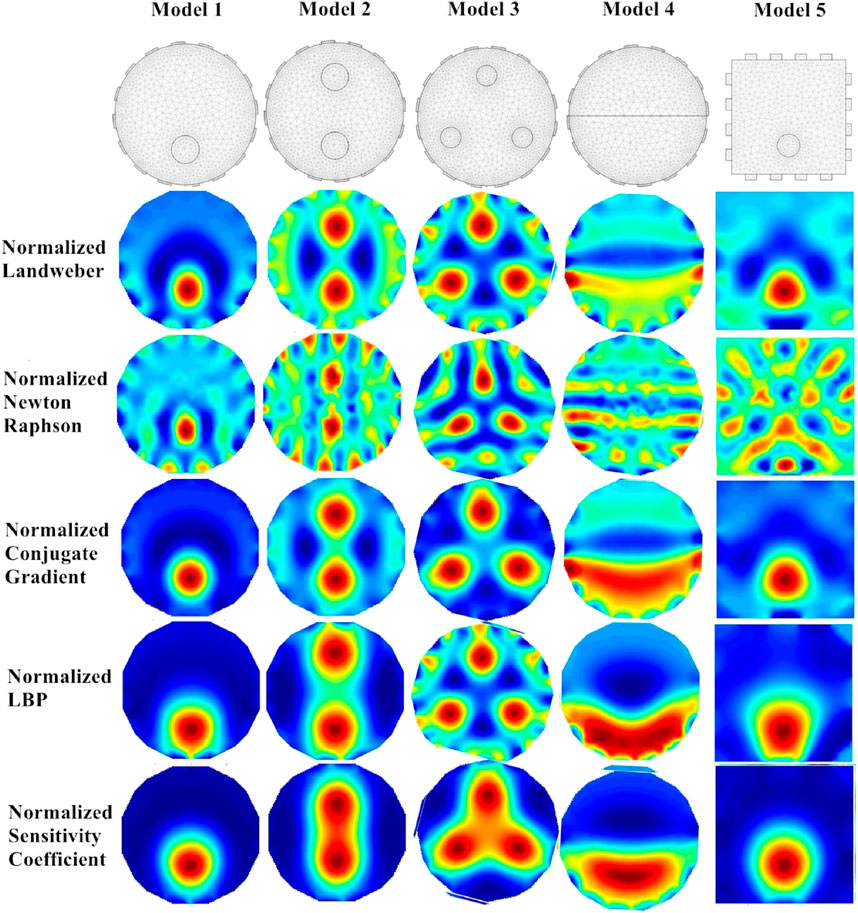
FIGURE 4. Reconstructed image after normalization.
It can be seen that the quality of the reconstructed images is obviously improved after normalization of the sensitivity matrix, especially for model IV. The quality of the reconstructed images after normalization of the sensitivity coefficients method is very much improved, which indicates that the normalized sensitivity coefficients method is more effective for the reconstruction of more complex cases in the field.
4 Verification of concrete internal damage identification based on ERT
4.1 Imaging system commissioning with water bodies as experimental objects.
The model design of this paper is based on the object of the water body, because water is a more homogeneous substance compared with the concrete structure we are investigating, which is more conducive to the debugging of the whole ERT system.
This paper made the experimental container containing water, the diameter of the container was about 20cm, the height of the water inside was about 18cm, as shown in Figure 5. From the order of activity of metals table, considering the economy, the design based on the experiment of the production of electrodes material selected copper, electrode size width of about 3cm, length of about 4cm, thickness of about 3 mm.
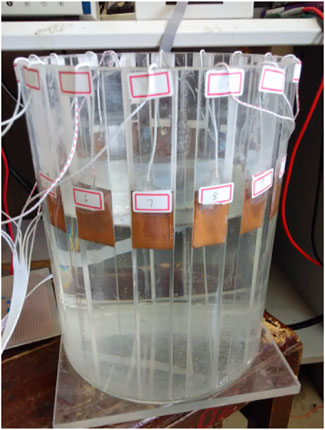
FIGURE 5. Experimental container.
In the actual experimental study, this paper was conducted in five groups of experiments for imaging experiments with a body of water, respectively, an empty circular medium placed on the left side of the water body, a circular medium placed on the right side of the water body, two circular mediums placed at the same time, a square wooden stick placed, and a wooden board placed in the water body, as shown in the five photos at the top of Figure 7.
In the above five experiments, the current excitation was applied to them respectively, and the boundary voltage projection data were collected through the data acquisition system. Adjacent mode is used for data acquisition. Figure 6 shows the boundary voltage data collected in Experiment 1, and the image reconstruction was performed through five image reconstruction algorithms written by MATLAB, and the reconstructed image results are shown in Figure 7.
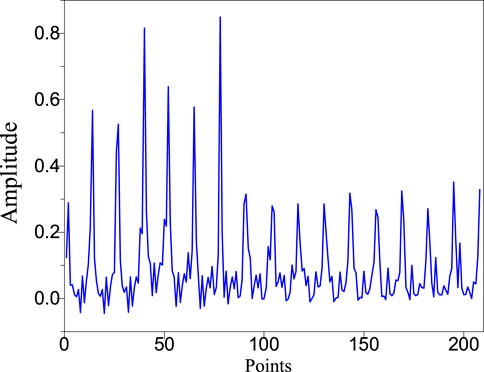
FIGURE 6. Boundary voltage data collected for Experiment 1
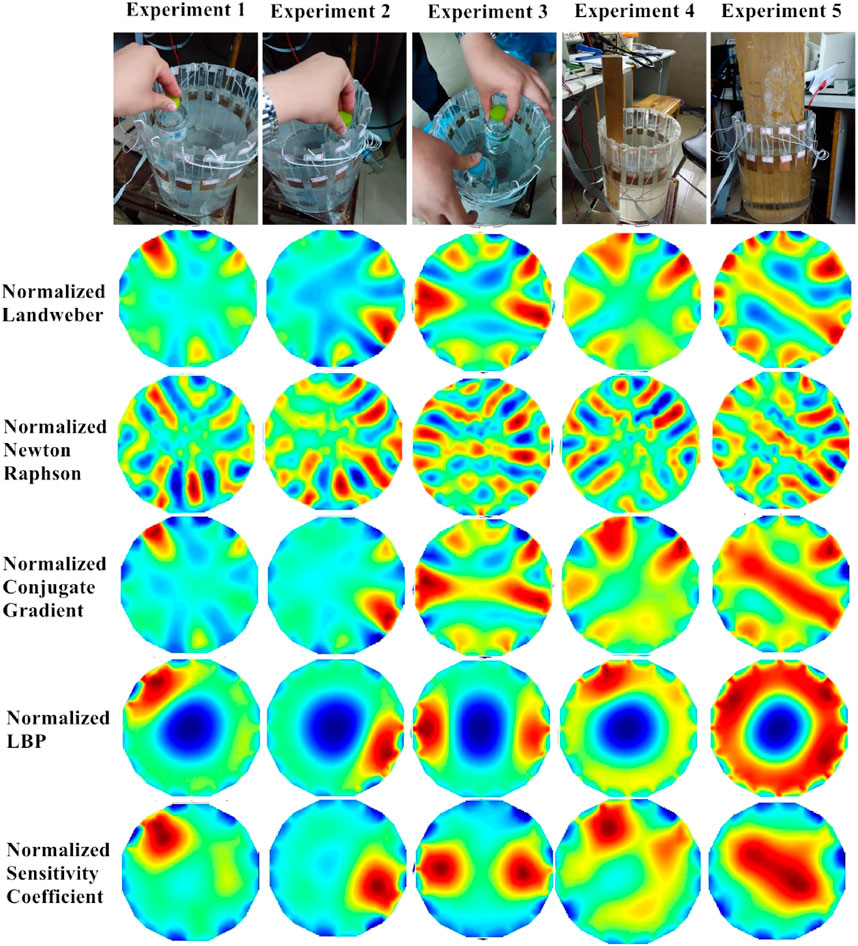
FIGURE 7. Reconstructed image of water body experiment.
In Figure 7, it can see that the normalized Landweber algorithm can basically see the location of the substances in the water body in general for the five experimental cases, but it is not very accurate. The normalized Newton-Raphson is not very sensitive to the reconstruction effect of these five experimental cases, and basically cannot get the location of the substances contained in the water body. In experiment 5, we can see the location of the wooden board placed in the water body. Normalized conjugate gradient algorithm and normalized Landweber algorithm imaging effect is roughly equivalent. Because of the sensitivity of the center of the sensitive field, normalized LBP algorithm is relatively low, so the center of the material can not be seen, and always appear artifacts in the center of the location. Normalized sensitivity coefficient method reconstruction effect is the best, both in the location and size can be a good response to the body of water contained in the substances, especially for experiment IV, but also can clearly reflect the geometry of the substances contained in the water body.
The above experiments show that the electro-layered imaging system can image the substances contained in the water body well, and the best imaging algorithm is the normalized sensitivity factor method.
4.2 Experimental study of ERT in concrete flaw detection.
Considering the economic and convenient type, only the steel sheet electrode shown in Figure 8 was used in the test of concrete structure, which also has stable chemical properties.
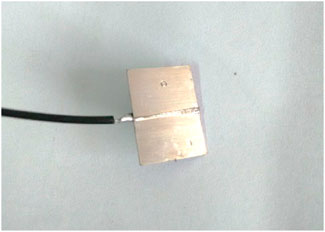
FIGURE 8. Steel sheet electrodes used in concrete structures.
The concrete test blocks made in this paper used a sand rate of 2 and a water-cement ratio of 0.6. A bag of 1350 g of standard sand was used for each test block. After the concrete has set and stabilized, the mold was demolded to obtain the concrete test blocks shown in Figure 11. a and Figure 12. a. Current excitation was applied to the concrete specimen blocks and the boundary voltage values were collected using a data acquisition system as shown in Figure 9.
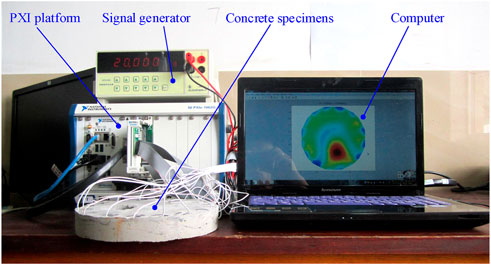
FIGURE 9. Measure equipment.
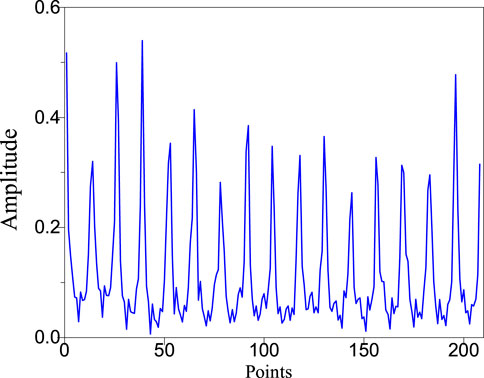
FIGURE 10. Boundary voltage values collected from circular concrete specimens.
ERT measurements were obtained by using 16 electrodes placed uniformly around the concrete sample. In this paper, adjacent excitation and adjacent measurements are used. With a current of 20 mA, current was injected into the adjacent electrode pairs while the remaining electrodes floated and the voltage on each remaining adjacent electrode was measured. After using all adjacent electrode pairs as sources, the conductivity distribution over the cross section was mathematically reconstructed from the voltage measurements by an appropriate reconstruction algorithm.
The image reconstruction of the two concrete test blocks fabricated using the model built by Comsol finite element package and the image reconstruction algorithm written under MATLAB is shown in Figure 11. b and Figure 12. b, respectively.

FIGURE 11. (A) shows a circular concrete specimen with 16 electrodes, (B) shows its reconstruction image.
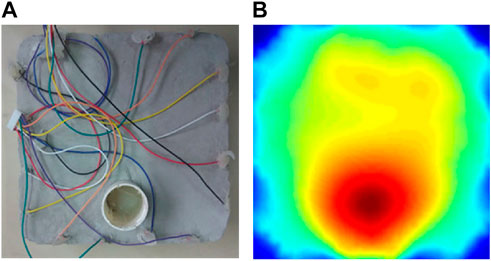
FIGURE 12. (A) shows a square concrete specimen with 16 electrodes, (B) shows its reconstruction image.
From the reconstruction results, it can be seen that the application effect of ERT in concrete structure damage detection is still possible, as in Figure 11, the reconstructed image can not only achieve the detection of the damage location, but also the reconstruction of the damage geometry reproduction. In Figure 12, the reconstruction effect is less satisfactory, but the location of the damage can also be reproduced. The reason for the unsatisfactory reconstruction effect is that the square sensitivity matrix is more unevenly distributed, resulting in numerous reconstruction image artifacts.
4.3 Experimental study of seawater penetration in concrete structures.
The paper concludes with a study of seawater penetration in concrete structures. In this paper, three comparative tests were designed by placing the test blocks vertically in salt water (as shown in Figure 13) and wetting approximately one-third, one-half and all of the test blocks, respectively, as shown in Figures 14–16. a.and b shows its reconstructed image.
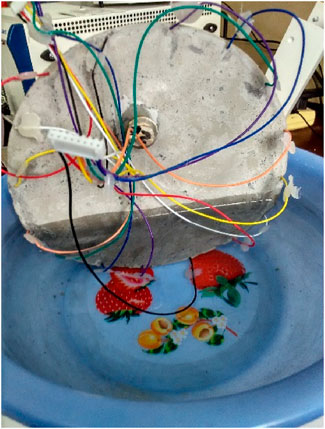
FIGURE 13. A shows the reinforced concrete specimen after rusting.
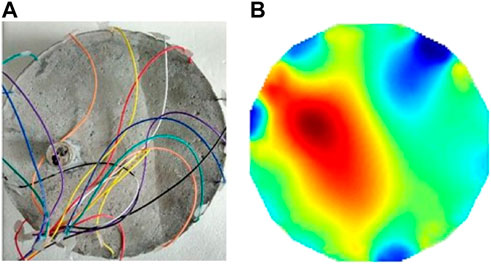
FIGURE 14. (A) shows one third of the wetted concrete specimen, and (B) shows its reconstructed image.
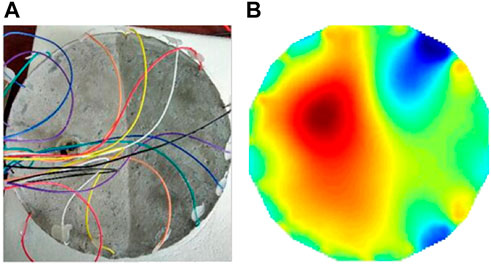
FIGURE 15. (A) shows a one-half wetted concrete specimen, and (B) shows its reconstructed image.
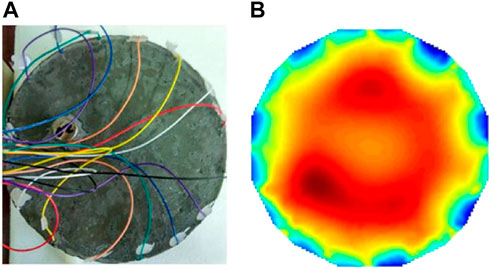
FIGURE 16. (A) shows the fully wetted concrete specimen, and (B) shows its reconstructed image.
The current excitation is applied to the concrete specimen, the boundary voltage is collected by the data acquisition system, and it is imaged by the image reconstruction algorithm written. The imaging effect is shown as in Figures 14–16. b, respectively, in which the change of the concrete specimen after wetting can be seen.
5 Conclusion
In this paper, the problems and methods related to the application of resistance chromatography imaging technology in concrete structure flaw detection are explored and investigated. After experiments, it is shown that the application of resistance chromatography imaging technology in concrete structure damage detection is feasible, and the main research contents and conclusions are as follows.
1) Based on the basic principles and methods of ERT, five image reconstruction algorithms are studied, and the advantages and disadvantages of the algorithms are compared with each other after simulation experiments and actual experiments.
2) Due to the non-uniformity of the concrete structure, this paper firstly used a body of water instead of a concrete structure for the commissioning of the entire electrical chromatography imaging system, the experiments show that the system designed in this paper can achieve the imaging detection of “inclusions” in the body of water.
3) Finally, the electrical chromatography imaging system designed in this paper is applied to the detection of damage in concrete structures, imaging the detection of joints (pore size) in concrete and imaging the detection of seawater penetration in concrete, respectively.
The experimental results show that the application of ERT in concrete flaw detection is feasible, which provides a new idea for nondestructive testing of concrete structures.
Data availability statement
The original contributions presented in the study are included in the article/supplementary material, further inquiries can be directed to the corresponding author.
Author contributions
CS, JZ and CL: methodology; WZ: software; CS and HY: formal analysis; CS:Writing- Reviewing and Editing.
Funding
This work was supported by the Doctoral Research Fund Project of Shandong Jianzhu University under Grant X21037Z, Shandong Province Natural Science Foundation, China, ZR2021QF118.
Conflict of interest
The authors declare that the research was conducted in the absence of any commercial or financial relationships that could be construed as a potential conflict of interest.
Publisher’s note
All claims expressed in this article are solely those of the authors and do not necessarily represent those of their affiliated organizations, or those of the publisher, the editors and the reviewers. Any product that may be evaluated in this article, or claim that may be made by its manufacturer, is not guaranteed or endorsed by the publisher.
References
1. Feng X, Gong B, Tang C, Zhao T. Study on the non-linear deformation and failure characteristics of EPS concrete based on CT-scanned structure modelling and cloud computing. Eng Fracture Mech (2022) 261:108214. doi:10.1016/j.engfracmech.2021.108214
2. Chin WJ. 3D internal visualization of concrete structure using multifaceted data for ultrasonic array pulse-echo tomography[J]. Sensors (2021) 21:6681. doi:10.3390/s21196681
3. Kim JW, Cho YC, Lee YO. Application of R2S unstructured tetrahedral mesh method to radioactive concrete structure dismantling using AETIUS/FISPACT codes. Int J Energ Res (2020) 44(10):8181–92. doi:10.1002/er.5321
4. Yan LB, Han B, Fan L, Li X. Fatigue damage of PBH shear connector of steel-concrete composite structure. Eng Structures (2020) 213(10):110540. doi:10.1016/j.engstruct.2020.110540
5. Lin Z, Fdab C, Yi X. Meso-scale damage detection and assessment of concrete under dynamic compression loading using X-ray computed tomography[J]. Mater Characterization (2021) 176:111149. doi:10.1016/j.matchar.2021.111149
6. Li L, Luo G, Wang Z. Prediction of residual behaviour for post-earthquake damaged reinforced concrete column based on damage distribution model[J]. Eng Structures (2021) 234:111927. doi:10.1016/j.engstruct.2021.111927
7. Xc A, Qwa B, Rza B. Intelligent recognition of erosion damage to concrete based on improved YOLO-v3[J]. Mater Lett (2021) 302:130363. doi:10.1016/j.matlet.2021.130363
8. Meixedo A, Santos JP, Ribeiro D. Damage detection in railway bridges using traffic-induced dynamic responses[J]. Eng Structures (2021) 238:112189.
9. Li Q, Wang W, Wang J, Zhang J, Geng D. Exploring the relationship between InSAR coseismic deformation and earthquake-damaged buildings. Remote Sensing Environ (2021) 262:112508. doi:10.1016/j.rse.2021.112508
10. Sun Q, Martin B, Williams B, Heard W, Frew D, Nie X. Comparative study on the impact-induced microstructural damage in concrete using X-ray computed micro-tomography. Mech Mater (2022) 168:104277. doi:10.1016/j.mechmat.2022.104277
11. Sun Q, Williams B, Loeffler C. Comparative study of strength-based damage evolution in ultra-high-performance concrete (UHPC) and conventional concrete (CC) under dynamic loading[J]. Int J Impact Eng (2021) 2021(3):103893.
12. Sun S, Lu LU, Yue S, Geng H, Jiang Z. The composite damage effects of explosion after penetration in plain concrete targets. Int J Impact Eng (2021) 153(4):103862. doi:10.1016/j.ijimpeng.2021.103862
13. Assa B, Gang SA, Lhp A. A localizing gradient enhanced isotropic damage model with Ottosen equivalent strain for the mixed-mode fracture of concrete[J]. Int J Mech Sci (2021) 199:106410. doi:10.1016/j.ijmecsci.2021.106410
14. Metherall P, Barber DC. Three-dimensional electrical impedance tomography [J]. Nature (1996) 380:509–12. doi:10.1038/380509a0
15. Tong T. Zhang Weixing Design of voltage controlled current source in electrical impedance imaging system. J Electron Des Eng (2012) 20(1):4.
16. Schmidt-Hattenberger C, Bergmann P, Labitzke T, Wagner F, Rippe D. Permanent crosshole electrical resistivity tomography (ERT) as an established method for the long-term CO2 monitoring at the Ketzin pilot site. Int J Greenhouse Gas Control (2016) 52:432–48. doi:10.1016/j.ijggc.2016.07.024
17. Ruzinsky F, Bennington C. Aspects of liquor flow in a model chip digester measured using electrical resistance tomography. Chem Eng J (2007) 130(2-3):67–74. doi:10.1016/j.cej.2007.01.027
18. Yoon GL, Park JB. Sensitivity of leachate and fine contents on electrical resistivity variations of sandy soils. J Hazard Mater (2001) 84(2-3):147–61. doi:10.1016/s0304-3894(01)00197-2
19. Zhu Y, Zhen-chong W. Soil resistivity measurement based on fast Fourier transform DC component. [J] Opt precision Eng (2013) 21(001):115–23. doi:10.3788/ope.20132101.1150123
20. Kowalski A, Davidson J, Flanagan M, York T. Electrical resistance tomography for characterisation of physical stability in liquid compositions. Chem Eng J (2010) 158(1):69–77. doi:10.1016/j.cej.2009.10.054
21. Ricard F, Brechtelsbauer C, Xu XY, Lawrence C. Monitoring of multiphase pharmaceutical processes using electrical resistance tomography. Chem Eng Res Des (2005) 83(7):794–805. doi:10.1205/cherd.04324
22. Binley A, Pinheiro P, Dickin F. Finite element based three-dimensional forward and inverse solvers for electrical impedance tomography[C]//Advances in Electrical Tomography. in: Proceedings of International Conference of Academic Libraries on Vision and Roles of Future Academic Libraries; June 19, 1996; London, UK (1996). doi:10.1049/ic:19960834
23. Zhang L, Dai L. Image reconstruction of electrical capacitance tomography based on adaptive support driven Bayesian reweighted algorithm[J]. IEEE Sensors J (2021) 21(99):1. doi:10.1109/JSEN.2021.3099241(
24. Geng L, Peng L, Zhang B. Preconditioned Landweber iteration algorithm for electrical capacitance tomography[J]. Flow Meas Instrumentation (2005) 16(2-3):163–7.
25. Ysa B, Ql B, Meng WB. A non-convex regularization method combined with Landweber method for image reconstruction in electrical resistance tomography[J]. Flow Meas Instrumentation (2021) 79:101917. doi:10.1016/j.flowmeasinst.2021.101917
26. Rao L, He R, Wang Y. An efficient improvement of modified Newton-Raphson algorithm for electrical impedance tomography[J]. IEEE Trans Magnetics (2002) 35(3):1562–5.
27. Kusmiaran A, Sanny TA, Nurrahmi S, Yanti F, Minarti . Implemented preconditioning conjugate gradient algorithm on electrical resistance tomography to modelling structural geology. J Phys Conf Ser (2021) 1763(1):012005. doi:10.1088/1742-6596/1763/1/012005
28. Sun B, Yue S, Cui Z, Wang W. A new linear back projection algorithm to electrical tomography based on measuring data decomposition. Meas Sci Technol (2015) 26(12):125402. doi:10.1088/0957-0233/26/12/125402
Keywords: concrete structure, ert, non destructive testing, image reconstruction, liquid penetrant testing
Citation: Su C, Zhang W, Zhao J, Yang H and Li C (2022) Research on damage visualization of concrete structures based on electrical resistance tomography. Front. Phys. 10:993260. doi: 10.3389/fphy.2022.993260
Received: 13 July 2022; Accepted: 25 July 2022;
Published: 05 September 2022.
Edited by:
Bo Feng, Huazhong University of Science and Technology, ChinaCopyright © 2022 Su, Zhang, Zhao, Yang and Li. This is an open-access article distributed under the terms of the Creative Commons Attribution License (CC BY). The use, distribution or reproduction in other forums is permitted, provided the original author(s) and the copyright owner(s) are credited and that the original publication in this journal is cited, in accordance with accepted academic practice. No use, distribution or reproduction is permitted which does not comply with these terms.
*Correspondence: Chenhui Su, suchenhui2010@163.com