Real-Time Reconstruction of the Complex Field of Phase Objects Based on Off-Axis Interferometry
 Xiang Li†
  Junle Qu
 Liwei Liu
- Key Laboratory of Optoelectronic Devices and Systems of Guangdong Province and Ministry of Education, College of Physics and Optoelectronic Engineering, Shenzhen University, Shenzhen, China
Quantitative phase imaging (QPI) can acquire dynamic data from living cells without the need for physical contact. We presented a real-time and stable dynamic imaging system for recording complex fields of transparent samples by using Fourier transform based on off-axis interferometry. We calculated and removed the system phase without sample to obtain the real phase of the sample, so as to ensure that the system has the ability to accurately measure the phase. The temporal and spatial phase sensitivity of the system was evaluated. Benefit from the ability to record the dynamic phase and phase profile of a specimen, a standard sample (polystyrene microspheres) is investigated to demonstrate the efficiency of this imaging system and we have observed the variation of erythrocyte membrane during Red Blood Cells (RBCs) spontaneous hemolysis with different mediums. Experimental results indicate that the phase of non-anticoagulant RBC changed apparently than anticoagulant RBC and the system could be applied to real-time noninvasive and label-free identification of living cells.
1 Introduction
Most living cells are almost transparent when illuminated by visible light, essentially acting as phase objects. Same techniques such as phase-contrast microscopy and differential interference difference microscopy can carry out microscopic imaging of transparent samples, consequently revealing the structural details of biological systems [1, 2]. In spite of this, the information of the illumination field obtained by these techniques is only qualitative, and it is difficult to describe the morphology of the sample quantitatively. Both non-interference and interference methods have been widely used in quantitative phase imaging of biological samples. For example, the microscopy based on intensity transfer equations can realize phase imaging of biological samples through a series of numerical operations [3–6]. However, it is limited by the complexity of the calculation process and the long time required. The advantages of digital holographic microscopy (DHM) are rapid, non-destructive, and high-resolution which is widely used in the study of cell structural characteristics, cell deformation, cell dynamics, etc., [7–10]. Meanwhile, it can also be combined with other technologies [11–13] to form a multi-mode microscopic imaging technology. The acquisition rate of this technique is limited only by CCD and has the ability to measure the morphological characteristics of living cells in real-time [14, 15]. However, it should not be ignored that the real-time monitoring quality and the longest observation time of QPI will be limited by the overall stability of the imaging system [16, 17]. In off-axis DHM, the low contrast of interference fringes usually reduces the phase sensitivity of the system. In addition, camera dark noise, read noise and other instrumental parameters may affect the measurement sensitivity of the system [18]. The spatial sensitivity of the system is easily affected by speckle noise factors such as scattering field of impurities on optical elements and random interference noise patterns generated by specular reflection of various surfaces in the system, or environmental factors such as mechanical vibration and air density fluctuations. Spatial light interference microscopy (SLIM) is considered as a method to reduce speckle noise inherent in laser light source [19]. In conclusion, it is significant to check and reduce the influence of noise and environmental factors on measurement sensitivity during post-processing. In the process of off-axis spatial filtering, the Fourier transform involved will also bring unnecessary noise to the image. Therefore, in order to ensure the spatial phase sensitivity of QPI, it is particularly important to subtract the background phase.
In this paper, an off-axis real-time digital holographic microscopy system based on Mach- Zehnder interferometer was designed, to solve the above problems, we acquired the background phase firstly by dealing with the interference fringe without a sample then the phase caused only by the sample can be computed by subtracting the background phase. Consequently, the dynamic imaging of the phase only caused by the sample could be achieved. To verify the feasibility of the imaging system, we have demonstrated the experiments on polystyrene microspheres and red blood cells [20–23].
2 System and Methods
2.1 Experimental Setup
A typical setup of off-axis interferometry is depicted in Figure 1A. A continuous wave (CW) laser (MRL-III-650L, Changchun new industry), which was used for the imaging Mach-Zehnder interferometer, was steered to the first non-polarized beam splitter (NPBS), after which the beam was separated to perform off-axis interferometry.
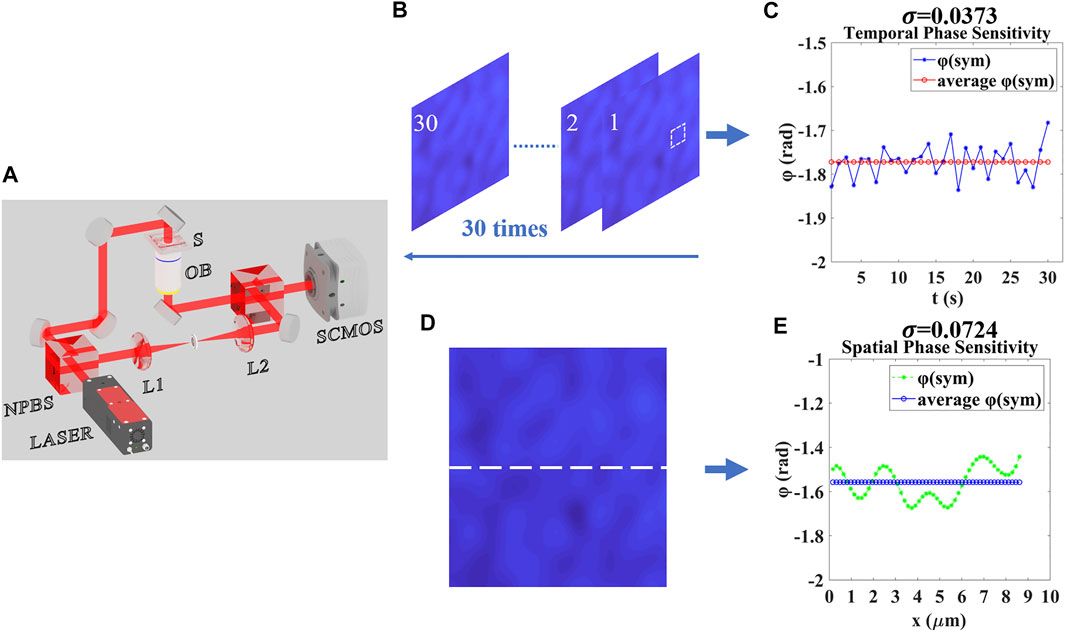
FIGURE 1. Working principle and spatiotemporal calibration of the system. (A) Schematic of the experimental setup. NPBS, non-polarized beam splitter; SCMOS, scientific complementary metal-oxide-semiconductor camera; OB, objective lens; S, stage. (B) 30 s phase measurement of the system without sample. (C) Temporal Phase Sensitivity. (D) phase measurement of the system without sample along the white line. (E) Spatial Phase Sensitivity. φ(sym): phase of the system without sample, σ: Standard deviation of the phase without sample.
The sample was placed on a three-axis displacement table for wide-field illumination. An objective (Daheng Optics, GCO-213 40x, NA = 0.60) imaged the sample to a scientific complementary metal-oxide-semiconductor (sCMOS) camera which was positioned at the imaging plane of the objective, where an exact (magnified) replica of the sample field can be formed. The acquisition rate of the sCMOS that we used (PCO.Panda.4.2, Germany) is 48 frames/s when acquiring at the full resolution of 2048 × 2048 pixels. To produce a clean reference beam, a 20 μm pinhole was placed within the reference path at the common focus of a pair of lenses (L1 and L2) performing spatial filtering. Finally, the reference field was slightly tilted relative to the sample beam and interfered with the sample beam to form uniform phase modulation fringes in sCMOS. The standard Fourier transform (FT) algorithm was adopted to reconstruct the amplitude and phase [24]. Specifically, the camera respectively recorded a hologram with and without a sample and performed a fast two-dimensional Fourier transform (By selecting the higher-order information in the spectrum to fundamental and performing the inverse Fourier transform), by subtracting and unwrapping the phase information, the phase directly related to the sample can be obtained. Off-axis interferogram was recorded after optimized the fringe contrast with an exposure time of 10 ms. The temporal and spatial phase sensitivity was evaluated as shown in Figure 1B,D (a 30 s continuous and a series of different points measurement of the phase without samples). The absolute value of the phase is not meaningful, but the relative change of the phase is meaningful. The standard deviation of points was selected to demonstrate the time-space domain phase fluctuation, the smaller the value, the more stable the phase, which shows great temporal-spatial stability as shown in Figure 1C,E.
2.2 Principle
As for the spatial coherence imaging system, the intensity comes out at sCMOS has the form:
By applying Euler’s formula,
In the spectrum, the interference term
By taking any term (
The term
The phase and amplitude information of the sample could be obtained by inverse Fourier transform of
The phase calculated here includes the phase caused by non-samples, which we solve in this paper by the following method. The phase caused by ambient noise or the possible presence of impurity scattering field
2.3 Sample Preparation
To demonstrate the phase stabilization ability of the proposed method, we performed QPI of polystyrene sphere as well as the RBC spontaneous hemolysis. For the study, all cell samples were taken from three-month-old mice. After euthanasia on mice (Put the mouse’s body straight, lift it up about 30° diagonally, and instantly break the cervical vertebra according to IACUC guidelines), we extracted blood by removing the eyeballs of mice. For comparison, we divide the obtained blood into two parts, one immediately poured into a centrifuge tube with anticoagulant and the other not, centrifuged for 5 min at a speed of 2000 RPM, and then sucked 2 μl red blood cells on a slide for imaging experiments with our experimental system. Animal related experiments were approved by Guangdong Medical Experimental Animal Center (Code: C202110-01).
3 Results
Using quantitative phase imaging techniques for live cell monitoring can better reflect other cell information such as phase, optical thickness, etc. We first achieved the complex field and phase measurement ability of our system using standard samples (polystyrene microspheres) as shown in Figure 2. Polystyrene microsphere is a common test target because of its simple and easily identifiable structure. The polystyrene microspheres we use are about 10 microns with refractive index of 1.60. We took a hologram of the sample as shown in Figure 2A in Olympus oil medium with approximate refractive index of 1.52. Figure 2B,C show the overall amplitude and phase distributions with Fourier transform (FT) algorithm. The phase information shows the spherical structure of the sample, what’s more, we plotted the phase profile as shown in Figure 2D to verify the effectiveness of our imaging system. (Real-time dynamic process of the polystyrene microspheres See Supplementary Figure S1).
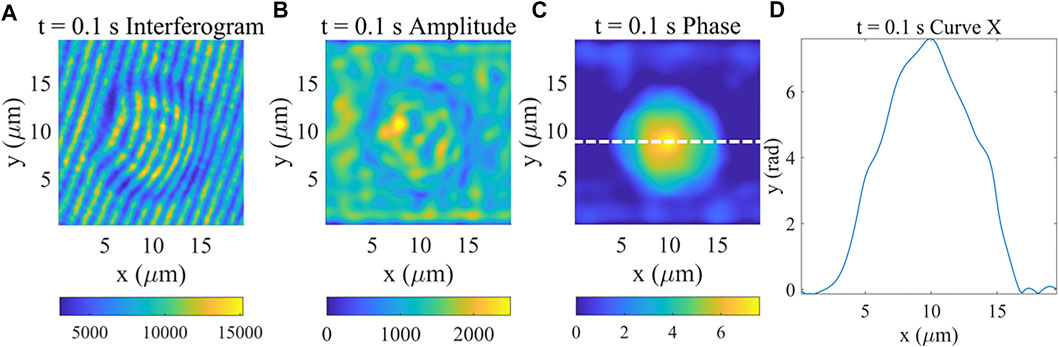
FIGURE 2. Complex field and Phase measurement results of polystyrene microspheres. (A) Interferogram image at 0.1 s. (B) Amplitude image at 0.1 s. (C) Phase image at 0.1 s. (D) Phase profile of horizontal direction curves at the location indicated by the white dashed line shown in (C).
Then, we imaged living red blood cells with different mediums. The result of the complex field of the blood cell without anticoagulant and its phase profile at 1s are shown in Figure 3A–D, and Figure 3E–H shows the results of the red blood cell with anticoagulant. After obtaining the interferogram (Figure 3A) with high contrast, the complex field of this sample was obtained by using the algorithm introduced above, as shown in Figure 3B,C. To verify the accuracy of the achieved phase, the phase value across the middle white line was plotted (Figure 3D) which showed the unique structure of RBCs.
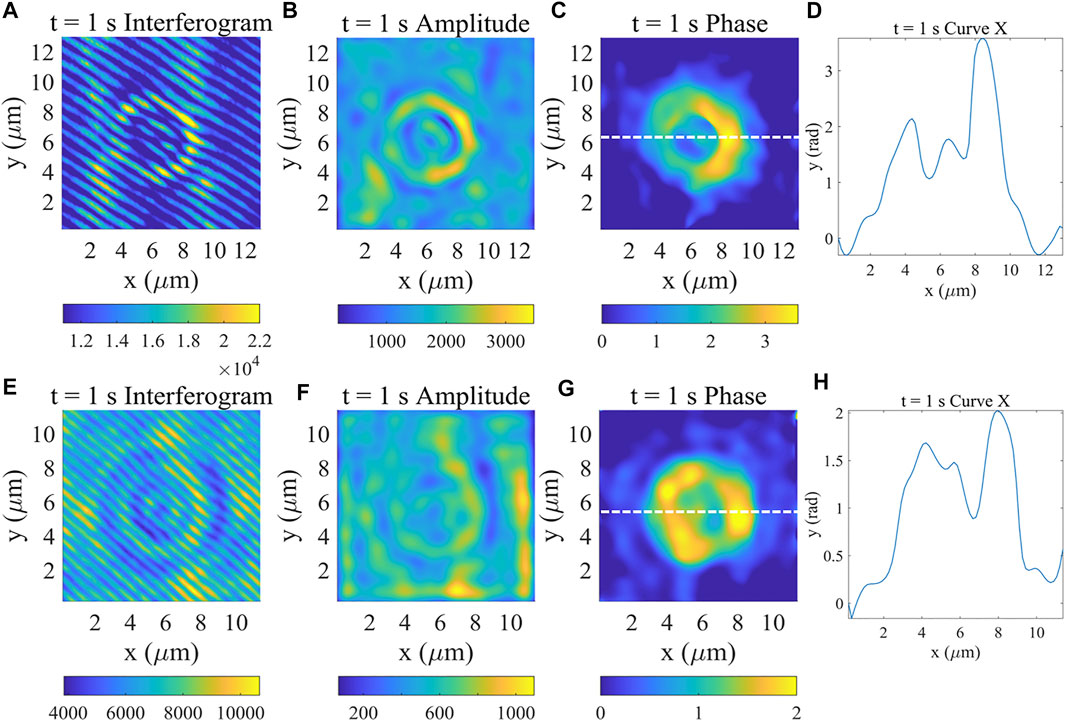
FIGURE 3. Complex field and Phase measurement results of red blood cells without and with anticoagulant (the results of the first row are without anticoagulant). (A,E) Interferogram image at 1 s (B,F) Amplitude image at 1 s (C,G) Phase image at 1 s (D,H) Phase profile of horizontal direction curves at the location indicated by the white dashed line shown in (C,G).
To observe the morphological changes of red blood cells during spontaneous hemolysis, phase measured for 4 consecutive hours, the results of the first 2 h were shown in Figure 4. On the one hand, it can be clearly observed that the structure of the non-anticoagulant RBC membrane has undergone significant changes as shown in Figure 4A–E which is caused by the variation of its osmotic pressure between internal and external during cell spontaneous hemolysis [7]. Specifically, the RBC (Figure 4A) has a complete structure that means it has two peaks which can be seen from its phase curve shown in Figure 3D. An hour later, as shown in Figure 4F, the RBC only has one peak which indicates both that its cell membrane morphology has changed and it has died. From Figure 4 C,D,E, we can find that the morphology of the RBC is basically unchanged cause of death of the cell. On the other hand, the results in Figure 4G–K show that the anticoagulant RBC membrane has not changed significantly and the RBC has two peaks all the time as shown in Figure 4L. Comparing Figure 4A–E with Figure 4G–K, it can be found that due to the addition of anticoagulants to the samples, which enabled the RBC to maintain physiologically active for a long time and with no obvious variation of the RBC phase. The dynamic phase of the RBC was continuously acquired after 2 hours for approximately 120 min with 30 s intervals as shown in Supplementary Figures S2, S3.
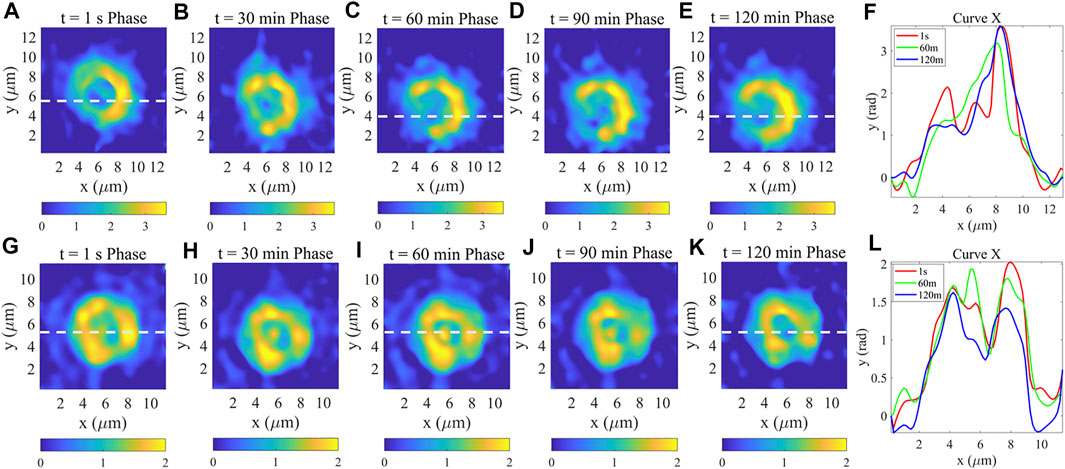
FIGURE 4. (A–E) are phase measurement results of red blood cells without anticoagulant in 2 hours. (F) Phase profile of horizontal direction curves at the location indicated by the white dashed line shown in (A,C,E); (G–K) are phase measurement results of red blood cells with anticoagulant in 2 h. (L) Phase profile of horizontal direction curves at the location indicated by the white dashed line shown in (G,I,K).
To show the phase variation of the non-anticoagulant and anticoagulant RBC in 2 hours qualitatively, we continually recorded the maximum phase of the cells with 10 min intervals and calculate its average value as shown in Figure 5A and Figure 5B. Apparently, the maximum phase of non-anticoagulant RBC trended to change in one direction, but of which the anticoagulant RBC changed little and leveled off at the same time. The standard deviation was used to show the stability of data usually. Compared with the anticoagulant RBC, the standard deviation of the non-anticoagulant RBC phase maximum is bigger which means non-anticoagulant RBC has changed sharply and the addition of anticoagulants has the effect of making the cell morphology last longer.
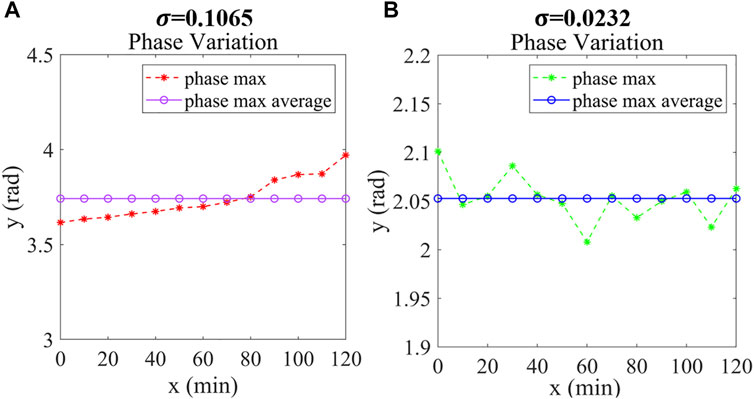
FIGURE 5. (A) Phase Maximum variation of red blood cells without anticoagulant. (B) Phase Maximum variation of red blood cells with anticoagulant. σ: Standard deviation of the RBC Phase Maximum.
4 Conclusion
In summary, we have measured the complex field of objects using off-axis interferometry. The dynamic phase and phase profile are used to describe the morphology changes of the sample. We have observed the spontaneous hemolysis process of red blood cells with two different mediums in 2 hours (with anticoagulant or not). For the non-anticoagulant RBC, the cell membrane changed significantly during spontaneous hemolysis. We also quantitatively described the spontaneous hemolysis of red blood cells in two ambient fluids by using the standard deviation of the maximum phase. The advantages of our system are that good measurement stability of the system is obtained by subtracting the background phase, the phase and profile information are combined and can be detected in real-time, and the time of one single shoot needed is about 0.1 s. We believe that this work can be applied to the physiological detection of living cells.
Data Availability Statement
The original contributions presented in the study are included in the article/Supplementary Material, further inquiries can be directed to the corresponding author.
Ethics Statement
The animal study was reviewed and approved by Animal related experiments were implemented according to the guidance of the Medical Department of Shenzhen University.
Author Contributions
XL and GQ conceptualized the study. XL, GQ, and WY performed the analysis of data. XL and GQ performed the data collection and wrote the original draft. XL, GQ, WY, HL, RH, JQ, and LL reviewed and edited the manuscript. LL reviewed and supervised writing the manuscript.
Funding
This work was supported in part by The National Natural Science Foundation of China (62175163/61935012/61961136005/61835009/62127819), Shenzhen Key projects JCYJ20200109105404067, Shenzhen International Cooperation Project (GJHZ20190822095420249), and Shenzhen Talent Innovation Projects RCJC20210706091949022.
Conflict of Interest
The authors declare that the research was conducted in the absence of any commercial or financial relationships that could be construed as a potential conflict of interest.
Publisher’s Note
All claims expressed in this article are solely those of the authors and do not necessarily represent those of their affiliated organizations, or those of the publisher, the editors and the reviewers. Any product that may be evaluated in this article, or claim that may be made by its manufacturer, is not guaranteed or endorsed by the publisher.
Acknowledgments
We thank students in the group for providing mice in the sample preparation procedure in our imaging system.
Supplementary Material
The Supplementary Material for this article can be found online at: https://www.frontiersin.org/articles/10.3389/fphy.2022.943016/full#supplementary-material
References
1. Zernike F. Phase Contrast, a New Method for the Microscopic Observation of Transparent Objects Part II. Physica (1942) 9(10):974–86. doi:10.1016/S0031-8914(42)80079-8
3. Li Y, Di J, Ma C, Zhang J, Zhong J, Wang K, et al. Quantitative Phase Microscopy for Cellular Dynamics Based on Transport of Intensity Equation. Opt Express (2018) 26(1):586. doi:10.1364/OE.26.000586
4. Greenbaum A, Zhang Y, Feizi A, Chung P-L, Luo W, Kandukuri SR, et al. Wide-Field Computational Imaging of Pathology Slides Using Lens-Free On-Chip Microscopy. Sci Transl Med (2014) 6(267):ra175. doi:10.1126/scitranslmed.3009850
5. Zuo C, Chen Q, Yu Y, Asundi A. Transport-of-Intensity Phase Imaging Using Savitzky-Golay Differentiation Filter - Theory and Applications. Opt Express (2013) 21(5):5346–62. doi:10.1364/OE.21.005346
6. Gureyev TE, Nugent KA. Rapid Quantitative Phase Imaging Using the Transport of Intensity Equation. Opt Commun (1997) 133(1-6):339–46. doi:10.1016/S0030-4018(96)00454-3
7. Popescu G, Ikeda T, Best CA, Badizadegan K, Dasari RR, Feld MS. Erythrocyte Structure and Dynamics Quantified by Hilbert Phase Microscopy. J Biomed Opt (2005) 10(6):060503. doi:10.1117/1.2149847
8. Lue N, Popescu G, Ikeda T, Dasari RR, Badizadegan K, Feld MS. Live Cell Refractometry Using Microfluidic Devices. Opt Lett (2006) 31(18):2759–61. doi:10.1364/OL.31.002759
9. Popescu G, Ikeda T, Goda K, Best-Popescu CA, Laposata M, Manley S, et al. Optical Measurement of Cell Membrane Tension. Phys Rev Lett (2006) 97(21):218101. doi:10.1103/PhysRevLett.97.218101
10. Masters BR. Quantitative Phase Imaging of Cells and Tissues. J Biomed Opt (2012) 17(2):029901. doi:10.1117/1.JBO.17.2.029901
11. Park Y, Popescu G, Badizadegan K, Dasari RR, Feld MS. Diffraction Phase and Fluorescence Microscopy. Opt Express (2006) 14(18):8263. doi:10.1364/OE.14.008263
12. Hu C, He S, Lee YJ, He Y, Kong EM, Li H, et al. Live-Dead Assay on Unlabeled Cells Using Phase Imaging with Computational Specificity. Nat Commun (2022) 13(1):713. doi:10.1038/s41467-022-28214-x
13. Park Y, Depeursinge C, Popescu G. Quantitative Phase Imaging in Biomedicine. Nat Photon (2018) 12(10):578–89. doi:10.1038/s41566-018-0253-x
14. Hoover EE, Squier JA. Advances in Multiphoton Microscopy Technology. Nat Photon (2013) 7(2):93–101. doi:10.1038/nphoton.2012.361
15. Pham HV, Bhaduri B, Tangella K, Best-Popescu C, Popescu G. Real Time Blood Testing Using Quantitative Phase Imaging. PLoS One (2013) 8(2):e55676. doi:10.1371/journal.pone.0055676
16. Lee K, Kim K, Jung J, Heo J, Cho S, Lee S, et al. Quantitative Phase Imaging Techniques for the Study of Cell Pathophysiology: from Principles to Applications. Sensors (2013) 13(4):4170–91. doi:10.3390/s130404170
17. Bhaduri B, Edwards C, Pham H, Zhou R, Nguyen TH, Goddard LL, et al. Diffraction Phase Microscopy: Principles and Applications in Materials and Life Sciences. Adv Opt Photon (2014) 6(1):57–119. doi:10.1364/AOP.6.000057
18. Hosseini P, Zhou R, Kim Y-H, Peres C, Diaspro A, Kuang C, et al. Pushing Phase and Amplitude Sensitivity Limits in Interferometric Microscopy. Opt Lett (2016) 41(7):1656. doi:10.1364/OL.41.001656
19. Wang Z, Millet L, Mir M, Ding H, Unarunotai S, Rogers J, et al. Spatial Light Interference Microscopy (SLIM). Opt Express (2011) 19:1016–26. doi:10.1364/OE.19.001016
20. Memmolo P, Miccio L, Merola F, Mugnano M, Ferraro P. Hydrodynamic Red Blood Cells Deformation by Quantitative Phase Microscopy and Zernike Polynomials. Front Phys (2019) 7:111. doi:10.3389/fphy.2019.00111
21. Vasudevan S, Chen GCK, Andika M, Agarwal S, Chen P, Olivo M. Dynamic Quantitative Photothermal Monitoring of Cell Death of Individual Human Red Blood Cells upon Glucose Depletion. J Biomed Opt (2010) 15(5):057001. doi:10.1117/1.3484260
22. Memmolo P, Merola F, Miccio L, Mugnano M, Ferraro P. Investigation on Dynamics of Red Blood Cells through Their Behavior as Biophotonic Lenses. J Biomed Opt (2016) 21(12):121509. doi:10.1117/1.JBO.21.12.121509
23. Memmolo P, Miccio L, Merola F, Gennari O, Netti PA, Ferraro P. 3D Morphometry of Red Blood Cells by Digital Holography. Cytometry A (2014) 85(12):1030–6. doi:10.1002/cyto.a.22570
Keywords: real-time, complex field, living cells, off-axis interferometry, dynamic imaging
Citation: Li X, Qin G, Yu W, Li H, Hu R, Qu J and Liu L (2022) Real-Time Reconstruction of the Complex Field of Phase Objects Based on Off-Axis Interferometry. Front. Phys. 10:943016. doi: 10.3389/fphy.2022.943016
Received: 13 May 2022; Accepted: 10 June 2022;
Published: 29 June 2022.
Edited by:
Baoli Yao, Xian Institute of Optics and Precision Mechanics, (CAS), ChinaReviewed by:
Rongli Guo, Xi'an Technological University, ChinaJianglei Di, Guangdong University of Technology, China
Copyright © 2022 Li, Qin, Yu, Li, Hu, Qu and Liu. This is an open-access article distributed under the terms of the Creative Commons Attribution License (CC BY). The use, distribution or reproduction in other forums is permitted, provided the original author(s) and the copyright owner(s) are credited and that the original publication in this journal is cited, in accordance with accepted academic practice. No use, distribution or reproduction is permitted which does not comply with these terms.
*Correspondence: Liwei Liu, liulw@szu.edu.cn
†These authors have contributed equally to this work and share first authorship