Acoustofluidic trapping device for high-NA multi-angle imaging
 Mia Kvåle Løvmo
 Simon Moser
 Gregor Thalhammer-Thurner
 Monika Ritsch-Marte
- Institute of Biomedical Physics, Medical University of Innsbruck, Innsbruck, Austria
In the life sciences, there has been growing awareness that the traditional 2D cell culture model has its limitations in advancing our understanding of the mechanisms that underlie cell behavior, as the behavior and response of cells depend on the 3D microenvironment. Studying models such as suspended cell clusters and organoids is a step toward closing the gap between in vitro and in vivo studies. The fact that sample confinement and contact with surfaces have an impact on cells creates a need for contact-less tools for the inspection of live biological samples. Recently, we developed an acoustofluidic chip to trap and manipulate sub-millimeter-sized biological samples, and here, we demonstrate that this device can be adapted to support high-resolution imaging and illumination scanning for multi-view image acquisition. After coupling acoustic bulk waves into a microfluidic chip, the sample is levitated by an optically transparent transducer in the vertical direction. Two orthogonal side-transducers give additional control over the sample. By tuning the relative strengths of the three transducers and thus inducing an acoustic torque, we can transiently rotate the sample into various orientations for image acquisition. Under different operating conditions, exciting other modes, we can also induce sustained rotation of samples by means of other torque contributions and around axes perpendicular to the imaging axis, which is important to avoid “missing cone” artifacts in the tomographic reconstruction of the sample. We will discuss the modifications to our previously established device that were necessary to comply with the requirements for high-NA imaging and high-NA illumination. We provide a characterization of the performance and show examples of rotation and reorientation of biological samples, such as large pollen grains and cancer spheroids.
1 Introduction
Cell clusters and organoids are promising in vitro models compared to traditional 2D cell culture. Handling and imaging sub-mm-sized live cell clusters and organoids in solution without any confining structures or gels is important, as these may influence growth. Acoustofluidics provides a great strategy for contact-less and non-invasive manipulation of samples that are too heavy to be levitated by optical tweezers. Acoustic trapping devices (using, e.g., phased arrays, focused-, surface,- or bulk acoustic waves) can be manufactured for various applications, such as patterning, spheroid formation, sorting, and more [1, 2]. Acoustic trapping or levitation in a microfluidic chip is particularly attractive, as it allows for nutrient and buffer exchange, thus lending itself to long-term monitoring of live samples.
Optical imaging of the levitated sample is of importance. A multitude of methods have been developed to obtain 3D information about objects by optical imaging from different view points, such as optical diffraction tomography and tomographic phase microscopy [3]. Rotating the object rather than the imaging system itself is a simple approach to obtain images from different viewing directions. Sample rotation can, for instance, be achieved by embedding a sample in a gel in a capillary and rotating the capillary [4, 5] or rotating a sample attached to a tip [6]. Such approaches, however, imply some fixation of the object, which is not freely floating anymore.
To meet the demand of rotating a levitated (but mechanically unbound) sub-mm-sized biological specimens in solution in order to get views from multiple directions, we have recently developed a microfluidic sono-optical device which induces torques for transient or continuous rotations by means of acoustic—and optionally also optical—forces [7]. We use acoustic bulk waves in a fluid-filled chamber containing the sample(s), which are excited by three independent transducers, one for each of the three dimensions. Other acoustofluidic devices for tomographic imaging have been developed based on surface acoustic waves for trapping and acoustic streaming to induce rotation of living specimens [8, 9].
Our sono-optical manipulation device provides the possibility of rotating the sample around different rotation axes, which can be chosen interactively. Specifically, the possibility to rotate around orthogonal axes limits the so-called “missing cone” problem [10] in coherent wide-field transmission microscopy, which relates to unreachable regions in the 3D optical transfer function. Rotation of the sample into various directions also lessens the related problem of standard 3D microscopy that the axial resolution is inferior to the lateral resolution due to finite numerical aperture (NA) of the imaging and illumination lenses.
To achieve more isotropic resolution, it has been proposed to combine illumination scanning and sample rotation, to be able to fill the whole Ewald sphere [11]. This has been demonstrated with samples rotated by attachment to a fiber that is mechanically rotated [6] which implies fixation of the sample. Illumination scanning has also been combined with samples rotated by optical forces [12]. Trapping and rotation by pure optical forces can be precisely controlled, but has its limitations concerning sample size [1]. One can reduce the missing cone problem by increasing the sampled angles, and it can be fully eliminated provided the imaging angles can cover a range of 360° along two object axes orthogonal to the imaging axis [13, 14].
In this work, we present a modified 3D acoustic trapping platform which is fully compatible with imaging and illumination under high numerical aperture (NA). We demonstrate that the basic operations for optical 3D inspection and tomographic reconstruction, i.e., reorientation to a new desired position and rotation around different (orthogonal) axes with respect to the sample, which we introduced in our earlier work [7], are also feasible in this new geometry. Together with high-NA imaging, this drastically reduces the information missing from the Fourier spectrum. This is important, since having experimentally inaccessible regions in Fourier space, e.g., due to single axis sample rotation, due to limited illumination angles and/or due to low-NA imaging, generally deteriorates or even prevents tomographic reconstruction. Moreover, the high-NA compatible chip not only allows us to acquire high-resolution images of our samples, but also opens up possibilities for the combination with optical direct force measurements to characterize the acoustic forces [15]. The modifications in the current chip design compared to the previous [7] include direct sample solution contact from all three transducers and a change in the channel geometries, and tunable channel-lengths. The functionalities of our new platform, for instance, include a flexible manipulation strategy along the lines of Lamprecht et al. [16], with two crossed standing waves operated at the same driving frequency with a tunable phase-shift between them. Lamprecht et al. used two crossed horizontal standing waves to induce object rotations around an axis parallel to the imaging axis. We operate one vertical and one horizontal standing wave at the same frequency to reach the targeted acoustic conditions for inducing an acoustic torque on the object to continuously rotate it around an axis orthogonal to the imaging axis. In addition, we use a third orthogonal standing wave to further confine the object in 3D.
The particle manipulation in our device includes 3D acoustic trapping with individual control of the trapping strength in each direction, in addition to acoustic torque contributions that we use to either transiently or continuously rotate the sample. The acoustic conditions for sample reorientation or for sustained rotation are different, and we have optimized our chip so that we can tune between these two effects. The three standing waves in our device lead to a trapping landscape where a typical biological sample of arbitrary shape will be pushed to the 3D pressure nodes due to the acoustic radiation force [17]. To transiently rotate a sample, we change the relative amplitude between the standing waves, and the acoustic scattering by an asymmetric particle will result in an acoustic torque that aligns the particle to the new acoustic force landscape [18]. We refer to this contribution to the acoustic torque as the “restoring torque.” Instead, to induce a sustained rotation of our samples, we drive two orthogonal standing wave modes at the exact same frequency. This creates a vortex field around the trapping nodes for certain settings of the relative phase [19]. The angular momentum of the vortex can then be transferred from the field to an object by absorption in the particle and in the thermal-viscous boundary layer around the particle, and the acoustic dissipation can lead to sustained rotation of objects [20]. Spinning of trapped particles has also been demonstrated in focused acoustic vortex beams in air [21] and in water [22]. The torque contribution due to the acoustic absorption in the viscous boundary layer is also called the “viscous torque” [16]. It is found that the absorption in the particle itself also can play a significant role [22, 23]. Moreover, the particle rotation can also be affected by (large scale) flows in the fluid induced by the acoustic field [24]. We here refer to all dissipative contributions to the acoustic torque as the “spinning torque.”
The samples we are interested in have unknown parameters. However, they have asymmetric and visco-elastic parameters. They will be affected by both the restoring torque and the spinning torque simultaneously. In this work, we have optimized our chip geometry and chip operation to improve the control between reorientation and continuous rotation of the samples by tuning between a dominant restoring torque and a dominant spinning torque, respectively. We demonstrate and discuss the suitability of the acoustic manipulation technique to acquire data at multiple sample orientations for illumination scanning tomography and induced sustained rotation on several examples of large pollen grains and cancer cell spheroids.
2 Methods
In this section, we describe our acoustofluidic manipulation device, with respect to design considerations, manufacturing and assembly. Schematics of the chip are shown in Figure 1. We will also give a qualitative characterization of the properties in the trapping chamber and describe our general operation strategy. We prefer to keep the chip manufacturing and operation as simple and low-cost as possible while maintaining the flexible ability to rotate samples of unknown properties.
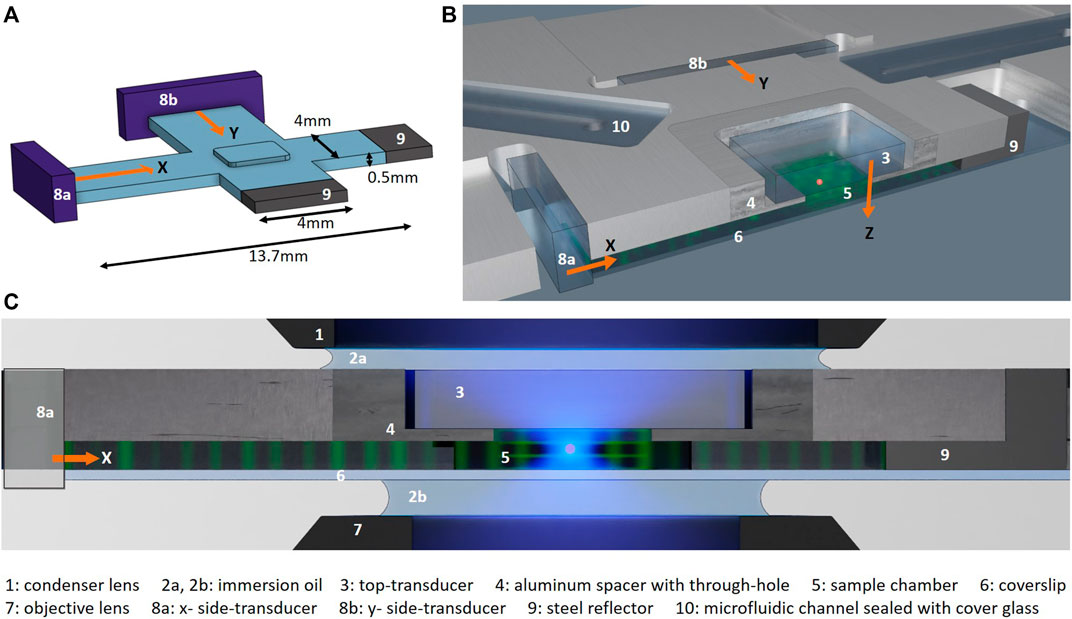
FIGURE 1. Microfluidic chip: (A) Schematic showing the three orthogonal fluid channels (blue) of the chamber: two long crossed horizontal channels for propagating the ultrasound from the side-transducers (8a, 8b, purple) and one short vertical channel where the crossed side-channels intersect for propagating the ultrasound from the top-transducer (not shown). Schematics from (B) an angled top view and (C) a cross-section of the chip with a through-cut along the x-channel as marked with a red dashed line in Figure 2A. The propagation direction of the ultrasound from the three orthogonal LiNbO3 transducers in x-, y- and z-direction (8a, 8b, and 3) are indicated with orange arrows. All transducers are in direct contact with the fluid and generate standing waves in the three directions by reflection of the acoustic waves at the end of each channel: with the bottom coverslip (6) for the top-transducer and the steel reflectors (9) for the side-transducers. The particle manipulation and imaging is performed where the three standing waves intersect under the top transducer (3) and the aluminum spacer (4). (C) shows the chip in the high-NA imaging set-up, with blue illumination light and immersion oil (2a) between the top of the chip and the immersion condenser lens (1) and immersion oil (n = 1.33, 2b) between the bottom of the chip and the immersion objective lens (7) respectively. The numbers refer to the components listed at the bottom of the figure, and figures are not to scale.
2.1 Manipulation chamber for 3D acoustics
We have created a mm-sized manipulation chamber that works as an acoustic resonator by letting three orthogonal fluid channels intersect, as illustrated in Figure 1A. We machined two long
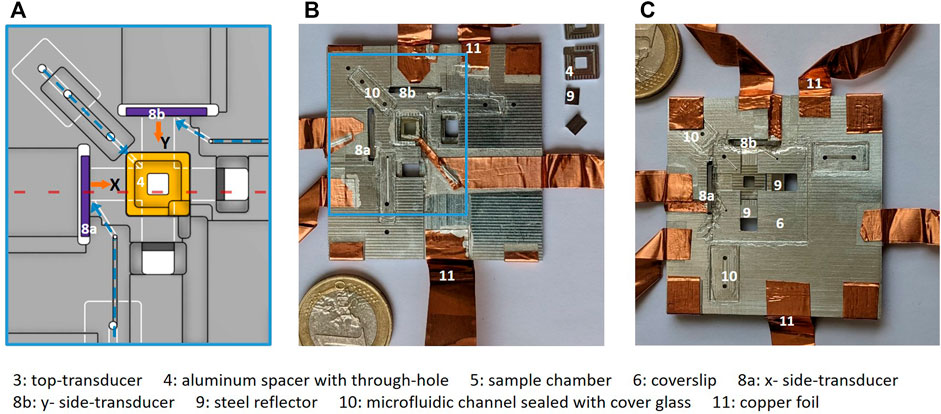
FIGURE 2. Chip assembly: (A) shows a technical drawing of the middle area of the chip marked in blue rectangle in (B), with aluminium spacer inset for top-transducer (4, yellow), side-transducers (8a, 8b, purple) and bottom channels visible (white). The three microfluidic channels for filling the chip are marked with dashed blue arrows and each channel end up at each of the three transducers. Images of the assembled CNC-machined chip is shown with (B) top view and (C) (mirrored) bottom view, where the crossed fluid channels from the side-transducers are visible. The microfluidic channels are sealed with cover glass (10). Electrical connection to the transducers is achieved with silver paint and copper foil (11). The numbers refer to the components listed at the bottom of the figure.
2.2 Acoustic transducers
Controllable 3D acoustic trapping in our current microfluidic device follows similar ideas as is described in detail in our earlier work [7]. Individual control of the acoustic trapping strength in all directions is achieved by independent control of three orthogonal transducers. The optical transparent transducers [25] are made of optical-grade lithium niobate (LiNbO3) (36° Y-cut, 1 mm thickness, Roditi) with transparent ITO electrodes (sheet resistance 10 Ω/sq, Diamond Coatings), with a thickness resonant mode frequency of the bare transducer around 3.4 MHz and a wavelength in water of about 440 µm. We place a LiNbO3 transducer above the through-hole chamber to levitate the samples. A microscope coverslip on the bottom side seals the chamber and acts as a reflector for the acoustic wave.
To excite the ultrasound wave in the horizontal directions, we place LiNbO3 transducers with the same thickness at one end of each side-channel, in direct contact with the fluid in the channel. Steel insets reflect the wave at the other end of the side-channels, as shown in Figure 1, to generate standing waves. Contrary to our previous designs, all three transducers are here in direct contact with the fluid, which provides good coupling between the transducers and the fluid to improve the strength of the acoustic waves in the fluid. We aim to excite the transducers close to their fundamental thickness mode to optimize the amplitude. When we fine-tune the frequency to a resonance of the fluid-filled cavity, the bulk waves are resonantly enhanced and we obtain sufficiently strong acoustic forces to trap (sub-)mm large particles. In each direction, the modes are approximately plane waves (see Section 2.7).
2.3 High-NA compatibility
The need for compatibility with high-NA optical imaging and/or illumination required adaptation of the original design. Apart from supporting higher resolution imaging, this also widens the options for combining our object reorientation strategy with other imaging modalities, as illumination angle-scanning for tomographic imaging. The major design difficulty arises from the fact that the condenser lens and the objective lens used for imaging need to be in close proximity for high-NA imaging, which poses a restriction to the trapping chamber height. In addition, the top and the bottom of the trapping chamber need to be flat without any protruding features due to the large area of the condenser lens and the imaging objective.
To comply with these restrictions, here, we have chosen a side-channel geometry consisting of two long and shallow crossed channels so the side-transducers can be moved far away from their intersecting region where the particles will be manipulated and imaged. This geometry is similar to the device presented by Lamprecht et. al [16], where two orthogonal horizontal standing waves cross to create a manipulation chamber in their intersection, which supports the rotation of samples around an axis parallel to the imaging axis. We need a third transducer propagating along an axis parallel to the imaging axis, to levitate the particles and to be able to rotate them around an axis orthogonal to the imaging axis. To achieve this we create a square through-hole, in the region where the side-channels intersect, to insert the top-transducer above, as illustrated in Figures 1B,C.
The high-NA compatibility, together with the transparent transducers, supports high-resolution optical imaging. It also facilitates the combination with optical trapping for combined sono-optical manipulation of particles [7, 15], and acoustic force characterization by optical force measurements [15], as we have demonstrated previously. The chip is designed to be compatible with standard microscopy frames.
2.4 Chip manufacturing
Our design is illustrated in Figure 1, and in Figure 2A, the technical drawing shows the details of the middle area of chip. The assembled microfluidic chip is depicted in Figures 2B,C. The chip carrier is machined from aluminium to a 50 mm ×50 mm ×1.7 mm plate that is milled from top and bottom with 1 mm or 0.5 mm milling-tools. The crossed side-channels (13.7 mm ×4 mm ×0.5 mm, l× w× h) are milled in the bottom of the plate. Small stain-less steel reflectors are machined to fit into the side-channels and reflect the wave from the side-transducers. These reflectors are made in variable lengths, to make the side-channel length adjustable. Milling a 1-mm deep 8 mm×8 mm square window from the top creates a through-hole above the crossed channels. This window fits an aluminium spacer inset for the top-transducer, as indicated by the number “4” in Figures 1B,C and shown in orange color in Figure 2A.
Because we want to be able to tune the top-transducer frequency, we designed multiple square aluminium spacer insets of variable thicknesses, so we can adjust the height of the top-transducer “channel.” Due to the finite tolerance (±10 µm) of the CNC-machine used, we design multiple insets of thicknesses in the range of 160 µm–230 μm, giving rise to a total chamber height under the top-transducer around 700 µm. This inset has a 2.6 mm×2.6 mm square through-hole with rounded corners (R = 0.25 mm) for coupling the top-transducer into the sample volume, as seen in Figure 1B.
We designed three microfluidic channels ending up at each of the three transducers, as shown with blue dashed arrows in Figure 2A, to fill the chamber with a solution (see Section 2.5). The microfluidic channels are 0.15 mm deep and are connected between the bottom and the top of the chip with 1-mm diameter through-holes and sealed with cover glass. The through-hole at the channel beginning fits standard pipette tips for filling the chamber.
2.5 Chip assembly and operation
The assembly of the chip is made reversible by using different types of glue and bonding materials, which enables us to rework only certain components, for instance, to clean the chamber or to change the cover-slip. We use hot glue (CrystalBond 509), which melts when heated above 90°C, to glue the top-transducer to the aluminium spacer inset and to the main chip. We use standard (cyanoacrylate) super-glue, which is removable with exposure to solvents such as acetone, to glue the side-transducers to the chip. Standard transparent nail-polish is used to seal the bottom of the chip with a coverslip, and the same procedure is used to seal the microfluidic channels with cover glass. Tape-spacers and a small cover glass are placed above the top-transducer (not shown in Figures 1, 2) to later create an immersion oil layer of constant thickness between the transducer and the cover glass, in addition to the immersion oil layer between this small cover glass and the condenser lens for high-NA imaging (see explanation in Section 2.9). Electrical connection to the ITO-coated transducers is achieved by silver-paint (RS: 123-9911) and copper-foil (RS: 176-7500). One side of each transducer is electrically connected to the aluminium chip which provides a common electrical ground.
To initially fill the chamber while avoiding air pockets, we remove the steel reflectors. By this, all channel endings are open, and we can completely fill the chamber by pipetting the buffer solution through any of the microfluidic channels. Air bubbles can easily escape through both open side channel endings. Finally, we put the reflectors back in place at the end of the side-channels. We then place the chip on the microscope stage and drive each transducer with a signal generator. For this, we use a dual output signal generator (Keysight 33522B) which allows us to drive two transducers at the same frequency, but with different amplitude and relative phase. The signal generator has a maximum nominal output voltage of 20 V (peak-to-peak) with 50 Ω output impedance. Typically, we drive the top-transducer with 1–3 V, which is enough to levitate a sample. The side-transducers are often operated at the maximum voltage because of the less efficient wave generation in the horizontal directions. Additionally, we use a Red Pitaya V1.1 device with power amplifier (ADA4870 from Analog Devices on evaluation board, RS 836-8714) to drive the third transducer. This device also allows us to easily measure the electrical impedance of the transducer (see [15] for more details).
With the acoustic trapping turned on, we load a sample into the center of the manipulation chamber by pipetting the sample suspension into the microfluidic channel ending under the top-transducer.
2.6 Chip geometry and optimization
The region under the through-hole in the aluminium spacer for the top-transducer is the region where all three orthogonal standing waves intersect to give rise to the desired manipulation conditions and the region to which we have optical (transmission) access. The targeted acoustic conditions for inducing reorientation or sustained rotation of samples of unknown properties under the influence of the restoring and spinning torque, respectively (defined in introduction), are different and will both be addressed later regarding chip design considerations and in Section 2.8 regarding operation strategy and scaling laws.
For our chip design purposes, the main difference between the two torques is that the spinning torque is addressable by a phase-shift between two transducers driven at equal frequencies, whereas the restoring torque is induced by a change in the relative force strength between our orthogonal transducers which in this case can be driven at different frequencies. Designing a chip only for particle trapping in 3D and object reorientation does not, therefore, require high accuracy in the channel length manufacturing. One can for instance create a chip with three orthogonal standing waves coupled into a simple through-hole cavity as in our previous work, or one can use longer crossed orthogonal side-channels as presented here. As long as each of the three orthogonal channels fits an integer number of λ/2 corresponding to a frequency roughly around the resonance frequency of the transducer, one can drive each transducer at its strongest fluid-resonance and achieve sufficient forces for the desired manipulation. In such a chip geometry, one can reorient an asymmetric sample between top-transducer nodes and side-transducer nodes due to the restoring torque. It is also possible to induce sustained rotations of a sample in such a chip geometry by generating a spinning torque larger than the radiation torque. In this case, spinning torque can be generated by exciting two overlapping orthogonal modes with a relative phase-shift in the resonator by one (or more) of the transducers, as presented in our previous work. For additional flexibility and greater control over the induced rotations and rotation axis, here, we have added elements to tune the three channel-lengths, which allows us to operate the transducers at different or at equal frequencies.
We achieve the targeted acoustic conditions for inducing a spinning torque, by means of generating acoustic vortices by two phase-shift controlled transducers operating at the exact same frequency. To rotate an object around an axis orthogonal to the imaging axis, the top-transducer and one of the side-transducers must generate the vortices. A chamber to support this consists of a vertical channel crossed with a horizontal channel where each channel length matches an integer number of λ/2. For two transducers with the same fundamental thickness mode, two channels of the exact same dimensions would make it easier to match the two resonance frequencies and their amplitudes in the fluid channels. However, we have to make the side-channels long to move the side-transducers away from the condenser lens area, and the top-transducer channel has to be short for high-NA imaging compatibility.
Specifically, in our actual device shown in Figure 2, the different channel lengths for side- and top-transducer (
To cope with this, we make the side-transducer frequency tunable by gluing an extra mass (glass slide) to the back of the side-transducers and tune the frequency further by adjusting the length of the side-channels by variable steel-reflector lengths. To tune the top-transducer frequency, we also made the top-transducer channel length adjustable by manufacturing the separate aluminium spacer insets of variable heights. With these flexibilities in the chip manufacture, which allow us to fine-tune the channel lengths, one can mitigate or cancel imperfections related to finite milling precision and inaccuracies in assembly (such as glue layer thicknesses and exact material properties).
This extra flexibility of our setup allows us to either use a configuration where at least two transducers are operated at the same frequency, which maximizes spinning torque for sustained rotation [16], or to have independent control of the waves in different directions, which is more suitable to control reorientation of particles with different stable alignment directions. However, in this latter method suitable for reorientation, a single transducer can also lead to induced sustained rotations [7] (see also Section 2.8). Therefore, a fine-tuning of the design and the operation conditions is required to achieve the desired manipulation.
In this work, we have chosen a configuration for the channel length where modes in the vertical and one horizontal direction have the same resonant frequency, and the mode in the remaining horizontal direction is detuned from this. This gives us the flexibility to realize both manipulation methods—reorientation and sustained rotation—at the same time without the need to modify the chip design.
2.7 Characterization of acoustic modes
Our acoustofluidic channel designs are chosen based on theory [16, 26–28] and from 2D and 3D finite element simulations solving the wave-equation under hard wall boundary conditions for a somewhat simplified geometry. The sound pressure amplitude in a standing wave varies sinusoidally in the sound propagation direction with pressure nodes at a distance of λ/4 from the transducer and reflector, and pressure minima every λ/2 along the fluid channel. For particles much smaller than the wavelength, the acoustic radiation forces in a standing wave are proportional to the square of the sound pressure [17]. They push samples of positive acoustophoretic contrast (which depends on the sample’s density and compressibility) to pressure nodes.
To characterize the actual transducer response and to experimentally determine the resonances in our chamber, we use electrical impedance measurements. To get a good indication of the strongest resonances in our liquid-filled resonator, we first measure the electrical impedance of the transducers while scanning the frequency and compare the scans between an empty and filled chamber.
Furthermore, for a quick qualitative visualization of the trapping mode-patterns and for a verification of what the strongest resonances are, we have established an approach using swimming micro-organisms [7, 29], which tend to stay a longer time in trapping regions compared to other regions. We fill our resonator with actively swimming Euglena gracilis, which measure about 50 μm in length. When scanning the transducer frequency, we directly observe when the micro-organisms are most strongly confined by the acoustic forces and in which regions. As most biological samples, an Euglena protist has a positive acoustophoretic contrast factor and will be pushed to the acoustic pressure nodes in the chamber.
We record movies of trapped specimens, with a top-view of the center region of our 3D resonator, and perform a “minimum intensity projection” (MIP) of the stack of images to get the mode-pattern visualization, as shown in Figure 3. To verify confined trapping planes from the top-transducer, one can adjust the imaging focus or design a chip with a prism side-view [29]. The image in Figure 3A shows an MIP of every 10th of 300 frames while operating only the top-transducer at its strongest fluid-resonance. The imaging focus is in the first trapping plane, λ/4 from the bottom coverslip, and the specimen is free to swim around within this plane. The standing waves in the vertical direction in a similar chip design have been studied in detail in our previous work [15, 29]. The aluminium spacer under the top-transducer is chosen here so that the fluid-chamber height under the top-transducer matches 3 × λ/2. As observed, this gives rise to three trapping nodal planes in the vertical direction. In Figure 3B, the side-transducer propagating along x-axis is active in addition to the top-transducer, and the specimen is confined to a stripy pattern, every ≈ λ/2, within the z-trapping planes. In Figure 3C, the y-transducer is active in addition to the top-transducer and the stripy mode-pattern is parallel to the x-axis. In Figure 3D, all three orthogonal transducers are active and we can observe the resulting trapping landscape; more isolated trapping “islands” where the forces along both x and y are strong, and stripy patterns dominated by x- or y-transducer, respectively, where their forces mainly dominate the confinement within the z-trapping plane. Figures 3B,C is an MIP of every 10th frame of 600 frames recording.

FIGURE 3. Mode pattern visualization by means of the actively swimming micro-organisms Euglena gracilis under acoustic trapping from (A) top-transducer, (B) top- and x-transducer, (C) top- and y-transducer, (D) all three transducers. The images are a minimum-intensity projection of a video recording from the center region of the trapping chamber.
Euglena gracilis is a strong swimmer and can escape the acoustic forces up to tens of pico-Newton, while non-swimming particles would simply accumulate in the trapping islands. The strength of the transducers can be qualitatively assessed, as a stronger force confines the particles more and fewer specimens can escape giving rise to a higher contrast between the dark stripes and the white background as seen in Figure 3B compared to Figure 3C. Please note, however, that the color of the stripes (black to gray) is also influenced by the variable amount of particles in the center trapping region at a given time, which makes this only qualitative. The forces and sound pressure in our previous design, characterized based on bead displacement and tracking, determined non-uniform forces within the resonator, which is qualitatively verified. Due to this non-uniformity in force strength, and due to the higher forces achievable per input power by the top-transducer relative to the side-transducers because of their different Q-factor, we need to fine-tune the voltage settings for a particle in a specific node to achieve the desired manipulation.
A sample introduced to the acoustic chamber will temporarily be under the influence of the maximum acoustic forces, as it is being pushed to a pressure node. As sound pressure and forces are not homogeneous, but vary sinusoidally in each direction in the chip, a sample being drawn into the trap will be under the influence of varying sound pressure and force gradient levels. In the trap, a sample of diameter much smaller than the wavelength will explore only the low-force region around the trapping site, while a large sample will experience the higher force region further away from the node, which may lead to a slight compression of non-rigid samples.
2.8 General operation strategy for reorientation and sustained rotation
To achieve the controlled trapping and rotation of a sample, we have developed a general strategy, which we will outline later. Generally, the acoustic restoring torque, arising from acoustic scattering by an asymmetric particle, is used to reorient the particle, and the acoustic spinning torque, arising from dissipative effects in and around the particle, is used to induce sustained rotations. Since each new sample has different shape and size, and it often ends up at a different node with a different trapping landscape, we need to adjust the settings. To this end, we follow a specific procedure, while getting direct feedback from observing the sample: While loading the sample into the chamber (see Section 2.5), all transducers are active to trap the sample in 3D in a node. Initially, the top-transducer is driven at a high level to ensure robust levitation of the sample.
The restoring torque can be understood as the torque arising due to the acoustic radiation forces on individual parts of an extended, asymmetric object. To reorient a sample into a new stable orientation, the relative acoustic radiation force strength between the top-transducer and one side-transducer is adjusted. To begin with, the sample is aligned to the nodes created with a dominating top-transducer. To reorient the sample by 90°, we increase the voltage of one of the side-transducers and lower the voltage of the top-transducer to the point of which we observe a reorientation of the sample. The exact ratio at which this transition occurs varies between samples and position within the chamber. By switching the ratio of the driving voltage of top- and side-transducer between well below and above this threshold value, we can reorient the particle in a controlled manner. An example is shown in Section 3.1. The other side-transducer is kept at low voltage to ensure 3D trapping but without influencing the orientation.
To induce sustained rotation of a sample, the acoustic spinning torque needs to be larger than the acoustic restoring torque. To achieve this, the trapping landscape around the particle needs to be isotropic to allow for free rotation. We adjust the voltages of the top- and of the side-transducers to a point where their induced radiation forces are of approximately equal magnitude at the node of interest. We achieve this by observing at which ratio the sample is about to reorient. Often, the sample starts rotating at this step due to the spinning torque. To optimize the rotation rate, we adjust the phase-shift between the two transducers to increase the spinning torque contribution. In this situation, the top- and the first side-transducer are operated at the same frequency because this is crucial to generate acoustic vortices and induce sustained rotation by the spinning torque via the mechanism described by Lamprecht et al. [16]. In addition, the second side-transducer is always operated at a different frequency to suppress its spinning torque contribution. Typically, the second side-transducer is kept at a low voltage to minimize its influence, but ensures 3D trapping. However, when operated at higher power, it will reorient the particle within the horizontal plane without influencing the rotation induced by the top and the first side-transducer (see the example in Section 3.2). Sometimes we observe sustained rotation even when all frequencies are different. This can be explained by a coupling between modes in vertical and horizontal direction, which can both be excited by a single transducer, leading to a spinning torque [7].
The shape and the size of the particle have an impact on the relative strengths of restoring and spinning torque. In general, the restoring torque vanishes for perfectly spherical particles, whereas the spinning torque does not. More asymmetric particles experience stronger variations in the restoring torque in different orientations, and thus, the orientation is more easily locked. For particles smaller than our typical samples and much smaller than the trapping wavelength, the scaling of the restoring torque with particle size a is well known: The peak value of the restoring torque scales as a3. For our larger samples that are outside the Rayleigh regime, the particle-size dependence of the acoustic radiation force and thus the restoring torque may be more complicated [30, 31]. The scaling of the spinning torque with particle size is dependent on which contributions are dominating (dissipation in the particle and in the viscous boundary layer involved in the dipolar and quadrupolar oscilliations), and the scaling can vary also within the Rayleigh regime, and it depends on particle parameters such as absorption coefficient [22]. We find that among the samples we have studied, generally, the smaller and more spherical objects rotate faster, and this generic behavior can be seen in the results and movies of Section 3. For larger and/or more asymmetric particles, we find that a more precise tuning of the trapping strength in different directions is needed to realize a trapping landscape that is isotropic around the rotation axis.
In the case that the spinning torque is larger than the restoring torque, and a sustained rotation is induced, the rotation rate is mainly determined by the interplay of the spinning torque and the hydrodynamic drag (∼ a3). To control the rotation rate, e.g., to make it suitable for tomographic imaging, we change the total driving strength of all transducers (with a quadratic scaling of the acoustic forces on the driving voltage), while keeping the trapping landscape isotropic. Also, the relative phase of the transducers driven with the same frequency has a strong impact. However, because of the afore-mentioned coupling between the modes in different directions in the experiment, an iterative optimization of the settings for the individual transducers is often required. Generally, large-scale acoustic streaming can also affect the particle motion, has been found to slightly reduce the drag torque [22], and may play a non-negligible role in the case of slow rotation rate shown in Section 3.
2.9 Imaging set-up and impact on acoustic modes
For large field-of-view (FOV) and moderate imaging-NA observations, we use an inverted microscope (Zeiss Axiovert 200M). The experiments presented here are carried out with a (5×) or a (40×) magnification objective (Zeiss Fluar 5× NA 0.2 or Olympus UPlanFLN 40× NA 0.75). For high-NA imaging, we use an inverted microscope (Nikon ECLIPSE Ti2-E). We use a 40× magnification water immersion objective (Nikon CFI Apochromat LWD Lambda-S 40× NA 1.15) with a working-distance of 0.59 mm–0.61 mm and an oil immersion condenser (Nikon C-C Achromat/Aplanat Condenser NA 1.4) with a working-distance of 1.6 mm. We also use a 10× magnification objective (Nikon CFI Plan-Achromat 10× 0.25NA) for larger FOV observation and to localize a particle of interest in the chamber. Imaging and Köhler illumination is achieved via the standard microscope beam paths. The camera used in this work for imaging the specimen is a MatrixVision mvBlueFox3-2071a with a Sony IMX428 sensor. Throughout the paper, we use NAobj and NAcon to refer to objective and condenser lens NA, respectively. The theoretical achievable resolution can be estimated by r = 1.22λ/(NAobj + NAcon), with λ being the illumination wavelength.
When performing high-NA imaging in an acoustofluidic chip, one needs to take into account the coupling between standing waves in the immersion oil layers between objective lens and bottom coverslip and between condenser lens and top-transducer [15]. The influence of the condenser is easier to avoid, as one can choose a condenser position which gives rise to little influence on the trapping forces in the main chamber. We also add a coverslip above the top-transducer with immersion oil below and above, to keep the standing waves induced in the layer above the top-transducer constant and limit the influence of a condenser position change.
When moving the objective lens to get a desired focus in a sample, one has to be careful, as certain positions cancel out the standing waves in the chamber and need to be avoided. But since the range of unavailable positions is much smaller than our typical sample sizes, it is always possible to image a slice of the object. However, if one wants to acquire a full z-stack of the object, remote focusing would be required. Furthermore, by careful design or changes to the immersion medium, these unavailable positions can be placed such that they do not affect normal operation. The horizontal position of the objective can also influence the trapping. This effect is less pronounced and is not important, as the field of view is large compared to the sample size. In practice, we refrain from moving the lens after completing the outlined initial adjustments.
3 Results
The high-NA compatible acoustofluidic chip can trap sub-mm-sized biological samples in solution for imaging, rotate samples to a new stable trapping position, or induce sustained rotations of samples, as we will demonstrate in this section with complex-shaped pollen-grains and cancer cell spheroids. With high-NA imaging, we can achieve high resolution and, possibly even more important, good optical sectioning. Further, the high-NA compatibility lends itself to a combination with illumination scanning tomography, as we will discuss.
3.1 Controlled object reorientation under high-NA imaging conditions
An asymmetric particle will change its orientation in response to a change in the acoustic field—giving rise to an acoustic restoring torque acting on the particle—and settle into a new equilibrium position. A particle of roughly elliptical shape will align its shortest axis with the direction of the steepest trap stiffness at the trapping node. By adjusting the relative voltages of the three orthogonal transducers in our device, we can thus reorient a particle, which allows us to image the particle from multiple viewing axes. We have chosen to use a pollen-grain from Sansevieria trifasciata for demonstration, cf. Figure 4, since the pollen of this plant species have a darker and a more transparent half, making it easy to keep track of the orientation of the grain.
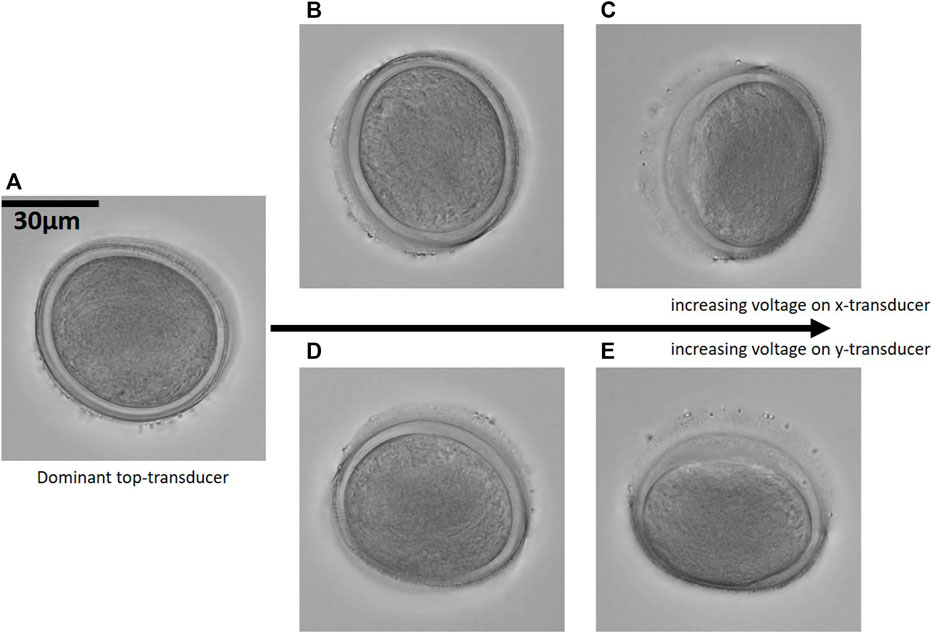
FIGURE 4. Transient reorientation: By adjusting the relative voltages of the three orthogonal transducers a pollen grain from Sansevieria trifasciata is transiently rotated. In (A) the particle aligns to the nodal planes from the top-transducer, in (B) and (C) the voltage on the x-transducer is increased and the particle aligns, within the top nodal plane, to an orientation up towards 90° relative to the orientation in (A). (D,E) shows the particle orientation due to an increased voltage on the y-transducer. (40× magnification, NAobj = 1.15 and NAcon = 0.6). Corresponding Supplementary Movies S1, S2.
In Figure 4A, the particle is aligned with its shortest axis along the direction of the steepest trap stiffness created by the dominant top-transducer, and we see only the absorbing half of the particle. Increasing the power of the side-transducers along the x-axis and the y-axis, respectively, tilts the particle up to 90°, aligning the particle’s longest axis along the direction of the weakest trap stiffness. The new equilibrium positions are stable trapping orientations, as can be observed in corresponding movies provided as Supplementary Movies S1, S2. The high-NA images are acquired at 40× magnification with NAobj = 1.15 and NAcon = 0.6.
3.2 Sustained rotation of an object around two axes
Inducing a sustained rather than transient rotation of an object in a viscous fluid in a stationary acoustic field requires continuous transfer of angular momentum from the impinging waves to the particle. The spinning torque, arising, e.g., from absorption of acoustic angular momentum in the particle and its viscous boundary layer, can lead to such rotations. An asymmetric particle is also always under influence of the acoustic restoring torque which—due to the different scaling laws—tends to dominate over the spinning torque.
To induce a sustained rotation, the spinning torque needs to be larger than the restoring torque. Creating a more isotropic trapping potential around the particles is beneficial to achieve this condition. We have different coupling strengths from the transducers, with higher achievable forces from the top-transducer than the side-transducers. In general, we keep the top-transducer at a low voltage and the side-transducer voltages are then fine-tuned to achieve a desired manipulation, as explained in Section 2.8. The rotation rate of a particle scales with the spinning torque magnitude, which is proportional to the sound pressure squared in the coherent superposition of the two orthogonal out-of-phase modes, generating the acoustic vortex around the trapping node. Thus, the rotation rate scales with the product of the driving voltages of the transducers exiting the two modes. The rotation is periodic, but during one rotational period, the angle-dependent restoring torque “assists” the roughly constant spinning torque at some instances, and “opposes” it at others, leading to acceleration and deceleration of the rotation and to a non-constant angular velocity, as evident in the movie recordings of rotating samples in Supplementary Material.
Sustained rotations of a particle around different axes permit one to collect imaging data from a variety of viewing directions. For particles that are not too elongated, such as the Sansevieria trifasciata pollen grain as seen in Figure 5, we can induce rotations around two orthogonal object axes. In Figure 5A, the top- and x-transducer are driven at the same frequency with a relative phase-shift, giving rise to the observed object rotation axis: along its longest axis, which lies within a trapping plane from the top-transducer. The longest axis is here aligned to the y-axis, which is the direction of the weakest trap-stiffness from the y-transducer driven at a lower voltage and at a different frequency, for 3D confinement of the object position. In Figure 5B, the voltage of the y-transducer is increased beyond the x-transducer voltage, and the object’s longest axis is oriented to the now weakest confinement along the x-axis. However, the viscous torque direction is the same in the chamber as in Figure 5A, and the particle rotates around its shorter axis. The pollen-grain is rotating at a rate of 0.1 Hz, which would be well suited to acquire hundreds of images during one revolution for tomographic imaging at a typical video frame rate around 60 Hz. The corresponding movie recordings are in Supplementary Movies S3, S4.
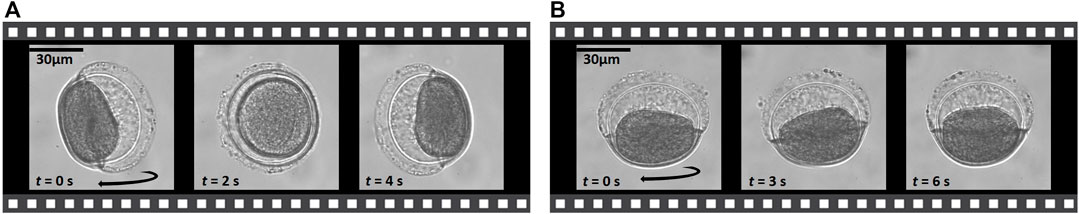
FIGURE 5. Sustained rotation around two orthogonal object axes allows one to collect tomographic data that can circumvent the “missing cone problem” when reconstructing the object. The timestamp of the selected images from the movie recording are shown in the lower left corner. (40× magnification, NAobj = 0.75). Corresponding Supplementary Movies S3, S4.
Rotation around two object axes allows us to collect tomographic data that can circumvent the “missing cone” problem, i.e., to fill the Fourier spectrum more completely. The more elongated the object is, the more difficult it is to rotate it around a shorter object axis while keeping it levitated against gravity, because of the high trap stiffness from the top-transducer. The images in Figure 5 are acquired at 40× magnification and with an air objective, NAobj = 0.75.
3.3 Sustained rotations under high-NA imaging conditions
In the high-NA compatible chip, we can acquire full resolution for the highest NA setting (NAobj + NAcon = 1.15 + 1.15 = 2.3) available by our optics. As seen in Figure 6A, the highest NA gives us the best resolution (292 nm theoretically). At the lowest illumination NA (NAcon = 0.15) in Figure 6B, we get better contrast at the expense of lower effective resolution (516 nm theoretically). A good compromise between the resolution and contrast to observe this particle is shown in Figure 6C, with NAcon = 0.6. In Figures 6A,B, the particle rotates around the same object axis, and in Figure 6C, around the orthogonal object axis. The sinogram in Figure 6D was created by applying MIP inside the blue rectangle in Figure 6B and shows a periodicity of the rotational motion of about 0.07 Hz (15 s period), with non-uniform rotation rate and axis, as evident in the Supplementary Movies S5–S7.
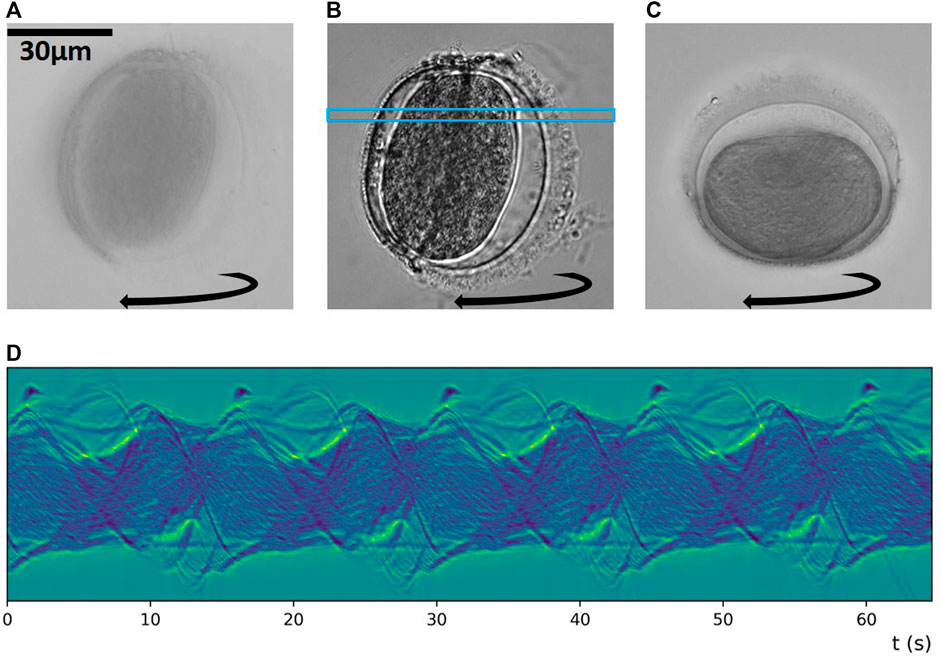
FIGURE 6. Sustained rotation and high-NA imaging and illumination: There is a trade-off between (A) the highest resolution at NAobj + NAcon = 2.3 and (B) the highest contrast at NAobj + NAcon = 1.3. Around NAobj + NAcon = 1.75 as in (C) one gets a good compromise between good resolution and good contrast. The particle in (A,B) rotates around an object axis orthogonal to the one in (C). (D) provides a MIP-based sinogram pertaining to the blue rectangle in (B). Corresponding Supplementary Movies S5–S7.
3.4 Manipulation and imaging of cancer spheroids
Our acoustofluidic chip is suitable to trap and manipulate sub-millimeter samples, such as cell clusters and organoids. These in vitro models are valuable tools as they facilitate the study of aspects related to 3D structure that traditional 2D cell culture lacks and can give results in biomedical research that are more representative of the in vivo responses. They are useful models in, for instance, development and oncology studies, toward personalized medicine and avoidance of animal testing. To be able to trap such live models in solution, without any contact to surfaces or interference with gels for long-term imaging, acoustic trapping platforms are valuable tools. Inspection of such structures with optical light allows for non-invasive observation without any dependence on labeling, fluorescent dye, or sample preparation.
To demonstrate our manipulation capabilities for 3D cell models, we use neuroblastoma cancer cell spheroids formed by cell self-aggregation in external well plates with non-adhesive rounded bottom. In Figure 7, we show an example of an elongated spheroid undergoing a sustained rotation in our acoustic trap at a rotation rate of about 0.017 Hz (60 s period). With this sample, we demonstrate another practical reason why working with a larger NA is desirable: Increasing the total imaging-NA (NAobj + NAcon) not only improves the achieved resolution, but also leads to stronger optical sectioning. The image in Figure 7A with the 10× magnification objective with NAobj = 0.25 has low resolution, and optical sectioning is practically absent, as we can see the cover-slip in the background. The image in Figure 7B with the 40× magnification objective with NAobj = 1.15 and NAcon = 0.15 has higher resolution and an improved optical sectioning capability. At the highest effective NA of our setup (NAobj + NAcon = 2.3) in Figure 7C, we only see a thin slice through the object at a time, which shows good resolution, but the contrast is much lower than in (B).
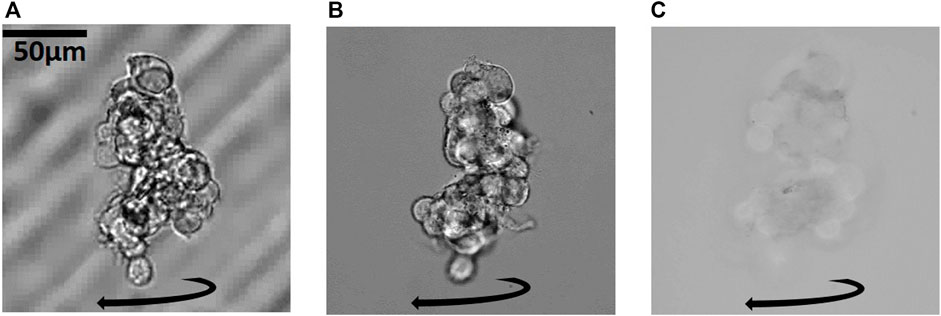
FIGURE 7. Optical sectioning, resolution and contrast of a cancer cell spheroid under sustained rotation: Increasing the imaging NA, from (A) NAobj = 0.25 to (B) NAobj + NAcon = 1.3 to (C) NAobj + NAcon = 2.3 increases the optical sectioning and the resolution of the object. In (A) the coverslip is visible in the background. In (B) the optical sectioning and resolution is better. In (C) the optical sectioning is best and each image of the rotating spheroid shows a slice through the object at the highest resolution. For large objects, only the periphery is in focus, and there is a trade-off between highest resolution and sectioning in (C) compared to higher contrast and lower sectioning and resolution in (B) for inspection of a sample. Corresponding Supplementary Movies S8–S10.
Combining acoustic levitation with illumination scanning of a stationary sample also requires a high-NA compatible chip. A reconstruction based on illumination scanning performed at one object orientation, suffers from axial resolution being inferior to the lateral resolution. But acoustofluidic manipulation offers a solution to this ailment: We can trap a sample in a stable orientation from a dominating top-transducer as seen in Figure 8A and perform illumination scanning and then reorient the sample (in our current system up to 90°) by increasing the voltage of a side-transducer, as shown in Figure 8B, and perform another illumination scan. The two orientations of the sample are stable trapping positions as can be observed in the Supplementary Movies S11, S12.
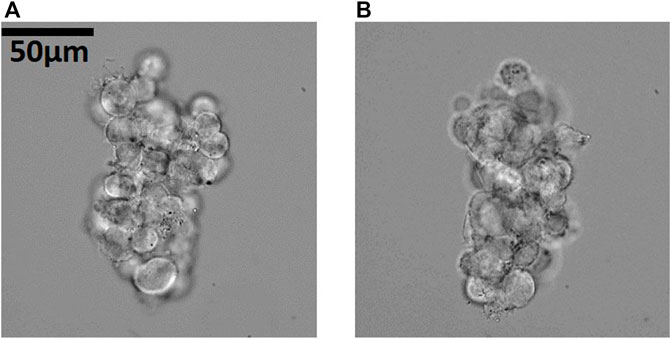
FIGURE 8. Reorientation of cell cluster for angle-scanning of the illumination in the high-NA compatible chip. Reorienting the sample to a new stable trapping orientation allows us to repeat illumination scanning at a different viewing direction, to improve the reconstruction. In (A) the cancer cell spheroid is trapped and oriented to a strong top-transducer, in (B) to a stronger x-transducer. NAcon = 0.2. Corresponding Supplementary Movies S11, S12.
4 Discussion
Acoustofluidic devices can be manufactured at a wide frequency range to accommodate specific needs, e.g., different sample sizes. The acoustic radiation forces scale with the volume of the particle for samples smaller than the wavelength (and with its acoustophoretic contrast), and levitating a cell cluster against buoyant gravity does not require high voltages. To ensure that the sample is lifted above the bottom coverslip in our device, the sample radius cannot exceed λ/4 ≈ 120 µm. The lower limit for trappable particle sizes is determined by balancing the acoustic radiation force with the acoustic streaming. One can derive a theoretical particle diameter for which the acoustic streaming is dominating, as in [32] for a spherical particle. The critical particle diameter depends on the particle’s acoustophoretic contrast factor, the chamber geometry, and on the viscous boundary layer determined by the trapping frequency and the viscosity of the surrounding fluid. We find that spherical polystyrene particles above ≈1 μm–2 µm diameter in water are trapped by the acoustic radiation force in our device. To trap even smaller particles, one can increase the trapping frequency, e.g., using higher harmonics of the device, or modify the resonator geometry to reduce the effect of streaming, e.g., by reducing channel heights [24, 33, 34]. To be able to induce sustained rotations of a sample, the trapped object should not be larger than the spacing between the trapping nodes from the transducers (λ/2), as it then could be “locked in” and not free to move. To levitate and rotate samples of several mm in size, one should use an up-scaled design operated at longer wavelengths.
The study of mature organoids poses a serious problem, since the larger they grow the more opaque they become. Optical imaging then faces a serious problem concerning penetration depth and image quality, due to diffraction, absorption, and multiple scattering. The reconstruction of 3D structural maps, such as the refractive index distribution inside the sample, becomes very challenging for such samples, but inspection from different sides nevertheless provides essential information. In Figure 9, we show images of a larger and more spherical ≈100 μm-sized cancer cell spheroid undergoing a sustained rotation in our device at a rotation rate of 0.018–0.03 Hz. We see that one can inspect the sample from multiple viewing axes at a high contrast and higher resolution when increasing the imaging NA from Figure 9A NAobj = 0.25 to Figure 9B NAobj + NAcon = 1.15 + 0.15 = 1.3. At a higher illumination NAcon = 0.4 in Figure 9C, we get higher resolution images of the spheroid and higher optical sectioning. We can resolve the periphery of the object in one optical slice at a higher contrast than the middle part as the refractive index change is larger between the cells and the medium around than within the more homogeneous cell cluster core. For even larger samples, the light from the middle will be deteriorated by scattering within the object. The larger the object, the less information we get from the center of the object. Optical diffraction tomography has its limits to how scattering the object can be (depending on the object parameters) to reconstruct the 3D structure, and combing our technique with other optical imaging modalities with a higher penetration depth (e.g., multi-photon microscopy, potentially applying adaptive optics or wavefront shaping) will be advantageous for studies of large cancer cell spheroids and organoids.
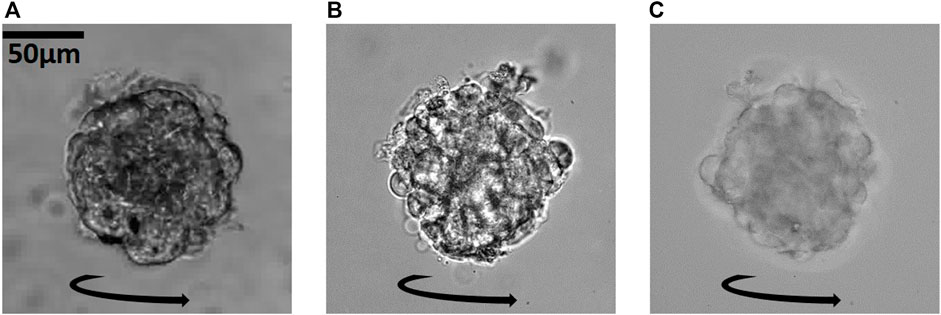
FIGURE 9. Enabling of the 3D inspection of a larger, more spherical cancer spheroid: Increasing the imaging-NA from (A) NAobj = 0.25 to (B) NAobj + NAcon = 1.3 to (C) NAobj + NAcon = 1.55 allows us to inspect the cancer cell spheroid from all sides while it is rotating, at increasingly higher resolution. Corresponding Supplementary Movies S13–S15.
5 Summary and outlook
We have presented a high-NA compatible device for acquiring high-resolution images of trapped sub-mm-sized biological samples. While keeping samples in their native state and in non-contact to confining structures, we can reorient and induce sustained rotation of samples to image them from multiple viewing axes to acquire tomographic data. We have demonstrated induced sustained rotations of pollen grains and cancer cell spheroids rotating at a rate between 0.017 and 0.1 Hz. For particles of a more spherical shape, we can induce rotations around two object axes, by controlling the direction of the restoring and spinning torque respectively. Rotating an object around two (largely) orthogonal axes while imaging from the top allows us to collect data that can circumvent the “missing cone problem” of tomographic reconstruction, which relates to inaccessible regions in Fourier space when the rotation axis is kept constant. Our high-NA compatible chip can also be combined with illumination-angle scanning, for improving the resolution in the reconstruction by reorienting the sample and performing repeated illumination scanning from multiple viewing directions. Our manipulation strategy to induce sustained rotations of samples in liquid to collect tomographic data, compared to rotating the imaging system, relaxes the imaging setup requirements. However, it also introduces a problem, as the rotation parameters are unknown. The exact rotation parameters in such a system have to be retrieved prior to reconstruction, for example, by recurrent neural networks which are trained to find the rotation axis and angle of images of test samples rotated into many directions.
Here, we are addressing only the manipulation strategies possible in the high-NA compatible chip; investigations into which samples can be reconstructed with this strategy in combination with optical diffraction tomography or other imaging modalities and about the achievable resolution is ongoing work in our lab. Larger samples, such as developing cancer cell spheroids, embryos, and organoids with sizes larger than 1 mm, demand to increase the size of the acoustofluidic device, in particular the channel height, which is 500 µm for our device, and to operate it at larger wavelengths using thicker transducers. However, the restricted working distances of available high-NA objective lenses poses a limitation on the up-scaling of the device.
A great advantage of the presented acoustofluidic trapping device is the feature that it can trap and manipulate samples in solution without any prior knowledge about the samples within a certain size-range determined mainly by the trapping wavelength. For samples, such as certain organoids, that require gel matrix support to grow, manipulating a gel droplet they are encapsulated in could be an interesting approach. Moreover, the biocompatibility of such devices is very good within certain sound pressure limits, as has already been established [2, 8], allowing for acoustic trapping of living samples over days [35]. With our setup, we have already performed continuous acoustic trapping of spheroids for up to 8 h, but for meaningful long-term experiments, we would need to implement temperature control, media exchange, and check the biocompatibility of the materials used for the device to ensure the viability of the samples. Acoustic trapping platforms have also been used for tissue-engineering, for instance, cell spheroids have been formed in acoustic trapping platforms allowing for long-term study of cell organization and development [36, 37]. As the acoustic radiation forces are pushing the cells together, these strategies allow for spheroid formation also of cells with lower contractile properties. This application could also be possible in our device, with the further capability of collecting tomographic imaging data by rotating the sample. Quantitative reconstruction of a samples refractive index distribution by, e.g., optical diffraction tomography, would yield valuable insight into cell and sub-cellular morphology and biochemical information [3]. 3D reconstruction of the samples can be used for live monitoring of developing cells, 3D cell structures, and organoids. This would make screening, diagnostics, and monitoring of response to chemotherapeutic agents, or to pathogens, feasible. With the rise of spheroid and organoid research, a manipulation platform that opens up the possibilities to keep samples of a large size range trapped long-term in a non-contact and non-invasive manner with label-free tomographic imaging capabilities would be of great importance.
Data availability statement
The original contributions presented in the study are included in the article/Supplementary Material; further inquiries can be directed to the corresponding author.
Author contributions
MR-M and GT-T provided the funding and devised the general approach, MKL and SM performed the experiments, MKL designed and assembled the acoustofluidic chip, and all authors contributed to the writing of the manuscript.
Funding
This work was supported by the Austrian Science Fund (FWF) under SFB-grant F68 Tomography across the scales (sub-project F6806-N36 Inverse Problems in Imaging of Trapped Particles).
Acknowledgments
We thank Judith Hagenbuchner and Michael Ausserlechner (both Department of Pediatrics, Medical University Innsbruck) for providing us with the neuroblastoma cancer cell spheroids. We thank Armin Sailer (Institute for Experimental Physics, University of Innsbruck) for CNC-manufacturing the high-NA chip according to our design.
Conflict of interest
The authors declare that the research was conducted in the absence of any commercial or financial relationships that could be construed as a potential conflict of interest.
Publisher’s note
All claims expressed in this article are solely those of the authors and do not necessarily represent those of their affiliated organizations, or those of the publisher, the editors, and the reviewers. Any product that may be evaluated in this article, or claim that may be made by its manufacturer, is not guaranteed or endorsed by the publisher.
Supplementary material
The Supplementary Material for this article can be found online at: https://www.frontiersin.org/articles/10.3389/fphy.2022.940115/full#supplementary-material
References
1. Dholakia K, Drinkwater BW, Ritsch-Marte M. Comparing acoustic and optical forces for biomedical research. Nat Rev Phys (2020) 2:480–91. doi:10.1038/s42254-020-0215-3
2. Rufo J, Cai F, Friend J, Wiklund M, Huang TJ. Acoustofluidics for biomedical applications. Nat Rev Methods Primers (2022) 2:30–21. doi:10.1038/s43586-022-00109-7
3. Jin D, Zhou R, Yaqoob Z, So PT. Tomographic phase microscopy: Principles and applications in bioimaging [invited]. J Opt Soc Am B (2017) 34:B64. doi:10.1364/josab.34.000b64
4. Heintzmann R, Cremer C. Axial tomographic confocal fluorescence microscopy. J Microsc (2002) 206:7–23. doi:10.1046/j.1365-2818.2002.01000.x
5. Van Rooij J, Kalkman J. Large-scale high-sensitivity optical diffraction tomography of zebrafish. Biomed Opt Express (2019) 10:1782–93. doi:10.1364/boe.10.001782
6. Simon B, Debailleul M, Houkal M, Ecoffet C, Bailleul J, Lambert J, et al. Tomographic diffractive microscopy with isotropic resolution. Optica (2017) 4:460–3. doi:10.1364/optica.4.000460
7. Løvmo MK, Pressl B, Thalhammer G, Ritsch-Marte M. Controlled orientation and sustained rotation of biological samples in a sono-optical microfluidic device. Lab Chip (2021) 21:1563–78. doi:10.1039/d0lc01261k
8. Chen C, Gu Y, Philippe J, Zhang P, Bachman H, Zhang J, et al. Acoustofluidic rotational tweezing enables high-speed contactless morphological phenotyping of zebrafish larvae. Nat Commun (2021) 12:1118–3. doi:10.1038/s41467-021-21373-3
9. Zhang J, Yang S, Chen C, Hartman JH, Huang PH, Wang L, et al. Surface acoustic waves enable rotational manipulation of caenorhabditis elegans. Lab Chip (2019) 19:984–92. doi:10.1039/c8lc01012a
10. Lim J, Lee K, Jin KH, Shin S, Lee S, Park Y, et al. Comparative study of iterative reconstruction algorithms for missing cone problems in optical diffraction tomography. Opt Express (2015) 23:16933–48. doi:10.1364/oe.23.016933
11. Vertu S, Flügge J, Delaunay JJ, Haeberlé O. Improved and isotropic resolution in tomographic diffractive microscopy combining sample and illumination rotation. Open Phys (2011) 9:969–74. doi:10.2478/s11534-011-0018-3
12. Lee M, Kim K, Oh J, Park Y. Isotropically resolved label-free tomographic imaging based on tomographic moulds for optical trapping. Light Sci Appl (2021) 10:102–9. doi:10.1038/s41377-021-00535-4
13. Kou SS, Sheppard CJ. Image formation in holographic tomography: High-aperture imaging conditions. Appl Opt (2009) 48:H168–H175. doi:10.1364/ao.48.00h168
14. Habaza M, Gilboa B, Roichman Y, Shaked NT. Tomographic phase microscopy with 180 rotation of live cells in suspension by holographic optical tweezers. Opt Lett (2015) 40:1881–4. doi:10.1364/ol.40.001881
15. Thalhammer G, McDougall C, MacDonald MP, Ritsch-Marte M. Acoustic force mapping in a hybrid acousticoptical micromanipulation device supporting high resolution optical imaging. Lab Chip (2016) 16:1523–32. doi:10.1039/c6lc00182c
16. Lamprecht A, Schwarz T, Wang J, Dual J. Viscous torque on spherical micro particles in two orthogonal acoustic standing wave fields. The J Acoust Soc America (2015) 138:23–32. doi:10.1121/1.4922175
17. Bruus H. Acoustofluidics 7: The acoustic radiation force on small particles. Lab Chip (2012) 12:1014–21. doi:10.1039/c2lc21068a
18. Silva G, Lobo T, Mitri F. Radiation torque produced by an arbitrary acoustic wave. EPL (Europhysics Letters) (2012) 97:54003. doi:10.1209/0295-5075/97/54003
19. Zhang L, Marston PL. Acoustic radiation torque on small objects in viscous fluids and connection with viscous dissipation. J Acoust Soc America (2014) 136:2917–21. doi:10.1121/1.4900441
20. Wang T, Kanber H, Rudnick I. First-order torques and solid-body spinning velocities in intense sound fields. Phys Rev Lett (1977) 38:128–30. doi:10.1103/physrevlett.38.128
21. Zhang B, Hong Z, Drinkwater B. Transfer of orbital angular momentum to freely levitated high-density objects in airborne acoustic vortices. Phys Rev Appl (2022) 18:024029. doi:10.1103/physrevapplied.18.024029
22. Baresch D, Thomas JL, Marchiano R. Orbital angular momentum transfer to stably trapped elastic particles in acoustical vortex beams. Phys Rev Lett (2018) 121:074301. doi:10.1103/physrevlett.121.074301
23. Mitri F, Lobo T, Silva G. Axial acoustic radiation torque of a bessel vortex beam on spherical shells. Phys Rev E (2012) 85:026602. doi:10.1103/physreve.85.026602
24. Wiklund M, Green R, Ohlin M. Acoustofluidics 14: Applications of acoustic streaming in microfluidic devices. Lab Chip (2012) 12:2438–51. doi:10.1039/c2lc40203c
25. Brodie GWJ, Qiu Y, Cochran S, Spalding GC, Macdonald MP. Letters: Optically transparent piezoelectric transducer for ultrasonic particle manipulation. IEEE Trans Ultrason Ferroelectr Freq Control (2014) 61:389–91. doi:10.1109/TUFFC.2014.2923
26. Bruus H. Acoustofluidics 2: Perturbation theory and ultrasound resonance modes. Lab Chip (2012) 12:20–8. doi:10.1039/c1lc20770a
27. Hahn P, Lamprecht A, Dual J. Numerical simulation of micro-particle rotation by the acoustic viscous torque. Lab Chip (2016) 16:4581–94. doi:10.1039/c6lc00865h
28. Hill M, Shen Y, Hawkes JJ. Modelling of layered resonators for ultrasonic separation. Ultrasonics (2002) 40:385–92. doi:10.1016/s0041-624x(02)00127-0
29. Thalhammer G, Steiger R, Meinschad M, Hill M, Bernet S, Ritsch-Marte M. Combined acoustic and optical trapping. Biomed Opt Express (2011) 2:2859. doi:10.1364/BOE.2.002859
30. Mitri F. Acoustic radiation force acting on elastic and viscoelastic spherical shells placed in a plane standing wave field. Ultrasonics (2005) 43:681–91. doi:10.1016/j.ultras.2005.03.002
31. Glynne-Jones P, Mishra PP, Boltryk RJ, Hill M. Efficient finite element modeling of radiation forces on elastic particles of arbitrary size and geometry. J Acoust Soc America (2013) 133:1885–93. doi:10.1121/1.4794393
32. Bruus H. Acoustofluidics 10: Scaling laws in acoustophoresis. Lab Chip (2012) 12:1578–86. doi:10.1039/c2lc21261g
33. Hahn P, Leibacher I, Baasch T, Dual J. Numerical simulation of acoustofluidic manipulation by radiation forces and acoustic streaming for complex particles. Lab Chip (2015) 15:4302–13. doi:10.1039/c5lc00866b
34. Bach JS, Bruus H. Suppression of acoustic streaming in shape-optimized channels. Phys Rev Lett (2020) 124:214501. doi:10.1103/physrevlett.124.214501
35. Wiklund M. Acoustofluidics 12: Biocompatibility and cell viability in microfluidic acoustic resonators. Lab Chip (2012) 12:2018–28. doi:10.1039/c2lc40201g
36. Christakou AE, Ohlin M, Önfelt B, Wiklund M. Ultrasonic three-dimensional on-chip cell culture for dynamic studies of tumor immune surveillance by natural killer cells. Lab Chip (2015) 15:3222–31. doi:10.1039/c5lc00436e
Keywords: 3D acoustic trapping, high-NA, microfluidics, acoustic torque, sustained rotation, reorientation, lab-on-a-chip, tomography
Citation: Løvmo MK, Moser S, Thalhammer-Thurner G and Ritsch-Marte M (2022) Acoustofluidic trapping device for high-NA multi-angle imaging. Front. Phys. 10:940115. doi: 10.3389/fphy.2022.940115
Received: 09 May 2022; Accepted: 28 November 2022;
Published: 12 December 2022.
Edited by:
Ashis Sen, Indian Institute of Technology Madras, IndiaReviewed by:
Zhenyu Hong, Northwestern Polytechnical University, ChinaMauricio Hoyos, École Supérieure de Physique et de Chimie Industrielles de la Ville de Paris, France
Copyright © 2022 Løvmo, Moser, Thalhammer-Thurner and Ritsch-Marte. This is an open-access article distributed under the terms of the Creative Commons Attribution License (CC BY). The use, distribution or reproduction in other forums is permitted, provided the original author(s) and the copyright owner(s) are credited and that the original publication in this journal is cited, in accordance with accepted academic practice. No use, distribution or reproduction is permitted which does not comply with these terms.
*Correspondence: Monika Ritsch-Marte, monika.ritsch-marte@i-med.ac.at