Simulations of graphite boronization: A molecular dynamics study of amorphization resulting from bombardment
 Aaditya Rau
 Sierra Jubin2,3
  Joseph R. Vella
 Igor D. Kaganovich
- 1Department of Mechanical Engineering, Johns Hopkins University, Baltimore, MD, United States
- 2Princeton Plasma Physics Laboratory (PPPL), Princeton, NJ, United States
- 3Department of Astrophysical Sciences, Princeton University, Princeton, NJ, United States
The molecular dynamics code LAMMPS was used to simulate the bombardment of a graphite structure by atomic boron with impact energies ranging from 50–250 eV. The transient structural evolution, penetration depth, and amorphous layer thickness were analyzed. Simulations show that larger impact energies lead to a greater volume of amorphization and penetration of boron, but that the growth rate of the amorphous layer decreases with increasing fluence. Furthermore, the change in surface chemistry of the amorphized structures was studied using the ReaxFF formalism, which found that the amorphization process introduces dangling bonds thus increasing reactivity in the amorphous region.
1 Introduction
As has been noted by multiple studies [1, 2] on the topic, plasma-facing components (PFCs) and the corresponding plasma-material interactions (PMIs) remain an active and important area of study in fusion device development. Historically, graphite panels have been used in fusion devices due to carbon’s low atomic number and graphite’s lack of a melting point at ambient pressure. These features correspond to fewer energy losses due to sputtering of wall material into the plasma and protect the material against high reactor temperatures [3]. The deposition of boron onto graphite PFCs, or boronization, has been tested as a strategy to improve PFC behavior by increasing deuterium retention and reducing sputtering; effects such as these have been studied at facilities such as the National Spherical Torus eXperiment—Upgrade (NSTX-U) [1–3]. Boron is typically deposited onto the wall material through a glow discharge created using a boron precursor gas, such as diborane or boron trimethyl [3]; alternatively, recent work has been done to show the feasibility of boronization via addition of boron powder into the plasma [4, 5]. Impurities introduced into the main plasma can undesirably cool the plasma and limiting the sputtering of PFCs is key to improving their part life and overall utility. Thus, a firm understanding of PFC boronization is necessary in improving the performance of fusion devices.
However, as has been mentioned in the literature [1, 2], there are multiple challenges endemic to PMIs: firstly, the rapid timescales (picoseconds to nanoseconds) of chemical reactions mean that post-operation analysis of wall material cannot capture transient reaction dynamics. Furthermore, the complex reaction dynamics of bombardment, ion implantation, and surface evolution are typically too complex to practically resolve with high-fidelity quantum mechanical simulations and difficult to understand or measure with in-situ experiments due to the atomic length scales involved and safety hazards related to the use of boron precursors [3]. As a result, atomistic simulation methods such as molecular dynamics (MD) have emerged as a critical tool in characterizing PMIs. To this end, a combination of classical molecular dynamics (CMD) and density functional theory (DFT) approaches have been used to investigate reactions between carbon/boron/oxygen mixtures and their irradiation by deuterium [2, 6–8]. This has provided valuable insight into species transport, sputtering behavior, and other events that are relevant to PMIs. For example, the presence of boron within oxidized amorphous carbon mixtures has been shown in simulations—and corroborated via experiment—to reduce the amount of sputtered carbon from to deuterium bombardment [2, 6, 7]. Furthermore, boron has been shown to prevent the sputtering of oxygen within amorphous carbon by deuterium via the formation of oxidized boron states [6–8]. The hydrogen uptake of ordered carbon/boron mixtures has been probed by simulations of low-energy hydrogen bombardment of both pure carbon and boron-doped fullerene cages to observe uptake, which showed that the probability of hydrogen retention varied strongly based on impact energy [9].
Despite the insight gained by these prior simulations, they are subject to certain constraints that, if lifted, could yield further information about PMIs. For example, the aforementioned amorphous C-B-O mixtures contained approximately 400 atoms [2, 6, 7], where the initial positions of atoms were generated randomly then relaxed via energy minimization and thermalization. As has been shown through other CMD simulations of graphite under deuterium bombardment [10], only the top few layers were found to become amorphous, while the rest of the crystal maintained the typical graphite structure. Though the ATJ graphite used as PFCs in NSTX-U is amorphous, the coke particles used to produce ATJ graphite have been shown to have crystalline structure resembling graphite on the scales of 10–30 Å [11]. Thus, large-scale simulations of PFCs that build the simulation from a fundamentals-based approach are necessary to determine the structure of boron-carbon mixtures resulting from boronization in order to advance the understanding of PMIs and fusion device development. In the current study, the boronization process is simulated for a large graphite block of roughly 6,000 carbon atoms bombarded by atomic boron at energies ranging from 50 to 250 eV. One work on tokamaks has predicted ion-wall collision energies of 200–300 eV [12], but recent works in deuterium bombardment have used much lower energies near 5–30 eV [2, 6], thus the current set of simulations samples a relevant range of collision energies. The goal of this study is to use an atomistic model to investigate the interactions between graphite and boron and the resulting effects on physical structure and chemical reactivity. It should also be noted that we expect CMD to be an ideal tool for studying the boronization of a graphite surface at the aforementioned energies. This is because the collision cascade after bombardment will last for a few picoseconds and affect regions within 1–2 nm of the material surface, and these time and length scales are compatible with CMD simulations.
The paper is organized as follows: the next section will provide details about the CMD calculations as well as various properties calculated, followed by the presentation and discussion of results. In the final section, we will give concluding remarks summarizing these results.
2 Materials and methods
2.1 Simulation details
CMD is a computational technique where the movement of a system of particles (typically atoms or molecules) is simulated by integrating Newton’s 2nd Law of motion. That is, the movement of the i-th atom is given by:
where mi is its mass,
Because of the dynamic nature of PMIs, there are a plethora of events that occur: sputtering, bond destruction/formation, and defect creation, among others. As has been done in other PMI CMD studies, the Reactive Force-Field (ReaxFF) potential was chosen for its ability to accurately describe these events [1, 2, 6, 7, 9]. As the name suggests, ReaxFF potentials can be used to simulate chemical reactions. Originally developed for hydrocarbon systems [13], ReaxFF has been extended to various other systems [14–17]. ReaxFF also allows for the dynamic calculation of atomic charge using the Electronegativity Equalization Method (EEM) [18]. For the current work, a ReaxFF potential parameterized to study boron carbides at extreme temperatures and pressures was used [16], as it was able to simulate deformation-induced amorphization of boron-carbide [16]. Furthermore, it has been used in CMD simulations of supersonic and hypersonic impacts of carbon projectiles into boron-carbide blocks to study impact-induced amorphization [19]. Thus, we are confident that the chosen ReaxFF potential is suitable to describe the high-energy impact processes and resulting amorphization studied in this work. The Large Scale Atomic/Molecular Massively Parallel Simulator (LAMMPS) software (29 October 2020 and 29 September 2021 versions) was used to run the simulations in this study [20, 21].
The initial graphite structure was created using the standard lattice parameters (a = 2.46 Å, c = 6.71 Å) and primitive lattice vectors (v1 = (a√3/2, -a/2, 0), v2 = (a√3/2, -a/2, 0), v3 = (0,0,c)) for a graphite cell with dimensions of roughly 40 Å ✕ 35 Å ✕ 40 Å in the x, y, and z directions, respectively (see Supplementary Figure S1 for a diagram of the physical meanings of these quantities for a graphite cell). These dimensions correspond to a graphite block twelve layers thick and a simulation cell of approximately 6,000 carbon atoms. An energy minimization scheme was performed, and the simulation cell was allowed to relax to zero isobaric pressure using periodic boundary conditions in all directions.
For boron deposition simulations, the graphite block was inserted into a simulation box with approximately 20 Å of initial vacuum space above the graphite cell, and the periodic boundary condition in the z direction was changed to a fixed boundary in order to allow for potentially reflected atoms to leave the simulation cell. The bottom graphene layer was fixed to prevent the crystal from exiting the bottom of the cell due to momentum transfer from impacts. The rest of the graphite was thermalized at 300K for 1 ps. Then, bombardment commenced, using a similar methodology to prior simulations of D bombardment of graphite [10]. Layers two through eight were held at 300 K using a Langevin thermostat [22] with time constant of 100 fs, to act as a thermal sink and to simulate the bulk crystal. The top four layers were allowed to evolve freely for 1 ps under the microcanonical (NVE) ensemble (constant number of atoms, volume, and energy) after each B impact. After the NVE run, the top four layers were also subjected to a Langevin thermostat for 1 ps with a time constant of 100 fs, in order to dissipate excess thermal energy from bombardment. Based on preliminary trial runs, this alternating thermostat was necessary to force energy dissipation, as the transfer of energy between graphene planes via van der Waals forces led to impractically large simulation times. The insertion period of 2 ps is comparable to that used in prior bombardment studies that have ranged from 2 ps [23] to as small as 0.5 ps [24]—thus, we are confident that the insertion and thermostatting timescales chosen are sufficient to observe the collision cascade and allow for relaxation. This was confirmed by monitoring the temperatures of the top four layers in order to ensure that the thermostat was not applied prematurely (see Supplementary Figure S2). After this, the bombardment procedure is repeated until the desired B fluence is reached. We note that we use B fluence rather than B flux because we are only integrating Newton’s equations during the collision cascade for each impact. We are not considering the time between impacts which, in experiments and applications, is on the order of milliseconds. This timescale is too large to be resolved with traditional CMD given that the timestep of integration is on the order of a femtosecond. We circumvent these long timescales by assuming no significant physics occurs during the time between impacts, so simulation of these times is not necessary. Thus, once an impact simulation is finished and the simulation cell is thermostatted, we immediately jump to the next impact. Strictly speaking, this procedure only allows us to interpret our results in terms of B fluence, instead of flux because the time between impacts is undefined. However, given that fluence is simply flux multiplied by time, comparison with experiments can be done. The initial graphite structure and a diagram of the thermostat setup are presented in Figure 1. During the deposition simulations, boron atoms are randomly placed above the graphite slab such that they are high enough to be outside the interaction distance of the other atoms. B atoms are assigned a kinetic energy that varied from 50 to 250 eV in 50 eV increments and a velocity directed in the downward direction. The structure of the graphite slab was monitored during the deposition simulations and various types of analyses were performed. These will be explained in the next subsection. The simulations were conducted on the Cori Cray XC40 supercomputer at National Energy Research Scientific Computing Center (NERSC) on the Haswell partition with 32 cores.
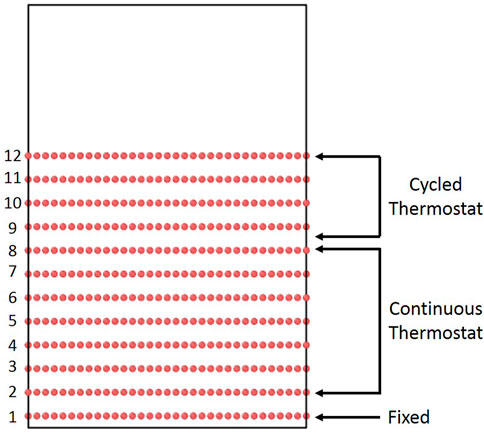
FIGURE 1. Initial graphite cell with the different thermostat zones marked.
2.2 Analysis methodology
Several different types of analyses were performed in order to study the amorphization of graphite by B bombardment. Here, we will discuss how each analysis was performed and the purpose of each one.
2.2.1 Shannon entropy
Boron and carbon atoms were sorted by z-coordinate into bins of width 0.5 Å. This enables easy analysis of the time evolution of the number density of both species as a function of depth. To quantify the degree and timescale of graphite amorphization, the statistical (or Shannon) entropy was computed for the carbon atom distribution every picosecond. The histogram of carbon number density with n bins at a given time step means that for the i-th bin of the histogram, the probability Pi that a carbon atom will be in that bin is given by the ratio:
Then, with probabilities assigned to all bins, the Shannon entropy [25], denoted as S, can be computed as:
with the convention that
2.2.2 Penetration depth
Furthermore, the time-dependent average depth of boron beneath the surface was computed using the following method developed by the authors. At a boron fluence of qB, if the graphite surface has mean height Zs(qB) and the z-positions of the boron atoms are averaged to compute ZB(qB), we define the average penetration depth D(qB) as:
To estimate the surface height at each time step, the carbon atoms first were sorted by height. Then, the standard deviation and mean were computed for the topmost atoms in multiples of 16, i.e., the topmost 16 carbon atoms, then the topmost 32, etc., up to 512 atoms - the number of carbon atoms in a graphite layer at the simulation onset. From this list, the mean value with the lowest standard deviation was selected as the surface height estimate. While the Shannon entropy described above measures the spread of the distribution of carbon atoms, estimating penetration depth indicates the center of the distribution of boron atoms within the graphite block.
2.2.3 Coordination number
Another useful metric in studying amorphization is the use of an order parameter, as has been done in MD simulations of the bombardment of a crystalline silicon lattice with argon [24]. For this study, the carbon coordination number of the carbon atoms was used as a simple order parameter. The carbon coordination number is defined as the number of neighboring carbon atoms within a cutoff radius of a central carbon atom; the cutoff value was taken to be 2 Å, which was chosen to be slightly larger than the first peak in the C-C radial distribution function computed using LAMMPS. The Open Visualization Tool (OVITO) [26] was used to compute the coordination number for each atom at every time step. The carbon atoms were then separated into bins of size c/40 where c = 6.71 Å is the vertical lattice parameter of graphite. Within each bin, the per-atom coordination numbers were averaged. A MATLAB script was then used to identify the bin where the coordination number deviated from the crystalline graphite value of three by 0.1; this deviation then provides a marker for the amorphous-crystalline interface. Measuring the interface height in this way is useful to gauge whether the size of the amorphous regions generated via random placement of boron and carbon used in prior work can accurately represent boronized graphite surfaces.
2.2.4 Undercoordination
As described in the original ReaxFF paper [13], the over/undercoordination of an atom is computed at each simulation timestep as part of the reaction dynamics. Meant to extend the notion of “bond-order” used in potentials such as those by Tersoff [27], overcoordinated atoms are those which the sum of the bond orders on an atom exceeds the valence value set by ReaxFF in the input potential parameter file. Conversely, undercoordination represents when this sum is less than the valence. Importantly, this can be taken as a proxy for the reactivity of a surface; undercoordinated atoms have a more radical character and thus will be more likely to form bonds with impinging atoms in order to lower the degree of undercoordination. This is of particular interest for PMIs because the creation of a more reactive surface would allow for greater retention of deuterium due to the formation of bonds with carbon. To measure this, a script was written in Python to compute the total bond order on atoms by implementing the equations of the ReaxFF formalism [13] on the atom positions output by LAMMPS and the input parameters of the potential file [16].
3 Results
After 225 atomic boron impacts, the initial structure and final structures at each energy are shown in Figure 2. Given the lateral box dimensions of 35 Å ✕ 40 Å in the x-y plane, this corresponds to a final fluence on order of 1019 B/m2, which is comparable to values used in other bombardment simulations pertinent to fusion science [10] (approx. 1020 B/m2). Thus, we are confident that the degree of amorphization we observe from our simulations is representative of graphite present in fusion devices.
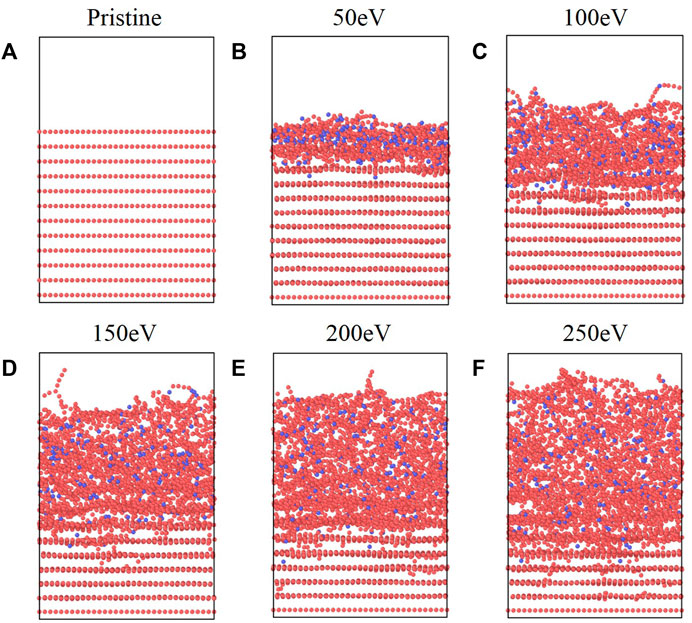
FIGURE 2. (A) Original graphite structure and structures after 225 B impacts at (B) 50 eV, (C) 100 eV, (D) 150 eV, (E) 200 eV, and (F) 250 eV impinging energies.
Qualitatively, it is evident that increased bombardment energies cause greater destruction of the discrete graphite layers seen in Figure 2A. This is consistent with analogous work done in the context of the semiconductor industry. For example, the thickness of the damaged (also called amorphous) region of silicon during argon ion bombardment has been shown to increase as a function of the square root of the ion energy [24], a trend, that is, qualitatively matched in the present simulations (see Supplementary Figure S3). This destruction is accompanied by a decrease in density, evident by the larger volume occupied by the boron-graphite structure at higher bombardment energies. This swelling is consistent with prior results related to the amorphization of carbon structures from DFT [1, 2] and MD calculations [2, 10].
In the initial stages of the simulation, point defects in graphene sheets such as substitutions and vacancies can be observed (see Supplementary Figure S4); these defects are caused by impinging boron atoms knocking carbon atoms out of the plane. However, as the simulation progresses, the graphene layers become damaged enough that these defects are no longer coherent. Although these defects were observed, a reliable estimate of the point defect formation energy would require higher fidelity quantum chemistry calculations. While graphite layers typically interact through weak van der Waals forces, impacting boron atoms can be seen to force the creation of carbon chains that cross-link layers. Furthermore, carbon-boron chains are visibly formed at the surface. Within the block, the destruction of graphene layers leads to boron-carbon mixtures; while this disruption of structured carbon occurs at both the surface and in the bulk, the atoms in the bulk are effectively annealed by the thermostat and surrounded by other carbon atoms. Thus, it is unlikely for discrete, isolated chains to form inside the bulk as they do on the surface. For the 50 eV impact energy, it appears that while boron atoms have perturbed the top two layers, most of the atomic boron resides in between the layers.
3.1 Shannon entropy
After sorting the carbon atoms by height into bins of width 0.5 Å, the Shannon entropy at each time step was computed for each energy as described above; the results are displayed in Figure 3. For all energies tested, the final entropy values increased with increasing impact energy, which is consistent with the visualizations in Figure 2. This is in large part accounted for by the greater volume of the simulation that is amorphized by the impinging boron at higher energies, also seen in Figure 2. Furthermore, each entropy curve shows a significant flattening by the end of the simulation run, compared to the rapid increase in entropy in the first 25 impacts. The initial rapid increase is associated with both the destruction of discrete graphite layers and the swelling of the graphite block—occupying a greater volume causes more bins to fill and thus the entropy to increase. The slower increase in entropy at the later stages of the simulation is due to smaller-scale changes in volume resulting from the insertion of additional boron atoms, which causes the amorphous region to grow—albeit much more slowly than the initial rapid expansion. We expect this state of slow amorphous region growth to be the final stage of the amorphization process and thus believe that our simulations capture the amorphization dynamics pertinent to boronization.
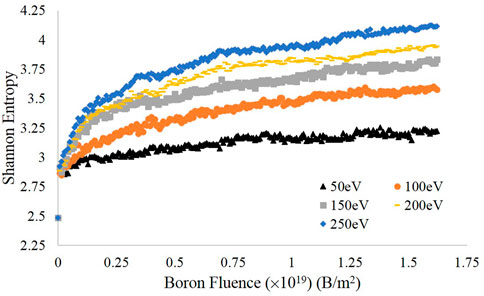
FIGURE 3. Shannon entropy as a function of fluence for each energy investigated.
3.2 Penetration depth
Having analyzed the evolution of the overall structure, another quantity of interest in characterizing the final structure of the boronized graphite is the average penetration depth of boron. Using the method described to estimate the heights of the surface and boron atoms, the following plot was obtained and is presented in Figure 4. From here, the similarities to the plot of entropy are readily apparent; the penetration depth also follows the expected trend that higher impact energies lead to greater penetration. For a given ion energy, the penetration depth initially increases rapidly as a function of fluence because the amorphous layer is being formed. The lower density and displacement of carbon atoms from the stable sp2 configuration due to the previous impacts may lower the energy barrier for successive impinging boron. However, we note that following this rapid increase, the penetration depth enters a slower growth regime, similar to the Shannon entropy. This is due to the fact that the ions lack the amount of kinetic energy needed to penetrate deeper into the layer.

FIGURE 4. Estimated penetration depth of boron as a function of fluence for each energy tested.
Interestingly, there is noticeable continued growth of the penetration depth towards the end of the simulation, particularly for the higher bombardment energies. This is dissimilar to the Shannon entropy, which, while it may still be increasing, appears to be slowing in its evolution. This difference may be explained by considering how the surface height is estimated. The method used in this paper computes the average using the topmost atoms in the simulation cell; these atoms are mostly contained within the aforementioned surface level chains. As these chains are consistently disturbed and liberated during impact events, this is a potential explanation for the noticeable penetration depth evolution observed at the end of the simulation, particularly at the higher impact energies where chain formation is more prominent. A more robust surface height estimation method that eliminates the effect of the chains on the estimate may reduce the final growth of the penetration depth. Furthermore, analysis of the penetration depth shows that on average, boron at the energies tested lies beneath the surface rather than accumulating on top of the graphite block. The distribution of boron is also non-uniform thus indicating that prior work that considered a uniform mixture of carbon and boron may not be fully representative of the boron-carbon mixtures formed during amorphization; based on the pertinent boron fluence, studies of deuterium sputtering and retention of boronized surfaces may need to include both amorphous and crystalline features within the interaction depth of bombarding deuterium.
3.3 Coordination number
As mentioned above, the use of the carbon coordination number as an order parameter provides a metric to analyze the amorphous-crystalline interface. As shown for the 50 eV, 150 eV, and 250 eV cases in Figure 5 using a binning parameter of c/4 (1.71 Å) as an initial illustration of the effectiveness of coordination number as an order parameter, the mean coordination number remains near three in the undisturbed layers - which corresponds to the three neighboring carbon atoms in a graphene sheet - but rapidly drops at the interface between the undisturbed and amorphous regions. Interestingly, there is a slight increase in the coordination number at the crystalline-amorphous interface before the rapid decrease occurs. A similar trend has been observed in a study of Si bombardment by Ar which also used the coordination number to study amorphization [28]. One possible explanation for this is that the boundary contains carbon atoms from graphene sheets above the interface that have been forced down by boron impacts; this also suggests that the amorphous region is not of uniform local structure. Overall, Figure 5 confirms that deviations in the mean coordination number can be used to estimate the thickness of the amorphous region by subtracting the interface height from the surface height previously computed.
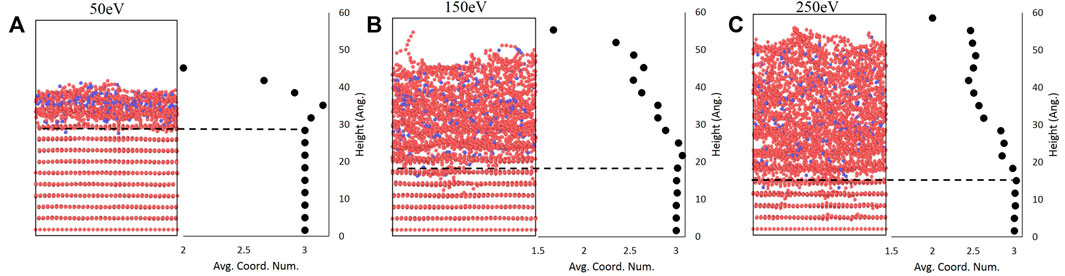
FIGURE 5. Final bombarded structures at (A) 50 eV, (B) 150eV, and (C) 250 eV alongside plots of averaged coordination number showing that deviations from the graphitic value of three correspond with the amorphous interface.
The results over the entire simulation are shown in Figure 6, using a more fine-grained binning value of c/40 (0.171 Å) to better resolve the interface height. As can be seen in the plot, there is a similar flattening in the values of successive data points as seen in the plots of entropy versus fluence. The thickness of the amorphous region appears to be roughly 35 to 45 Å at the higher energies tested, but only about 10 Å at the lowest energy. Furthermore, the three highest energies show similar behavior but are significantly separated from the 100 and 50 eV curves which themselves take on markedly different values. Thus, when considering prior simulations of deuterium bombardment of PFC materials, these simulations indicate that an amorphous target material may not be fully accurate; depending on the energy of the impinging boron, the target may include both amorphous and crystalline features on the length scale considered by prior deuterium bombardment simulations. Furthermore, given the interface threshold height at the final time step, the number density of the amorphous region was computed and is presented in Table 1 alongside the value for the original pristine graphite cell. Despite the differences in bombarding energy, the number densities for each case are quite similar, with the 50 eV value being slightly larger than the rest but still smaller than the pristine graphite value.
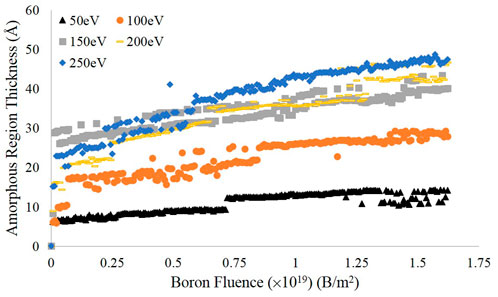
FIGURE 6. Estimates of the amorphous region thickness for each energy tested, calculated using the difference between the surface height estimate and the interface height value determined from deviations in the coordination number.
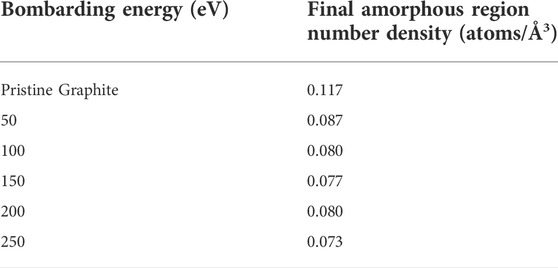
TABLE 1. Number densities of the original graphite block before bombardment and of the final amorphous regions for each energy tested.
3.4 Undercoordination
After computing the total bond orders on the atoms at the final timestep, the atoms with total bond order less than three (the value specified in the parameter file as the valence of carbon) were binned by height. The histograms are presented in Figure 7, where the crystalline-amorphous interface as predicted via coordination number is drawn on the plot. From these plots, it is evident that the bulk of the undercoordinated atoms are within the amorphous region. Thus, the current set of simulations predict that boronization leads to the creation of a reactive surface, that is, more likely to form bonds with impinging atoms such as deuterium. The dependence of amorphization on bombardment energy is made even more critical in the context of deuterium sputtering and retention studies; as amorphization influences surface reactivity, accurately representing the degree of amorphization is important to improving understanding of sputtering dynamics for PFC materials.
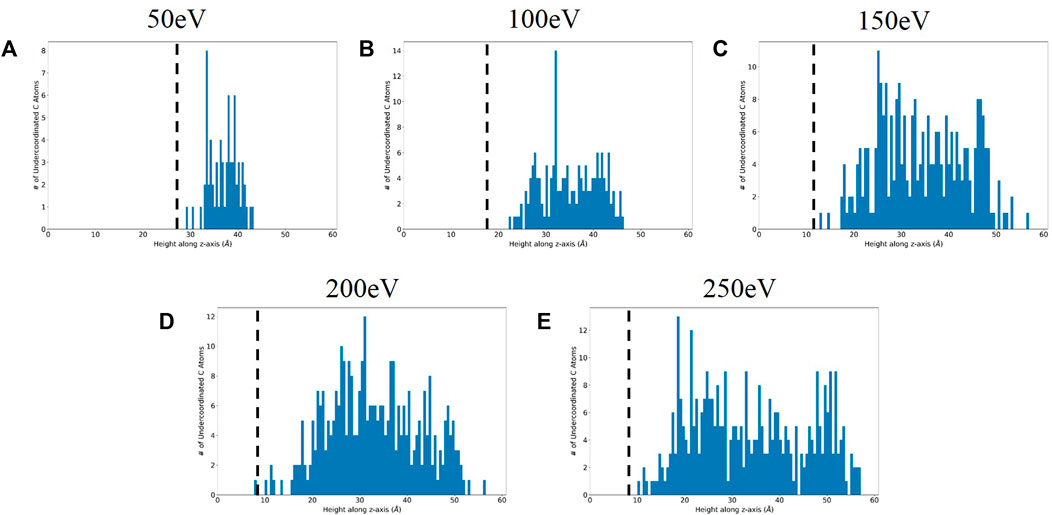
FIGURE 7. Height distribution of undercoordinated carbon atoms for (A) 50 eV, (B) 100 eV, (C) 150 eV, (D) 200 eV, and (E) 250 eV cases with interface threshold from coordination number analysis marked with the dotted black line.
4 Discussion
The objective of this study was to investigate the nature of boron-graphite interactions in the context of amorphization for improving the fidelity of PFC simulations pertinent to fusion devices. This was done through a set of classical molecular dynamics simulations where atomic boron was deposited onto a large graphite crystal at energies ranging from 50 to 250eV. A total of 225 boron atoms were deposited, leading to a final fluence of roughly 1019 B/m2; the resulting structures were analyzed to identify the physical and chemical changes resulting from amorphization via boron.
From these simulations, we find that by considering three different structural metrics—the statistical entropy of the distribution of carbon, amorphous region thickness determined via the coordination number, and the average penetration depth of boron—that each structure experienced a period of rapid change followed by slow increases in all three metrics that appears to evolve consistently with subsequent impacts. The final transient changes in structure were due to steady increasing concentrations of boron in the amorphous region, with the bulk of evolution occurring within the first roughly 50 boron impacts. Furthermore, across each metric considered, an increase in energy corresponded to an increased degree of amorphization, greater amorphous layer thickness, and a greater penetration depth. All cases shared a similar value for the number density in the amorphous region, except the 50 and 250 eV cases which were slightly larger and smaller respectively. However, all amorphous region densities were smaller than the number density of the initial graphite block. For all cases, there was a region of semi-crystalline or crystalline graphite underneath the amorphous layer, thus indicating that the randomized structures considered in previous works on the subject of boronization do not fully capture the structural complexity of boronized carbon as predicted by MD simulation. Furthermore, by considering the bond order predicted by ReaxFF, the amorphous region was found to contain undercoordinated atoms while the crystalline region had none, thus the amorphous region is predicted to contain more dangling bonds and have a greater propensity to capture impinging species such as deuterium. In the context of fusion devices, the relationship between the amorphous region and impacting energy is thus important for accurately modeling the surfaces that deuterium atoms bombard.
With this study in mind, future work on expanding the range of elements considered in this simulation may be useful; as PFC graphite contains elements such as oxygen and hydrogen, their resulting effect on retention chemistry at large length/time scales warrants investigation. Other defects such as vacancies may be of interest due to the ability to create dangling bonds, thus increasing the reactivity of the surface. With recent efforts in developing liquid lithium and tungsten PFCs (such as the wall materials projected for use in ITER), the simulation framework developed in this study can provide a starting point for understanding bombardment processes in those systems. Furthermore, plasma deposition of boron has been used to create hard coatings for metals, thus the current work has potential for improving understanding of surface modification with boron even beyond fusion device development [29–31].
5 Conclusion
MD simulations were performed to observe the amorphization of graphite by successive boron impacts at energies ranging from 50 to 250 eV. By computing the Shannon entropy of the carbon atom distribution, we found that the structures all underwent a rapid period of layer destruction and swelling, followed by a slow increase in swelling and disorder related to continual insertion of boron atoms within the amorphous boron/carbon region. We found that penetration depth and the amorphous region thickness increase with energy, but that both quantities show decreasing growth rates at higher boron fluences. Furthermore, the amorphous surface generated was shown to be more reactive than the underlying graphite by applying the ReaxFF formalism to quantify the undercoordination of the atoms. These findings show that future simulations of PFC sputtering and retention may need to include both crystalline and amorphous regions to accurately capture structural and chemical interactions.
Data availability statement
The raw data supporting the conclusions of this article will be made available by the authors, without undue reservation.
Author contributions
All authors contributed to the conception of this study. AR ran the classical molecular dynamics calculations, wrote the MATLAB scripts to process penetration depth and coordination number data, and wrote the first draft full draft of the manuscript. SJ provided insight on molecular dynamics calculations and wrote the Python script to calculate undercoordination. JRV suggested the use of coordination number as an order parameter and significantly assisted with revisions of the Introduction and Methods sections of the manuscript. IDK managed the group and coordinated the research effort. All authors contributed to manuscript revision and approved the submitted version.
Funding
This research was supported by the U.S. Department of Energy Office (DOE) of Fusion Energy Science at Princeton Plasma Physics Laboratory (PPPL) under Contract No. DE-AC02-09CH11466. AR work was made possible by funding from the DOE for the Summer Undergraduate Laboratory Internship (SULI) program. This research used computing resources on the PPPL cluster and the National Energy Research Scientific Computing Center (NERSC), a U.S. Department of Energy Office of Science User Facility located at Lawrence Berkeley National Laboratory, operated under Contract No. DE-AC02-05CH11231.
Acknowledgments
This research used resources of the National Energy Research Scientific Computing Center (NERSC), a U.S. Department of Energy Office of Science User Facility located at Lawrence Berkeley National Laboratory, operated under Contract No. DE-AC02-05CH11231. The research described in this paper was conducted under the Laboratory Directed Research and Development (LDRD) Program at Princeton Plasma Physics Laboratory, a national laboratory operated by Princeton University for the U.S. Department of Energy under Prime Contract No. DE-AC02-09CH11466. In addition, this research used computing resources on the PPPL cluster.
Conflict of interest
The authors declare that the research was conducted in the absence of any commercial or financial relationships that could be construed as a potential conflict of interest.
Publisher’s note
All claims expressed in this article are solely those of the authors and do not necessarily represent those of their affiliated organizations, or those of the publisher, the editors and the reviewers. Any product that may be evaluated in this article, or claim that may be made by its manufacturer, is not guaranteed or endorsed by the publisher.
Supplementary material
The Supplementary Material for this article can be found online at: https://www.frontiersin.org/articles/10.3389/fphy.2022.933494/full#supplementary-material
References
1. Krstic PS, Allain JP, Dominguez-Gutierrez FJ, Bedoya F. Unraveling the surface chemistry processes in lithiated and boronized plasma material interfaces under extreme conditions. Matter Radiat Extremes (2018) 3:165–87. doi:10.1016/j.mre.2018.03.003
2. Dominguez-Gutierrez FJ, Bedoya F, Krstic PS, Allain JP, Neff AL, Luitjohan K, et al. Studies of lithiumization and boronization of ATJ graphite PFCs in NSTX-U. Nucl Mater Energ (2017) 12:334–40. doi:10.1016/j.nme.2016.12.028
3. Bedoya F. Plasma facing components conditioning techniques and their correlation with plasma performance in the national spherical Torus experiment upgrade (NSTX-U). [Doctoral Dissertation]. Urbana-Champaign, IL: University of Illinois at Urbana-Champaign, Illinois Digital Environment for Access to Learning and Scholarship (2017). Available at: http://hdl.handle.net/2142/99444 (Accessed July 24, 2020).
4. Bortolon A, Maingi R, Nagy A, Ren J, Duran JD, Maan A, et al. Observations of wall conditioning by means of boron powder injection in DIII-D H-mode plasmas. Nucl Fusion (2020) 60:126010. doi:10.1088/1741-4326/abaf31
5. Effenberg F, Bortolon A, Frerichs H, Grierson B, Lore JD, Abrams T, et al. 3D modeling of boron transport in DIII-D L-mode wall conditioning experiments. Nucl Mater Energ (2021) 26:100900. doi:10.1016/j.nme.2021.100900
6. Dominguez-Gutierrez FJ, Krstic PS, Allain JP, Bedoya F, Islam MM, Lotfi R, et al. Deuterium uptake and sputtering of simultaneous lithiated, boronized, and oxidized carbon surfaces irradiated by low-energy deuterium. J Appl Phys (2018) 123:195901. doi:10.1063/1.5026415
7. Dominguez-Gutierrez FJ, Krstic PS. Chemical sputtering of boronized and oxidized carbon surfaces irradiated by low-energy deuterium atoms. J Appl Phys (2017) 121:215302. doi:10.1063/1.4984756
8. Bedoya F, Allain JP, Dominguez-Gutierrez FJ, Krstic PS. Effect of deuterium irradiation on graphite boronized in the NSTX-U tokamak. Sci Rep (2019) 9:2435. doi:10.1038/s41598-019-38941-9
9. Dominguez-Gutierrez FJ, Krstic PS, Irle S, Cabrera-Trujillo R. Low-energy hydrogen uptake by small-cage Cn and Cn-1B fullerenes. Carbon (2018) 134:189–98. doi:10.1016/j.carbon.2018.03.085
10. Fallet M. Bombardment of graphite and amorphous carbon surfaces using molecular dynamics simulations: Toward A more realistic experimental model. All Dissertations (2013) 1079:1.
11. Ismagilov ZR, Popova AN, Sozinov SA. Study of coke by X-ray structural analysis and scanning electron microscopy. J Phys Conf Ser Bristol (2021) 1749(1):012014. doi:10.1088/1742-6596/1749/1/012014
12. Buzhinskij OI, Semenets YM. Review of in situ boronization in contemporary tokamaks. Fusion Technology (1997) 32(1):1–13. doi:10.13182/fst97-a19875
13. van Duin ACT, Dasgupta S, Lorant F, Goddard WA. ReaxFF: A reactive force field for hydrocarbons. J Phys Chem A (2001) 105:9396–409. doi:10.1021/jp004368u
14. Islam M, Bryantsev VS, van Duin ACT. ReaxFF reactive force field simulations on the influence of teflon on electrolyte decomposition during Li/SWCNT anode discharge in lithium-sulfur batteries. J Electrochem Soc (2014) 161:E3009–14. doi:10.1149/2.005408jes
15. Pai SJ, Yeo BC, Han SS. Development of the ReaxFFCBN reactive force field for the improved design of liquid CBN hydrogen storage materials. Phys Chem Chem Phys (2016) 18(3):1818–27. doi:10.1039/c5cp05486a
16. An Q, Goddard WA. Atomistic origin of brittle failure of boron carbide from large-scale reactive dynamics simulations: Suggestions toward improved ductility. Phys Rev Lett (2015) 115(10):105501. doi:10.1103/physrevlett.115.105501
17. Senftle TP, Hong S, Islam M, Kylasa SB, Zheng Y, K Shin Y, et al. The ReaxFF reactive force-field: Development, applications and future directions. Npj Comput Mater (2016) 2:15011. doi:10.1038/npjcompumats.2015.11
18. Mortier WJ, Ghosh SK, Shankar S. Electronegativity-equalization method for the calculation of atomic charges in molecules. J Am Chem Soc (1986) 108(15):4315–20. doi:10.1021/ja00275a013
19. Zhang H, Shi L, Ma X, Yang L, Zhong Y, He X, et al. Impact resistance of boron carbide ceramics from hypersonic and supersonic impacts: A large-scaled molecular dynamics simulation study. J Appl Phys (2022) 131:135105. doi:10.1063/5.0080252
20. Plimpton S. Fast Parallel algorithms for short-range molecular dynamics. J Comput Phys (1995) 117:1–19. doi:10.1006/jcph.1995.1039
21. Aktulga HM, Fogarty JC, Pandit SA, Grama AY. Parallel reactive molecular dynamics: Numerical methods and algorithmic techniques. Parallel Comput (2012) 38:245–59. doi:10.1016/j.parco.2011.08.005
22. Schneider T, Stoll E. Molecular-dynamics study of a three-dimensional one-component model for distortive phase transitions. Phys Rev B (1978) 17:1302–22. doi:10.1103/physrevb.17.1302
23. Brault P, Chuon S, Bauchire JM. Molecular dynamics simulations of platinum plasma sputtering: A comparative case study. Front Phys (2016) 4(20):1. doi:10.3389/fphy.2016.00020
24. Humbird D, Graves DB, Stevens AAE, M Kessels WM. Molecular dynamics simulations of Ar + bombardment of Si with comparison to experiment. J Vacuum Sci Technology A: Vacuum Surf Films (2007) 25:1529–33. doi:10.1116/1.2787713
25. Shannon CE. A mathematical theory of communication. Bell Syst Tech J (1948) 27(4):623–56. doi:10.1002/j.1538-7305.1948.tb00917.x
26. Stukowski A. Visualization and analysis of atomistic simulation data with OVITO- the Open Visualization Tool. Model Simul Mat Sci Eng (2010) 18:015012. doi:10.1088/0965-0393/18/1/015012
27. Tersoff J. Modeling solid-state chemistry: Interatomic potentials for multi-component systems. Phys Rev B (1989) 39(5):5566–8. doi:10.1103/physrevb.39.5566
28. Timonova M, Thijsse BJ. Molecular Dynamics simulations of the formation and crystallization of amorphous Si. Comput Mater Sci (2011) 50(8):2380–90. doi:10.1016/j.commatsci.2011.03.016
29. Ballinger J, Catledge SA. Metal-boride interlayers for chemical vapor deposited nanostructured NSD films on 316 and 440C stainless steel. Surf Coat Technology (2015) 261:244–52. doi:10.1016/j.surfcoat.2014.11.022
30. Johnston JM, Jubinsky M, Catledge SA. Plasma boriding of a cobalt-chromium alloy as an interlayer for nanostructured diamond growth. Appl Surf Sci (2015) 328:133–9. doi:10.1016/j.apsusc.2014.11.129
Keywords: graphite, boron, bombardment, molecular dynamics, fusion
Citation: Rau A, Jubin S, Vella JR and Kaganovich ID (2022) Simulations of graphite boronization: A molecular dynamics study of amorphization resulting from bombardment. Front. Phys. 10:933494. doi: 10.3389/fphy.2022.933494
Received: 01 May 2022; Accepted: 05 July 2022;
Published: 26 August 2022.
Edited by:
Maria Rutigliano, Institute for Plasma Science and Technology (CNR), ItalyReviewed by:
Umedjon Khalilov, Academy of Sciences Republic of Uzbekistan (UzAS), UzbekistanKejiang Li, University of Science and Technology Beijing, China
Copyright © 2022 Rau, Jubin, Vella and Kaganovich. This is an open-access article distributed under the terms of the Creative Commons Attribution License (CC BY). The use, distribution or reproduction in other forums is permitted, provided the original author(s) and the copyright owner(s) are credited and that the original publication in this journal is cited, in accordance with accepted academic practice. No use, distribution or reproduction is permitted which does not comply with these terms.
*Correspondence: Aaditya Rau, arau5@jhu.edu