The Morphological Analysis of the Collagen Fiber Straightness in the Healthy Uninvolved Human Colon Mucosa Away From the Cancer
 Sanja Z. Despotović
 M. Ćosić
- 1Faculty of Medicine, Institute of Histology and Embryology, The University of Belgrade, Belgrade, Serbia
- 2Laboratory of Physics, Vinča Institute of Nuclear Sciences—National Institute of Thе Republic of Serbia, The University of Belgrade, Belgrade, Serbia
The morphological method—based on the topology and singularity theory and originally developed for the analysis of the scattering experiments—was extended to be applicable for the analysis of biological data. The usefulness of the topological viewpoint was demonstrated by quantification of the changes in collagen fiber straightness in the human colon mucosa (healthy mucosa, colorectal cancer, and uninvolved mucosa far from cancer). This has been done by modeling the distribution of collagen segment angles by the polymorphic beta-distribution. Its shapes were classified according to the number and type of critical points. We found that biologically relevant shapes could be classified as shapes without any preferable orientation (i.e. shapes without local extrema), transitional forms (i.e. forms with one broad local maximum), and highly oriented forms (i.e. forms with two minima at both ends and one very narrow maximum between them). Thus, changes in the fiber organization were linked to the metamorphoses of the beta-distribution forms. The obtained classification was used to define a new, shape-aware/based, measure of the collagen straightness, which revealed a slight and moderate increase of the straightness in mucosa samples taken 20 and 10 cm away from the tumor. The largest increase of collagen straightness was found in samples of cancer tissue. Samples of healthy individuals have a uniform distribution of beta-distribution forms. We found that this distribution has the maximal information entropy. At 20 cm and 10 cm away from cancer, the transition forms redistribute into unoriented and highly oriented forms. Closer to cancer the number of unoriented forms decreases rapidly leaving only highly oriented forms present in the samples of the cancer tissue, whose distribution has minimal information entropy. The polarization of the distribution was followed by a significant increase in the number of quasi-symmetrical forms in samples 20 cm away from cancer which decreases closer to cancer. This work shows that the evolution of the distribution of the beta-distribution forms—an abstract construction of the mind—follows the familiar laws of statistical mechanics. Additionally, the polarization of the beta-distribution forms together with the described change in the number of quasi-symmetrical forms, clearly visible in the parametric space of the beta-distribution and very difficult to notice in the observable space, can be a useful indicator of the early stages in the development of colorectal cancer.
Introduction
Tumors are no longer considered an isolated population of cancer cells. It is now known that cancer cells widely interact with a surrounding environment and that these interactions are numerous and multidirectional. The cancer cells are interacting with a variety of tissue-resident cells, infiltrating host cells, and extracellular matrix proteins, which all together form the tumor microenvironment. These interactions between cancer cells and all components of the tumor microenvironment are influencing every step of tumor development, progression, and tumor response to different therapy modalities [1,2].
Extracellular matrix (ECM) is a dynamic network comprised of fibrous proteins and ground substance components. The most abundant component of ECM is a network made of collagen fibers, especially collagen type I. Both physical and chemical properties of collagen fibers are sensed by cancer cells and host cells from the tumor microenvironment and converted into downstream cellular responses which influence cell polarization, proliferation, migration, secretion, and survival [3,4]. On the other hand, all cells within the tumor microenvironment (including cancer cells), are involved in collagen fibers remodeling. The profound remodeling of collagen fibers (thus, change in synthesis, degradation, and cross-linking) accompanies all stages of tumor progression [5].
Colorectal cancer (CRC) is the third leading cause of cancer death in the world [6]. Like other solid tumors, CRC is a complex heterocellular system, in which mutated epithelial cells are constantly, from the very beginning, interacting with all components of the tumor microenvironment, including collagen fibers. In CRC, the remodeling of collagen fibers, including increased deposition, cross-linking, alignment, and straightness have been described [7]. The remodeling of collagen fibers, resembling that in cancer, has also been described in the uninvolved human colon mucosa, as far as 10 and 20 cm away from the CRC [8,9].
In the previous work, the identification of straight collagen segments was based on curvelet and Fourier transforms [10,11]. Each identified segment is associated with a phasor of unit length whose phase angle is equal to the angle between the corresponding collagen segment and some predetermined axis. The straightness of collagen fibers was expressed as the length of the phasor sum divided by the number of segments [10,11]. In simpler words, straightness is defined as a fraction of collagen segments sharing the same orientation.
Although straightforward to implement, this approach is unsatisfactory because any permutation of phasors will produce the same sum but will correspond to a completely different organization of collagen fibers. To elucidate further mechanisms of collagen remodeling, with potential application in CRC screening in mind, a new shape-aware method of characterization of collagen fibers is needed.
It can be said that the primary task of any experimentalist is to extract useful information out of the shape of the measured signal. In some cases, like in measuring the length or thickness of individual fiber, this task is straightforward and trivial. However, it can be very difficult when one tries to quantify the organization of the collagen fibers that form tissue. One of the main reasons for this is the large variation of the possible forms, that is, characteristic of any biological data. Because of this, scientists are never truly certain whether their hypothesis is merely a consequence of the statistical fluctuations and noise.
The standard approach to overcome this difficulty is to analyze a very large data set, to cover all possible cases. This method was successfully applied on numerous occasions and its validity is guaranteed by the laws of large numbers. However, it is very time-consuming, labor-intensive, and often challenging to implement. Additionally, population sizes of large statistical ensembles in biology and medicine are small compared to the sizes of statistical ensembles used in mathematics and physics, where population sizes of the Monte-Carlo simulations or the number of processed events in the CERN experiments are measured in billions. As a result, the standard approach requires the use of very advanced statistical methods, tailored for moderate sizes of the sample space, which can be also very difficult to implement.
Here we will investigate an alternative approach, inspired by topology and singularity theory. Note that topologists are not focused on one particular object, but on the whole family of objects that can be obtained from the original one by scaling, stretching, twisting, turning, or in general by applying certain kinds of allowed transformations. They group all objects sharing the same topological properties that are invariant on a specified set of transformations, regardless of how pronounced these properties are. In other words, topological classification should be highly immune/resistant to disturbing effects such as noise or statistical fluctuations since the exact shape of the object is not relevant at all.
A similar approach proved its usefulness in the scattering theory where the existence of the rainbow effect forces regular, abrupt metamorphoses (or in this case catastrophic changes [12]) of the angular distribution. The shape analysis was at the core of the newly developed morphological method [13], which was being used for the determination of the proton-graphene interaction potential and characterization of graphene samples [13,14].
It will be shown how to use the morphological method for the classification of collagen fiber samples that allows easy identification of the changes in its organization. Obtained distribution of shapes will be analyzed from the standpoint of the classical information theory. Determined classification will be used to define a shape-aware measure of the straightness of collagen fibers, which will be used to characterize collagen fibers in the healthy colon, CRC, and uninvolved human colon mucosa 10 and 20 cm away from the CRC. Finally, the obtained result will be compared with the results of previous studies. Although our focus is on collagen straightness, the presented model can be simply extended for the analysis of other collagen parameters such are fiber width, porosity, density, alignment, etc.
Theoretical and Experimental Methods
Tissue Samples
Tissue samples were obtained during diagnostic colonoscopy at the Department of gastrointestinal endoscopy, University Hospital Center “Dr. Dragiša Mišović-Dedinje”, Belgrade, Serbia, as previously described [9]. Briefly, tissue samples from the colorectal carcinoma, and tissue samples from healthy-looking colon mucosa 10 and 20 cm away from the carcinoma in the caudal direction, were obtained from 10 patients (Table 1). The diagnosis of colorectal adenocarcinoma was confirmed by an experienced pathologist. For all patients, it was a newly discovered cancer, so they have not received any kind of treatment for the malignant disease before.
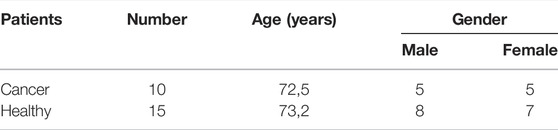
TABLE 1. Demographic characteristics of patients included in the study.
Samples of colon mucosa of 15 healthy patients of the corresponding age and gender (Table 1) were collected during colonoscopy in the same institution. In this group of patients, colonoscopy was indicated because of weight loss, rectal bleeding, or refractory anemia. Only patients in which colonoscopy didn’t show any pathological findings or patients diagnosed with uncomplicated hemorrhoids were included in the study. Patients with inflammatory bowel disease, infections colitis, and diverticular disease of the colon were excluded from the study. Our study was approved by the Ethics Committee of University Hospital Center “Dr. Dragiša Mišović-Dedinje”, Belgrade, Serbia (18/10/2017). All methods were carried out in the accordance with relevant guidelines and regulations.
Second-Harmonic Imaging of Collagen Fibers in Colon Tissue Samples
For the second harmonic imaging of collagen fibers in the label-free colon tissue samples, an original lab frame nonlinear laser-scanning microscopy (NLM) was used as previously described in [9,15,16]. In brief, the tunable mode-locked Ti: sapphire laser (Coherent’s MIRA900) has been the source of the infrared femtosecond pulses. The laser light was directed onto the sample by a short-pass dichroic mirror (having a cut-off wavelength of 700 nm) and collected by the objective lens (Zeiss’s EC Plan-Neofluar 40 × /1.3 NA Oil DIC M27). The laser wavelength was set to 840 nm. The second harmonic generation (SHG) was detected in the back-reflection arm, and recorded by the active-pixel CMOS-sensor camera (Canon, EOS 50D). The narrow bandpass filter at 420 nm (Thorlabs’s FB420-10, FWHM 10 nm) blocks the scattered laser light and autofluorescence and passes only the second harmonic at 420 nm. The average laser power on the sample was 30 mW. The pulse duration (160 fs) and repetition rate (76 MHz) sets the peak laser power to be 2.5 kW.
Manual Segmentation of Collagen Fibers
On each SHG image three regions of interest (ROIs) with size 350 × 350 px were cropped. Each ROI was located near crypts and contained collagen fibers. To characterize the straightness of collagen fibers in ROIs, the following method was developed: On each image, the collagen fibers were identified by a histopathologist. Each fiber was additionally split into smaller segments and the relative frequency of its orientation with respect to the positive
Elements of the Singularity Theory
Let us consider a family of continuous, differentiable functions where each member is a map
where maps
while the degenerate critical points are critical points that additionally satisfy the following equation
here
The singularity theory studies the behavior of the function family in the vicinity of its critical points and classifies members of the function family into structurally stable equivalence classes [12,17]. In simple words, the catastrophe theory lists inequivalent ways how a variation of the system parameters changes the number and type of the family member’s critical points. The critical values of the parameters, for which redistribution occur, partition the parametric space into equivalence classes according to the number of the critical points the corresponding family members have.
If system dynamics force parameters of a certain family member to cross the boundary of its equivalence class and to enter into a subspace of another equivalence class, then that function undergoes the significant transformation that is called the metamorphose, or in V. I. Arnol’d’s term perestroika [17]. Metamorphose is a more general term that includes bifurcations of the degenerate critical points and induction of unrelated isolated singularities.
Elements of the Multivariate Statistics
Let,
The unbiased covariance matrix of the sampled points is a matrix composed of the mean values of the products of marginal deviations of respective data points from its mean values, with Bassel’s correction
The characteristic ellipse of the data point distribution is given by the equation
When the distribution of data is bivariate Normal, the characteristic ellipse encloses 63.21% of the data points. In the general case, the percentage of the enclosed data points can be different. Nevertheless, it represents a convenient measure of the spread of the data points.
The Beta-Distribution
The probability density function of the beta-distribution is given by the following expression [18].
The sample space of the state variable is
From the singularity theory perspective, Eq. 7 defines the corank-one, codimension-two function family with the state variable
In other words, critical points of curve
The partial derivative of the function
Members of the family can have none, one, two, or three critical points. The two out of three possible critical points are the boundary points
shows that only boundary points
Results
When excited by a strong external electric field, the second harmonic generation happens only in materials for which a microscopic polarization field, generated by the local response of the material’s microscopic constituents called harmonophores, averaged over all their positions and orientations produces anisotropic macroscopic polarization. In the case of collagen, the second-harmonic response originates in slight charge asymmetry between C=O and N-H groups, acting as a slight electron donor and acceptor, respectively, that favors oscillations of delocalized bond electrons along the collagen’s backbone [20,21]. Since second harmonic generation happens coherently, an additional amplification of the effect occurs when all harmonophores are mutually aligned, as is the case for the harmonophores embedded in the rigid and compact collagen triple helix [19,21].
Figure 1 shows second-harmonic generation images of a human colon sample of a healthy mucosa (Figure 1A), colon mucosa taken 10 cm away from cancer (Figure 1B), and colon cancer sample (Figure 1C). In all examined cases, the distribution of the light intensity is dominantly determined by the density of collagen harmonophores coherently excited by the incoming laser beam. All other sources of second-harmonic interfere destructively, producing small randomly fluctuating components of the measured light intensity. Thus, regions of the high intensity show a projection of the collagen network, located in the volume excited by the laser light, onto the image plane. As we have previously described [9] in the healthy colon mucosa collagen fibers are wavy, thin, and spreading in all directions throughout the lamina propria, around the crypts (Figure 1A). In the cancer tissue (Figure 1C) collagen fibers are thick and straight. The colon tissue samples 10 cm away from the cancer are somewhere in between, they contain regions resembling a healthy colon, but focally, straight, well-aligned collagen fiber could be observed (Figure 1B).
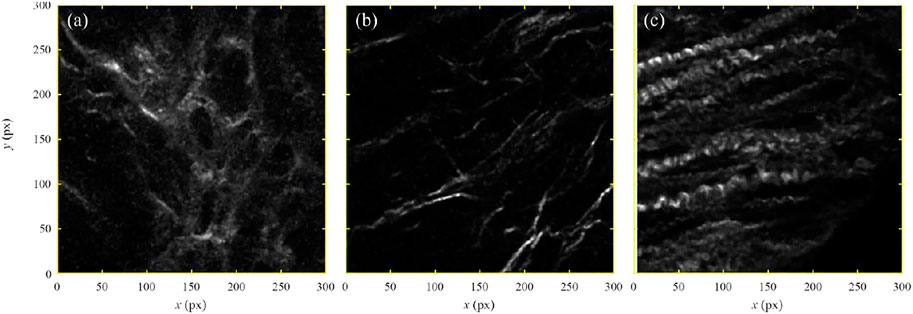
FIGURE 1. (color online) The enlarged views of the recorded intensity distribution of second-harmonic light of (A) a healthy control sample (code name K54S 5–1); (B) a sample taken 10 cm away from cancer (code name J10cm 4–2); (C) sample of cancer tissue (code name JTU 2–2).
Each recorded image was inspected and collagen fibers were identified by an eye of the experienced histopathologist (Z. Despotović) using judgment, training, and experience. An example of the application of the already described manual segmentation procedure will be shown in the case of the image shown in Figure 1B.
Figure 2A shows the selected ROI selected in the second harmonic image of the colon mucosa sample taken 10 cm away from cancer (code name J10cm 4–2). The regions of high intensity (sufficiently above the random threshold) were only examined and the ridge-like maxima were identified. When there is no overlap between ridges, their route can be identified with the projection of the individual collagen fiber. In the case of the overlap between ridge-maxima, such identification is not unique because of multiple possibilities to connect collagen segments. To resolve the described ambiguity, the principle of the minimal curvature was established which states that correct linkage produces collagen fibers of minimal curvature.
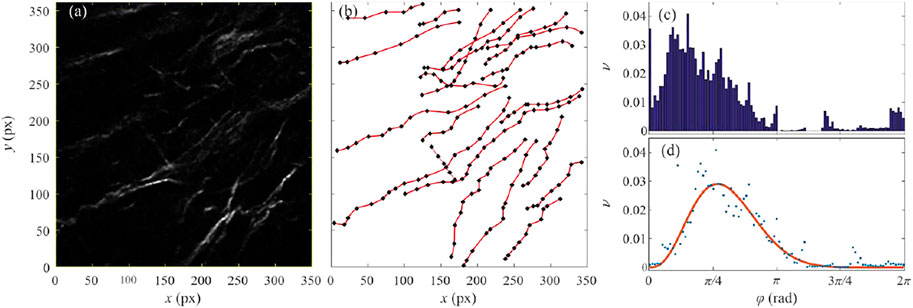
FIGURE 2. (color online) (A) An image of the human colon mucosa 10 cm away from the tumor, code name J10cm 4-2, recorded by the non-linear second harmonic microscopy. (B) Black squares show the characteristic points of the identified collagen fibers. Red lines represent the cubic-spline fit of the characteristic points. (C) A relative frequency of the angles between a small segment of the collagen fiber and
On the backbone of each identified fiber, several control points were selected sufficient for fitting the fiber by a cubic-spline plane curve. Obtained collection of the control points and associated family of plane curves are shown in Figure 2B by the black squares and red lines, respectively. In the next step, each collagen fiber was subdivided into a large number of small segments of equal length and the relative frequency of angle
The resulting distribution is shown in Figure 2C. Note that the reference direction for measuring angles was chosen arbitrarily. Any other choice of the reference direction, that is for example at an angle of
Applying the same procedure to all samples of the collagen fibers gives the distribution of the beta-distribution parameters shown in Figure 3. For better clarity, parameters of the beta-distribution are given in the logarithmic scale. Obtained data points occupy the rectangle in the parametric space whose lower left vertex is the coordinate origin, while its upper right vertex is the point
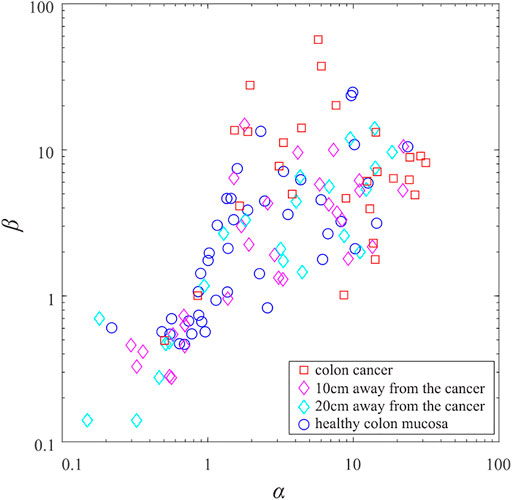
FIGURE 3. (color online) The scatter plot of beta-distribution parameters. The blue circles correspond to the collagen fibers from the samples of the healthy colon mucosa. The cyan and magenta diamonds correspond to the samples taken 20 and 10 cm from the colorectal adenocarcinoma. The red squares correspond to the collagen fibers from the samples of colorectal cancer tissue.
Discussion
The Shape Analysis
The straightforward approach for quantification of the fiber straightness would be to use the standard deviation
Therefore, we have devised an alternative strategy that takes into account the shape of the beta-distribution. We have performed a detailed inspection of the beta-distribution parametric space to try to classify the corresponding members of the function family given in Eq. 7 according to the number and type of critical points. Figure 4 shows obtained partition of the relevant parametric subspace into desired equivalence classes. Note that beta-distribution is invariant to the simultaneous substitution
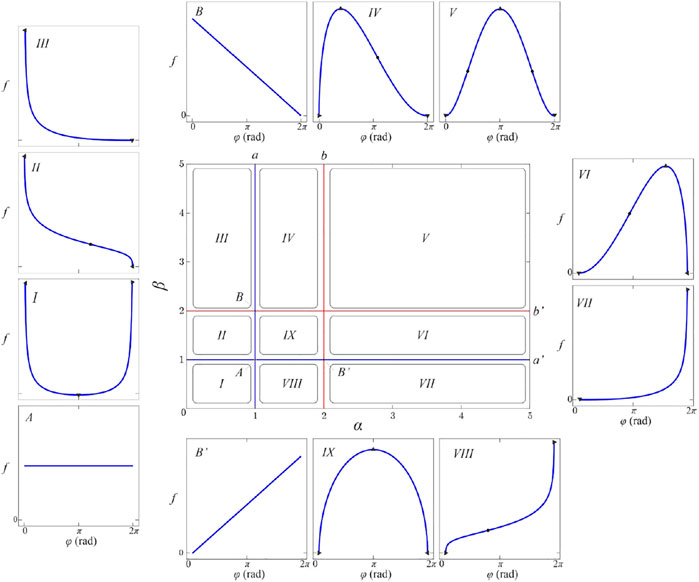
FIGURE 4. (color online) The shape diagram of the beta-distribution. Insets labeled by Roman numerals I-IX show the shape of the beta-distribution for parameters from the corresponding subspaces labeled by the same symbol. The characteristic lines
Equation 10 shows that for
Blue lines, labeled as
These four semi-lines divide parametric space into nine rectangular areas labeled
Note that even infinitesimal changes of parameters
It should be said that singularities of the beta-distribution do not have biological relevance. They are mathematical artifacts of the beta-distribution introduced by our desire for the simplest normalizable polymorphic function family. Singular peaks do not exist in any finite segmentation of fibers, nor in our data. When inspected closely almost all samples whose parameters belong to regions
where
that is a transcendental equation without closed-form solutions. However, for small
Therefore, for distribution parameters farther from the coordinate origin, the maximum of the distribution becomes narrower.
Note that the parameter
Parameter
Now we will perform the analysis of shapes for the family of beta-distributions shown in Figure 3. To analyze only different shapes all data points that are located below the symmetry line
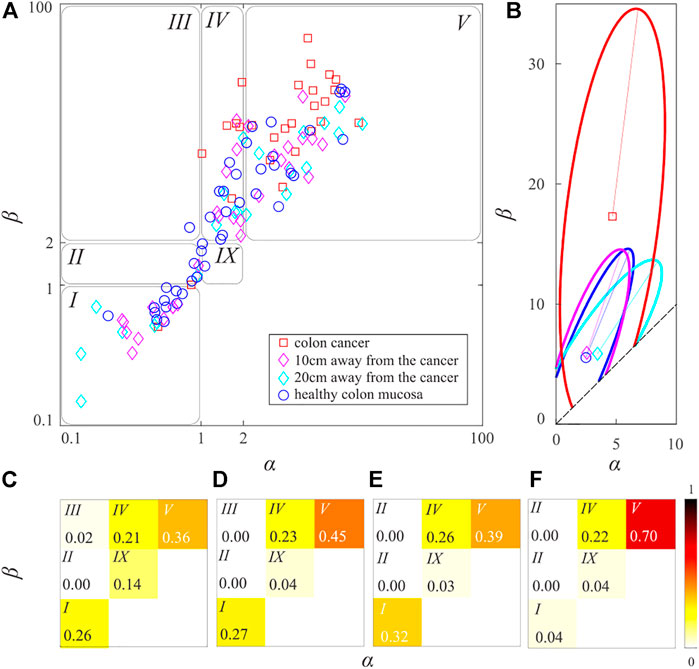
FIGURE 5. (color online) (A) The scatter-plot of the irreducible beta-distribution parameters. (B) The characteristic ellipses of the healthy samples, samples were taken 20 and 10 cm from the cancer tissue, and samples of cancer tissue are shown by blue, cyan, magenta, and red lines, respectively. Parts of the curves outside the irreducible sample space were ignored. The shape distribution of (C) the healthy samples, (D) and (E) samples taken 20 and 10 cm far from the cancer tissue, and (F) samples of the cancer tissues. The relative frequency of the forms is shown by the different tones of the red color, according to the show colorbar.
Centers of the distributions of the blue, cyan, magenta, and red data points are points
Note that the typical straightness of the cyan data points (mucosa 20 cm away from the CRC) is only 0.16% larger than the typical straightness of the blue data points (healthy mucosa). The typical straightness of the magenta data points (mucosa 10 cm away from the CRC) is larger by 2.80% than the corresponding typical straightness of the healthy colon mucosa, whereas the typical straightness of the red data points (the CRC mucosa) is larger by 31.71%. Examination of their typical representatives implies that the distribution of cyan data points is more similar to the distribution of blue data points, whereas the distribution of magenta data points is more similar to the distribution of red data points. These findings are again in good agreement with previous findings [8,9].
Now we shall compare the sensitivity of the newly introduced procedure for measuring collagen straightness with the standard approach implemented in the software CT-FIRE used in the previous study [9]. Sensitivity of measurement quantifies the ability of the measuring apparatus, or measuring procedure, to amplify the detected signal and produce larger output. In technical terms, sensitivity is defined as a ratio of the output of the measuring apparatus and the corresponding measured input [22]. The direct application of the definition is impossible in this case since the input to both procedures are images of the collagen samples and outputs are numbers obtained by computation. Moreover, the new procedure determines the FWHM of the beta-distribution peak, while the standard measure gives a fraction of fiber segments sharing the common orientation.
However, if the straightness of the healthy samples is taken as a reference point it is possible to compare the relative sensitivities of both procedures since considered collagen samples 10 and 20 cm away from CRC, and healthy controls are the same as in [9]. The procedure which produces a larger relative change in the output has greater sensitivity. To have the test of maximal fairness we shall compare the relative sensitivity of the parameter
In the case of the samples of colon mucosa 20 cm away from CRC relative variation of the
Whenever dealing with average values it is necessary to establish how typical these values are. To do so, we have used mean values
and plotted corresponding blue, cyan, magenta, and red characteristic ellipses in Figure 5B. Note that in the definition of the characteristic ellipse it is assumed that sample space is an entire plane. In our case, the irreducible space of the semi-infinite and is bounded by the conditions
Interestingly blue, cyan, and magenta ellipses have approximately the same area, while the red ellipse is considerably larger. It has been found that the blue ellipse contains 83.33% of blue data points, the cyan and magenta ellipses contain 72.73% and 90.62% of their respective data points, while the red ellipse encloses 74.07% of the red data points. Therefore, averages
All ellipses cover regions
Collagen fibers are the most abundant component of extracellular matrix. Their biochemical and biomechanical properties influence all crucial processes in the tissues (morphogenesis, angiogenesis, cell’s migration, proliferation, differentiation, and polarization) both in the health and disease [23].
It has been shown that cancer can induce changes in both biochemical and biomechanical properties of collagen fibers by different mechanisms: changes in production in enzymes which cross-link collagen fibers, like LOX, changes in synthesis and degradation of collagen fibers (via changes in number and activity of fibroblasts, myofibroblasts, and enzymes responsible from degradation of collagen fibers-matrix metalloproteinases) and by inducing biomechanical changes in the tumor microenvironment [7,9,23,24]. On the other hand, all cells, both cancer cells and host cells from the tumor microenvironment can sense these changes in collagen fibers and respond to them. It has been shown in many types of cancer that changes in collagen synthesis and degradation and collagen fibers remodeling, create a specific tumor microenvironment that promote tumor progression by influencing cell polarity, cell adhesions, and cell migration. In cancer, so-called “linearization” of collagen fibers has been described as an important parameter, with a significant impact of on tumor cell behavior-migration, proliferation and cell differentiation, and thus the ability of tumor cells to locally spread and form distant metastasis [23].
We have shown increase in straightness (increase in strongly oriented forms) in the cancer tissue, but, we have also shown increase in oriented forms in the healthy-looking tissue, far from the cancer. There are at least two explanations why we could expect changes this far from the cancer-systemic effects of tumor and filed carcinogenesis effect. It is known and believed that from the very early stages, tumor cells secrete growth factors, chemokines and cytokines which not only induce changes in the local environment, but acts on distant tissues, so from the very beginning tumors should be considered as a systemic disease [25]. On the other hand, according to field carcinogenesis theory, carcinogens act on the entire length of organ inducing a large altered field-filed of injury, and on this altered filed additional stochastic events could give rise to cancers [26]. Whatever the mechanism behind this changes in collagen fibers straightness is, we wanted a mathematical method that could detect and describe them, not only in cancer tissue, but also far from the cancer. The ability to detect them will be a good starting point in future studies to further characterize changes in collagen fibers, and investigate all the causes and consequences of these changes.
Observed behavior has also a simple interpretation in the terms of classical information theory and statistical mechanics where equal distribution of micro-states is associated with a long-lasting stable state, also known as thermodynamics equilibrium [27–29]. This state is special since for it the information entropy, defined by the weighted sum over the micro-states probabilities
is maximal [27–29]. Therefore, it is no surprise that equal distribution of forms corresponding to the blue data appoints is associated with the state of health, and has maximal detected information entropy
Conclusion
Increased straightness of collagen fibers has been detected in many cancers, including CRC [30–32]. It is believed that cancer cells use these linearized collagen fibers as “highways” for migration towards blood and lymphatic vessels [30,31,33].
To enhance our understanding of these processes we have modified the morphological method from condensed matter physics to be applicable for modeling biological data. To prove the usefulness of this topological viewpoint we have analyzed changes in the straightness of collagen fibers in the colon mucosa caused by the presence of the CRC. This was achieved by modeling the experimentally observed distribution of the collagen segment angles (in healthy colon mucosa, in mucosas taken 10 and 20 cm away from the CRC, and mucosa samples from CRC itself) by the polymorphic beta-distribution depending on two parameters. The parametric space of the beta-distribution was partitioned into subspaces according to the number and type of critical points of the beta-distribution. Each transition between subspaces, called metamorphoses, is abrupt and happens for the infinitesimal change of the critical values of parameters. Therefore, changes in the organization of the collagen fibers and their biological function were linked to the metamorphoses of the beta-distribution shapes. It should be stressed that described correspondence is a general feature of all topological models and it is by no means confined to modeling collagen orientation alone.
To give a biological interpretation of obtained mathematical classification, we have grouped the inequivalent shapes of the beta-distribution into three groups. The first group is formed by shapes without the local maximum, therefore without preferable orientation. The second group is formed by shapes with one less pronounced local maximum and at least one vertical critical point, called the transitional forms. The third group is formed by forms with pronounced local maximum and two inflection points that possess clear preferable orientation.
It has been found that samples of healthy colon mucosa contain an approximately equal amount of unoriented, transitional, and oriented forms of collagen fibers. Observed equal abundance of shapes is in perfect analogy with uniform distribution of microstates of the complex physical system necessary for the establishment of the thermodynamics equilibrium also known as a state of maximal entropy. In samples taken 10 and 20 cm away from CRC, the equilibrium distribution of forms is disturbed by the redistribution of less pronounced transitional forms increasing the fraction of unoriented and highly oriented forms. In the case of the mucosa samples taken from CRC, the distribution of forms is dominated by strongly oriented forms, corresponding to the thermodynamical state of low entropy, far from the equilibrium. We have also noticed the increase in the number of quasi-symmetrical forms in samples 10 cm away from CRC, while its number decreases steadily closer to CRC.
Our findings suggest that the abstract distribution of beta-distribution shapes follows the fundamental law of statistical mechanics, requiring that establishment of the long-lasting equilibrium is inextricably linked to the maximization of entropy. The described polarization of the distribution of beta-distribution forms, together with the evolution of the number of quasi-symmetrical forms can be an indicator of the early stage of CRC development.
We have introduced the shape-aware measure of collagen fiber straightness. The average straightness was measured by the FWHM of the pronounced maximum
In the previous work [9] we have used CT-FIRE, an open-source software package [10,11,34] for automatic extraction and analysis of collagen fibers. We have shown a statistically significant increase in collagen fiber straightness in the colon mucosa 10 and 20 cm away from cancer in comparison with collagen fibers in healthy mucosa. Using a novel approach, we have confirmed all findings of the previous study [9]. This study goes one step further by providing explicit criteria for detecting the changes in collagen fiber organization by the shape analysis of the corresponding beta distribution.
It should be said that the presented method is not ideal. Far from CRC relative sensitivity of the newly introduced straightness parameter
There could be two possible explanations for this behavior. Our main goal was to show that the morphological method could be applied to a different type of biological data, so that the number of considered samples was relatively small. However, we are quite confident that analysis of the larger sample space will confirm all stated conclusions and improve the sensitivity and linearity of the proposed method. Another weakness was the manual segmentation of collagen fibers because it is time-consuming and subjective. It was done by an experienced histopathologist, but only collagen fibers clearly visible and possible to follow on the examined images were analyzed. So, some fibers from the image were omitted.
In future work, we would like to improve and automatize collagen fibers segmentation and extend the sample size and number of analyzed parameters.
Data Availability Statement
The original contributions presented in the study are included in the article/Supplementary Material, further inquiries can be directed to the corresponding author.
Ethics Statement
The studies involving human participants were reviewed and approved by Ethics Committee of University Hospital Center “Dr. Dragiša Mišović-Dedinje”, Belgrade, Serbia (18/10/2017). The patients/participants provided their written informed consent to participate in this study.
Author Contributions
SD and MC contributed to conception and design of the study. SD collected the samples. MC performed the mathematical analysis. SD and MC wrote the manuscript. SD and MC contributed to manuscript revision, read, and approved the submitted version”.
Funding
The research was funded by the Ministry of Education, Science, and Technological Development of the Republic of Serbia.
Conflict of Interest
The authors declare that the research was conducted in the absence of any commercial or financial relationships that could be construed as a potential conflict of interest.
Publisher’s Note
All claims expressed in this article are solely those of the authors and do not necessarily represent those of their affiliated organizations, or those of the publisher, the editors and the reviewers. Any product that may be evaluated in this article, or claim that may be made by its manufacturer, is not guaranteed or endorsed by the publisher.
References
1. Brassart-Pasco S, Brézillon S, Brassart B, Ramont L, Oudart J-B, Monboisse JC. Tumor Microenvironment: Extracellular Matrix Alterations Influence Tumor Progression. Front Oncol (2020) 10:397. doi:10.3389/fonc.2020.00397
2. Ming-Zhu J, Wei-Lin J. The Updated Landscape of Tumor Microenvironment and Drug Repurposing. Sig Transuct Target Ther (2020) 5:166.
3. Hynes RO. The Extracellular Matrix: Not Just Pretty Fibrils. Science (2009) 326:1216–9. doi:10.1126/science.1176009
4. Pickup MW, Mouw JK, Weaver VM. The Extracellular Matrix Modulates the Hallmarks of Cancer. EMBO Rep (2014) 15(12):1243–53. doi:10.15252/embr.201439246
5. Xu S, Xu H, Wang W, Li S, Li H, Li T, et al. The Role of Collagen in Cancer: from Bench to Bedside. J Transl Med (2019) 17:309. doi:10.1186/s12967-019-2058-1
6. Rawla P, Sunkara T, Barsouk A. Epidemiology of Colorectal Cancer: Incidence, Mortality, Survival, and Risk Factors. pg (2019) 14(2):89–103. doi:10.5114/pg.2018.81072
7. Le CC, Bennasroune A, Langlois B, Salesse S, Boulagnon-Rombi C, Morjani H, et al. Functional Interplay between Collagen Network and Cell Behavior within Tumor Microenvironment in Colorectal Cancer. Front Oncol (2020) 10:527. doi:10.3389/fonc.2020.00527
8. Despotović SZ, Milićević NM, Milošević DP, Despotović N, Predrag E, Petar S, et al. Remodeling of Extracellular Matrix if the Lamina Propria in the Uninvolved Human Rectal Mucosa 10 Cm and 20 Cm Away from the Malignant Tumor. Tumour Biol (2017) 39:1010428317711654. doi:10.1177/1010428317711654
9. Despotović SZ, Milićević ĐN, Krmpot AJ, Pavlović AM, Živanović VD, Krivokapić Z, et al. Altered Organization of Collagen Fibers in the Uninvolved Human colon Mucosa 10 Cm and 20 Cm Away from the Malignant Tumor. Sci Rep (2020) 10:6359. doi:10.1038/s41598-020-63368-y
10. Liu Y, Keikhosravi A, Mehta GS, Drifka CR, Eliceiri KW. Methods for Quantifying Fibrillar Collagen Alignment. Methods Mol Biol (2017) 1627:429–51. in L. Rittié (ed) Fibrosis(Humana Press, New York). doi:10.1007/978-1-4939-7113-8_28
11. Bredfeldt JS, Liu Y, Conklin MW, Keely PJ, Mackie TR, Eliceiri KW. Automated Quantification of Aligned Collagen for Human Breast Carcinoma Prognosis. J Pathol Inform (2014) 5:28. doi:10.4103/2153-3539.139707
13. Ćosić M, Hadžijojić M, Petrović S, Rymzhanov R. Morphological Study of the Rainbow Scattering of Protons by Graphene. Chaos (2021) 31:093115. doi:10.1063/5.0059093
14. Hadžijojić M, Ćosić M, Rymzhanov R. Morphological Analysis of the Rainbow Patterns Created by Point Defects of Graphene. J Phys Chem C (2021) 125(38):21030. doi:10.1021/acs.jpcc.1c05971
15. Rabasović MD, Pantelić DV, Jelenković BM, Ćurčić SB, Rabasović MS, Vrbica MD, et al. Nonlinear Microscopy of Chitin and Chitinous Structures: a Case Study of Two Cave-Dwelling Insects. J Biomed Opt (2015) 20(1):016010.
16. Bukara K, Jovanic S, Drvenica IT, Stancic A, Ilic V, Rabasovic MD, et al. Mapping of Hemoglobin in Erythrocytes and Erythrocyte Ghosts Using Two Photon Excitation Fluorescence Microscopy. J Biomed Opt (2017) 22:26003. doi:10.1117/1.JBO.22.2.026003
19. Abramowitz M, Stegun edt IA. Handbook of Mathematical Functions, with Formulas, Graphs, and Mathematical Tables. Washington, DC: National Bureau of Standards (1964).
20. Chen X, Nadiarynkh O, Plotnikov S, Campagnola PJ. Second Harmonic Generation Microscopy for Quantitative Analysis of Collagen Fibrillar Structure. Nat Protoc (2012) 7(4):654–69. doi:10.1038/nprot.2012.009
21. Marie-Claire , Schanne-Klein . SHG Imaging of Collagen and Application to Fibrosis Quantization. In: Pavone FS,, and Capagnola PJ, editors. Second Harmonic Generation Imaging. Boca Raton: Taylor & Francis (2014).
22. Usher MJ, Keating DA. Sensors and Transducers: Characteristics, Applications, Instrumentation, Interfacing. London: Macmillan Press LTD (1996).
23. Fang M, Yuan J, Peng C, Li Y. Collagen as a Double-Edged Sword in Tumor Progression. Tumor Biol (2014) 35:2871–82. doi:10.1007/s13277-013-1511-7
24. Sheieh AC. Biomechanical Forces Shape the Tumor Microenvironment. Ann Biomed Eng (2011) 39:1379–89. doi:10.1007/s10439-011-0252-2
25. McAllister SS, Weinberg RA. The Tumour-Induced Systemic Environment as a Critical Regulator of Cancer Progression and Metastasis. Nat Cel Biol (2014) 16:717–27. doi:10.1038/ncb3015
26. Backman V, Roy HK. Advances in Biophotonics Detection of Field Carcinogenesis for Colon Cancer Risk Stratification. J Cancer (2013) 4:251–61. doi:10.7150/jca.5838
28. Jaynes ET. Information Theory and Statistical Mechanics. Phys Rev B (1957) 106:4. doi:10.1103/physrev.106.620
29. Landau LD, Lifshitz EM. Course of Theoretical Physics: Statistical Physics, 5. Oxford: Pergamon Press (1980).
30. Ouallette JN, Drifka CR, Pointer KB, Liu Y, Tyler JL, Kao WJ, et al. Navigation the Collagen Jungle: The Biomedical Potential of Fiber Organization in Cancer. Bioengineering (Basel) (2021) 8:17. doi:10.3390/bioengineering8020017
31. Provenzano PP, Eliceiri KW, Campbell JM, Inman DR, White JG, Keely PJ. Collagen Reorganization at the Tumor-Stromal Interface Facilitates Local Invasion. BMC Med (2006) 4:38. doi:10.1186/1741-7015-4-38
32. Nebuloni M, Albarello L, Andolfo A, Magagnotti C, Genovese L, Locatelli I, et al. Insight on Colorectal Carcinoma Infiltration by Studying Perilesional Extracellular Matrix. Sci Rep (2016) 6:22522. doi:10.1038/srep22522
33. Provenzano PP, Inman DR, Eliceiri KW, Trier SM, Keely PJ. Contact Guidance Mediated Three-Dimensional Cell Migration Is Regulated by Rho/ROCK-dependent Matrix Reorganization. Biophysical J (2008) 95:5374–84. doi:10.1529/biophysj.108.133116
Keywords: morphological analysis, pattern formation, type I collagen, collagen straightness, colorectal cancer
Citation: Despotović SZ and Ćosić M (2022) The Morphological Analysis of the Collagen Fiber Straightness in the Healthy Uninvolved Human Colon Mucosa Away From the Cancer. Front. Phys. 10:915644. doi: 10.3389/fphy.2022.915644
Received: 08 April 2022; Accepted: 30 May 2022;
Published: 13 July 2022.
Edited by:
Rajprasad Loganathan, Johns Hopkins Medicine, United StatesReviewed by:
Massimiliano Galluzzi, Shenzhen Institutes of Advanced Technology, (CAS), ChinaGuang-Kui Xu, Xi’an Jiaotong University, China
Copyright © 2022 Despotović and Ćosić. This is an open-access article distributed under the terms of the Creative Commons Attribution License (CC BY). The use, distribution or reproduction in other forums is permitted, provided the original author(s) and the copyright owner(s) are credited and that the original publication in this journal is cited, in accordance with accepted academic practice. No use, distribution or reproduction is permitted which does not comply with these terms.
*Correspondence: Sanja Z. Despotović, sanjadesp@gmail.com