Label-free multimodal non-linear optical imaging of three-dimensional cell cultures
 Wenying Zhao
 Dingcheng Sun
 Shuhua Yue
- Key Laboratory of Biomechanics and Mechanobiology, Ministry of Education, Institute of Medical Photonics, Beijing Advanced Innovation Center for Biomedical Engineering, School of Biological Science and Medical Engineering, Beihang University, Beijing, China
3D cell cultures recapitulate tissue-specific diversity and better mimic the in vivo conditions compared to 2D cell cultures. Although confocal fluorescence microscopy is probably the most commonly used optical imaging technique to characterize 3D cell cultures, the limited imaging depth greatly hinders its application. Moreover, due to difficult diffusion of fluorescent probes into thick 3D cultures, the optical imaging techniques that rely on exogeneous fluorescent probes are not desirable. To address these problems, non-linear optical (NLO) microscopy uses near infrared light excitation to achieve significant larger imaging depth and gains molecular selectivity in a label-free manner. Taking advantages of 3D optical sectioning capability, submicron resolution, and high speed, label-free multimodal NLO microscopy has offered great promise for regenerative medicine, tumor microenvironment research, and drug discovery. This article overviews and discusses the latest applications of label-free multimodal NLO microscopy as an emerging platform to facilitate 3D cell culture research.
1 Introduction
Cell cultures are crucial model systems widely used in life science and drug discovery. Most of the current cell cultures are still in two-dimensional (2D) monolayers, which have many limitations due to the lack of tissue architecture and complexity in vivo. Three-dimensional (3D) cell cultures, with the capability of reproducing the key features of biological tissues, including deposition of extracellular matrix (ECM), increased cell-cell and cell-ECM interactions, heterogeneity in oxygen and nutrients perfusion [1, 2], have proven to better mimic the in vivo conditions compared to 2D cell cultures. 3D cell cultures mainly include spheroids and organoids. Spheroids are micro-sized cellular aggregates of homotypic or heterotypic cells, as well as the ECM which provides structural support for cells in the extracellular space composed of collagen, elastin, laminin, fibronectin, and other components [3]. Organoids are mini-clusters of cells derived from pluripotent stem cells or adult stem cells, in which cells self-organize and differentiate into organ-specific functional cell types, and have a similar functionality as the original tissue [4, 5]. Owing to these advantages, the 3D cell cultures are becoming more popular in disease modeling [6], regenerative medicine [7], and cancer research [8]. For example, organoids have been widely utilized to engineer tissues in vitro, including bone [9], adipose tissue [10, 11], brain [12, 13], retina [14], and so on. A number of studies have reported that cancer cells cultured in 3D spheroids are much more resistant to chemotherapeutic drugs than the cells in 2D culture and can reproduce drug responses observed in tumors in vivo, such as prostate cancer [15], pancreatic cancer [16, 17], breast cancer [18–20], and ovarian cancer [21–23].
Along with the development of 3D cell cultures, the optical imaging techniques, primarily confocal fluorescence microscopy, have been applied to characterize cell phenotypes, size, morphology, as well as extracellular matrix organization of 3D cell cultures [3, 24]. However, due to poor penetration of visible light, the imaging depth of confocal fluorescence microscopy is limited to ∼100 μm, which greatly hinders its application in the imaging of large 3D cell cultures. Moreover, for 3D culture study, the optical imaging techniques that rely on exogeneous fluorescent probes have several drawbacks, such as i) unreliable labeling due to difficult diffusion of fluorescent probes into thick 3D cultures; ii) possible strong background due to mislabeling of ECM; iii) perturbation to functions of small biomolecules due to commonly bulky fluorescent probes; iv) photobleaching of certain fluorescent probes.
To address the problem of penetration depth, non-linear optical (NLO) microscopy, also known as multiphoton microscopy, uses near infrared (NIR) light excitation to achieve significant larger imaging depth (up to ∼1 mm), with intrinsic 3D optical sectioning capability, submicron spatial resolution, and high imaging speed. More importantly, NLO microscopy gains molecular selectivity in a label-free manner, which overcomes the limitations induced by exogeneous fluorescent probes. With advantages of 3D-sectioning capability, large penetration depth, high spatial resolution, and high imaging speed, label-free multimodal NLO microscopy is desirable for 3D cell culture studies. In this review, we present an overview of the fundamental of label-free multimodal NLO imaging techniques and their recent applications in 3D cell cultures and discuss how label-free multimodal NLO microscopy may improve the understanding of tissue architecture and function in both physiology and pathology.
2 Brief introduction of label-free multimodal NLO imaging techniques
The primary label-free NLO imaging modalities used in the 3D culture study include two-photon excitation fluorescence (2 PF), three-photon excitation fluorescence (3 PF), second harmonic generation (SHG), third harmonic generation (THG), coherent anti-Stokes Raman scattering (CARS), and stimulated Raman scattering (SRS). The fundamentals of each modality have been summarized in multiple previous review articles [25–27].
As shown in Figure 1A, 2 PF or 3 PF relies on the simultaneous absorption of two or three photons, and then emits a fluorescence photon with higher energy. Compared to standard fluorescence microscopy, 2 PF and 3 PF microscopes allow for low phototoxicity via NIR excitation and deeper penetration by using longer excitation wavelength. Moreover, 3 PF can achieve bigger penetration depth than 2 PF owing to longer excitation wavelength. Specially, these two modalities allow the visualization of endogenous auto-fluorescent molecules, such as nicotinamide adenine dinucleotide (phosphate) [H] [NAD(P)H] and flavin adenine dinucleotide (FAD), two major reduction/oxidation (redox) cofactors. Glycolysis decreases FAD levels and increases NADH levels, while oxidative phosphorylation (OxPHOS) increases FAD levels and decreases NADH levels. By quantifying the ratio of
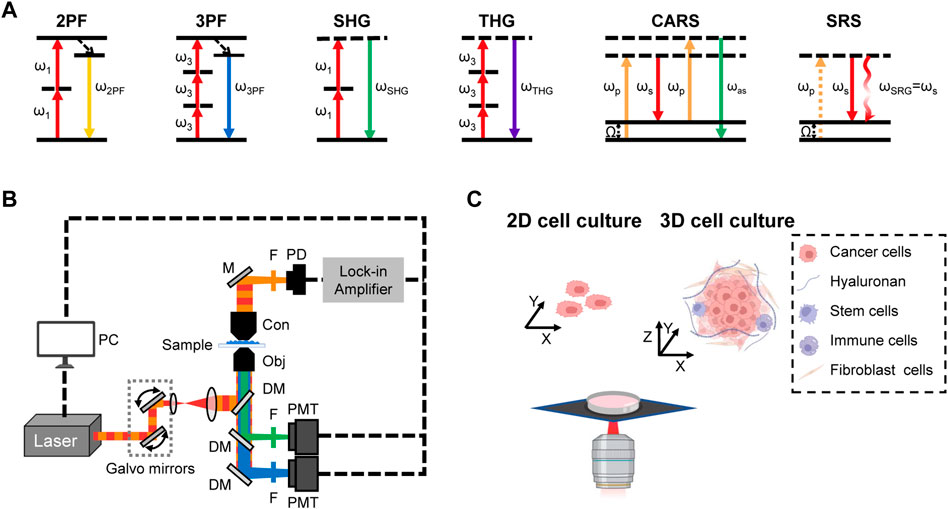
FIGURE 1. Illustration of multimodal label-free NLO imaging of cell cultures (A) Energy diagrams of NLO modalities. (B) Schematic of multimodal NLO microscope. M, mirror; F, filter; Obj, objective; Con, condenser; DM, dichroic mirror; PMT, photomultiplier tube; PD, photodiode. (C) 2D cell cultures and 3D cell cultures with heterogenous cell populations.
SHG is a second-order NLO process in which two photons of frequency ω are converted into one photon of frequency 2 ω with twice the energy of the excitation photons. In SHG, contrast arises from non-centrosymmetric structures. Therefore, SHG microscopy can be employed to visualize ordered structures such as collagen fibers and myosin filaments with high contrast in a label-free manner [16]. THG is a third-order NLO process in which three photons are converted into one photon with triple the energy of the excitation photons. THG signal occurs where the refractive index changes and enables label-free imaging of intracellular water/lipid interfaces, such as cell membranes and lipid droplets.
CARS and SRS use two excitation fields, pump (ωp) and Stokes (ωs), to coherently excite the selected molecular vibration and produce chemical contrast when the beating frequency (
Notably, these multiple modalities can be integrated on the same platform, known as multimodal NLO microscopy, to enable more comprehensive imaging and analysis of complex tissue microenvironment. The integrated platform, such as 2 PF/3 PF/SHG/THG [30, 31], 2 PF/3 PF/SHG/THG/CARS [32], 2 PF/SHG/SRS [33], and 2 PF/SHG/CARS/SRS [34], have been previously demonstrated (Figure 1B). Owing to the capability of spatial and temporal co-registration between modalities, multimodal NLO microscopy has become an emerging imaging platform for 3D cell culture research (Figure 1C). In the following sections, we focus on the intriguing applications of label-free multimodal NLO imaging in 3D culture study, including regenerative medicine, tumor microenvironment, and drug discovery.
3 Applications of NLO imaging for the study of 3D cell culture
3.1 Regenerative medicine
In tissue regeneration, cell-ECM interaction and cellular metabolism play vital roles in determining tissue structure and function. Thus, quantitative analysis of cell-ECM interactions, mainly collagen fiber organization, and cellular metabolic activity, such as redox state, is helpful to promote our understanding of tissue engineering and regeneration.
To study the role of collagen matrix in cartilage regeneration, label-free NLO imaging is used to monitor the collagen remodeling during chondrogenesis. Islam et al. [35] applied SHG imaging to visualize the collage matrix structure within tissue-engineered cartilage and native cartilage. The results revealed significantly different collagen organization between spheroids with chondrogenic growth factors, spheroids without growth factors, and native cartilage. Specifically, spheroids with growth factors displayed more collagen deposition than spheroids without growth factors, but lower than native cartilage. Another study by Nguyen et al. [36] assessed the role of nanofibrillated cellulose with alginate hydrogel in cartilage regeneration using SHG coupled with 2 PF. SHG imaging revealed the collagen architecture within 3D-printed cartilage tissue, while 2 PF detected the living cells. The alginate hydrogel has been shown to support induced pluripotent stem cells (iPSCs) differentiation into cartilaginous tissue and improve collagen type II formation, providing potential application as a scaffold for cartilage regeneration. Similarly, Lee et al. [37] utilized the multimodal multiphoton autofluorescence and SHG imaging to monitor the mesenchymal stem cells (MSCs) differentiation and collagen type II production within engineered cartilage that was encapsulated in poly-glycolic acid-based scaffolds. In addition to the assessment of collagen matrix within cartilage, SHG has also been integrated with CARS to provide more comprehensive information, such as cell morphology and lipid metabolism. By using this integrated platform, Mortati et al. [38] simultaneously obtained collagen fiber images and cell morphology signatures during human bone marrow-derived MSCs differentiation inside the fibrin hydrogel scaffold. Parodi et al. [39] also quantified the collagen deposition, nuclear morphology, as well as lipid droplets content during MSCs adipogenic and chondrogenic differentiation inside the Nichoid scaffold. Increased lipid droplets accumulation as well as less collagen content were observed within Nichoid scaffold, indicating that the Nichoid scaffold promoted adipogenesis while inhibiting chondrogenesis.
Label-free NLO microscopes are particularly well-suited to visualize the vascular structures, providing a valuable tool to characterize the vascularization in 3D engineered tissues. Kaushik et al. [40] used autofluorescence multiphoton microscopy to characterize 3D self-assembled vascular network morphology. The results showed that vascular networks cultured under dynamic flow conditions displayed lower network anisotropy and more interconnectivity compared to that under static conditions, suggesting that flow bioreactor techniques could improve the development of in vitro vascularized models. To study the role of collagen matrix in regulating angiogenesis, SHG was applied to monitor collagen matrix remodeling during endothelial sprout formation [41]. The results showed that collagen signal of the spheroids was weak at the beginning of incubation into collagen matrix, and subsequently increased along with endothelial sprout formation. However, degradation of collagen matrix was observed after 7 days. Furthermore, polarized SHG has the capability of providing additional information of collagen orientation, thereby improving our understanding of collagen remodeling in engineered tissues with collagen scaffolds [42].
Label-free NLO imaging has also been used to track adipogenesis by characterizing the lipid vesicles size, volume, concentration as well as spatial distribution signatures in 3D cultures. Using 2 PF imaging, Quinn et al. [43] monitored the dynamic changes of redox ratio
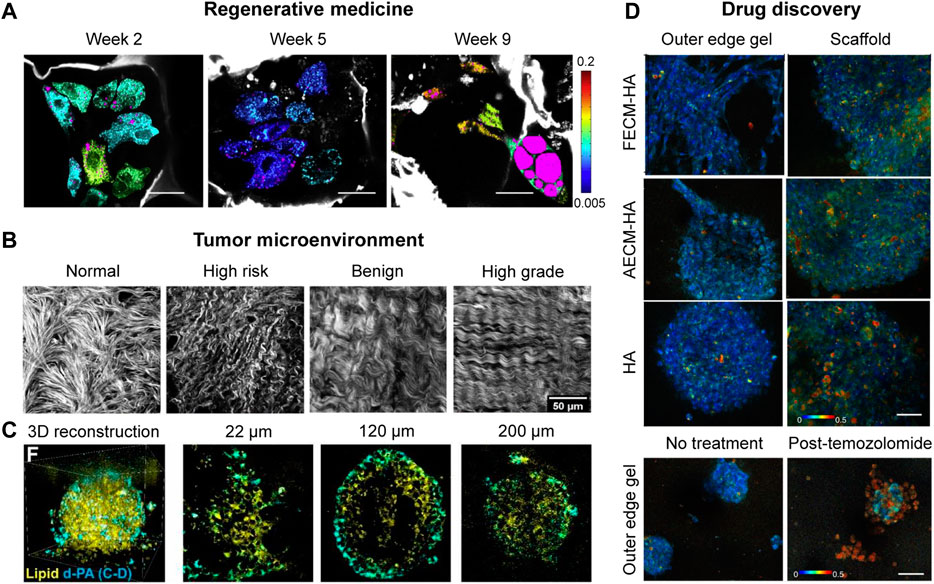
FIGURE 2. Applications of label-free NLO imaging in 3D cell cultures. (A) FLIM coupled with THG images of cellular redox ratios and lipid content (magenta) in hMSCs embedded in 3D silk scaffolds, exposed to the adipogenic media for 2, 5 and 9 weeks, respectively. Redox scale color bar is shown on the right. Endogenous silk fluorescence is shown in grayscale. Scale bars, 35 μm (with permission) [44]. (B) SHG images of collagen fibers from normal, high risk, benign, and high grade of ovarian tissues within fabricated scaffolds (with permission) [51]. (C) Volumetric SRS images and representative 2D images (at z = 22 μm, 120 μm, and 200 μm) of 3D tumor spheroids. Lipid droplets channel is shown in green, and d31-palmitic acid channel is shown in cyan. Scale bars, 50 μm (with permission) [55]. (D) Representative redox ratio images of glioblastoma cells within hyaluronic acid (HA), HA supplemented with porcine brain-derived fatal ECM (FECM-HA), and HA supplemented with porcine brain-derived adult ECM (FECM-HA) hydrogels scaffolded constructs. Image heatmap reflects varying redox ratio intensities in the outer edge gel or within the scaffold of the construct. Scale bars, 50 µm (with permission) [59].
Besides, label-free NLO imaging allows in situ real-time non-invasive study of retinal engineering by measuring the cellular metabolism and retinol production. Xue et al. [45] applied two-photon FLIM coupling with hyperspectral techniques to quantify
With the advantage of high penetration depth, THG has been applied for the visualization of whole cerebral organoids. In a study by Yildirim et al. [47], larger volume, larger surface area and lower ventricular thickness in mutant organoids compared to normal organoids were directly visualized. By further monitoring dynamic neuronal migration of cerebral organoids, shorter migration distance and slower migration speed were observed in mutant organoids. This study provides valuable insights for understanding the early human brain development.
In addition, label-free NLO microscopy has also been used to assess tissue polarity in 3D cell cultures. To quantitatively measure apical and basal polarity status in 3D breast organoids, CARS integrated with confocal Raman spectroscopy was applied to quantify the degree of lipid ordering in apical membranes and basal membranes [48]. Higher degree of lipid ordering was observed in apical membranes compared to basal membranes in polarized breast acini. This method demonstrates a highly sensitive tool to monitor apical and basal polarity status through label-free quantification of lipid ordering and offers a great potential for screening of risk factors that may induce loss of tissue polarity, the very early stage of cancer development.
These studies together demonstrate that multimodal label-free NLO imaging techniques have provided non-invasive and quantitative tools for regenerative medicine research and given deeper insight into quality control of tissue engineering.
3.2 Tumor microenvironment
The tumor microenvironment (TME), composed of heterogeneous cell populations (e.g., fibroblasts, endothelial cells, and immune cells) as well as the extracellular matrix (e.g., collagen, elastin, and fibronectin), plays an important role in tumor development [49].
To study macrophage heterogeneity within the TME, two-photon FLIM imaging was used to assess the redox state in both mono-culture and 3D co-culture [50]. Increased redox ratio was observed in 3D cultures compared to monocultures. More importantly, there were remarkable metabolic changes in pro-tumor macrophages compared to anti-tumor macrophages in 3D tumor co-cultures.
To investigate the tumor-stroma interactions in vitro, Alkmin et al. [51] constructed 3D collagen-based ovarian cancer models representing four types of ovarian tissues, including normal stroma, high-risk tissue, benign tumors and high-grade tumors. As shown in Figure 2B, the SHG imaging results showed well-ordered and crimping morphology of collagen fiber within the high-grade tumors, contributing to fast migration and high motility. In another study, Li et al. [52] used hyperspectral SRS imaging to characterize ovarian cancer stem cells (CSCs) within the TME that played an important role in the ovarian cancer progression. Higher lipid unsaturation was discovered in CSC-enriched spheroids compared to mono-cultured cancer cells, implying a novel CSC-specific targeted treatment strategy for ovarian cancer.
To dissect cellular metabolic activity in TME, Hou et al. [53] integrated 2 PF, SHG and CARS microscopy to study cellular metabolism and collagen synthesis in 3D breast tumor spheroids. The results showed significantly different glucose and lipid metabolic signatures in cancer cells, such as increased de novo lipid synthesis, beta-oxidation and collagen synthesis. Going beyond label-free imaging, the development of Raman tags as a unique strategy offers metabolic dynamics of specific biomolecules [54]. Raman tags are small in size and maintain the native properties of molecules with minimal perturbation, which are free from bulky fluorophores-associated issues. Using SRS imaging coupled with deuterated d31-palmitic acid (d-PA), Wei et al. [55] reported heterogeneous distribution of lipid metabolites in 3D breast cancer spheroids. It is worth mentioning that newly synthesized lipids were preferentially observed in the invasion front of the spheroids (Figure 2C).
Collectively, label-free multimodal NLO imaging has provided a new avenue to study the heterogeneous TME, enabling the characterization of cell type, cell morphology, cellular metabolism, ECM deposition, as well as cell-stroma interactions and so on.
3.3 Drug discovery
It is well known that heterogeneous drug responses are associated with heterogeneous cellular metabolism [56]. Therefore, metabolic imaging methods are potentially useful for drug discovery.
Two-photon FLIM imaging was applied to assess heterogeneous drug responses in pancreatic cancer and breast cancer patient-derived organoids by measuring the NAD(P)H, FAD and redox ratio [57]. This study revealed cellular metabolic heterogeneity in both pancreatic and breast cancer organoids. Moreover, cancer organoids displayed different morphologies, including hollow and solid. Solid cancer organoids exhibited greater metabolic heterogeneity compared to hollow organoids, due to different nutrition and pH penetration in solid organoids. The imaging platform was also used to track dynamic drug responses and distinguish drug-resistant cell populations in cancer organoids, providing a powerful tool for drug screening. More recently, two-photon FLIM imaging was applied to assess heterogeneous drug responses in gastroenteropancreatic neuroendocrine tumor (GEP-NET) patient-derived cancer organoids (PDCOs) [58]. This study opens a new avenue to drug discovery for GEP-NET, which could not be achieved by traditional measurements due to very low proliferation rate of GEP-NET. In a similar study, Sood et al. [59] used 2 PF imaging to investigate heterogeneous metabolism and drug responses of 3D bioengineered brain cancer cell cultures within ECM-enriched hyaluronic acid (HA) or collagen type I (CLG1) hydrogels. As shown in Figure 2D, increased redox ratio was observed in 3D cell cultures under CLG1 condition compared to that under HA condition. Besides, infiltrative cell populations on the outer edge gel displayed higher redox ratio than within scaffold region. Upon temozolomide (TMZ) treatment, cell populations at the outer edge displayed significantly higher redox ratio in comparison to inside scaffold, indicating that cell populations at the outer edge gel were more drug-responsive to TMZ treatment. This study for the first time observed the lipid droplet accumulation in primary 3D glioblastoma in vitro.
By combining 2 PF with CARS microscopy, Wright et al. [60] explored the mechanism by which CUB-domain containing protein 1 (CDCP1) promoted metastasis of triple-negative breast cancer (TNBC). 2 PF imaging was used to quantify the cellular redox ratio, while CARS imaging was used for lipid droplets detection. The results showed that CDCP1 could regulate lipid metabolism by reducing lipid droplet accumulation and stimulating fatty acid oxidation in 3D cultures, which offers a potential therapeutic target for TNBC metastasis. In a latest study, Becker et al. [61] coupled Raman microspectroscopy with FLIM platform for metabolic monitoring of drug treatment efficacy in bladder cancer organoids. Raman microspectroscopy was used to evaluate the impact of drugs on subcellular structures such as nuclei and mitochondria based on shifts and intensity changes of specific molecular vibrations. FLIM was used to quantify the effects of different drugs on cell metabolism based on autofluorescence from NADH and FAD. Neural network-based data analyses were performed to retrieve biomarkers for drug-specific responsiveness, which could promote drug screening and personalized treatment.
These metabolic imaging methods not only allow cell metabolic measurements of drug responses within the 3D microenvironment, but also enable distinguishing drug-resistant and drug-sensitive cell populations, which are superior to conventional viability assays that only gauge average cellular response.
4 Summary and Outlook
3D cell cultures recapitulate tissue-specific physiological or pathological diversity. Label-free multimodal NLO microscopy has shown the potential to significantly improve our understanding of the complexity of living multicellular systems and offered great applications for regenerative medicine (e.g., stem cell differentiation, collagen organization, and vascularization), TME heterogeneity (e.g., cell subtyping and tumor-stroma interaction), cell behaviors in 3D cultures (e.g., proliferation, invasion, and migration), cell metabolism in 3D cultures (e.g., redox status, lipid metabolism, and protein metabolism), and drug responses in 3D cultures (e.g., drug-resistant and drug-sensitive subpopulations). It is expected that future studies will explore broader applications of label-free NLO imaging in 3D cultures, not only in biological research but also in clinical translations for disease detection. For example, multicolor SRS microscopy could provide stain-free histology-like information with contrast originating from lipid and protein for accurate tumor diagnosis [62–65].
In addition, we believe technical advancements would further promote these research fields. Firstly, regarding improvement of imaging depth, several optical clearing methods have been developed to make specimens optically transparent and are therefore promising to image thick specimens. For fluorescent imaging, organic solvent-based protocols especially 3DISCO, SeeDB and CUBIC have performed successful applications of tissue clearing [66, 67]. As an improved technique, FDISCO enables visualization of 3D neuronal and vascular structures with the superior fluorescence preserving capability [66, 67]. For SRS imaging, 8 M urea has been discovered to be capable of increasing imaging depth by 5∼10 folds within spheroids [55]. Secondly, regarding acceleration of imaging speed, light sheet technique has been demonstrated to increase fluorescence imaging speed by ∼1,000 times and permits longitudinal imaging of living organisms [68]; Volumetric SRS imaging has been successfully developed to perform fast 3D imaging of living systems [69, 70]. Thirdly, regarding enhancement of molecular specificity and sensitivity, small-sized Raman tags (e.g., deuterium, alkyne, and diyne), which show strong Raman peaks well separated from endogenous cellular signals without perturbing biological activities of small molecules, have been developed and utilized to monitor cellular uptake, distribution, and metabolism of small molecules [54, 71, 72].
In summary, label-free multimodal NLO imaging techniques have become a vital tool for the study of 3D cell cultures. Looking into the future, the advanced NLO imaging techniques would further improve our understanding of the 3D microenvironment and promote a wider range of life science and medical research.
Author contributions
WZ contributed to the systematic review of the literature and wrote the initial draft of the manuscript. DS contributed to the drawing of the figures. SY wrote the review article and critically analyzed and approved it.
Funding
This work is supported by National Natural Science Foundation of China (Nos 62027824 and 91959120), Basic Research Program for Beijing-Tianjin-Hebei Coordination [No. 19JCZDJC65500(Z)], Fundamental Research Funds for the Central Universities (No. YWF-21-BJ-J-549).
Conflict of interest
The authors declare that the research was conducted in the absence of any commercial or financial relationships that could be construed as a potential conflict of interest.
Publisher’s note
All claims expressed in this article are solely those of the authors and do not necessarily represent those of their affiliated organizations, or those of the publisher, the editors and the reviewers. Any product that may be evaluated in this article, or claim that may be made by its manufacturer, is not guaranteed or endorsed by the publisher.
References
1. Cacciamali A, Villa R, Dotti S. 3D cell cultures: Evolution of an ancient tool for new applications. Front Physiol (2022) 13:836480. doi:10.3389/fphys.2022.836480
2. Jensen C, Teng Y. Is it time to start transitioning from 2D to 3D cell culture? Front Mol Biosci (2020) 7:33. doi:10.3389/fmolb.2020.00033
3. Costa EC, Moreira AF, de Melo-Diogo D, Gaspar VM, Carvalho MP, Correia IJ. 3D tumor spheroids: An overview on the tools and techniques used for their analysis. Biotechnol Adv (2016) 34:1427–41. doi:10.1016/j.biotechadv.2016.11.002
4. Corrò C, Novellasdemunt L, Li VSW. A brief history of organoids. Am J Physiol Cel Physiol (2020) 319:C151–65. doi:10.1152/AJPCELL.00120.2020
5. Taelman J, Diaz M, Guiu J. Human intestinal organoids: Promise and challenge. Front Cel Dev Biol (2022) 10:854740. doi:10.3389/fcell.2022.854740
6. Zanoni M, Cortesi M, Zamagni A, Arienti C, Pignatta S, Tesei A. Modeling neoplastic disease with spheroids and organoids. J Hematol Oncol (2020) 13:97. doi:10.1186/s13045-020-00931-0
7. Lukonin I, Serra D, Challet Meylan L, Volkmann K, Baaten J, Zhao R, et al. Phenotypic landscape of intestinal organoid regeneration. Nature (2020) 586:275–80. doi:10.1038/s41586-020-2776-9
8. Gopal S, Kwon SJ, Ku B, Lee DW, Kim J, Dordick JS. 3D tumor spheroid microarray for high-throughput, high-content natural killer cell-mediated cytotoxicity. Commun Biol (2021) 4:893. doi:10.1038/s42003-021-02417-2
9. Tassey J, Sarkar A, van Handel B, Lu J, Lee S, Evseenko D. A single-cell culture system for dissecting microenvironmental signaling in development and disease of cartilage tissue. Front Cel Dev Biol (2021) 9:725854. doi:10.3389/fcell.2021.725854
10. Al-Ghadban S, Artiles M, Bunnell BA. Adipose stem cells in regenerative medicine: Looking forward. Front Bioeng Biotechnol (2022) 9:837464. doi:10.3389/fbioe.2021.837464
11. Mandl M, Viertler HP, Hatzmann FM, Brucker C, Großmann S, Waldegger P, et al. An organoid model derived from human adipose stem/progenitor cells to study adipose tissue physiology. Adipocyte (2022) 11:164–74. doi:10.1080/21623945.2022.2044601
12. Qian X, Song H, Ming GL. Brain organoids: Advances, applications and challenges. Development (2019) 146:dev166074. doi:10.1242/dev.166074
13. Sun XY, Ju XC, Li Y, Zeng PM, Wu J, Zhou YY, et al. Generation of vascularized brain organoids to study neurovascular interactions. Elife (2022) 11:e76707. doi:10.7554/eLife.76707
14. Völkner M, Zschätzsch M, Rostovskaya M, Overall RW, Busskamp V, Anastassiadis K, et al. Retinal organoids from pluripotent stem cells efficiently recapitulate retinogenesis. Stem Cel Rep (2016) 6:525–38. doi:10.1016/j.stemcr.2016.03.001
15. Wartenberg M, Hoffmann E, Schwindt H, Grünheck F, Petros J, Arnold JRS, et al. Reactive oxygen species-linked regulation of the multidrug resistance transporter P-glycoprotein in Nox-1 overexpressing prostate tumor spheroids. FEBS Lett (2005) 579:4541–9. doi:10.1016/j.febslet.2005.06.078
16. Longati P, Jia X, Eimer J, Wagman A, Witt MR, Rehnmark S, et al. 3D pancreatic carcinoma spheroids induce a matrix-rich, chemoresistant phenotype offering a better model for drug testing. BMC Cancer (2013) 13:95. doi:10.1186/1471-2407-13-95
17. Huanwen W, Zhiyong L, Xiaohua S, Xinyu R, Kai W, Tonghua L. Intrinsic chemoresistance to gemcitabine is associated with constitutive and laminin-induced phosphorylation of FAK in pancreatic cancer cell lines. Mol Cancer (2009) 8:125. doi:10.1186/1476-4598-8-125
18. Muguruma M, Teraoka S, Miyahara K, Ueda A, Asaoka M, Okazaki M, et al. Differences in drug sensitivity between two-dimensional and three-dimensional culture systems in triple-negative breast cancer cell lines. Biochem Biophys Res Commun (2020) 533:268–74. doi:10.1016/j.bbrc.2020.08.075
19. Lovitt CJ, Shelper TB, Avery VM. Evaluation of chemotherapeutics in a three-dimensional breast cancer model. J Cancer Res Clin Oncol (2015) 141:951–9. doi:10.1007/s00432-015-1950-1
20. Landry BD, Leete T, Richards R, Cruz-Gordillo P, Schwartz HR, Honeywell ME, et al. Tumor-stroma interactions differentially alter drug sensitivity based on the origin of stromal cells. Mol Syst Biol (2018) 14:e8322. doi:10.15252/msb.20188322
21. Liao J, Qian F, Tchabo N, Mhawech-Fauceglia P, Beck A, Qian Z, et al. Ovarian cancer spheroid cells with stem cell-like properties contribute to tumor generation, metastasis and chemotherapy resistance through hypoxia-resistant metabolism. PLoS One (2014) 9:e84941. doi:10.1371/journal.pone.0084941
22. Shuford S, Wilhelm C, Rayner M, Elrod A, Millard M, Mattingly C, et al. Prospective validation of an ex vivo, patient-derived 3D spheroid model for response predictions in newly diagnosed ovarian cancer. Sci Rep (2019) 9:11153. doi:10.1038/s41598-019-47578-7
23. Yee C, Dickson KA, Muntasir MN, Ma Y, Marsh DJ Three-dimensional modelling of ovarian cancer: From cell lines to organoids for discovery and personalized medicine. Front Bioeng Biotechnol (2022) 10:836984. doi:10.3389/fbioe.2022.836984
24. Hilzenrat G, Gill ET, McArthur SL. Imaging approaches for monitoring three-dimensional cell and tissue culture systems. J Biophotonics (2022) 15:e202100380. doi:10.1002/jbio.202100380
25. Yue S, Slipchenko MN, Cheng JX. Multimodal nonlinear optical microscopy. Laser Photon Rev (2011) 5:496–512. doi:10.1002/lpor.201000027
26. Gopal AA, Kazarine A, Dubach JM, Wiseman PW. Recent advances in nonlinear microscopy: Deep insights and polarized revelations. Int J Biochem Cel Biol (2021) 130:105896. doi:10.1016/j.biocel.2020.105896
27. Parodi V, Jacchetti E, Osellame R, Cerullo G, Polli D, Raimondi MT. Nonlinear optical microscopy: From fundamentals to applications in live bioimaging. Front Bioeng Biotechnol (2020) 8:585363. doi:10.3389/fbioe.2020.585363
28. Datta R, Heaster TM, Sharick JT, Gillette AA, Skala MC. Fluorescence lifetime imaging microscopy: Fundamentals and advances in instrumentation, analysis, and applications. J Biomed Opt (2020) 25:1–43. doi:10.1117/1.jbo.25.7.071203
29. Blacker TS, Mann ZF, Gale JE, Ziegler M, Bain AJ, Szabadkai G, et al. Separating NADH and NADPH fluorescence in live cells and tissues using FLIM. Nat Commun (2014) 5:3936. doi:10.1038/ncomms4936
30. Sun Y, You S, Tu H, Spillman DR, Chaney EJ, Marjanovic M, et al. Intraoperative visualization of the tumor microenvironment and quantification of extracellular vesicles by label-free nonlinear imaging. Sci Adv (2018) 4:eaau5603. doi:10.1126/sciadv.aau5603
31. You S, Sun Y, Yang L, Park J, Tu H, Marjanovic M, et al. Real-time intraoperative diagnosis by deep neural network driven multiphoton virtual histology. NPJ Precis Oncol (2019) 3:33. doi:10.1038/s41698-019-0104-3
32. Liu Y, Tu H, You S, Chaney EJ, Marjanovic M, Boppart SA. Label-free molecular profiling for identification of biomarkers in carcinogenesis using multimodal multiphoton imaging. Quant Imaging Med Surg (2019) 9:742–56. doi:10.21037/qims.2019.04.16
33. Zou F, Zhang L, Zou X, Huang J, Nie C, Jiang J, et al. Differential characterization of lumbar spine associated tissue histology with nonlinear optical microscopy. Biomed Opt Express (2022) 13:474. doi:10.1364/boe.446351
34. Cunha R, Lafeta L, Fonseca EA, Barbosa A, Romano-Silva MA, Vieira R, et al. Nonlinear and vibrational microscopy for label-free characterization of amyloid-β plaques in Alzheimer’s disease model. Analyst (2021) 146:2945–54. doi:10.1039/d1an00074h
35. Islam A, Romijn EI, Lilledahl MB, Martinez-Zubiaurre I. Non-linear optical microscopy as a novel quantitative and label-free imaging modality to improve the assessment of tissue-engineered cartilage. Osteoarthritis Cartilage (2017) 25:1729–37. doi:10.1016/j.joca.2017.06.008
36. Nguyen D, Hgg DA, Forsman A, Ekholm J, Nimkingratana P, Brantsing C, et al. Cartilage tissue engineering by the 3D bioprinting of iPS cells in a nanocellulose/alginate bioink. Sci Rep (2017) 7:658. doi:10.1038/s41598-017-00690-y
37. Lee H-S, Teng S-W, Chen H-C, Lo W, Sun Y, Lin T-Y, et al. Imaging human bone marrow stem cell morphogenesis in polyglycolic acid scaffold by multiphoton microscopy. Tissue Eng (2006) 12:2835–41. doi:10.1089/ten.2006.12.2835
38. Mortati L, Divieto C, Sassi MP. CARS and SHG microscopy to follow collagen production in living human corneal fibroblasts and mesenchymal stem cells in fibrin hydrogel 3D cultures. J Raman Spectrosc (2012) 43:675–80. doi:10.1002/jrs.3171
39. Parodi V, Jacchetti E, Bresci A, Talone B, Valensise CM, Osellame R, et al. Characterization of mesenchymal stem cell differentiation within miniaturized 3d scaffolds through advanced microscopy techniques. Int J Mol Sci (2020) 21:8498–21. doi:10.3390/ijms21228498
40. Kaushik G, Gil DA, Torr E, Berge ES, Soref C, Uhl P, et al. Quantitative label-free imaging of 3D vascular networks self-assembled in synthetic hydrogels. Adv Healthc Mater (2019) 8:e1801186. doi:10.1002/adhm.201801186
41. Correa de Sampaio P, Auslaender D, Krubasik D, Failla AV, Skepper JN, Murphy G, et al. A heterogeneous in vitro three dimensional model of tumour-stroma interactions regulating sprouting angiogenesis. PLoS One (2012) 7:e30753. doi:10.1371/journal.pone.0030753
42. Xydias D, Ziakas G, Psilodimitrakopoulos S, Lemonis A, Bagli E, Fotsis T, et al. Three-dimensional characterization of collagen remodeling in cell-seeded collagen scaffolds via polarization second harmonic generation. Biomed Opt Express (2021) 12:1136. doi:10.1364/boe.411501
43. Quinn KP, Bellas E, Fourligas N, Lee K, Kaplan DL, Georgakoudi I. Characterization of metabolic changes associated with the functional development of 3D engineered tissues by non-invasive, dynamic measurement of individual cell redox ratios. Biomaterials (2012) 33:5341–8. doi:10.1016/j.biomaterials.2012.04.024
44. Chang T, Zimmerley MS, Quinn KP, Lamarre-Jouenne I, Kaplan DL, Beaurepaire E, et al. Non-invasive monitoring of cell metabolism and lipid production in 3D engineered human adipose tissues using label-free multiphoton microscopy. Biomaterials (2013) 34:8607–16. doi:10.1016/j.biomaterials.2013.07.066
45. Xue Y, Browne AW, Tang WC, Delgado J, McLelland BT, Nistor G, et al. Retinal organoids long-term functional characterization using two-photon fluorescence lifetime and hyperspectral microscopy. Front Cel Neurosci (2021) 15:796903. doi:10.3389/fncel.2021.796903
46. Samimi K, Pattnaik BR, Capowski EE, Saha K, Gamm DM, Skala MC. In situ autofluorescence lifetime assay of a photoreceptor stimulus response in mouse retina and human retinal organoids. Biomed Opt Express (2022) 13:3476. doi:10.1364/boe.455783
47. Yildirim M, Delepine C, Feldman D, Pham VA, Chou S, Ip J, et al. Label-free three-photon imaging of intact human cerebral organoids for tracking early events in brain development and deficits in Rett syndrome. Elife (2022) 2022:e78079. doi:10.7554/ELIFE.78079
48. Yue S, Cárdenas-Mora JM, Chaboub LS, Lelivre SA, Cheng JX Label-free analysis of breast tissue polarity by Raman imaging of lipid phase. Biophys J (2012) 102:1215–1223. doi:10.1016/j.bpj.2012.01.023
49. Tiwari A, Trivedi R, Lin SY. Tumor microenvironment: Barrier or opportunity towards effective cancer therapy. J Biomed Sci (2022) 29:83. doi:10.1186/s12929-022-00866-3
50. Heaster TM, Humayun M, Yu J, Beebe DJ, Skala MC. Autofluorescence imaging of 3D tumor-macrophage microscale cultures resolves spatial and temporal dynamics of macrophage metabolism. Cancer Res (2020) 80:5408–23. doi:10.1158/0008-5472.CAN-20-0831
51. Alkmin S, Brodziski R, Simon H, Hinton D, Goldsmith RH, Patankar M, et al. Role of collagen fiber morphology on ovarian cancer cell migration using image-based models of the extracellular matrix. Cancers (Basel) (2020) 12:1390. doi:10.3390/cancers12061390
52. Li J, Condello S, Thomes-Pepin J, Ma X, Xia Y, Hurley TD, et al. Lipid desaturation is a metabolic marker and therapeutic target of ovarian cancer stem cells. Cell Stem Cell (2017) 20:303–14.e5. e5. doi:10.1016/j.stem.2016.11.004
53. Hou J, Williams J, Botvinick EL, Potma EO, Tromberg BJ. Visualization of breast cancer metabolism using multimodal nonlinear optical microscopy of cellular lipids and redox state. Cancer Res (2018) 78:2503–12. doi:10.1158/0008-5472.CAN-17-2618
54. Zhao Z, Shen Y, Hu F, Min W. Applications of vibrational tags in biological imaging by Raman microscopy. Analyst (2017) 142:4018–29. doi:10.1039/c7an01001j
55. Wei M, Shi L, Shen Y, Zhao Z, Guzman A, Kaufman LJ, et al. Volumetric chemical imaging by clearing-enhanced stimulated Raman scattering microscopy. Proc Natl Acad Sci U S A (2019) 116:6608–17. doi:10.1073/pnas.1813044116
56. Gonçalves AC, Richiardone E, Jorge J, Polónia B, Xavier CPR, Salaroglio IC, et al. Impact of cancer metabolism on therapy resistance – clinical implications. Drug Resist Updates (2021) 59:100797. doi:10.1016/j.drup.2021.100797
57. Sharick JT, Walsh CM, Sprackling CM, Pasch CA, Pham DL, Esbona K, et al. Metabolic heterogeneity in patient tumor-derived organoids by primary site and drug treatment. Front Oncol (2020) 10:553. doi:10.3389/fonc.2020.00553
58. Gillette AA, Babiarz CP, Vandommelen AR, Pasch CA, Clipson L, Matkowskyj KA, et al. Autofluorescence imaging of treatment response in neuroendocrine tumor organoids. Cancers (Basel) (2021) 13:1873. doi:10.3390/cancers13081873
59. Sood D, Tang-Schomer M, Pouli D, Mizzoni C, Raia N, Tai A, et al. 3D extracellular matrix microenvironment in bioengineered tissue models of primary pediatric and adult brain tumors. Nat Commun (2019) 10:4529. doi:10.1038/s41467-019-12420-1
60. Wright HJ, Hou J, Xu B, Cortez M, Potma EO, Tromberg BJ, et al. CDCP1 drives triple-negative breast cancer metastasis through reduction of lipid-droplet abundance and stimulation of fatty acid oxidation. Proc Natl Acad Sci U S A (2017) 114:E6556. doi:10.1073/pnas.1703791114
61. Becker L, Fischer F, Fleck JL, Harland N, Herkommer A, Stenzl A, et al. Data-Driven identification of biomarkers for in situ monitoring of drug treatment in bladder cancer organoids. Int J Mol Sci (2022) 23:6956. doi:10.3390/ijms23136956
62. Li J, Lin P, Tan Y, Cheng J-X. Volumetric stimulated Raman scattering imaging of cleared tissues towards three-dimensional chemical histopathology. Biomed Opt Express (2019) 10:4329. doi:10.1364/boe.10.004329
63. Freudiger CW, Pfannl R, Orringer DA, Saar BG, Ji M, Zeng Q, et al. Multicolored stain-free histopathology with coherent Raman imaging. Lab Invest (2012) 92:1492–502. doi:10.1038/labinvest.2012.109
64. Ji M, Orringer DA, Freudiger CW, Ramkissoon S, Liu X, Lau D, et al. Rapid, label-free detection of brain tumors with stimulated Raman scattering microscopy. Sci Transl Med (2013) 5:201ra119. doi:10.1126/scitranslmed.3005954
65. Ji M, Lewis S, Camelo-Piragua S, Ramkissoon SH, Snuderl M, Venneti S, et al. Detection of human brain tumor infiltration with quantitative stimulated Raman scattering microscopy. Sci Transl Med (2015) 7:309ra163–N11. doi:10.1126/scitranslmed.aab0195
66. Vieites-Prado A, Renier N. Tissue clearing and 3D imaging in developmental biology. Development (2021) 148:dev199369. doi:10.1242/DEV.199369
67. Qi Y, Yu T, Xu J, Wan P, Ma Y, Zhu J, et al. Fdisco: Advanced solvent-based clearing method for imaging whole organs. Sci Adv (2019) 5:8355. doi:10.1126/sciadv.aau8355
68. Edwards SJ, Carannante V, Kuhnigk K, Ring H, Tararuk T, Hallböök F, et al. High-resolution imaging of tumor spheroids and organoids enabled by expansion microscopy. Front Mol Biosci (2020) 7:208. doi:10.3389/fmolb.2020.00208
69. Gong L, Lin S, Huang Z. Stimulated Raman scattering tomography enables label-free volumetric deep tissue imaging. Laser Photon Rev (2021) 15:2100069. doi:10.1002/lpor.202100069
70. Chen X, Zhang C, Lin P, Huang KC, Liang J, Tian J, et al. Volumetric chemical imaging by stimulated Raman projection microscopy and tomography. Nat Commun (2017) 8:15117. doi:10.1038/ncomms15117
71. Wei L, Hu F, Chen Z, Shen Y, Zhang L, Min W. Live-cell bioorthogonal chemical imaging: Stimulated Raman scattering microscopy of vibrational probes. Acc Chem Res (2016) 49:1494–502. doi:10.1021/acs.accounts.6b00210
Keywords: label-free, non-linear optical imaging, two-photon excitation fluorescence, second harmonic generation, coherent Raman scattering, three-dimensional cell culture
Citation: Zhao W, Sun D and Yue S (2023) Label-free multimodal non-linear optical imaging of three-dimensional cell cultures. Front. Phys. 10:1100090. doi: 10.3389/fphy.2022.1100090
Received: 16 November 2022; Accepted: 12 December 2022;
Published: 04 January 2023.
Edited by:
Xueli Chen, Xidian University, ChinaReviewed by:
Kun Miao, California Institute of Technology, United StatesTing Li, Chinese Academy of Medical Sciences and Peking Union Medical College, China
Copyright © 2023 Zhao, Sun and Yue. This is an open-access article distributed under the terms of the Creative Commons Attribution License (CC BY). The use, distribution or reproduction in other forums is permitted, provided the original author(s) and the copyright owner(s) are credited and that the original publication in this journal is cited, in accordance with accepted academic practice. No use, distribution or reproduction is permitted which does not comply with these terms.
*Correspondence: Shuhua Yue, yue_shuhua@buaa.edu.cn