Dynamic and high-speed measurement system for blade tip clearance of engine with optical comb
 Jibo Han
 Yu Bai1
 - 1Changcheng Institute of Metrology and Measurement, Beijing, China
- 2School of Instrumentation and Optoelectronic Engineering, Beihang University, Beijing, China
For blade tip clearance measurement, the optical measurement method has the characteristics of high precision, anti-electromagnetic interference, and non-contact measurement. A dynamic and high-speed blade tip clearance measurement system based on time stretch dispersive Fourier transform with the optical comb is proposed and demonstrated. The dynamic experiments are designed to verify the accuracy of the system. The results show that the measuring speed is up to 17.6 MHz and the measurement errors are less than 1 μm under dynamic conditions. The experiments prove that the system has the advantages of high measurement accuracy, high speed, and good repeatability. It can provide a new tool for engine health monitoring.
1 Introduction
The aero-engine, known as the Pearl of the industrial crown, is regarded as one of the leading technologies relating to industry development. Specifically, the blade is a critical component of the aero-engine. Working in a harsh environment for a long time, the blade will be affected by the air force generated by its separation force, air or gas flow. These forces will continuously affect the operating state of the blade [1]. Excessive tip clearance will reduce engine efficiency, consume more fuel, and even cause a surge. But the blade tip clearance is too small to cause friction between the blade and the inner wall of the casing, even affecting the operation safety of the engine. Therefore, in the production and application of the engine, it is necessary to monitor the blade tip clearance in real time to obtain the blade operation status. It would provide a strong guarantee for the safe operation of the aero-engine [2, 3]. Common measurement methods include non-optical measurement and optical measurement. The former mainly consists of the discharge probe measurement method, eddy current measurement method, microwave measuring method, and capacitance measurement method. The latter mainly includes reflection intensity measurement, and interference measurement [4–6].
The discharge probe method uses the DC discharge principle of the sensing probe to measure the tip clearance [7]. Sheard applied this method to the tip clearance measurement system of the engine [8]. Based on the principle of electromagnetic induction, the eddy current sensor obtains the tip clearance information by detecting the change of pick-up signal. The American HOOD company has developed two kinds of eddy current sensing probes, which can meet the requirements of different ambient temperatures [9]. The typical sensing probe can withstand 260°C, and the other sensing probe is equipped with an air cooling device, which can support temperatures above 1,000°C in the actual working environment. The microwave measurement method uses a microwave sensor to transmit a microwave signal to the blade, receives signals reflected from the blade tip, and analyzes blade tip clearance. Glenn Institute has developed a high-temperature microwave tip gap probe, which can meet the requirements of a 900°C high-temperature environment [10]. Capacitive measurement technology obtains the blade tip clearance by detecting the change of capacitance between the pole core of the sensor and the blade end face. A capacitance sensor has been developed for tip clearance measurement in harsh environments with a measurement range of 0.3–3 mm and a measurement accuracy of 15 μm [11, 12].
Due to the development of optical measurement and detection technology, researchers began to use optical fiber sensors for tip clearance measurement. Through the emission optical fiber, the reflection intensity detection type sensor probe irradiates the laser light on the blade end face to detect the optical signal reflected from the blade end face [13, 14]. An optical fiber blade tip clearance sensor for active clearance has been used, and the sampling rate is about 100 kHz, and its resolution ratio is better than 0.01 mm [15]. In addition, the China Electronics Technology Group Corporation and Tianjin University have made progress in this field [16, 17]. The interferometric measurement method is based on interferometric ranging technology and uses the common path interferometer as the detection system. The interferometer with this structure easily aligns the optical path and reduces the vibration impact of the mechanical design. A prototype was built and tested for monitoring tip clearances, and the spatial resolution of the sensor reaches 10 μm, and the measurement accuracy is up to 4 μm [18].
With the emergence and development of optical frequency comb, some new distance measurement methods have been proposed [19–21], and they are promising for blade tip clearance measurement. In this paper, we introduce a method of tip clearance measurement system based on time stretch dispersive Fourier transform (TSDFT). The steps machined at the top of the blade are used to verify the dynamic measurement accuracy at different rotating speeds. The experiment results show that the system has the characteristics of high measurement accuracy and good measurement repeatability, and it provides a new method for tip clearance measurement.
2 Measurement principles and experiments set up
The wideband spectral shape of the ultrashort optical pulse, which is a Fourier transform limited pulse, can be mapped onto the time-domain waveform [22, 23], when the pulse travels through a dispersive medium that has sufficiently large dispersion, the stretched pulse has the same shape as the spectrum intensity envelope [24]. In this process, the dispersive medium serves as a pulse stretcher to implement something similar to the Fourier transform, so the technology is called the time stretch dispersive Fourier transform [25]. It has been used for measuring Fast and continuous events because it overcomes the traditional optical instruments’ measurement rate limit.
The optical comb, whose pulse repetition rate and carrier-envelope offset frequency of mode-locked femtosecond laser are locked to reference frequency standard, has the characteristics of ultra-short pulse width, high repetition rate, wide spectrum, and ultra-high peak power [26]. The peculiar property of the optical comb makes the comb become an ideal light source for the measurement system of TSDFT. The dispersion elements can be implemented using a variety of optical devices, such as single-mode optical fiber, dispersion compensation fiber, chirped fiber Bragg gratings [27], spatially chirped dispersion systems (grating or prism pairs) [28], and multimode waveguide dispersion systems [29, 30]. Single-mode optical fiber with low loss and high mechanical stability is the simplest and most commonly used method to realize TSDFT [31]. Usually, several fiber amplifiers are added to the system to compensate for the loss of optical energy [32].
As shown in Figure 1, we describe the tip clearance measurement system principle based on TSDFT. Provided that there are no nonlinear phenomena, the femtosecond pulses can realize wavelength-to-time mapping in the system. The pulse emitted by the optical comb enters a Mach-Zehnder interferometer and is divided into two beams by the first optical fiber coupler (C1), whose beam splitting ratios are 1 percent and 99 percent; the one that has higher energy enters the measurement arm and is transmitted to the first port of the optical fiber circulator (CIR). A fiber focusing lens (FFL) connected to the second port of the circulator sends the measurement pulse to the blade tip and collects the reflected light pulse. The return pulse that carries the information of blade tip clearance d propagates to the third port of the circulator.
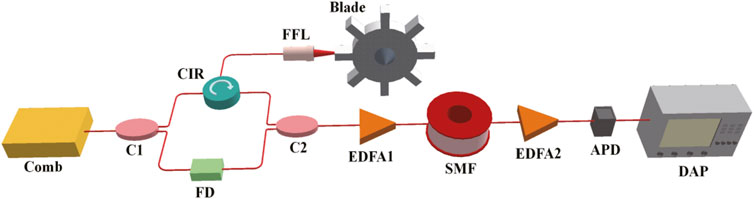
FIGURE 1. Schematic diagram of the tip clearance measurement system principle based on TSDFT. C: Coupler; CIR: Circulator; FD: Fiber delayer; FFL: Fiber focusing lens; EDFA: Erbium-doped fiber amplifier; SMF: Single-mode fiber; PD: Photodetector; DAP: Data acquisition and processing unit.
The other beam enters the reference arm, where a fiber delay line (FD) is placed to adjust the optical path to match that of the measurement arm, so the dispersion of the reference pulse and the measurement pulse from the third port is balanced when the two pulses converge at the second fiber coupler (C2). At the same time, the influence of pulse time jitter is avoided.
Before entering the dispersive medium, the confluent pulses are preamplified using an erbium-doped fiber amplifier (EDFA1). A roll of single-mode fiber (SMF) is applied to make the ultrashort pulses disperse into a wide pulse. The two pulses overlap and interfere in the time domain, and the interference signal consists of the time delay between the two pulses. The interference signal is amplified by the second erbium-doped fiber amplifier (EDFA2), and it is detected by a Photodetector (PD) and Sent to the data acquisition and processing unit (DAP) for signal processing.
The reference pulse and the measurement pulse can be respectively expressed as:
where E(t) and E (t-τ) is the electrical field. Where a and b are the power factors. The time-domain interference signal detected by photodetector can be expressed by:
Where ω is the angular frequency and can be expressed as τ/β2L [33], β2 is the second-order dispersion coefficient, L is the fiber length, τ is the time delay of the measurement pulse relative to the reference pulse, and the time delay can be written as τ = 2πβ2Lf, f is the frequency of the interference signal. It can be obtained by the Fourier transform of the interferogram. In the description of optical fiber parameters, the dispersion parameter D is Commonly used to represent dispersion, and the relation between D and β2 is D = −2πcβ2/λ2, λ is the center wavelength of the optical pulse, c is the speed of light in vacuum. The blade tip clearance is explicitly given as d = cτ/2ng, with ng being the refractive index of air. Substitute τ into the above equation d turns to be:
According to Eq. 3, it can be found that the factors affecting the measurement range mainly include |DL| and f; the measurement range is limited by the bandwidth of the detector and acquisition card when |DL| are determined. On the other hand, the larger the |DL|, the greater the measurement range.
Figure 2 shows the experimental setup. In the experiment, a homemade optical comb has a repetition rate of 17.6 MHz, a center wavelength of 1559 nm, and average output power of 15 mw. The optical comb emits a pulse, and the system can complete one measurement, so the measurement rate is very high and equal to the repetition rate of the pulse. To eliminate the nonlinearity of femtosecond pulses in the fiber, the output power of the optical comb must be controlled [34]. The amount of dispersion per wavelength can be represented as the product of the group velocity dispersion parameter D and the fiber length L. The larger the product, the more obvious the pulse broadening; in our experimental setup, the product |DL| is 250 ps/nm. Because the higher-order dispersion is minimal, the effect of the higher-order dispersion is not considered in the experiment.
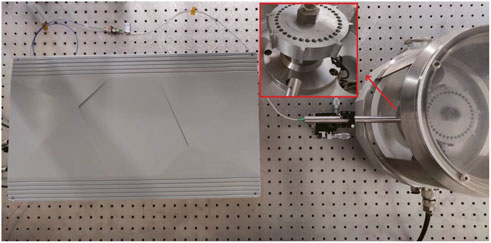
FIGURE 2. The experiment setup for tip clearance measurement system based on TSDFT.
The main factors affecting the clearance variation are rotor unbalance, casing deformation, thermal expansion, machining, and assembly accuracy. During the operation of an aero-engine, the change of tip clearance is very complicated due to the deformation of each component under different temperatures and stress, and it is difficult to assess the accuracy of the measurement. We design a verification experiment of dynamic measurement accuracy. As shown in the red box in Figure 2, the simulated blades are placed on a high-speed rotating motor, and the steps have different heights machined at the top of the blade. The height difference between the two faces of the step can be accurately calibrated under static conditions. The measurement line is marked in the center of the steps to ensure that the measurement position should be the same as possible under static and dynamic conditions. Because the two faces of the step are on the same blade, it can be considered to be affected equally when the blade tip is rotating at high speed.
The bandwidth of the photodetector is 18 GHz. Since the steps machined at the top of the blade have a smaller height, the sampling rate of data acquisition and processing unit is 2.6 GHz. But if the larger tip clearances are measured, a higher sampling rate acquisition card must be used. The environmental conditions are 20.0°C, 1013.2 h Pa, and 50.0% humidity. The group refractive index of air can be calculated as 1.0002694 based on the Ciddor formula [35]. The speed of light in vacuum c is 299792458 m/s.
3 Experimental results
The blade tip clearance is measured when the blade passes through the probe. Dynamic clearance measurement signals are shown in Figure 3. Figure 3A shows several consecutive clearance measurement signals when the blade tip rotates at high speed. Each cluster signal contains all the measured signals of a blade tip. We spread it out in the time domain, and all the signals of a blade tip are shown in Figure 3B. Continuing to spread, we get the signals of the two faces of the step in one blade tip in Figure 3C. It can be found simply that the frequency of the two signals has a slight difference.
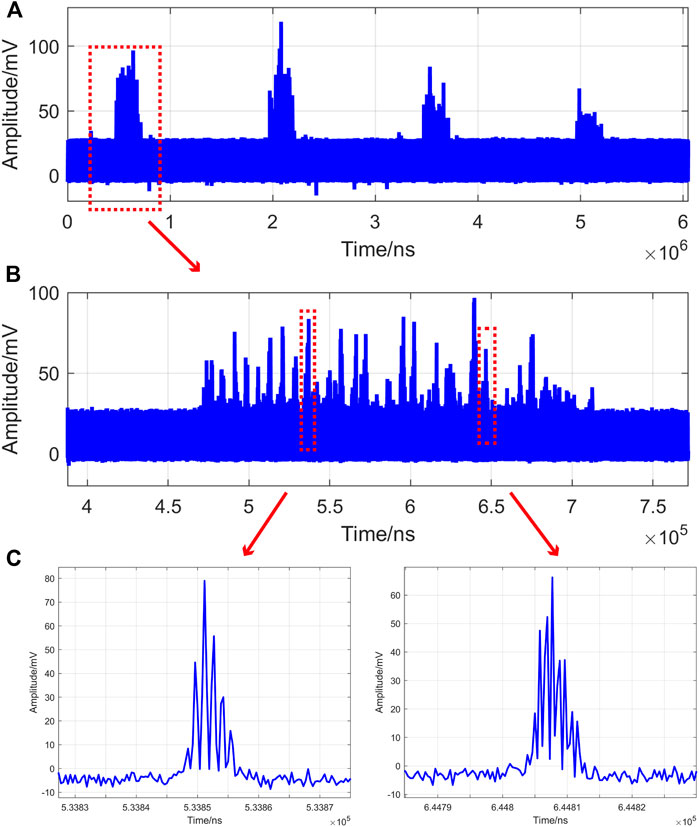
FIGURE 3. Dynamic clearance measurement signals. (A) The signals of several blade tips. (B) The signals of one blade tip. (C) The signals of the two faces of step in one blade tip.
For the time-domain signals in Figure 3C, we perform Fourier transform on it to obtain frequency-domain signals. Because the energy of measured light received is unstable and weak, the signals are usually not smooth and sharp enough to get the exact frequency of measurement signals. The frequency-domain clearance measurement signal is shown in Figure 4, after the signal is filtered and fitted, the exact frequency is obtained by peak-seeking operation, and we can calculate the value of the tip clearance according to Eq. 3.
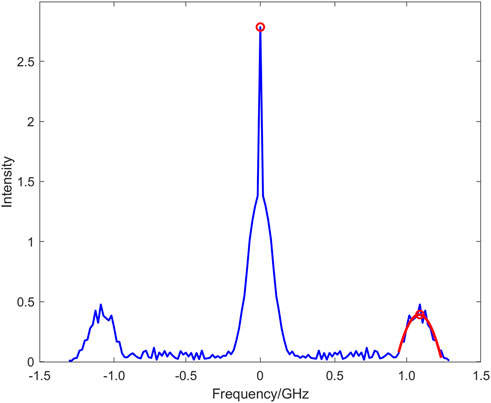
FIGURE 4. Frequency-domain clearance measurement signal.
Figures 5A, B show the measurement results of two faces of step 1 and step 2 at the same rotation, respectively. The measured trajectory is a curve rather than a straight line because the step surface is a plane rather than a circular arc camber, so each measurement result on the same surface is not equal to the blade rotating. Another reason is the unevenness caused by machining.
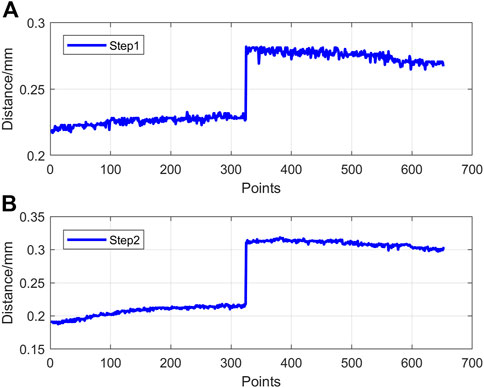
FIGURE 5. (A) The results of two faces of step 1. (B) The results of two faces of step 2.
The calibration heights of step 1 and step 2 are 0.04988 mm and 0.10507 mm, respectively. In the experiment, we eliminate the outliers caused by the low signal-to-noise ratio and use the average of all face results as the measurement result. Compared with calibration results, the heights error of step 1 and step 2 are shown in Figure 6, when the rotation speed is from 500 RPM to 5000 RPM at 500 RPM intervals. The experimental results show that the measurement error is less than 1 μm.
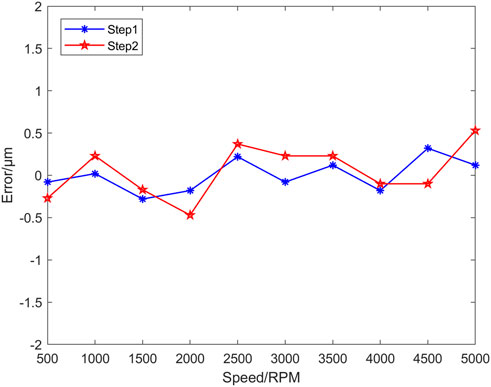
FIGURE 6. The height error of step 1 and step 2 under different rotation speeds.
Ten times measurements were made at each rotation speed and used to calculate the repeatability. The repeatability of measurements of step 1 and step 2 are shown in Figure 7 with the rotation speed from 1000 RPM to 5000 RPM at 1000 RPM intervals. The results show that the measurement repeatability is also better than 1 μm. It is proved that the system has superior measurement repeatability.
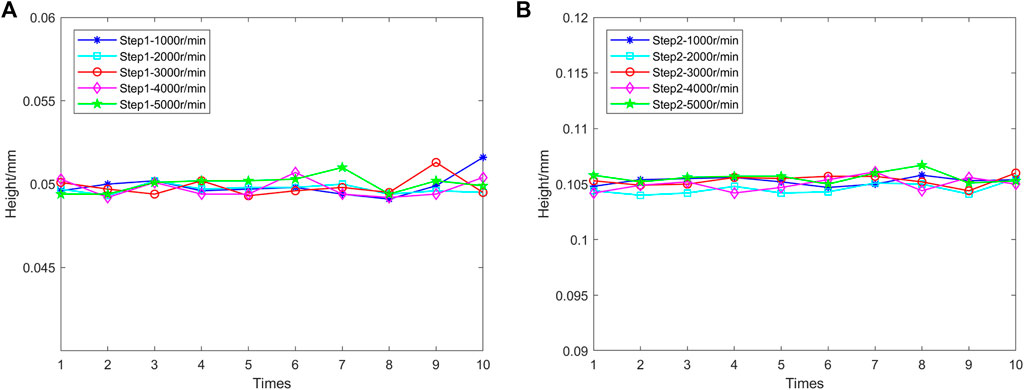
FIGURE 7. (A) The repeatability of measurements of step 1 under different rotation speeds. (B) The repeatability of measurements of step 2 under different rotation speeds.
4 Conclusion
In this paper, the system based on TSDFT is used to measure blade tip clearance variation When the blade rotates at high speed. The experimental results show that this system has the advantages of high measurement accuracy, high speed, and good repeatability. Furthermore, the data acquisition card’s sampling rate and the detector’s bandwidth are reduced. Up till now, the TSDFT has been widely used in various applications, such as microwave spectrum sensing measurement, real-time spectroscopy, ultra-fast continuous imaging, analog-to-digital conversion, non-linear kinetic, etc.
Data availability statement
The original contributions presented in the study are included in the article/Supplementary Material, further inquiries can be directed to the corresponding author.
Author contributions
JH was responsible for the design and implementation of the experiment, and manuscript writing. TW provided inspiration for the theory of the experiment. YB did the data processing and drawing, and participated in the revision of the manuscript. LL and YW assisted in the experiment. ZC made some suggestions for the preparation of the manuscript.
Funding
This work was supported by the Aviation fund of Aviation Industry Corporation of China Ltd.
The authors declare that this study received funding from Aviation Industry Corporation of China Ltd. The funder was not involved in the study design, collection, analysis, interpretation of data, the writing of this article, or the decision to submit it for publication.
Conflict of interest
The authors declare that the research was conducted in the absence of any commercial or financial relationships that could be construed as a potential conflict of interest.
The reviewer LW declared a shared affiliation with the author JH to the handling editor at the time of review.
Publisher’s note
All claims expressed in this article are solely those of the authors and do not necessarily represent those of their affiliated organizations, or those of the publisher, the editors and the reviewers. Any product that may be evaluated in this article, or claim that may be made by its manufacturer, is not guaranteed or endorsed by the publisher.
References
1. García I, Beloki J, Zubia J, Aldabaldetreku G, Illarramendi M, Jimenez F. An optical fiber bundle sensor for tip clearance and tip timing measurements in a turbine rig. Sensors (2013) 13(6):7385–98. doi:10.3390/s130607385
2. Yu B, Ke HW, Shen EY, Zhang T. A review of blade tip clearance–measuring technologies for gas turbine engines. Meas Control (2020) 53(3-4):339–57. doi:10.1177/0020294019877514
3. Jia BH, He L, Feng Y, Zhai J, Qiang G. The development of aero-engine tip-clearance measurement technology: A simple review[C]. In: Proceeding of the 2017 13th IEEE International Conference on Electronic Measurement & Instruments (ICEMI); October 2017; Piscataway, NJ. IEEE Press (2017). p. 565–70.
4. Yu-zhen M, Yong-kui Z, Guo-ping L, Hua-guan L. Tip clearance optical measurement for rotating blades. In: Msie 2011. IEEE (2011). p. 1206–8.
5. Ye DC, Duan FJ, Guo HT, Li Y, Wang K. Turbine blade tip clearance measurement using a skewed dual-beam fiber optic sensor. Opt Eng (2012) 51(8):081514. doi:10.1117/1.oe.51.8.081514
6. Kempe A, Schlamp S, Rösgen T, Haffner K. Low-coherence interferometric tip-clearance probe. Opt Lett (2003) 28(15):1323–5. doi:10.1364/ol.28.001323
7. Davidson DP, Derose RD, Wennerstrom AJ. The measurement of turbomachinery stator-to-drum running clearances[C]. In: Proceeding of the ASME 1983 International Gas Turbine Conference and Exhibit; March 1983; Phoenix, Arizona, USA (1983).
8. Sheard AG, Turner SR. Electromechanical measurement of turbomachinery blade tip-to-casing running clearance[C]. In: Proceeding of the 37th International Gas Turbine and Aeroengine Congress and Exposition; June 1992; Cologne, Germany (1992).
9. Kam C, Donald L. Turbo-machinery tip-timing comes of age[J]. Maintenance &Asset Manag (2009) 24(1):34–40.
10. Woike M, Roeder JM, Hughes CE, Bencic TJ. Testing of a microwave blade tip clearance sensor at the NASA Glenn Research Center. In: Proceeding of the 47th AIAA Aerospace Sciences Meeting including The New Horizons Forum and Aerospace Exposition; January 2009; Orlando, Florida (2009).
11. Steiner A. Techniques for blade tip clearance measurements with capacitive probes. Meas Sci Technol (2000) 11:865–9. doi:10.1088/0957-0233/11/7/303
12. Li J, Guo G, Duan F, Niu G, Shao X, Zhou C, et al. A novel self-adaptive, multi-peak detection algorithm for blade tip clearance measurement based on a capacitive probe. Meas Sci Technol (2021) 32(8):085006. doi:10.1088/1361-6501/abcad6
13. Jia B, Lei H. An optical fiber measurement system for blade tip clearance of engine. Int J Aerospace Eng (2017) 2017:1–9. doi:10.1155/2017/4168150
14. Jia B, He L, Yan G, Feng Y. A differential reflective intensity optical fiber angular displacement sensor. Sensors (2016) 16(9):1508. doi:10.3390/s16091508
15. Binghui J, Xiaodong Z. An optical fiber blade tip clearance sensor for active clearance control applications. Proced Eng (2011) 15:984–8. doi:10.1016/j.proeng.2011.08.182
16. Zhang C, Zhou L, Wei HU. Development of the optical fiber blade vibration sensing probe for aero-engine[J]. J China Acad Elect Inf Tech (2011) 6 (2), 217–220.
17. Duan F, Zhang J, Jiang J, Guo H, Ye D. Method to improve the blade tip-timing accuracy of fiber bundle sensor under varying tip clearance. Opt Eng (2016) 55(1):014106. doi:10.1117/1.oe.55.1.014106
18. Vakhtin A, Chen SJ, Massick S. Optical probe for monitoring blade tip clearance. In: Proceeding of the 47th AIAA Aerospace sciences meeting including the new horizons forum and aerospace exposition; January 2009; Orlando, Florida (2009). p. 507.
19. Matsukuma H, Madokoro S, Astuti WD, Shimizu Y, Gao W. A new optical angle measurement method based on second harmonic generation with a mode-locked femtosecond laser. Nanomanuf Metrol (2019) 2(4):187–98. doi:10.1007/s41871-019-00052-4
20. Joo KN, Kim SW. Absolute distance measurement by dispersive interferometry using a femtosecond pulse laser. Opt Express (2006) 14(13):5954–60. doi:10.1364/oe.14.005954
21. Jang YS, Kim SW. Distance measurements using mode-locked lasers: A review. Nanomanuf Metrol (2018) 1(3):131–47. doi:10.1007/s41871-018-0017-8
22. Huang C-P, Kapteyn HC, Mclntosh JW, Murnane MM. Generation of transform-limited 32-fs pulses from a selfmode-locked Ti: Sapphire laser. Opt Lett (1992) 17(2):139–41. doi:10.1364/ol.17.000139
23. Jannson T. Real-time Fourier transformation in dispersive optical fibers. Opt Lett (1983) 84:232–4. doi:10.1364/ol.8.000232
24. Wang C. Dispersive Fourier transformation for versatile microwave photonics applications [C]. In: Proceedings of the Photonics. Basel, Switzerland: Multidisciplinary Digital Publishing Institute (2014). p. 586–612.
25. Goda K, Jalali B. Dispersive Fourier transformation for fast continuous single-shot measurements. Nat Photon (2013) 7(2):102–12. doi:10.1038/nphoton.2012.359
26. Wei Z. The 2005 Nobel prize in physics and optical frequency comb techniques. PHYSICS-BEIJING- (2006) 35:213.
27. Muriel MA, Azaña J, Carballar A. Real-time Fourier transformer based on fiber gratings. Opt Lett (1999) 24(1):1–3. doi:10.1364/ol.24.000001
28. Gu X, Akturk S, Trebino R. Spatial chirp in ultrafast optics. Opt Commun (2004) 242(4-6):599–604. doi:10.1016/j.optcom.2004.09.004
29. Jalali B, Mahjoubfar A. Tailoring wideband signals with a photonic hardware accelerator. Proc IEEE (2015) 1037:1071–86. doi:10.1109/jproc.2015.2418538
30. Diebold ED, Hon NK, Tan Z, Chou J, Sienicki T, Wang C, et al. Giant tunable optical dispersion using chromo-modal excitation of a multimode waveguide. Opt Express (2011) 1924:23809–17. doi:10.1364/oe.19.023809
31. Saperstein RE, Panasenko D, Fainman Y. Demonstration of a microwave spectrum analyzer based on time-domain optical processing in fiber. Opt Lett (2004) 29(5):501–3. doi:10.1364/ol.29.000501
32. Solli D, Chou J, Jalali B. Amplified wavelength–time transformation for real-time spectroscopy. Nat Photon (2008) 2(1):48–51. doi:10.1038/nphoton.2007.253
33. Xia H, Zhang C. Ultrafast ranging lidar based on real-time Fourier transformation. Opt Lett (2009) 34(14):2108–10. doi:10.1364/ol.34.002108
34. Zhao L, Xia H, Hu Y, Wu T, Zhang Z, Han J, et al. Time-stretched femtosecond lidar using microwave photonic signal processing. J Lightwave Technol (2020) 38(22):6265–71. doi:10.1109/jlt.2020.3012439
Keywords: optical comb, blade tip clearance, dynamic measurement, high-speed measurement, dispersive fourier transform
Citation: Han J, Bai Y, Lv L, Wu T, Wu Y, Cao Z and Yang Y (2022) Dynamic and high-speed measurement system for blade tip clearance of engine with optical comb. Front. Phys. 10:1036485. doi: 10.3389/fphy.2022.1036485
Received: 04 September 2022; Accepted: 05 December 2022;
Published: 21 December 2022.
Edited by:
Hainian Han, Institute of Physics (CAS), ChinaCopyright © 2022 Han, Bai, Lv, Wu, Wu, Cao and Yang. This is an open-access article distributed under the terms of the Creative Commons Attribution License (CC BY). The use, distribution or reproduction in other forums is permitted, provided the original author(s) and the copyright owner(s) are credited and that the original publication in this journal is cited, in accordance with accepted academic practice. No use, distribution or reproduction is permitted which does not comply with these terms.
*Correspondence: Tengfei Wu, tengfei.wu@163.com