Information Content in Stochastic Pulse Sequences of Intracellular Messengers
 Alan Givré1,2
  Silvina Ponce Dawson1,2*
- 1Departamento de Física, FCEN-UBA, Buenos Aires, Argentina
- 2IFIBA, Consejo Nacional de Investigaciones Científicas y Técnicas, UBA, Buenos Aires, Argentina
Many cell signaling pathways rely on oscillatory messenger concentrations even to transduce aperiodic environmental changes. The universal second messenger calcium, Ca2+ often exhibits pulsatile behavior in the presence of constant concentrations of external ligands such as hormones or neurotransmitters. The analysis of intracellular Ca2+ pulses that involve Ca2+ release through inositol 1,4,5-trisphosphate (IP3) receptors led to a model with stochastic pulse firing at rate, λ and deterministic inhibition with recovery at rate, ρ. Here we combine this model with recent observations that established an exponential relationship between λ and the external ligand concentration, C. We compute analytically the mutual information between C and the interpulse time, t, or the number of pulses, N, in the λ/ρ ≪ 1 and λ/ρ ≫ 1 limits. We obtain that both I(C, t) and I(C, N) are largest in the second limit with a difference of at most ~1bit. Thus, the resolution with which the values of C can be discriminated at most doubles in one limit with respect to the other. The components of the model and the exponential dependence of the firing rate with C are features common to noise-driven excitable systems. Our results thus hold in this more general setting that applies widely in biology.
1. Introduction
Living organisms respond and react to changes in their environment. They do so by decoding the information contained in these changes. This process occurs at all levels, including single cells. Cell signaling malfunction can result in pathologies. Understanding this information processing is thus important from basic and applied viewpoints. Changes in the environment are usually reflected in changes in the concentration of substances that bind to receptors on the plasma membrane. Changes in this binding lead to changes in the cell and, through a signaling cascade, to the response. The traditional view of this process assumes that step-like changes in the ligand concentration produce intracellular concentration changes that increase with the initial step size. This is called amplitude modulation encoding. Step-like changes in external effectors, however, can induce oscillations in some intermediaries [1–4]. This is called frequency modulation encoding. This mechanism is quite prevalent in the case of Ca2+ signals [5, 6] where oscillations in the intracellular Ca2+ concentration are known to regulate enzyme activity [7, 8] and increase gene expression efficiency [9]. Some pathways also generate responses using amplitude [10] and frequency encoding [11] redundantly.
Intracellular Ca2+ oscillations in non-excitable cells usually involve Ca2+ release from the endoplasmic reticulum (ER) through inositol trisphosphate (IP3) receptors (IP3Rs) [12]. IP3R-Ca2+ channels need to bind IP3 and Ca2+ on their cytosolic side to become open. This implies that the opening of neighboring IP3Rs becomes coupled via the released Ca2+ in what is known as Calcium Induced Calcium Release [13]. Most often IP3Rs are organized in clusters that are ~1.5−2μm apart. Ca2+ signals then range from blips and puffs to waves depending on whether Ca2+ is released from one or many clusters [14–16]. Ca2+-mediated inter-cluster coupling is fundamental for the propagation of waves as reflected by the changes that slow Ca2+ buffers induce on the signals [17–19]. The transition from local to global signals is like a percolation process [20] in which the accumulated free cytosolic Ca2+ reduces the percolation threshold [21]. Thus, the cytosol acts as an excitable medium whose excitability is modulated by Ca2+ and where Ca2+ pulses or spikes are the result of wave nucleation [22].
In the sustained presence of external effectors, such as hormones or neurotransmitters, cells can exhibit sequences of intracellular Ca2+ pulses. There is strong evidence that, most often, the interpulse times have a large random component [22–25]. Randomness is a consequence of the highly stochastic and spatially local Ca2+ release events (puffs) that eventually lead to a propagating Ca2+ wave or pulse [26]. Waves are then followed by an inhibitory process that acts globally in space [22, 24]. In order to account for these two processes, the model introduced in Skupin and Falcke [22] combines the stochastic “firing” of the pulses with a deterministic description of the inhibition. In this paper we use the model of Skupin and Falcke [22] together with more recent observations that show an exponential dependence between the mean interpulse time and the external effector concentration, C [25], to study the mutual information between C and some properties of the pulse sequence. We derive analytic results in two opposite limits that depend on the ratio between two timescales: the firing rate in the absence of inhibition, λ, and the rate of recovery from inhibition, ρ. For ρ/λ ≫ 1, pulse occurrence is limited by λ and the process is Poisson. For ρ/λ ≪ 1, pulse occurrence is limited by recovery from inhibition. We call this the Global Negative Feedback (GNF) limit. Fixing the value of the mean interpulse time, T, and considering the least informative distribution for C (uniform between 0 and a maximum value) we determine that the mutual information is largest in the GNF limit. The difference with respect to the Poisson limit is of, at most, ~1bit. This implies that the precision with which C can be inferred is at most twice as large in one limit with respect to the other. If we fix the firing rate, λ, instead we obtain the same mutual information between the interpulse time and C in the Poisson and the GNF limits. We discuss later the implications of these results. The co-existence of stochastic firing and deterministic recovery from inhibition is common to many systems, particularly, noise-driven excitable ones [27]. These systems, a paradigmatic example of which is neurons, appear in various settings. Thus, we think that our results are applicable beyond the case of intracellular Ca2+ pulses.
2. Methods
2.1. The Model
We consider the model of Skupin and Falcke [22] where the probability density that a pulse occurs at time, t + Tcell, after a previous one is:
with Tcell deterministic, λ the probability per unit time that a pulse occurs in the absence of inhibition, ρ the rate of recovery from inhibition and p(t|λ) the conditional probability density of t for a given λ. We study the Global Negative Feedback (GNF) limit (x ≡ λ/ρ ≫ 1) and the Poisson one (x ≪ 1). For the latter the t distribution is exponential with mean 1/λ. Based on Thurley et al. [25], we assume that:
with C the effector concentration, 〈·〉|t|λ the mean over the distribution, p(t|λ) and A and B constant. Equation (2) implies that λ and C are related by (see Supplementary Material):
with α = π/(2ρA2), β = 2B (α = 1/A and β = B) in the GNF (Poisson) limit. The λ, T and C probability densities then satisfy:
In both limits, T, and the t standard deviation, σ, satisfy [22]:
k = 1 in the Poisson case. We obtain in the GNF limit (see Supplementary Material).
2.2. Calculations
After deriving properties of the model we compute the mutual information [28]:
where
with p{t, λ} the t, λ joint probability density. We obtain general expressions and then use:
We then compute I(C, N) = I(T, N), with N ≫ 1 the number of pulses that occur during a time, ttot≫T, dropping Tcell and using Equation (8).
All calculations are performed assuming constant C, A, B, and ρ and are valid if the C variation timescale is larger than T. We present a detailed description in the Supplement.
2.3. Numerical Simulations
We wrote a code in R to compute I(N, C) numerically using A = 1, B = 1 and various ttot ≤ 1000. 500 realizations were done setting T = e−C for each of the 100 C values randomly chosen with uniform probability in [0, 1]. We used ρ = 0.01, λ = 50πexp(C) for the GNF limit and no ρ and λ = exp(C) for the Poisson one. Thus, 1/e ≤ T ≤ 1 in both limits. We discretized time with time step, dt = 0.01, and decided with probability λdt that a pulse occurred at each time step in the Poisson limit and with probability λ(1 − exp(−ρ(t − tprev)))dt with tprev the time at which the previous pulse occurred in the GNF one. We counted the total number of pulses, N, for each realization and binned the results with boxes of ttot-dependent sizes. We used the DescTools package [29] to compute the mutual information between the values of N obtained and those of C.
3. Results
Here we compare the results on mutual information obtained for the model of section 2.1 in the Poisson (x = λ/ρ ≪ 1) and the GNF (x ≫ 1) limits.
3.1. Information Contained in the Interpulse Time
The calculations of the Supplementary Material yielded, in both limits:
with , given by:
and
Equations (9)–(11) imply that I(C, t) is independent of α. As shown in the Supplementary file, it is also independent of 〈C〉. The fact that Equations (9)–(11) read similarly regardless of the limit does not mean that the information is the same in both cases: given T and C, the value, λ, is different depending on the limit (see Equation 3). The fact that I depends on β but not on α and that β = B in the Poisson limit and β = 2B in the GNF one implies that by simply multiplying β by 2 in I(C, t), we go from one limit to the other for the same value of B. Assuming that pC = δ(C − 〈C〉) we obtain I(C, t) = 0 in the two limits. If we assume the least informative distribution for C (Equation 8) we obtain:
We show in Figure 1 this mutual information as a function of βCM for the two limits of the model. There we observe that it is always larger in the GNF limit and that the difference increases with βCM approaching ~1bit. As discussed in the Supplementary file, I(C, t) should increase with βσC, with σC the C standard deviation, for any pC(C).
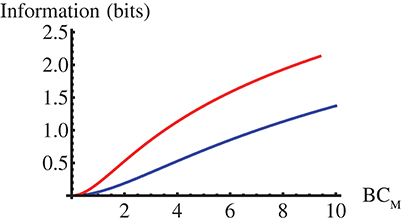
Figure 1. Mutual information, I(C, t) in Equation (12), between the effector concentration, C, and the stochastic part of the interpulse time, t, as a function of CM for the Poisson (blue) and the GNF (red) limits of the model with C uniformly distributed over [0, CM].
3.2. Information Contained in the Number of Pulses, N, That Occur During an Interval
The calculations of the Supplementary Material yielded, for the mutual information between C and N for a given observation time, ttot and N ≫ 1:
with H the entropy as in Equation (6) and k = 1 () for the Poisson (GNF) limit. In this case,for a given distribution, pT(T) or, equivalently, pC(C), the only difference between the Poisson and GNF limits lies on the constant of proportionality, k, between the standard deviation, σ and the mean, T, of the (stochastic part of the) interpulse time. We probed the analytic calculation via numerical simulations performed as described in Methods. We show the results in Figure 2. There we observe that, also in this case, I is larger for the GNF than for the Poisson limit and that the difference increases very slowly with ttot approaching the asymptotic value prescribed by the theory, ΔI = −log2(4/π − 1)/2 ≈ 0.936. The fitting curves confirm this and the dependence of I on ttot, in particular, the term that we attribute to the skewness of the N probability density that is not included when using the normal approximation.
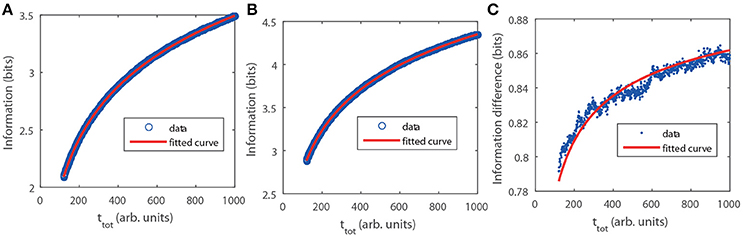
Figure 2. Mutual information, I(N, C|ttot), as a function of ttot obtained numerically with pC given by Equation (8), A = 1, B = 1 and CM = 1 (see section Methods). (A) Poisson limit. Circles are the result of the simulation. The fitting (solid) curve of the form gave a = (−1.6111 ± 0.0011) and b = (1.2275 ± 0.0086). (B) Similar to (A) but for the GNF limit with ρ = 0.01. The fitting gave a = (−0.69121 ± 0.00076) and b = (0.6061 ± 0.0058). (C) Information difference between both limits. In this case the fitting curve is with b = (−0.741 ± 0.022).
4. Discussion and Conclusions
Intracellular information is encoded in the oscillation frequency of messengers in many instances. This is the case of Ca2+, whose cytosolic concentration responds with sequences of pulses to the presence of constant concentrations of external effectors such as hormones or neurotransmitters. The statistical properties of the interpulse times have been studied theoretically and experimentally finding that they usually have a stochastic component, t, whose mean, T, and standard deviation, σ, are linearly related (Equation 5) [22–25]. The simple model [22] that includes the stochastic “firing” of the pulses with rate , λ, in the absence of inhibition, followed by immediate inhibition and subsequent recovery with rate, ρ [Equation 1 captured most features of the process. Here we combined this model with the observed dependence between T and the effector concentration, C, to compare the mutual information between C and the interpulse time, I(C, t), or the number of pulses, I(C, N), in the GNF (λ/ρ ≫ 1) and Poisson (λ/ρ ≪ 1) limits. We obtained that I(C, t) and I(C, N) were larger in the GNF limit and that the difference was at most ~1bit (it was < 0.5 for the values, BCM ~ 1.6, explored experimentally in [25]]. This ~1bit difference means that the precision with which the effector concentration is inferred can at most double as the recovery rate is reduced while the mean, T, is kept fixed. In the case of I(N, C) the ~1bit difference is independent of pC(C) (Equation 13) and determined by the slope, k, of the (linear) relationship between σ and T. We derived k analytically in both limits. The simulations of Skupin and Falcke [22] and Thurley and Falcke [24] show that this slope decreases monotonically when λ/ρ is increased. Thus, the information we obtain in the GNF limit should be the largest. In the GNF limit inhibition recovery is the rate-limiting process of pulse occurrence. Following the assumption that inhibition occurs globally in space, the model describes inhibition recovery deterministically. It is then reasonable that the standard deviation of the interpulse time decrease as the rate-limiting process goes from being purely stochastic (limited by λ) to being more deterministic (limited by ρ). Having a more predictable interpulse time for a given, C, should result also in a more faithful transmission of the information as we have found. As discussed in Thurley and Falcke [24] the existence of a global inhibition process is fundamental for the functional robustness of the signaling. Namely, it is the reason why Equation (5) holds with the same k for individual cells of the same type. Equation (9) also implies that, if ρ is varied for fixed λ (not T), there is no gain in the mutual information between t and C. This means that by solely reducing the recovery rate (e.g., by changing the level of expression of proteins involved in the inhibition) cells would increase the interpulse time and its variance without changing the information they could draw from the environment.
4.1. Resource Identification Initiative
Computations and figures were performed using R, RRID:SCR_001905, Wolfram Mathematica, RRID:SCR_014448, and MATLAB, RRID:SCR_001622.
Author Contributions
SP designed research and wrote the paper. AG performed analytic calculations and numerical simulations. AG and SP wrote Supplementary Material file.
Funding
This research has been supported by Universidad de Buenos Aires (UBACyT 20020130100480BA) and Agencia Nacional de Promoción Científica y Tecnológica (PICT 2015-3824). SP is a member of Carrera del Investigador Científico (Consejo Nacional de Investigaciones Científicas y Técnicas).
Conflict of Interest Statement
The authors declare that the research was conducted in the absence of any commercial or financial relationships that could be construed as a potential conflict of interest.
Acknowledgments
SP wants to acknowledge the hospitality of the International Centre for Theoretical Physics in Trieste, Italy, where part of this work was written.
Supplementary Material
The Supplementary Material for this article can be found online at: https://www.frontiersin.org/articles/10.3389/fphy.2018.00074/full#supplementary-material
References
1. Cai L, Dalal CK, Elowitz MB. Frequency-modulated nuclear localization bursts coordinate gene regulation. Nature (2008) 455:485–90. doi: 10.1038/nature07292
2. Levine JH, Lin Y, Elowitz MB. Functional roles of pulsing in genetic circuits. Science (2013) 342:1193–200. doi: 10.1126/science.1239999
3. Hao N, O'Shea EK. Signal-dependent dynamics of transcription factor translocation controls gene expression. Nat Struct Mol Biol. (2012) 19:31–9. doi: 10.1038/nsmb.2192
4. Albeck JG, Mills GB, Brugge JS. Frequency-modulated pulses of ERK activity transmit quantitative proliferation signals. Mol Cell (2013) 49:249–61. doi: 10.1016/j.molcel.2012.11.002
5. Berridge M, Bootman M, Lipp P. Calcium - a life and death signal. Nature (1998) 395:645–8. doi: 10.1038/27094
6. Dupont G, Combettes L, Bird GS, Putney JW. Calcium oscillations. Cold Spring Harb Perspect Biol. (2011) 3:a004226. doi: 10.1101/cshperspect.a004226
7. De Koninck P, Schulman H. Sensitivity of CaM kinase II to the frequency of Ca2+ oscillations. Science (1998) 279:227–30. doi: 10.1126/science.279.5348.227
8. Dupont G, Goldbeter A. CaM kinase II as frequency decoder of Ca2+ oscillations. BioEssays (1998) 20:607–10. doi: 10.1002/(SICI)1521-1878(199808)20:8<607::AID-BIES2>3.0.CO;2-F
9. Dolmetsch RE, Xu K, Lewis RS. Calcium oscillations increase the efficiency and specificity of gene expression. Nature (1998) 392:933–6. doi: 10.1038/31960
10. Colman-Lerner A, Gordon A, Serra E, Chin T, Resnekov O, Endy D, et al. Regulated cell-to-cell variation in a cell-fate decision system. Nature (2005) 437:699–706. doi: 10.1038/nature03998
11. Carbó N, Tarkowski N, Ipiña EP, Dawson SP, Aguilar PS. Sexual pheromone modulates the frequency of cytosolic Ca2+ bursts in Saccharomyces cerevisiae. Mol Biol Cell (2017) 28:501–10. doi: 10.1091/mbc.e16-07-0481
12. Foskett JK, White C, Cheung KH, Mak DOD. Inositol trisphosphate receptor Ca2+ release channels. Physiol Rev. (2007) 87:593–658. doi: 10.1152/physrev.00035.2006
13. Fabiato A. Calcium-induced release of calcium from the cardiac sarcoplasmic reticulum. Am J Physiol. (1983) 245:1–15. doi: 10.1152/ajpcell.1983.245.1.C1
14. Yao Y, Choi J, Parker I. Quantal puffs of intracellular Ca2+ evoked by inositol trisphosphate in Xenopus oocytes. J Physiol (Lond). (1995) 482:533–53. doi: 10.1113/jphysiol.1995.sp020538
15. Sun XP, Nicholas C, Marchant JS, Parker I. A continuum of InsP3-mediated elementary Ca2+ signalling events in Xenopus oocyte. J Physiol. (1998) 509:67–80. doi: 10.1111/j.1469-7793.1998.067bo.x
16. Smith IF, Parker I. Imaging the quantal substructure of single IP3R channel activity during Ca2+ puffs in intact mammalian cells. Proc Natl Acad Sci USA (2009) 106:6404–9. doi: 10.1073/pnas.0810799106
17. Callamaras N, Parker I. Phasic characteristic of elementary Ca2+ release sites underlies quantal responses to IP3. EMBO J. (2000) 19:3608–7. doi: 10.1093/emboj/19.14.3608
18. Piegari E, Sigaut L, Ponce Dawson S. Ca2+ images obtained in different experimental conditions shed light on the spatial distribution of IP3 receptors that underlie Ca2+ puffs. Cell Calcium (2015) 57:109–19. doi: 10.1016/j.ceca.2015.01.003
19. Piegari E, López LaF, Ponce Dawson S. Using two dyes to observe the competition of Ca2+ trapping mechanisms and their effect on intracellular Ca2+ signals 2018. Available Online at: http://iopscience.iop.org/article/10.1088/1478-3975/aac922
20. Solovey G, Dawson SP. Intra-cluster percolation of calcium signals. PLoS ONE (2010) 5:e8997. doi: 10.1371/journal.pone.0008997
21. Lopez La, Piegari Ea, Sigaut L, Ponce Dawson S. Intracellular calcium signals display an avalanche-like behavior over multiple lengthscales. Front Physiol. (2012) 3:350. doi: 10.3389/fphys.2012.00350
22. Skupin A, Falcke M. Statistical properties and information content of calcium oscillations. Genome Inform Ser. (2007) 18:44–53. doi: 10.1142/9781860949920_0005
23. Skupin A, Kettenmann H, Winkler U, Wartenberg M, Sauer H, Tovey SC, et al. How does intracellular Ca2+ oscillate: by chance or by the clock? Biophys J. (2008) 94:2404–11. doi: 10.1529/biophysj.107.119495
24. Thurley K, Falcke M. Derivation of Ca2+ signals from puff properties reveals that pathway function is robust against cell variability but sensitive for control. Proc Natl Acad Sci USA (2011) 108:427–32. doi: 10.1073/pnas.1008435108
25. Thurley K, Tovey SC, Moenke G, Prince VL, Meena A, Thomas AP, et al. Reliable encoding of stimulus intensities within random sequences of intracellular Ca2+ spikes. Sci Signal. (2014) 7:ra59. doi: 10.1126/scisignal.2005237
26. Marchant JS, Parker I. Role of elementary Ca 2+ puffs in generating repetitive Ca 2+ oscillations. EMBO J. (2001) 20:65–76. doi: 10.1093/emboj/20.1.65
27. Lindner B, a Ojalvo JG, Neiman A, Schimansky-Geier L. Effects of noise in excitable systems. Phys Rep. (2004) 392:321–424. doi: 10.1016/j.physrep.2003.10.015
28. Bialek W. Biophysics. Searching for Principles. Princeton; Oxford: Princeton University Press (2012).
29. Signorell A, et, al,. DescTools: Tools for Descriptive Statistics. R package version 0.99.24. (2018). Available online at: https://cran.r-project.org/package=DescTools
Keywords: cell signaling, Ca2+ pulses, information, Poisson processes, inhibition
Citation: Givré A and Ponce Dawson S (2018) Information Content in Stochastic Pulse Sequences of Intracellular Messengers. Front. Phys. 6:74. doi: 10.3389/fphy.2018.00074
Received: 12 March 2018; Accepted: 26 July 2018;
Published: 20 July 2018.
Edited by:
Luis Diambra, National University of La Plata, ArgentinaReviewed by:
Margaritis Voliotis, University of Exeter, United KingdomKhanh Dao Duc, University of California, Berkeley, United States
Copyright © 2018 Givré and Ponce Dawson. This is an open-access article distributed under the terms of the Creative Commons Attribution License (CC BY). The use, distribution or reproduction in other forums is permitted, provided the original author(s) and the copyright owner(s) are credited and that the original publication in this journal is cited, in accordance with accepted academic practice. No use, distribution or reproduction is permitted which does not comply with these terms.
*Correspondence: Silvina Ponce Dawson, silvina@df.uba.ar