Design and test a converging and de Laval nozzle using additive manufacturing
 Mingtai Chen
 Ruksana Baby
  Seth Dillard 1
  Srinath Ekkad
 - 1Mechanical and Aerospace Engineering Department, North Carolina State University, Raleigh, NC, United States
- 2Analytical Instrumentation Facility, North Carolina State University, Raleigh, NC, United States
The advent of additive manufacturing technology has facilitated the design and fabrication of parts and models in both academia and aerospace industry. Compressible flow in the nozzles is not a new research topic; however, the accuracy of the experimental results obtained from the nozzles using additive manufacturing has not been assessed comprehensively. Surface roughness and strength of 3D-printed nozzles are two major concerns when they are applied to compressible flows. In this paper, a converging and a de Laval nozzle fabricated by additive manufacturing using ABS filament are designed and tested. Surface roughness inside the converging nozzle is quantified using a nondestructive method. In general, the experimental results compare well with the analytical solutions from isentropic equations for the converging nozzle and the numerical simulations conducted in ANASYS Fluent for the de Laval nozzle. 3D-printed nozzles can be employed to quickly demonstrate and verify novel ideas and concepts in the pedagogy and research at large Reynolds numbers.
1 Introduction
Nozzles are mechanical bodies that are carefully designed to achieve the targeted flow velocity and regulate the flow direction using pressure energy and fluid enthalpy (Khan et al., 2021). Typically, two types of nozzles: converging and de Laval or converging-diverging nozzle are employed in both academia and aerospace industry. For a converging nozzle, its cross-section area decreases gradually from the inlet to the exit. A de Laval nozzle, on the other hand, contains a throat where the minimum cross-section area is reached. Between the inlet and the throat, the cross-section area reduces first, following by the increase in the cross-section area between the throat and the exit.
The flow in the nozzles, treated as compressible flow, has been studied analytically (Nunn, 1989), numerically (Chen et al., 1994; Frey and Hagemann, 1998; Nasuti and Onofri, 1998; Gross and Weiland, 2004; Nasuti et al., 2007) and experimentally (Chen et al., 1994; Frey et al., 2000; Reijasse et al., 2001; Hagemann et al., 2002; Hunter, 2004; Morris et al., 2013; Harmon et al., 2018; Tommila et al., 2021). Conservation laws and enthalpy balance are used to analytically derive isentropic relations in one dimension (Nunn, 1989). Bounded by the walls, terminologically, the flow inside the nozzles is categorized into internal flow. For numerical studies, Computational Fluid Dynamics (CFD) tools or codes were adopted, more popularly, in two dimensions. For nozzle experiments, in general, investigations were performed on scaled nozzles except for (Chen et al., 1994; Hunter, 2004) in which full-scaled nozzles were used. Also, the majority of the nozzles were machined from metals or made of alloys using additive manufacturing in the aforementioned experimental research. Morris et al. (2013) is one exception in which a sub-scaled converging nozzle was fabricated by rapid prototyping, a synonym of additive manufacturing, using polymer to validate the concept of fluidic inserts on noise reduction. However, the authors brought up a pending question: how accurate are the experimental flow results from nozzles manufactured by additive manufacturing (AM) compared to machined metal nozzles? Based on the traditional viscous loss theory, surface roughness affects shear stress at the boundary wall (Moody, 1944). The effects of surface roughness on nozzle performance were mainly investigated at low Reynolds number
AM, also known as 3D printing, is a process of joining materials to make objects from 3D model data, usually layer upon layer (ASTM-F2792-12a, 2012). This technology is called additive manufacturing because the mass change of the part is positive during the process; otherwise, equivalent and subtractive manufacturing are used for processes with zero and negative change on the part mass, respectively (Lu et al., 2015). AM technology has been around for about two decades, but it has prospected into a new manufacturing revolution in the past few years (Joshi and Sheikh, 2015). There are merits and demerits in terms of the application of AM technology into aerospace industry (Kalender et al., 2019). Particularly, when AM technology is applied in the compressible flow field of nozzles, nozzle strength and surface roughness are two major concerns accompanying with advantages on cost, time and resource consumption. The purpose of this research is to design and test a converging and de Laval nozzle using AM technology at large Reynolds number. For the de Laval nozzle design, the shape was not optimized by using the method of characteristics. This is to demonstrate that the analytical area ratio relationship does not predict the formation of shock waves caused by the nozzle shape, which is important in design a de Laval nozzle besides the surface roughness. Similar to Morris et al. (2013), acrylonitrile butadiene styrene (ABS) filament among different polymers suitable for AM was chosen for the nozzles. Surface roughness of the 3D-printed ABS nozzles was quantified using a novel nondestructive scanning method—X-ray micro-computed tomography (XRM-CT). Also, a Pitot tube instead of pressure taps on the wall was used to obtain pressure and temperature data even though it created a blockage effect but was less affected by the shear stress and boundary layer on the wall. The experimental results are compared to the analytical solutions and CFD simulations for accuracy assessment. Smooth surface was considered in both analytical solutions and CFD simulations. With a better understanding of additive manufacturing on the performance of nozzle flows, it would be beneficial for quickly demonstrating concepts, verifying new designs, and proving novel ideas related to nozzles in academic courses and research as well.
2 Problem formulation
2.1 Nozzle design
Quasi-one-dimensional adiabatic compressible flow is assumed to be inside the nozzles (Anderson, 1991). To obtain the flow field inside the nozzles, the local Mach number, pressure, and temperature must be known at various locations according to the nozzle geometry (Tommila et al., 2021). Nozzle design was implemented on the isentropic condition when Mach number (M) equals one at the nozzle exit and throat for the converging and de Laval nozzle, respectively. To obtain the Mach number distribution along the nozzle centerline, Eq. (1) (Anderson, 1991) is solved numerically based on the local nozzle area ratio.
where A is the cross-section area at designated locations, A* equal to the nozzle exit and throat area for converging and de Laval nozzle, respectively, for this case, and γ = 1.4 for the air. Surface roughness via the Fanning friction factor is not included in Eq. (1). One reason is that this work attempts to answer the question brought up in Morris et al. (2013), while another is that the Fanning friction factor using the absolute surface roughness has not been applied to large Reynolds numbers. Once the Mach number distribution is obtained, the local pressure is calculated by the isentropic equation introduced in Anderson (1991). Lastly, Eq. (2) is used to satisfy the constraint on the maximum compressed air supply: 120 psig (827 kPa).
where p* equal to the static pressure at the nozzle exit and throat for converging and de Laval nozzle, respectively, and p01 is the stagnation pressure at the nozzle inlet, equal to the stagnation pressure in the reservoir tank. At the sonic condition, the static pressure at the exit for both nozzles equals the back pressure. Back pressure (pb) is constant and equal to 14.7 psi (101 kPa) in this case. The second consideration in the design is the blockage effect from the Pitot tube with a diameter of 1/8 inches provided by United Sensor instead of nozzle wall pressures (Hunter, 2004; Goodman et al., 2021) to measure Mach number experimentally. Table 1 details the geometry of both nozzles.
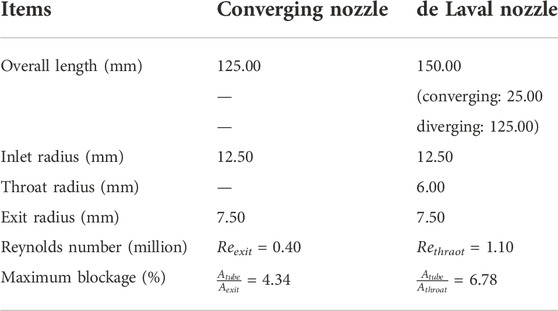
TABLE 1. Specifications for the converging and de Laval nozzle design.
2.2 3D-printed nozzles
In this study, a Stratasys F170 3D printer was used to fabricate the designed converging and de Laval nozzle from the SOLIDWORKS software (Version 2021). The working principle of the 3D printer is to melt the plastic filament in layers at a high temperature. After the filament is extruded from the printer’s nozzle, it is no longer subject to the nozzle’s high temperatures. Then, the solidification of the filament begins and the layers of the filament are fused together once the cooling process is finished. The 3D printer has a maximum build area of 254 × 254 × 254 mm with a nozzle diameter of 0.4 mm. As for the filaments that can be used on the 3D printer, there are multiple selections. Considering the nature of compressible flows, ABS filament is chosen for the printing material due to its resistance to impact and high temperature (between -20 and 80°C). Also, it can be welded by chemical processes using acetone. The nozzles were printed at a 0.254 mm layer height with an 80% infill. Table 2 lists the properties of both 3D-printed nozzles shown in Figure 1.
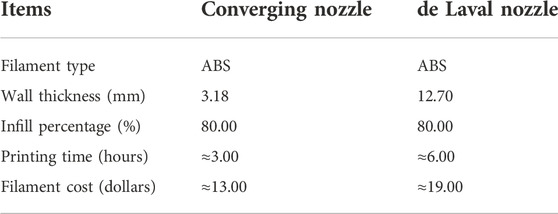
TABLE 2. Properties of 3D printed nozzles.
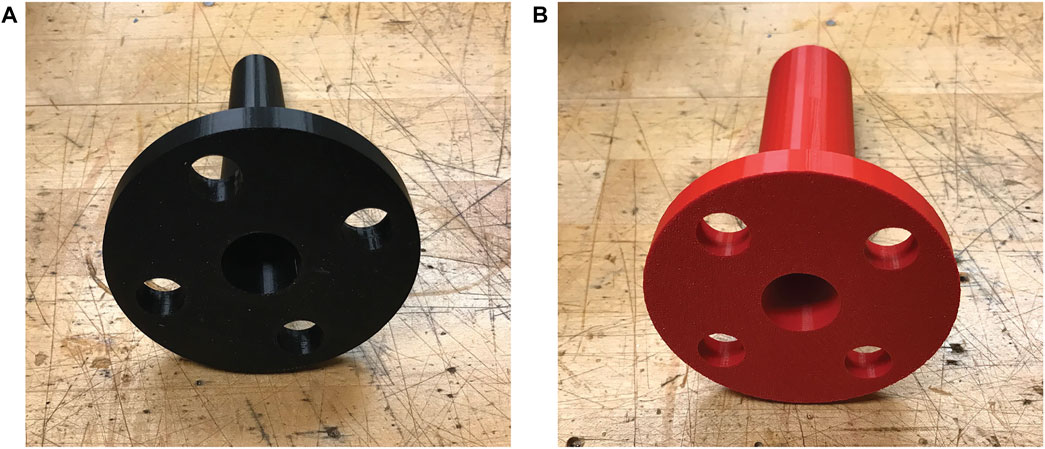
FIGURE 1. Nozzles fabricated by additive manufacturing, (A) the converging nozzle, (B) the de Laval nozzle.
2.3 XRM-CT
To measure the surface roughness of the 3D-printed nozzles, an Xradia 510 Versa 3D X-ray microscope (XRM) (Zeiss, Germany) was used for imaging the converging nozzle sample. This nondestructive quantitative method is called XRM-CT, which is detailed in Baby et al. (2021). It has been applied in biological and medical science, material science, and in the analysis of membranes, fibers, yarns, and fabrics (Baby et al., 2021). However, it is the first time to employ this method in the 3D-printed nozzles. The high-resolution images (pixel size: 20.90 μm) were obtained at 50 kV and 4 W using the Flat Panel, and from a projection number set to 1,601. The images were then imported to the XMReconstructor software for post-reconstruction into 8-bit TIFF files. The reconstructed TIFF images were finally imported into the Dragonfly Pro software (ORS, Montreal, Canada) for post-processing and presentation. Window leveling, contrast and intensity space were adjusted for both the 3D and 2D images.
2.4 Test setup
Figure 2 shows the schematic diagram and a picture of the nozzle test setup. A pressure regulator with an accuracy of 2.9% in a range of 0–150 psig (1 MPa) is used to control the total pressure in the reservoir tank of which one end is connected to the nozzle inlet. The compressed air supplied by the two external storage tanks has a maximum gage pressure of 120 psig (827 kPa). A ball valve is used to quickly close off the air supply between test points and for safety concern. The nozzle exit is open to room.
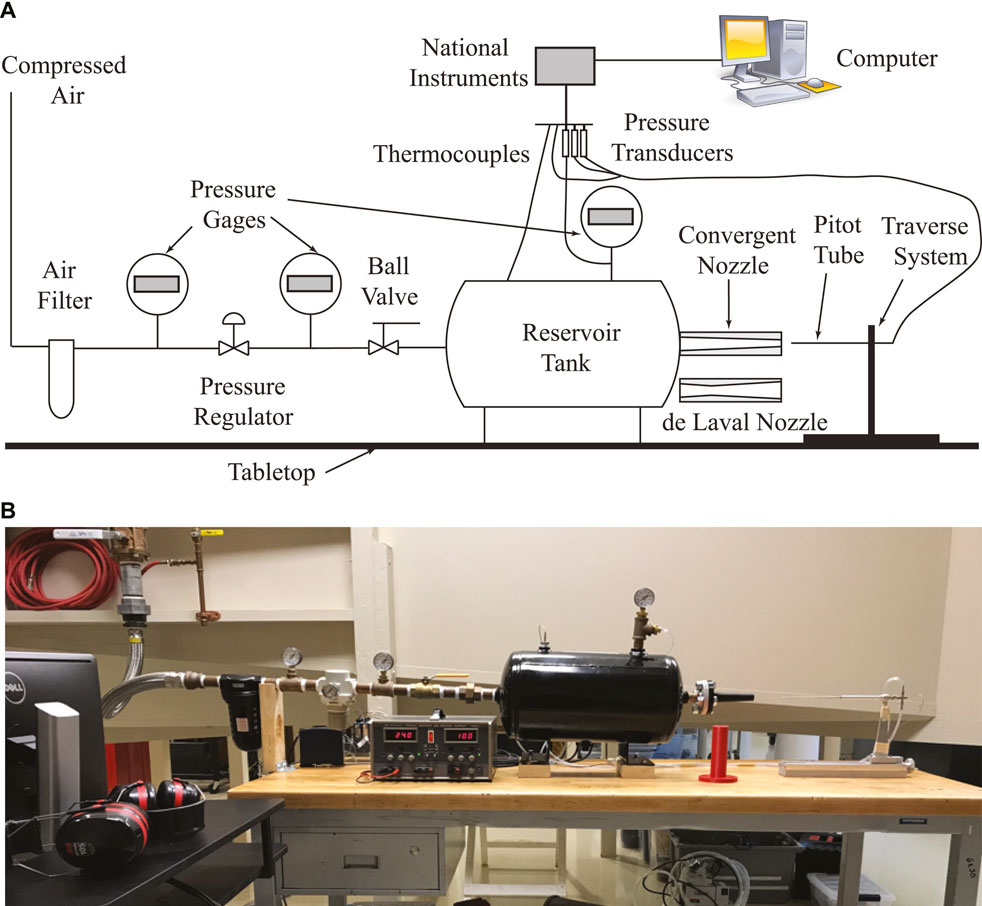
FIGURE 2. Experimental Nozzle test setup, (A) the schematic diagram, (B) a picture.
Measurement devices include a Pitot tube, three pressure transducers, two thermocouples to measure the total temperature of the air in the tank and the nozzle, and a traverse system with a scale to locate the Pitot tube with respect to the nozzle exit. All the OMEGA PX409-150A10V pressure transducers have an accuracy of 0.08% of the full scale range: 0–150 psi (1 MPa) in absolute pressure. Three pressure gages are only used for pressure indication. The signals from the thermocouples and pressure transducers were acquired by a National Instruments cRIO 9076 using LabVIEW with a NI 9211 module for temperature measurements and a NI 9205 module for pressure measurements. The sampling rate of the signals was 1,000 Hz. A LabVIEW code (2019) and a MATLAB code (R2021a) were developed for data acquisition and analysis, respectively.
2.5 Numerical simulations
The experimental cases were duplicated in ANSYS Fluent using a 2D planar nozzle model with the geometry listed in Table 2. Absolute, steady and pressure-based flow solver together with SST k − ω turbulence model was selected for the simulations. SST k − ω turbulence model was chosen because it provides a good prediction on shock waves and boundary layer separation for nozzle flows (Kolář and Dvořák, 2011). To check the accuracy of the experimental results, the default and smooth solid (aluminum) was chosen for the nozzle walls. Flow conditions in the simulations obtained from Section 2.1 Nozzle Design are shown in Table 3. For both nozzles, the tolerance was set to 10–6. Structured grid element was used in the simulations. In sum, there were 4,160 and 15,180 cells in the converging and de Laval nozzle simulation, respectively. Figure 3 presents a picture of the mesh used in the simulation for the converging and de Laval nozzle.
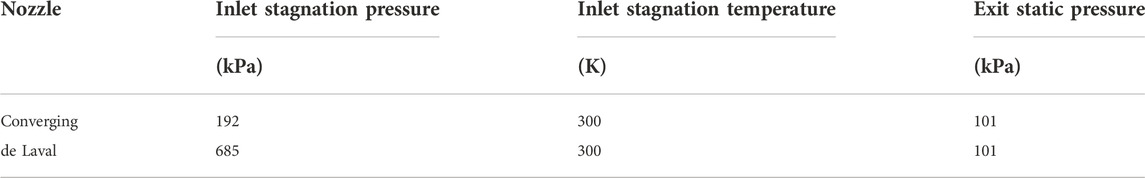
TABLE 3. Flow conditions for CFD simulations.
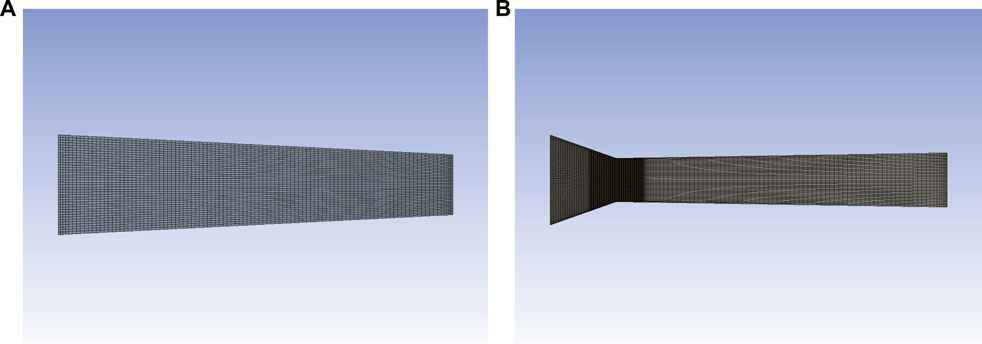
FIGURE 3. A picture of the mesh used in the Fluent simulations, (A) the converging nozzle, (B) the de Laval nozzle.
3 Results and discussion
3.1 Surface roughness measurement
Figure 4 presents the surface roughness data of the 3D-printed converging nozzle. The scanned volume is 3,024 pixel × 3,064 pixel × 1,932 pixel (width × height × depth). After examining the reconstructed 3D image inside the converging nozzle, two small volumes highlighted in Figure 4A are separately cropped for further analysis. The smaller volume (21 pixel × 9 pixel × 1,343 pixel) represents the regular surface inside the nozzle, while the larger volume (11 pixel × 41 pixel × 1,343 pixel) where one layer of ABS filament ends and a new layer begins shows the bumpy surface. Meanwhile, the various and irregular protrusions are observed in the scanned volume. Figure 4B presents the distribution of the protrusions by density measured in the internal surface of the scanned converging section from top view. It is thought that this is caused by the inconsistency on ABS filament ejection from the nozzle of the 3D printer during the printing process. To quantify the internal surface roughness, thickness mesh contours are presented in Figures 4C,D from the Dragonfly Pro software for the selected two small volumes. Unfortunately, the averaged thickness data could not be directly exported from the software. Therefore, the maximum roughness height–the difference between the minimum and the maximum thickness in Figure 4C,D–is used for comparison instead of the averaged surface roughness. Traditionally, the nozzles are fabricated using a variety of subtractive manufacturing techniques. Electrical discharge machining (EDM) is among them. For AM, laser powder bed fusion (LPBF) technique, starting with metal alloy powder and a laser, was used before. Table 4 compares the maximum surface height measured in EDM-, LPBF- and ABS-type nozzle. From Table 4, the 3D-printed ABS-nozzle has a rougher surface compared to the EDM-nozzle achieved through subtractive manufacturing. To be noted, the LPBF- and ABS-type nozzle in Table 4 are measured without post-processing on the internal surface finish.
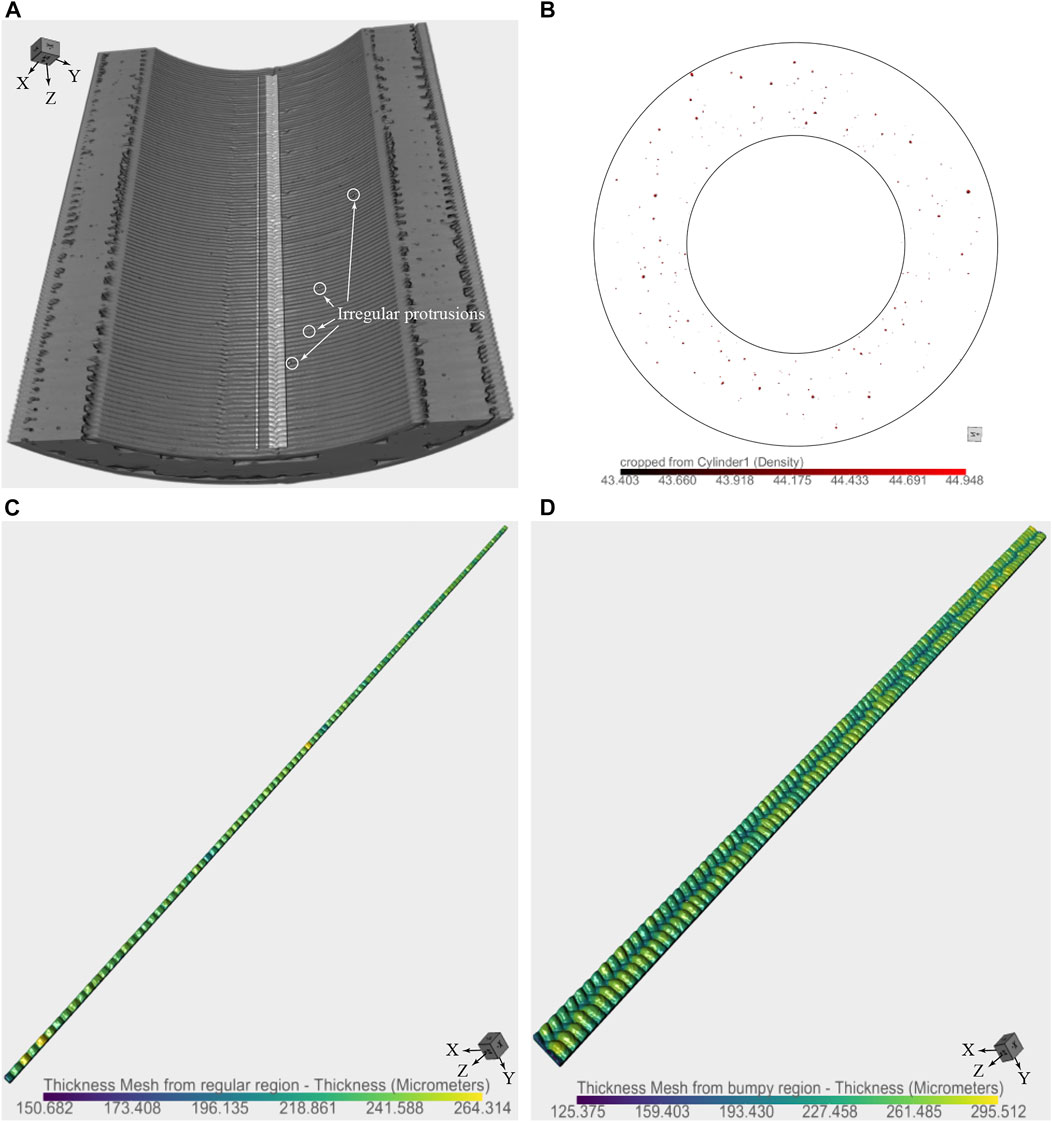
FIGURE 4. (A) The converging nozzle topography using a 3D X-ray microscope, (B) the distribution of protrusions on the internal surface (top view), (C) the thickness mesh of the regular region on the internal surface, and (D) the thickness mesh of the bumpy region on the internal surface.
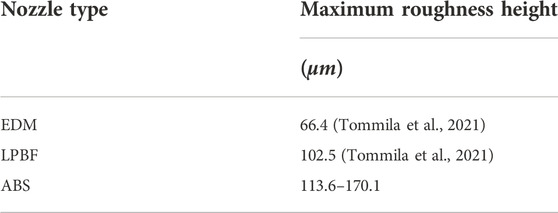
TABLE 4. Comparison of the measured maximum nozzle roughness height.
3.2 Critical pressure ratio
Figure 5A presents the experimental ratio of the static pressure (pexit) from the Pitot tube at the exit of the converging nozzle to the stagnation pressure (p01) in the tank as the air accelerates from the nozzle by opening the pressure regulator. The Mach number is calculated using Eqs (3), (4) (Anderson, 1991) for the subsonic and supersonic flow, respectively. Eq. (4) is named as Rayleigh Pitot tube formula.
where p is the static pressure and p02 is the stagnation pressure from the Pitot tube, respectively. The critical pressure ratio when M = 1 at the exit (marked in black dashed lines) is obtained by fitting the experimental results using a third-order polynomial. Table 5 lists this value and compares to the theoretical one (0.5283). From Table 5, the experimental result matches the theoretical one well. However, the Mach number did not stay at 1 when the stagnation pressure in the tank kept increasing. In other words, the flow was not choked at the exit of the converging nozzle. This is backed up by Figure 5C in which the static pressure in the air starts to drop from room pressure at M = 1.02 while the stagnation pressure is almost the same between the tank and the Pitot tube. Under-expansion waves are speculated to be formed at the nozzle exit. Another phenomenon is that the stagnation temperature is not constant at the nozzle exit after M exceeds 0.5 as shown in Figure 5B, which proves that the nozzle flow is not adiabatic in reality.
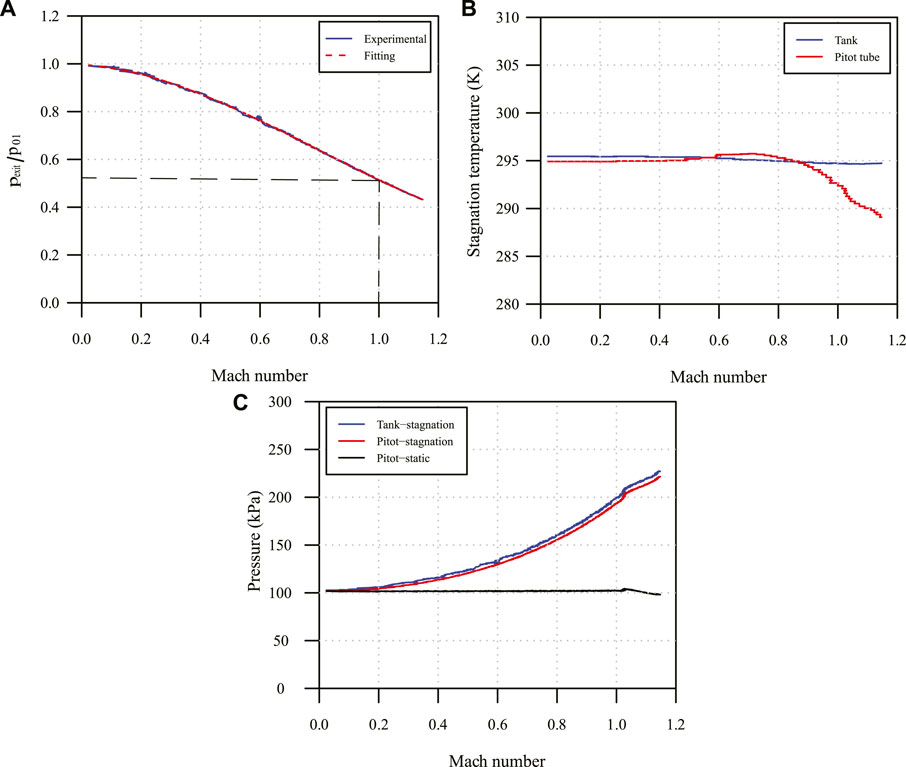
FIGURE 5. Experimental results at the exit of the converging nozzle, (A) the pressure ratio, (B) the stagnation temperature, and (C) the pressure readings.
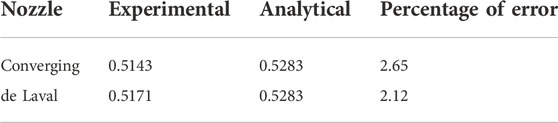
TABLE 5. Comparison of the critical pressure ratio at M = 1
Figure 6A presents the experimental ratio of the static pressure (pthroat) from the Pitot tube at the throat of the de Laval nozzle to the stagnation pressure (p01) in the tank with respect to the Mach number. Similar to Figure 5A, the difference between the experimental critical pressure ratio and the theoretical one is negligible as shown in Table 5. From the pressure readings in Figure 6C, the throat was choked at 1.14 instead of the theoretical Mach number (equal to 1). The difference in the stagnation pressure between the tank and Pitot tube is indistinguishable. Once the throat was choked, the stagnation temperature (Figure 6B) in the tank and from the Pitot tube started to drop rapidly. The air in the tank has a less reduction in the stagnation temperature. When the Pitot tube was placed at the exit of the de Laval nozzle, the experimental results presented in Figure 7 are different compared to Figure 5 for the converging nozzle. After M is larger than 1.14, the trend in the pressure ratio (Figure 7A), stagnation temperature (Figure 7B), and pressure readings (Figure 7C) is changed differently. From Figure 7C, at M equal to 1.14, a bow shock was formed at the head of the Pitot tube, followed by over-expansion waves. At M = 1.45, there were under-expansion waves at the exit till the stagnation pressure in the tank reached 685 kPa. This informs that the analytical calculation cannot predict the formation of shock waves when the nozzle shape is not optimum. Thus, for de Laval nozzles the shape profile should be optimized by using the method of characteristics; otherwise, a large discrepancy could create between the experiments and the analytical solutions.
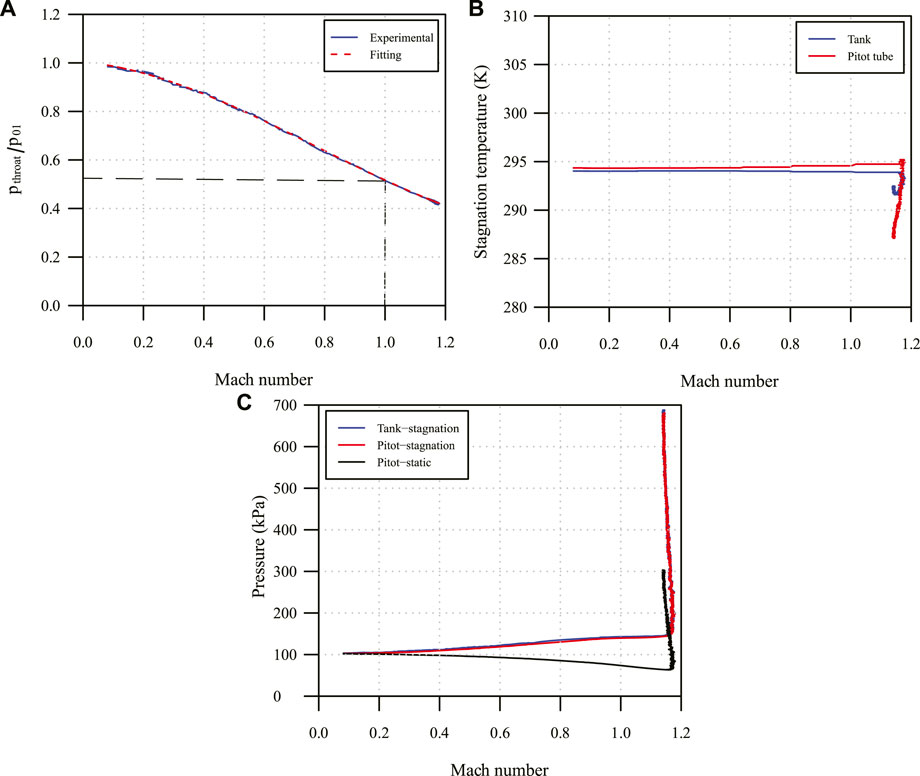
FIGURE 6. Experimental results at the throat of the de Laval nozzle, (A) the pressure ratio, (B) the stagnation temperature, and (C) the pressure readings.
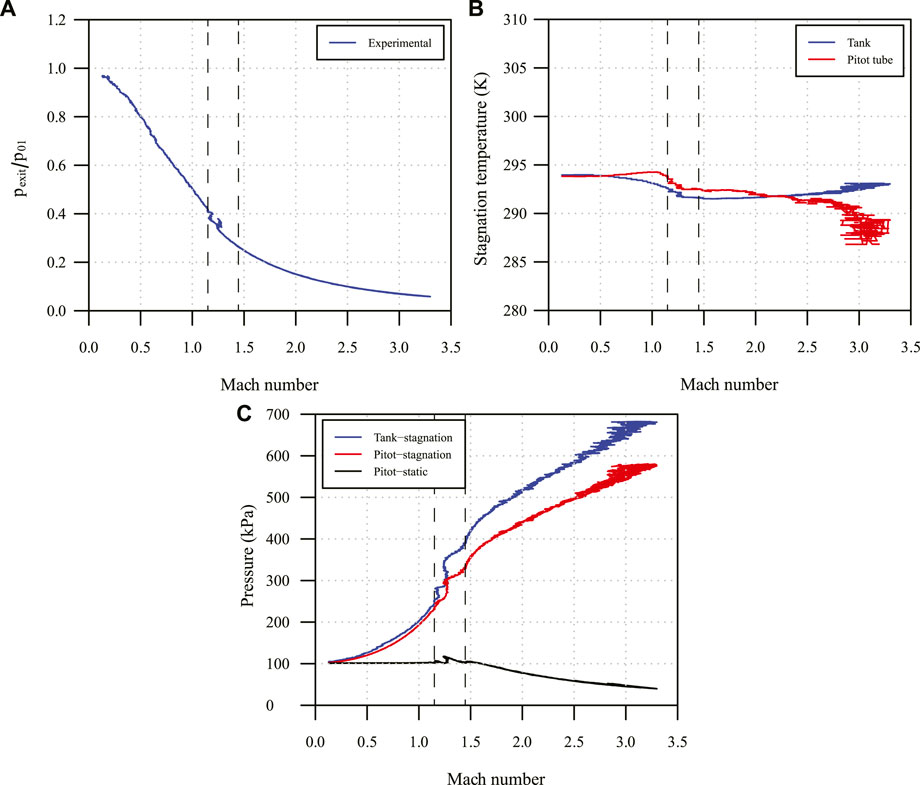
FIGURE 7. Experimental results at the exit of the de Laval nozzle, (A) the pressure ratio, (B) the stagnation temperature, and (C) the pressure readings.
3.3 Mach number distribution
In terms of the Mach number distribution along the nozzle centerline, the stagnation pressure in the tank was set to the value listed in Table 3 for each nozzle. A ball valve controlled on/off of the air in the nozzles. The Pitot tube was moved on a traverse system of which a scale indicated the location of the Pitot tube. At each location, 1,000 data points were collected and averaged. Figure 8A presents the Mach number results of the converging nozzle. In general, the experimental results are more close to the analytical solutions except for the normalized location at 0.9. ANSYS Fluent overpredicts the Mach number more as it approaches to the nozzle inlet. For the stagnation temperature in Figure 8B, similar to Figure 5B, it decreases when the Mach number of the air in the nozzle exceeds 0.6. Figure 8C shows the velocity vector field and Mach number contour inside the converging nozzle.
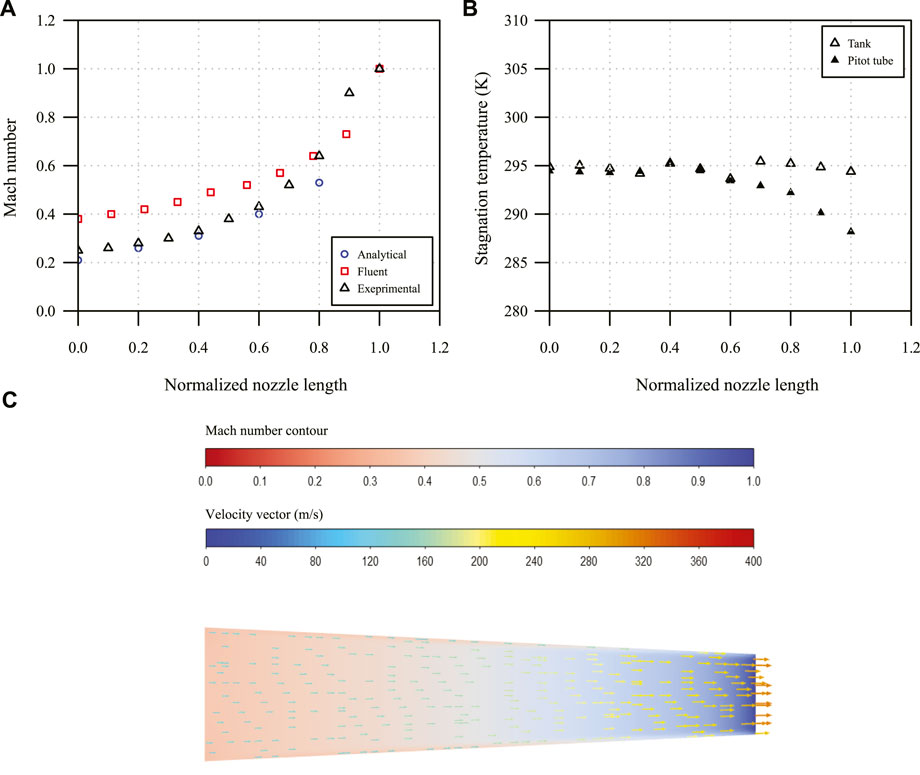
FIGURE 8. Results of the converging nozzle, (A) the Mach number, (B) the experimental stagnation temperature, and (C) the velocity vector field and Mach number contour in ANSYS Fluent.
Contrary to the converging nozzle, the experimental results of the de Laval nozzle match CFD simulations better compared to the analytical solutions (Figure 9A). As explained in Section 3.2 Critical Pressure Ratio, it is understandable that the analytical solutions have a larger discrepancy. Both isentropic equations and ANSYS Fluent do not work well at the nozzle exit. Similar to the experimental results, Nasif et al. (2018) presents the Mach number results from CFD simulations in which the simulation domain was extended to the ambient outside of the nozzle exit, different to the domain used in this work. Another finding from the experiment is that a choked band (dashed lines) forms around the throat (located at 0.17 on the x axis of Figure 9A). The width of this band is about 1 inch. It is possibly caused by the blockage effect from the Pitot tube. In Figure 9B, the stagnation temperature is almost constant in the tank. The air in the nozzle has a fluctuating stagnation temperature, particularly, in the diverging section, which implies that oblique shocks are formed and reflected as shown in Figure 9C due to the abrupt change in the geometry at the throat.
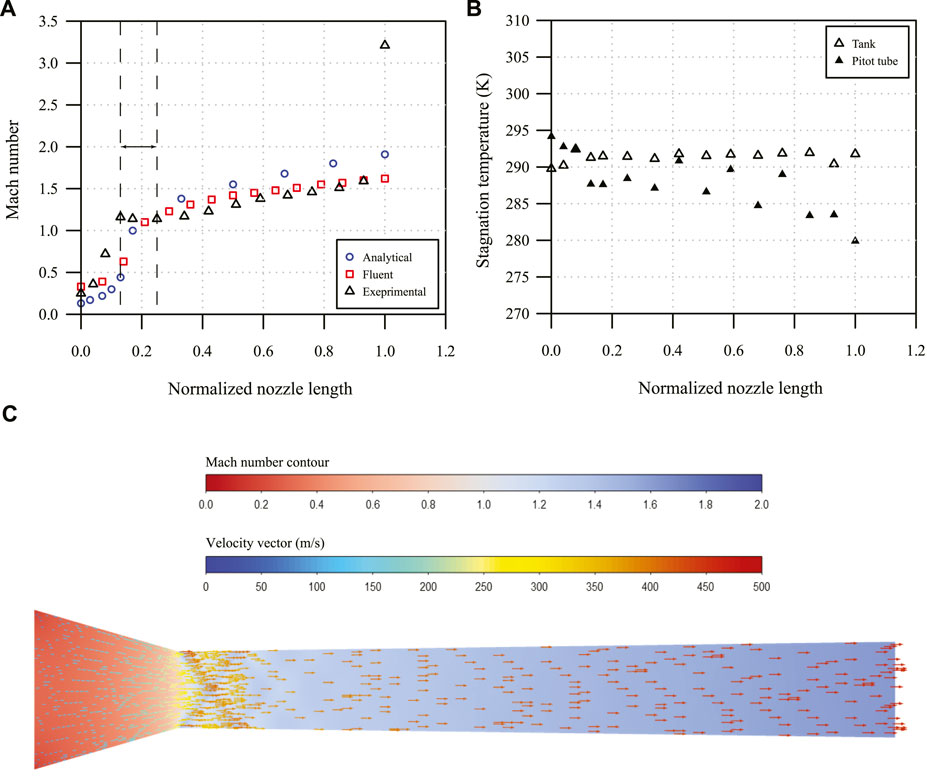
FIGURE 9. Results of the de Laval nozzle, (A) the Mach number, (B) the experimental stagnation temperature, and (C) the velocity vector field and Mach number contour in ANSYS Fluent.
4 Conclusion
This paper quantifies the surface roughness of the converging nozzle fabricated by AM using ABS filament. Compared to subtractive manufacturing, AM typically results in a variable and rougher nozzle surface profile. The experiment was conducted at Reynolds number of 400,000 and 1,100,000 for the 3D-printed converging and de Laval nozzle, respectively. Critical pressure ratio, Mach number, and stagnation temperature were investigated in the nozzles. The experimental results are compared to the analytical calculations and CFD simulations conducted in ANASYS Fluent. For both nozzles, the experimental critical pressure ratios are close to 0.5283 (the theoretical value). More specifically, the experimental Mach number results compare well with the analytical solutions for the converging nozzle and the CFD simulations for the de Laval nozzle. This implies that the surface roughness of the 3D-printed nozzles does not create a large discrepancy on the performance of the nozzle flows when Reynolds numbers are relatively large. For de Laval nozzles, more emphasis should be placed on the optimization of the nozzle geometry using the method of characteristics. The analytical area ratio equation does not predict the formation of shock waves in the de Laval nozzle. Also, in the de Laval nozzle there is a choked band at about M = 1.14 around the nozzle throat. It is speculated that it is caused by the blockage effect from the Pitot tube. Lastly, From the stagnation temperature data, the experiments reveal that the nozzle flows are not adiabatic, while both analytical equations and CFD simulations assume that stagnation temperature is constant in the nozzle flows. In sum, AM can be applied to the nozzle flows at large Reynolds numbers to quickly demonstrate and verify novel ideas and concepts without a significant loss on flow performance.
Data availability statement
The original contributions presented in the study are included in the article/Supplementary Material, further inquiries can be directed to the corresponding author.
Author contributions
SE, department head, contributed to the original idea of the study and the allocation of the fund to support the study. MC designed test setup, conducted experiment, analyzed the data, and organized the manuscript. RB measured the nozzle surface roughness and conducted data presentation and analysis on surface roughness. SD performed 3D printing of the nozzles and wrote the corresponding sections in the manuscript. YL helped MC design the test setup and reviewed the final manuscript. All authors contributed to manuscript revision, read, and approved the submitted version.
Funding
This research is funded by the gift grant (687204) of Mechanical and Aerospace Engineering (MAE) department at North Carolina State University.
Acknowledgments
The authors thank North Carolina State University for the use of the test facilities. This work was performed in part at the Analytical Instrumentation Facility (AIF) at North Carolina State University, which is supported by the State of North Carolina and the National Science Foundation (award number ECCS-2025064). The AIF is a member of the North Carolina Research Triangle Nanotechnology Network (RTNN), a site in the National Nanotechnology Coordinated Infrastructure (NNCI). Dr. Venkat Narayanaswamy helped review the experimental test setup design. Mr. Vincent Chicarelli, Mr. Amos Tucker, and the students in the machine shop of MAE department fabricated the parts for this study.
Conflict of interest
The authors declare that the research was conducted in the absence of any commercial or financial relationships that could be construed as a potential conflict of interest.
Publisher’s Note
All claims expressed in this article are solely those of the authors and do not necessarily represent those of their affiliated organizations, or those of the publisher, the editors and the reviewers. Any product that may be evaluated in this article, or claim that may be made by its manufacturer, is not guaranteed or endorsed by the publisher.
References
Astm-F2792-12a, (2012). Standard terminology for additive manufacturing technologies. Tech. rep. doi:10.1520/F2792-12A
Baby, R., Mathur, K., and DenHartog, E. (2021). Nondestructive quantitative evaluation of yarns and fabrics and determination of contact area of fabrics using the x-ray microcomputed tomography system for skin-textile friction analysis. ACS Appl. Mater. Interfaces 13, 4652–4664. doi:10.1021/acsami.0c18300
Chen, C. L., Chakravarthy, S. R., and Hung, C. M. (1994). Numerical investigation of separated nozzle flows. AIAA J. 32, 1836–1843. doi:10.2514/3.12181
Frey, M., and Hagemann, G. (1998). “Status of flow separation prediction in rocket nozzles,” in 34th AIAA/ASME/SAE/ASEE Joint Propulsion Conference and Exhibit (AIAA).
Frey, M., Stark, R., Cieaki, H., Quessard, F., and Kwan, W. (2000). “Subscale nozzle testing at the p6.2 test stand,” in 36th AIAA/ASME/SAE/ASEE Joint Propulsion Conference and Exhibit (AIAA).
Goodman, N., Leege, B. J., and Johnson, P. E. (2021). An improved de laval nozzle experiment. Int. J. Mech. Eng. Educ. 0, 513–537. doi:10.1177/03064190211034165
Grisnik, S. P., Smith, T. A., and Saltz, L. E. (1987). Experimental study of low Reynolds number nozzles. Tech. Rep. NASA-TM-89858.
Gross, A., and Weiland, C. (2004). Numerical simulation of separated cold gas nozzle flows. J. Propuls. Power 20, 509–519. doi:10.2514/1.2714
Hagemann, G., Frey, M., and Koschel, W. (2002). Appearance of restricted shock separation in rocket nozzles. J. Propuls. Power 18, 577–584. doi:10.2514/2.5971
Harmon, M., Bhargav, V. N., Sellappan, P., Alvi, F. S., and Kumar, R. (2018). “Experimental study of impinging jet flow field involving converging and cd nozzle pair,” in 2018 AIAA Aerospace Sciences Meeting (AIAA).
Hunter, C. A. (2004). Experimental investigation of separated nozzle flows. J. Propuls. Power 20, 527–532. doi:10.2514/1.4612
Joshi, S. C., and Sheikh, A. A. (2015). 3d printing in aerospace and its long-term sustainability. Virtual Phys. Prototyp. 10, 175–185. doi:10.1080/17452759.2015.1111519
Kalender, M., Kılıç, S. E., Ersoy, S., Bozkurt, Y., and Salman, S. (2019). “Additive manufacturing and 3d printer technology in aerospace industry,” in 2019 9th International Conference on Recent Advances in Space Technologies (RAST) (IEEE).
Khan, S. A., Ibrahim, O. M., and Aabid, A. (2021). Cfd analysis of compressible flows in a convergent-divergent nozzle. Mater. Today Proc. 46, 2835–2842. doi:10.1016/j.matpr.2021.03.074
Kolář, J., and Dvořák, V. (2011). Verification of k-ω sst turbulence model for supersonic internal flows. Int. J. Mech. Mechatronics Eng. 5, 1715–1719.
Lu, B., Li, D., and Tian, X. (2015). Development trends in additive manufacturing and 3d printing. Engineering 1, 085–089. doi:10.15302/J-ENG-2015012
Morris, P. J., McLaughlin, D. K., and Kuo, C. (2013). Noise reduction in supersonic jets by nozzle fluidic inserts. J. Sound Vib. 332, 3992–4003. doi:10.1016/j.jsv.2012.11.023
Nasif, G., Baron, R., Balachandar, R., and Villafuerta, J. (2018). “Cfd assessment of a de laval nozzle with a small exit diameter for additive manufacturing,” in 26th Annual Conference of The CFD Society of Canada (The CFD Society of Canada).
Nasuti, F., Onofri, M., and Martelli, E. (2007). “Numerical analysis of flow separation structures in rocket nozzles,” in 43rd AIAA/ASME/SAE/ASEE Joint Propulsion Conference and Exhibit (AIAA).
Nasuti, F., and Onofri, M. (1998). Viscous and inviscid vortex generation during startup of rocket nozzles. AIAA J. 36, 809–815. doi:10.2514/2.440
Reijasse, P., Morzenski, L., Blacodon, D., and Birkemeyer, J. (2001). “Flow separation experimental analysis in overexpanded subscale rocket-nozzles,” in 37th Joint Propulsion Conference and Exhibit (AIAA).
Spisz, E. W., Brinich, P. F., and Jack, J. R. (1965). Thrust coefficients of low thrust nozzles. Tech. Rep. NASA-TN-D-3056.
Tommila, C. D., Hartsfield, C. R., Redmond, J. J., Komives, J. R., and Shelton, T. E. (2021). Performance impacts of metal additive manufacturing of very small nozzles. J. Aerosp. Eng. 34, 04020115. doi:10.1061/(ASCE)AS.1943-5525.0001229
Tommila, C. D., and Hartsfield, C. (2017). “Thrust coefficient losses in additively manufactured low thrust nozzles,” in 55th AIAA Aerospace Sciences Meeting (AIAA).
Nomenclature
Abbreviations
ABS acrylonitrile butadiene styrene
AM additive manufacturing
CFD computational fluid dynamics
EDM electrical discharge machining
LPBF laser powder bed fusion
NI National Instruments
XRM-CT X-ray micro-computed tomography
Symbols
A nozzle cross-sectional area (m2)
Aexit nozzle exit area (m2)
Athroat nozzle throat area (m2)
Atube Pitot tube cross-sectional area (m2)
A* theoretical nozzle area at the sonic condition (m2)
M Mach number
p static pressure from Pitot tube (Pa)
pback back pressure (Pa)
pexit static pressure at the nozzle exit (Pa)
pthroat static pressure at the nozzle throat (Pa)
p* theoretical static pressure at the sonic condition (Pa)
p01 stagnation pressure in the tank (Pa)
p02 stagnation pressure from the Pitot tube (Pa)
Reexit analytical Reynolds number at the exit of the converging nozzle
Rethroat analytical Reynolds number at the throat of the de Laval nozzle
γ the ratio of specific heats for the air
Superscripts
()* the sonic condition (M = 1)
Subscripts
()back back pressure
()exit nozzle exit
()throat nozzle throat
()tube Pitot tube
()01 stagnation in the tank
()02 stagnation from the Pitot tube
Keywords: converging nozzle, de Laval nozzle, additive manufacturing, compressible flows, surface roughness
Citation: Chen M, Baby R, Dillard S, Lee YT and Ekkad S (2022) Design and test a converging and de Laval nozzle using additive manufacturing. Front. Aerosp. Eng. 1:951987. doi: 10.3389/fpace.2022.951987
Received: 24 May 2022; Accepted: 12 July 2022;
Published: 22 August 2022.
Edited by:
Kin Liao, FRAeS, FRSC, Khalifa University, United Arab EmiratesReviewed by:
Alexandru—Nicolae Tudosie, University of Craiova, RomaniaAdnan Maqsood, National University of Sciences and Technology (NUST), Pakistan
Copyright © 2022 Chen, Baby , Dillard , Lee and Ekkad . This is an open-access article distributed under the terms of the Creative Commons Attribution License (CC BY). The use, distribution or reproduction in other forums is permitted, provided the original author(s) and the copyright owner(s) are credited and that the original publication in this journal is cited, in accordance with accepted academic practice. No use, distribution or reproduction is permitted which does not comply with these terms.
*Correspondence: Mingtai Chen, mchen33@ncsu.edu