 Xinyue Zhao
 Qinghong Meng2
 Judong Luo
 Lijun Hu
- 1Graduate School of Dalian Medical University, Dalian, China
- 2Department of Radiation Oncology, Changzhou No. 2 People’s Hospital Affiliated to Nanjing Medical University, Changzhou, China
Objective: This study endeavored to explore the optimal treatment strategy and conduct a prognostic analysis for patients diagnosed with pT4M0 (pathologic stage T4) colon adenocarcinoma (COAD).
Methods and materials: A total of 8,843 patients diagnosed with pT4M0 COAD between January 2010 and December 2015 were included in this study from the Surveillance, Epidemiology, and End Results (SEER) database. These patients were randomly divided into a training set and an internal validation set using a 7:3 ratio. Variables that demonstrated statistical significance (P<0.05) in univariate COX regression analysis or held clinical significance were incorporated into the multivariate COX regression model. Subsequently, this model was utilized to formulate a nomogram. The predictive accuracy and discriminability of the nomogram were assessed using the C-index, area under the curve (AUC), and calibration curves. Decision curve analysis (DCA) was conducted to confirm the clinical validity of the model.
Results: In the entire SEER cohort, the 3-year overall survival (OS) rate (74.22% vs. 63.20%, P<0.001) and the 3-year cancer-specific survival (CSS) rate (76.25% vs. 66.98%, P<0.001) in the surgery combined with postoperative adjuvant therapy (S+ADT) group surpassed those in the surgery (S) group. Multivariate COX regression analysis of the training set unveiled correlations between age, race, N stage, serum CEA (carcinoembryonic antigen), differentiation, number of resected lymph nodes, and treatment modalities with OS and CSS. Nomograms for OS and CSS were meticulously crafted based on these variables, achieving C-indexes of 0.692 and 0.690 in the training set, respectively. The robust predictive ability of the nomogram was further affirmed through receiver operating characteristic (ROC) and calibration curves in both the training and validation sets.
Conclusion: In individuals diagnosed with pT4M0 COAD, the integration of surgery with adjuvant chemoradiotherapy demonstrated a substantial extension of long-term survival. The nomogram, which incorporated key factors such as age, race, differentiation, N stage, serum CEA level, tumor size, and the number of resected lymph nodes, stood as a dependable tool for predicting OS and CSS rates. This predictive model held promise in aiding clinicians by identifying high-risk patients and facilitating the development of personalized treatment plans.
1 Introduction
Colon adenocarcinoma (COAD) ranks among the most prevalent malignant tumors of the digestive system. Global statistics from 2018 reveal an alarming incidence, with over 1.8 million new cases of colon cancer reported, constituting 10.2% of all cancer cases. This malignancy, standing as the second most common cancer worldwide, follows closely behind lung and breast cancer. Furthermore, the associated mortality figures are equally concerning, with over 840,000 deaths attributed to colon cancer, accounting for 9.2% of all cancer-related deaths (1).
In the secondary analysis of global cancer statistics for 2020, colon cancer maintains its significant impact, ranking second in incidence and fifth in mortality within China (2). Despite advancements in systemic therapy that have contributed to a decline in the incidence of distant metastasis in colon cancer, postoperative local recurrence rates remain notable, ranging between 10% and 40% (3). This underscores the imperative for effective postoperative local treatments, such as radiotherapy (4, 5). Traditionally, adjuvant radiotherapy is not routinely recommended for COAD and is typically reserved for specific clinical scenarios, including locally advanced disease (pT4) and/or positive margins (6). However, due to the limited utilization of radiotherapy in clinical practice and the scarcity of comprehensive clinical trials, the therapeutic efficacy of radiotherapy in COAD remains uncertain (7).
Recent updates in the 2020 NCCN guidelines mark a subtle expansion in the indications for adjuvant radiotherapy. Remarkably, individuals with a confirmed postoperative T4 stage with fixation are currently being contemplated for radiotherapy, albeit with a class II recommendation. Nevertheless, the influence of adjuvant radiotherapy on the overall prognosis of patients with COAD remains elusive.
In light of this, our retrospective study utilized the Surveillance, Epidemiology, and End Results (SEER) database to analyze the survival outcomes of patients with pT4M0 COAD who underwent various treatment modalities. The study aimed to elucidate prognostic factors influencing the outcomes of these patients and, subsequently, construct and validate nomograms to predict overall survival (OS) and cancer-specific survival (CSS).
2 Materials and methods
2.1 Study population
The inclusion criteria for patients in the SEER database search were as follows (1): patients diagnosed with COAD as their initial malignancy between January 2010 and December 2015 (2); T4 and M0 staging according to the American Joint Committee on Cancer 7th Edition Staging System (3); definitive cause of death and treatment details, including initial surgery or external radiotherapy, with or without chemotherapy; and (4) survival time of at least 1 month. Ultimately, this study included 8,843 patients with stage pT4M0 COAD. All treatments, including surgery, radiotherapy, and chemotherapy, were administered as the initial treatment upon diagnosis.
2.2 Treatment groups
All patients underwent surgery. Patients exclusively undergoing surgery were included in the S group. Patients receiving postoperative adjuvant radiotherapy were included in the S+R group. Those receiving postoperative adjuvant chemotherapy were included in the S+C group. Patients undergoing postoperative adjuvant chemoradiotherapy were included in the S+R+C group. For subsequent analysis convenience, the S+R group, S+C group, and S+R+C group were combined into the surgery with the postoperative adjuvant therapy (S+ADT) group.
2.3 Statistical analysis
The study delineated OS as the duration from randomization to death from any cause. CSS was specifically defined as the duration from randomization to death caused by COAD. OS was designated as the primary endpoint, with CSS serving as the secondary endpoint.
The statistical analysis was performed using SPSS 26.0 and R-Software 4.1.2, and graphs were generated through R packages, including ‘survival,’ ‘timeROC,’ ‘ggDCA,’ ‘dplyr,’ and ‘rms.’ Pearson’s chi-square test was employed to compare the characteristics of different treatment groups. Univariate and multivariate analyses utilized COX proportional hazards models to assess and compare the prognostic significance of clinicopathologic variables on OS and CSS rates.
The Kaplan-Meier method, followed by a log-rank test, was employed to analyze survival curves. Variables found significant in the univariate analysis were included in the multivariate analysis to construct the nomogram. Statistical significance was set at P < 0.05.
The accuracy of the nomogram was evaluated using the C-index, receiver operating characteristic (ROC) curve, and calibration curve. Clinical usefulness and benefits were estimated using decision curve analysis (DCA) plots. Additionally, using risk score and X-tile software version 3.6.1 (Yale University, New Haven, CT), patients were stratified into low-, intermediate-, and high-risk groups.
3 Results
3.1 Patient characteristics
We identified 10,041 patients diagnosed with pT4M0 colon cancer between January 2010 and December 2015 from the SEER database. Exclusions were applied to 649 patients with a pathological type other than adenocarcinoma, 491 based on treatment modality, and 59 with a survival period of less than 1 month. This resulted in a final cohort of 8,843 patients for the current analysis. The entire SEER cohort was randomly divided into training and validation sets in a 7:3 ratio, and summarized characteristics are provided in Table 1.
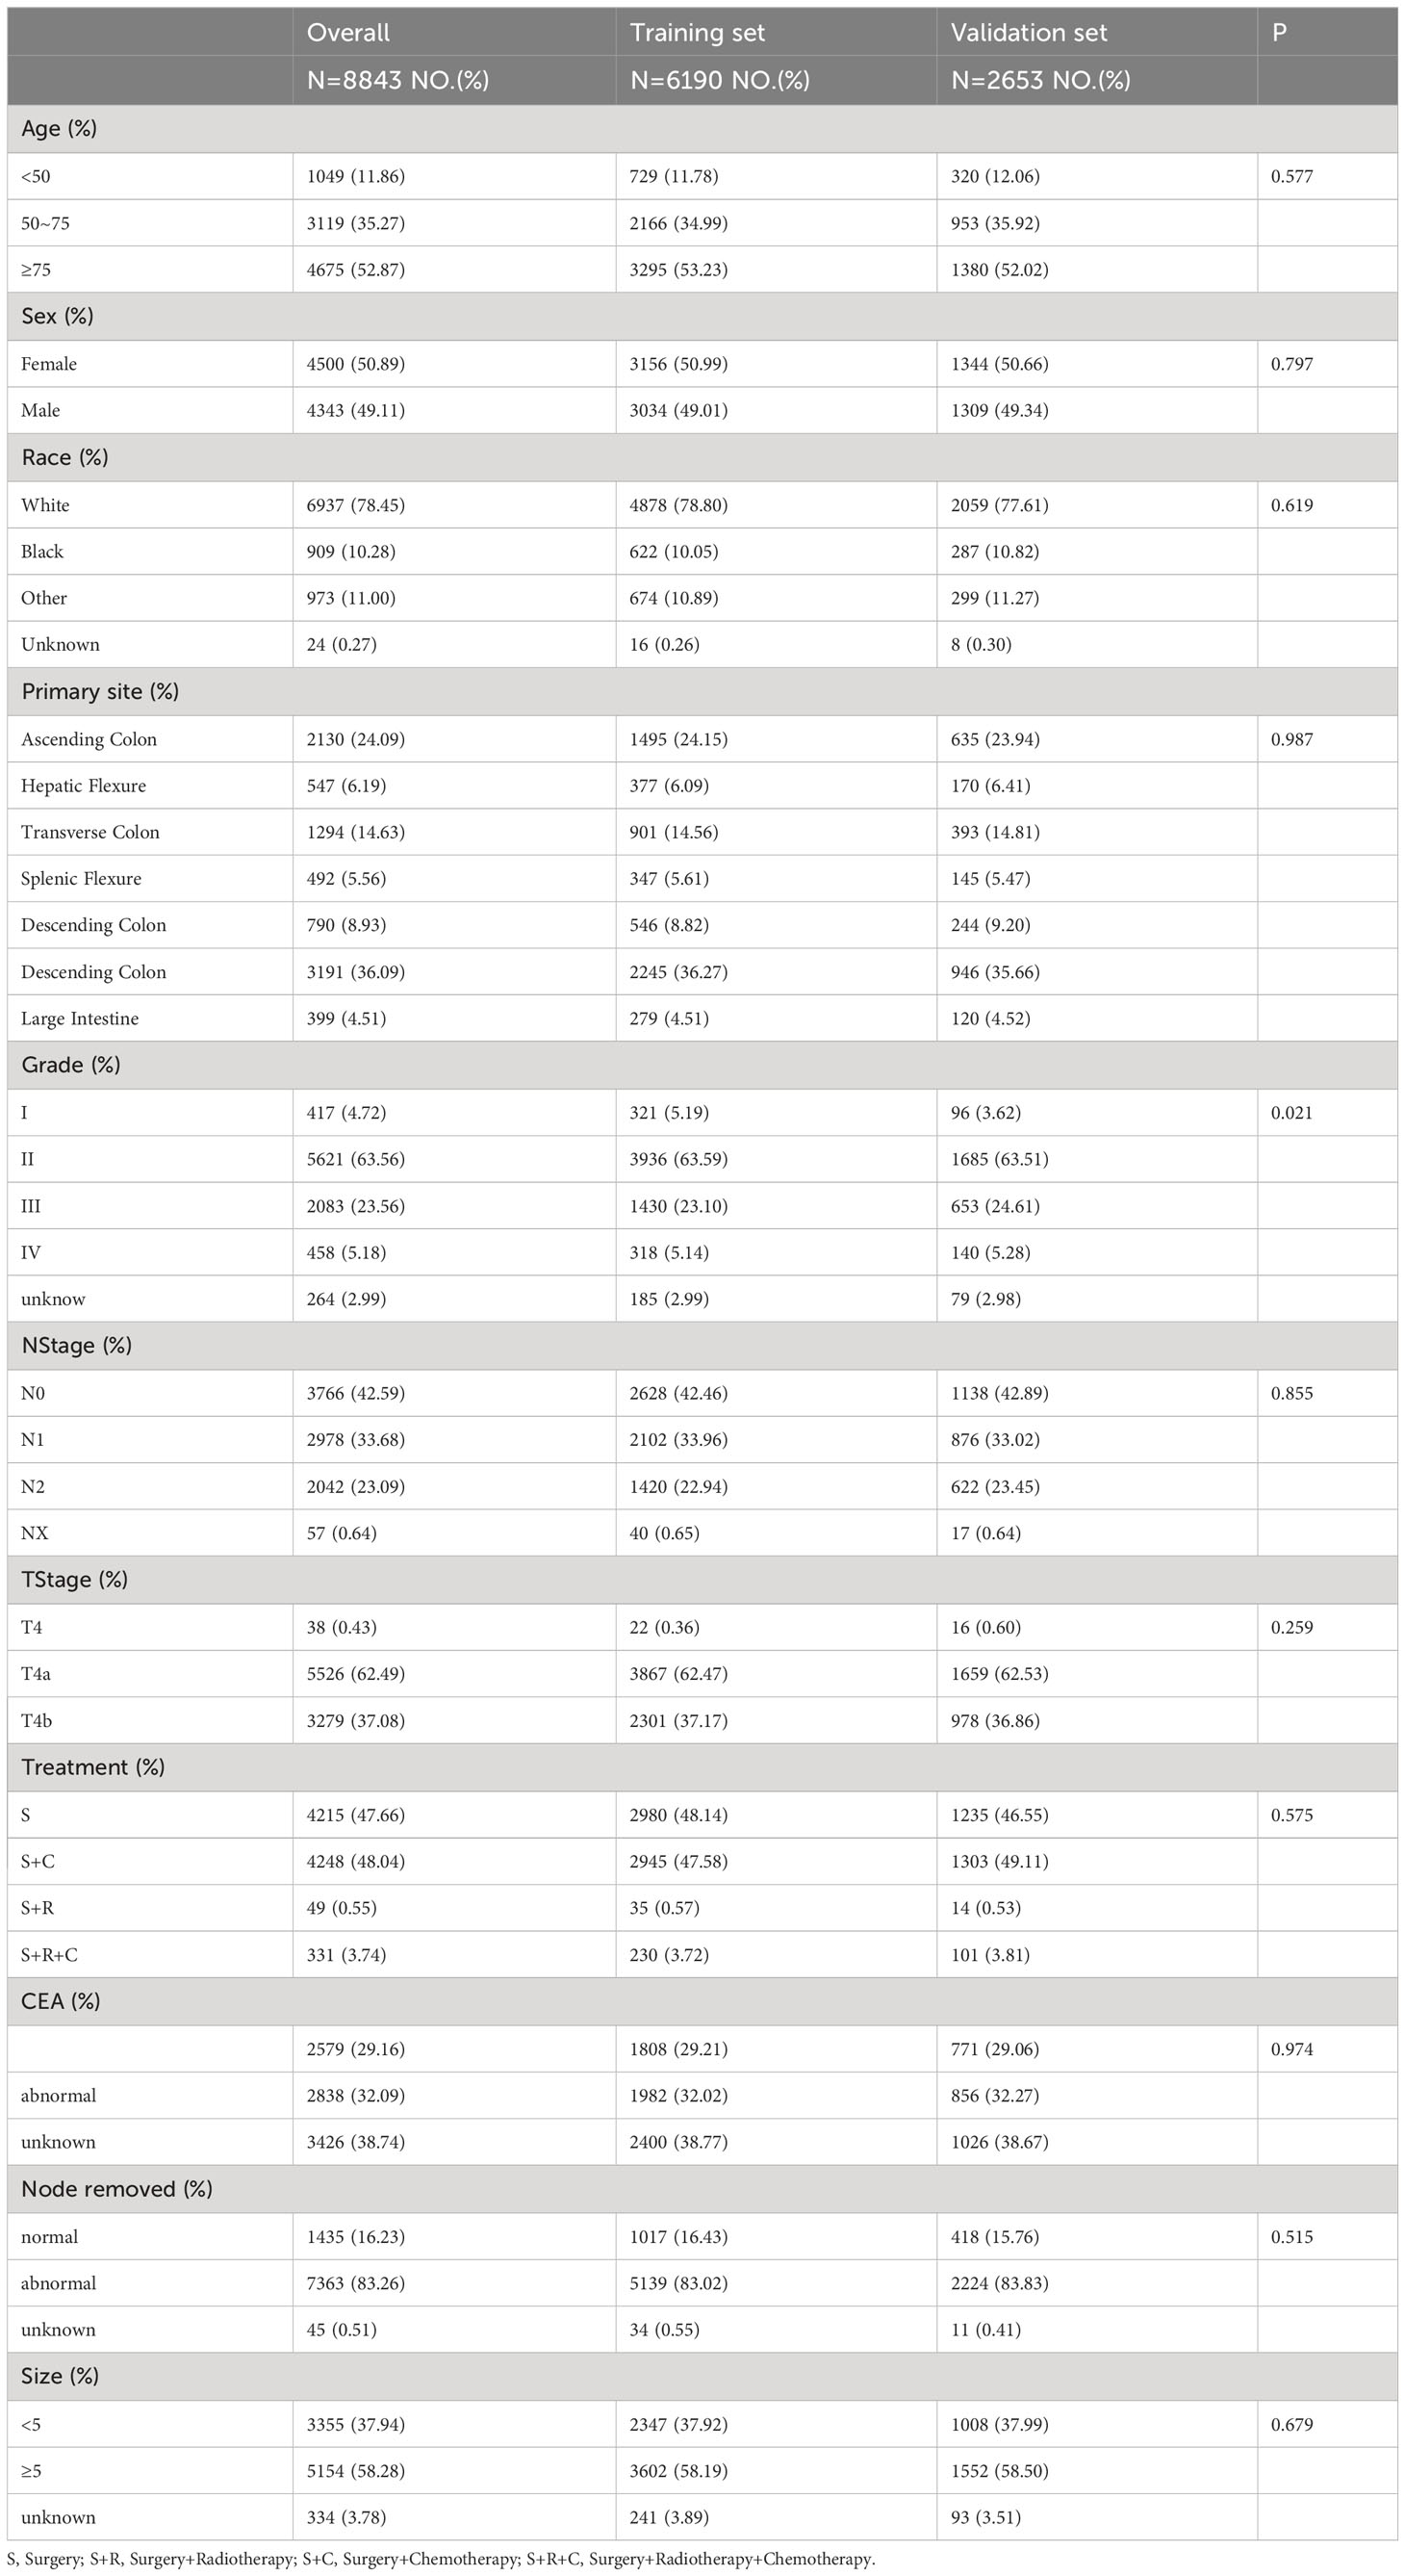
Table 1 Clinical data of the study subjects.
In the total SEER cohort, the median survival for the overall population was 49 (1–119) months, with 1-, 3-, and 5-year OS rates of 86.63%, 68.97%, and 61.19%, respectively. Corresponding CSS rates were 87.89%, 71.83%, and 65.01%. Within the S+C and S+R+C groups, 1-, 3-, and 5-year OS rates were 92.47% vs. 94.56%, 74.41% vs. 73.11%, and 65.16% vs. 64.95%, respectively. For CSS, the rates were 93.08% vs. 95.17%, 76.39% vs. 75.83%, and 61.89% vs. 70.09%. Survival curves for the S+C and S+R+C groups (Figures 1A, C) were similar and superior to those in the S group. Due to limited cases in the S+R and S+R+C groups, they were combined into the S+ADT group. The 1-year OS rate for the S+ADT group was 92.48%, compared to 80.21% in the S group. At 3 years, the rates were 74.22% vs. 63.20%, and at 5 years, 65.06% vs. 56.94%, all significantly better in the S+ADT group (P<0.01). The 1-, 3-, and 5-year CSS rates (93.09%, 76.25%, and 68.13%) in the S+ADT group surpassed those in the S group (Figure 1). These findings strongly supported the recommendation of surgery with postoperative adjuvant therapy for pT4M0 COAD.
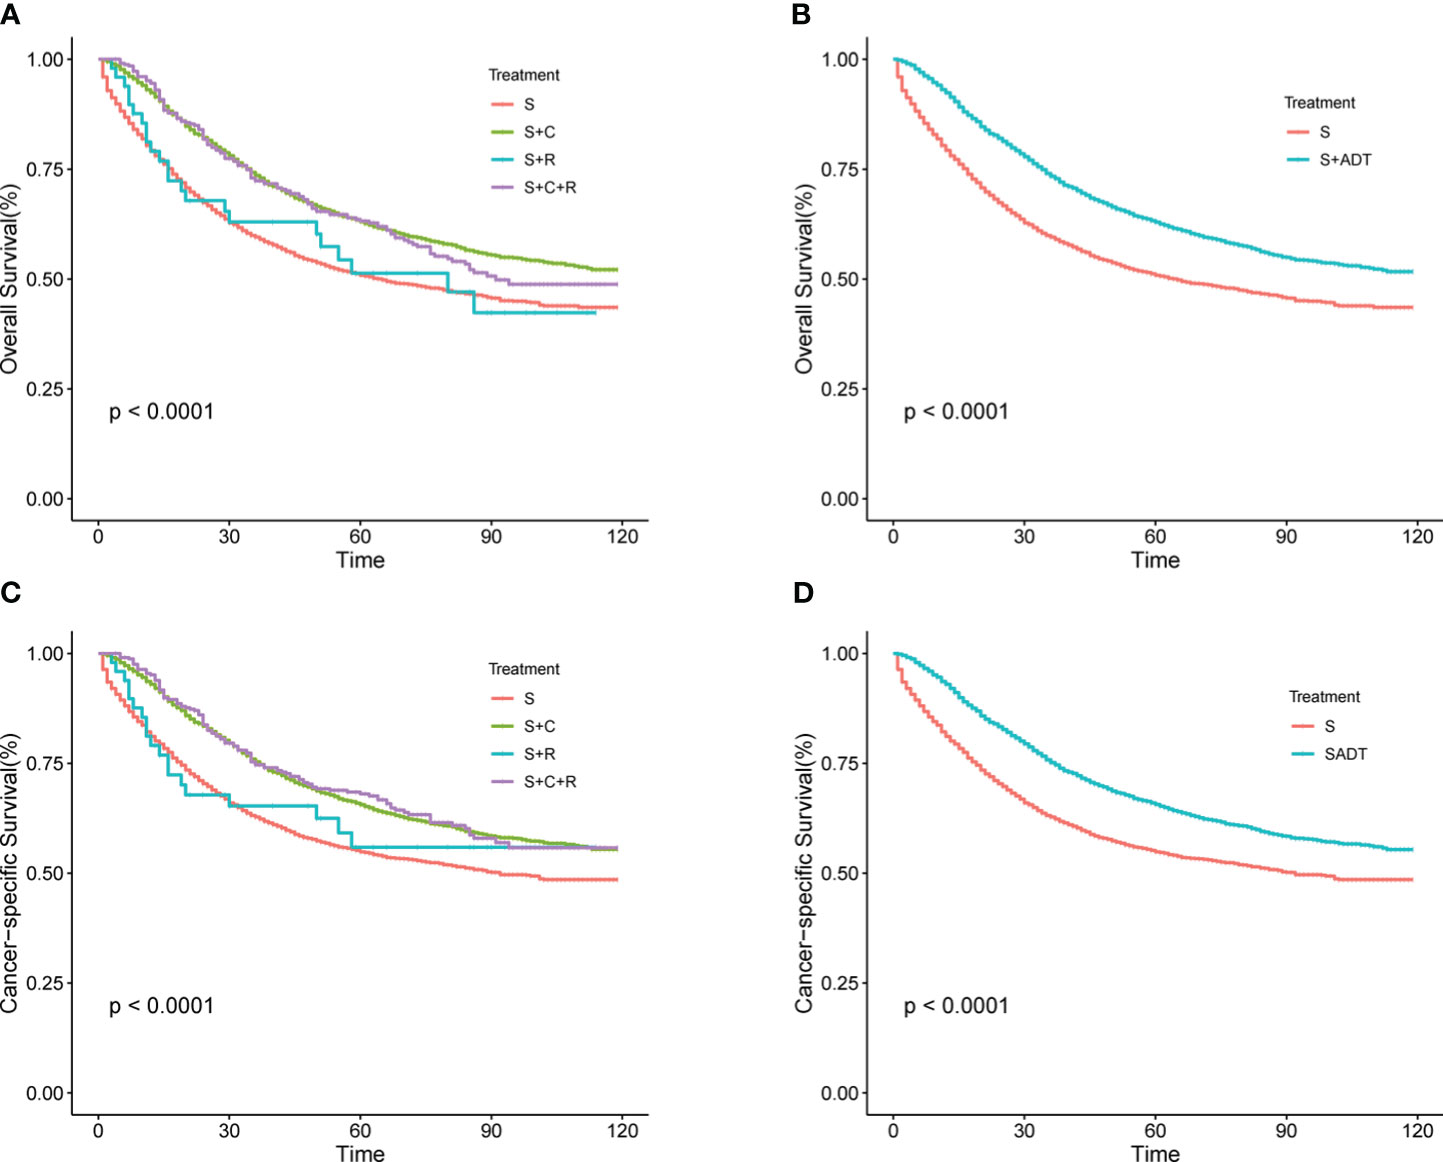
Figure 1 (A–D) Survival rates for T4M0 COAD patients grouped by treatment throughout the cohort. (A) OS rates between four groups (B) OS rates between S and S+ ADT groups (C) CSS rates between four groups (D) CSS rates between S and S+ADT groups.
3.2 Independent prognostic predictors of OS and CSS
Univariate COX regression analysis during training revealed significant influences on OS, including age, race, primary site, degree of differentiation, N stage, serum carcinoembryonic antigen (CEA), tumor size, and number of lymph nodes resected. Similarly, age, race, primary site, gender, degree of differentiation, N stage, serum CEA, tumor size, and the number of lymph nodes resected were associated with CSS (Table 2). In a multifactorial COX regression analysis adjusting for covariates, independent predictors of both OS and CSS included age, race, differentiation grade, N stage, serum CEA, tumor size, and the number of resected lymph nodes (Table 3).
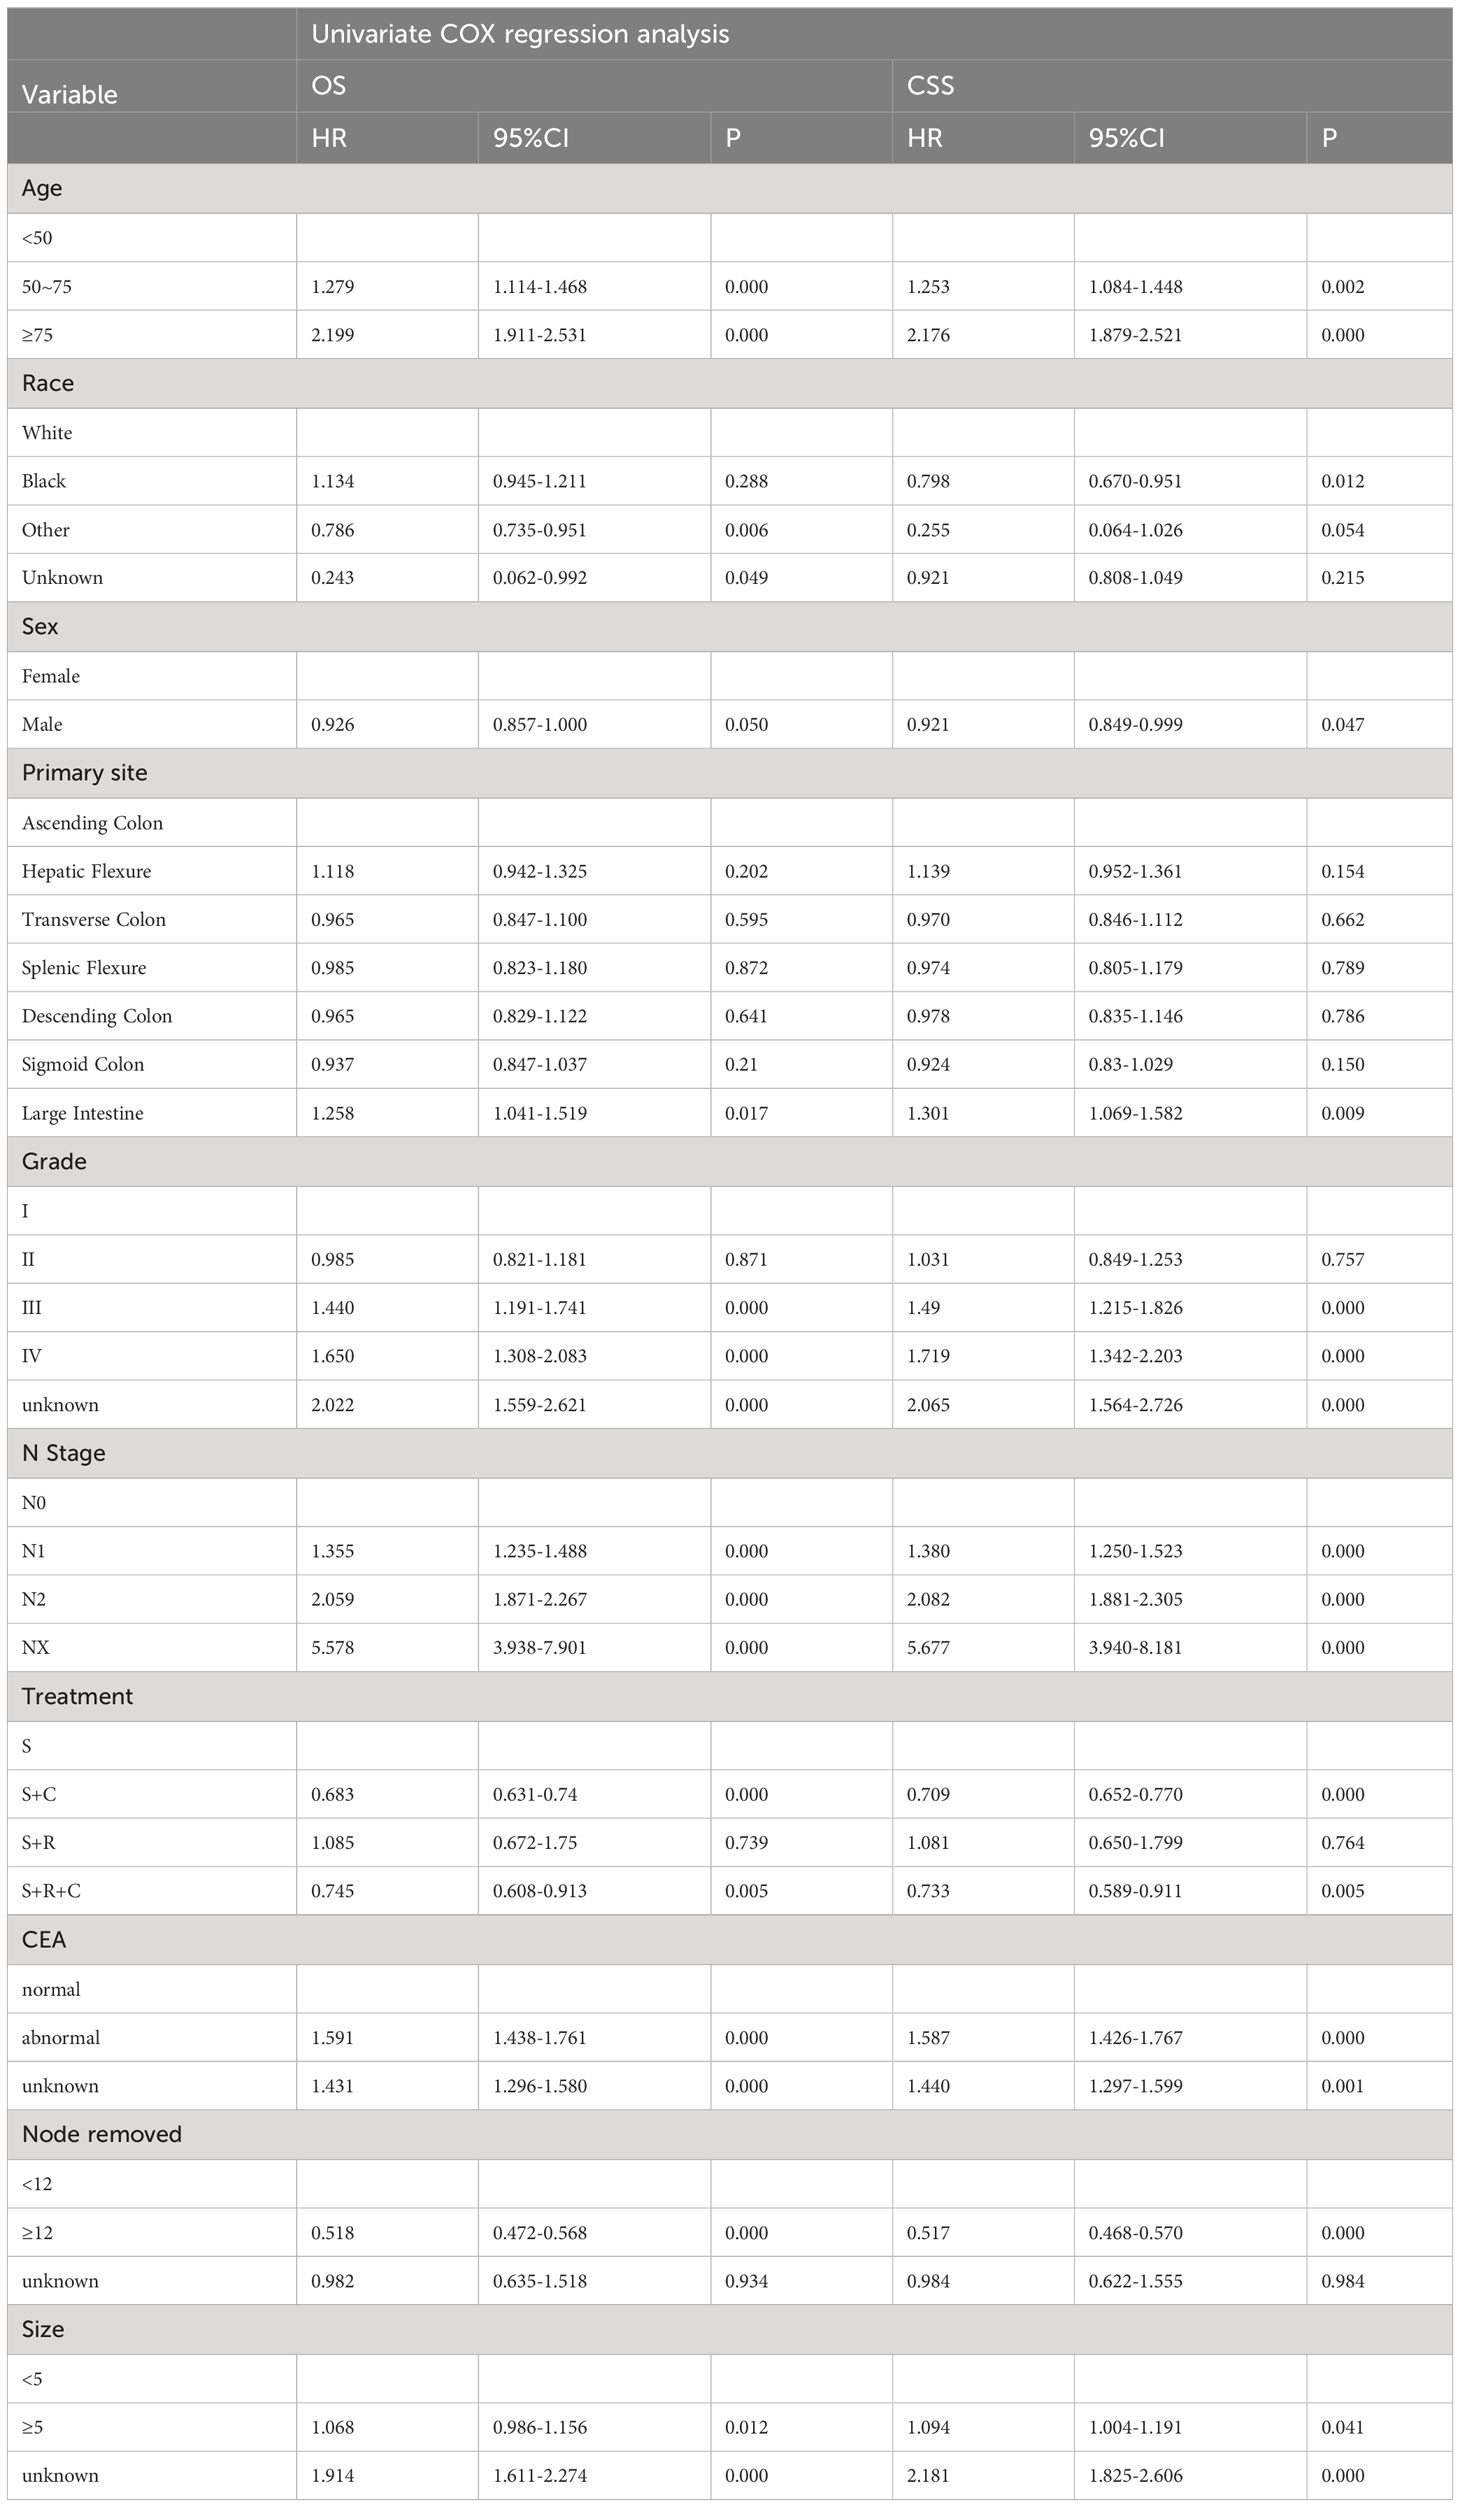
Table 2 Univariate COX regression analysis of OS and CSS.
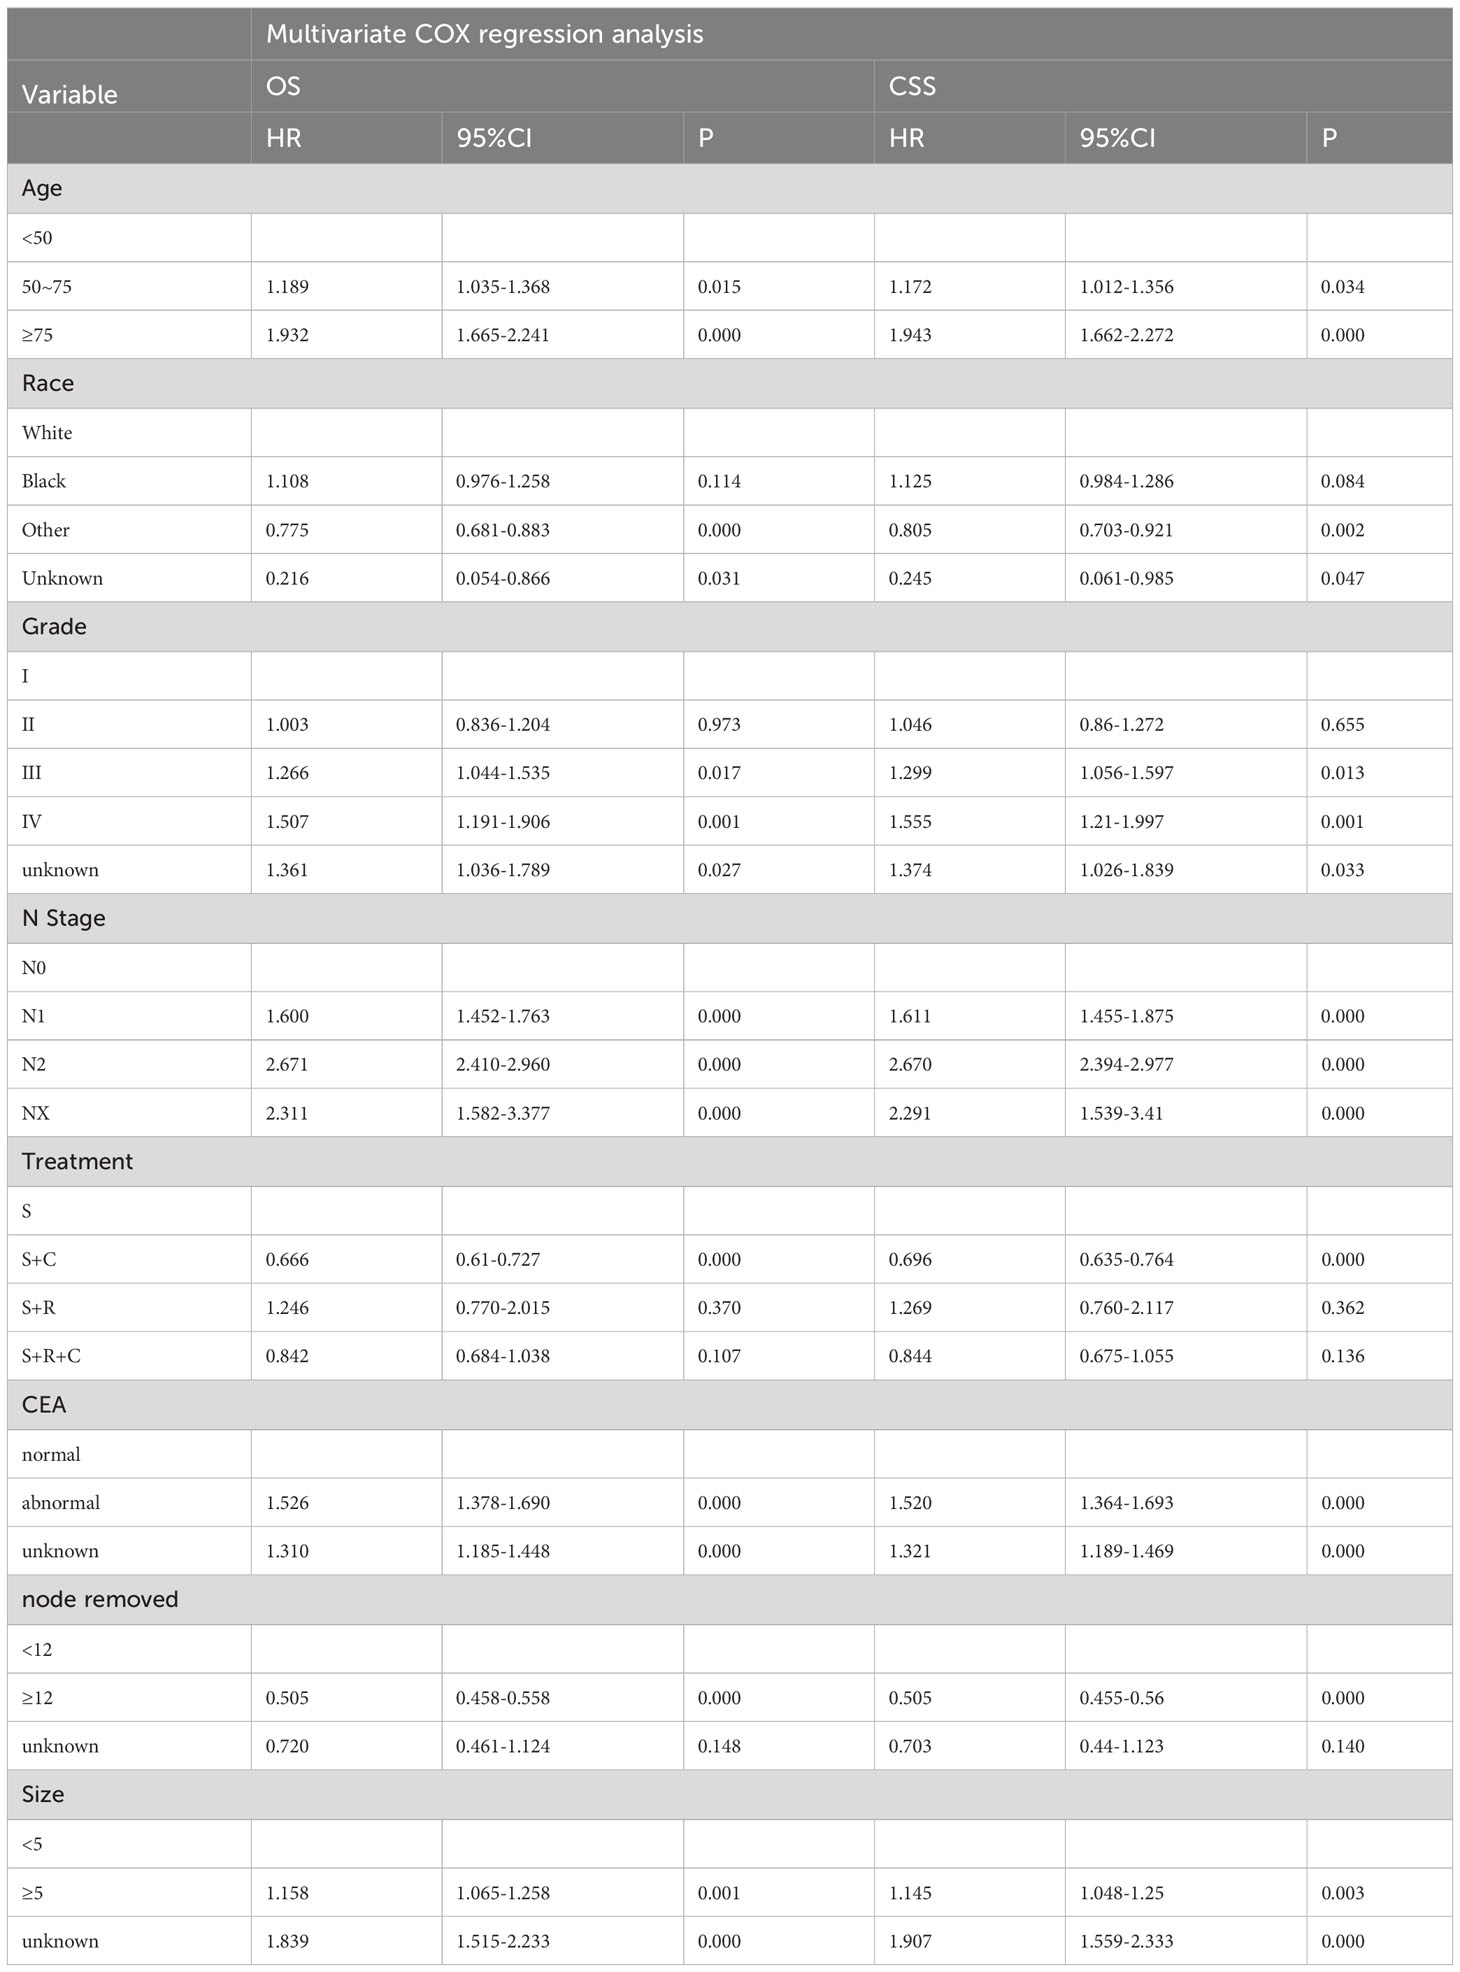
Table 3 Multivariate COX regression analysis of OS and CSS.
3.3 Construction and validation of the nomogram
Nomograms for OS and CSS were developed using independent predictors identified through multifactorial COX regression analysis in the training set (Figure 2). The nomograms highlighted race as the most significant factor impacting OS, followed by N stage, treatment modality, number of resected lymph nodes, age, tumor size, serum CEA levels, and degree of differentiation. Similarly, for CSS, race emerged as the foremost influential factor, succeeded by N stage, number of resected lymph nodes, age, tumor size, treatment modality, degree of differentiation, and serum CEA levels. The R2 values for the OS and CSS models were 0.148 and 0.134, respectively (Supplementary Table 4).
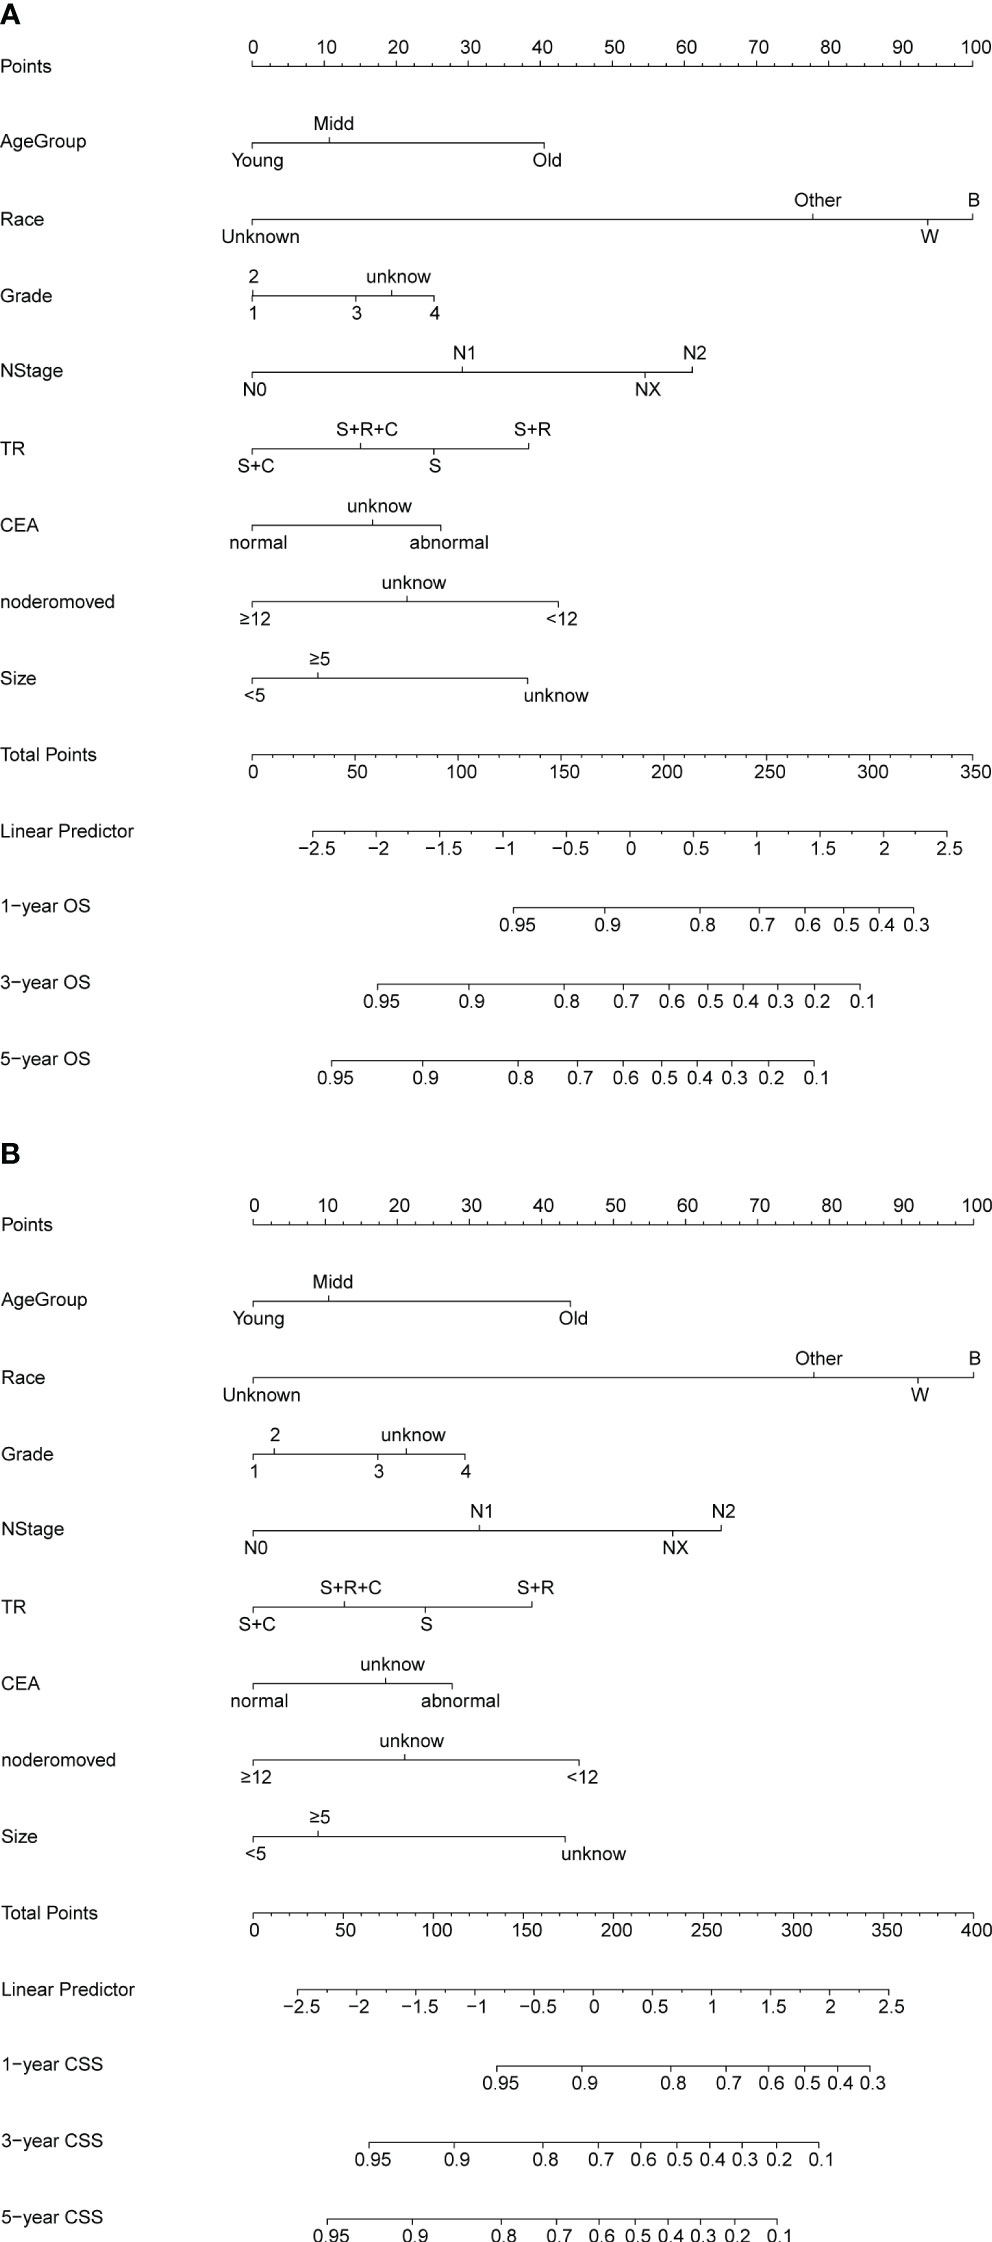
Figure 2 (A, B) Nomogram for predicting OS and CSS of patients with PT4M0 COAD. (A) Nomogram for predicting 1-, 3-, and 5-year OS; (B) Nomogram for predicting 1-, 3-, and 5-year CSS.
The C-index values for predicting OS and CSS in the training set were 0.692 and 0.690, respectively. In the internal validation set, these values improved to 0.703 and 0.708, respectively (Figure 3), indicating commendable accuracy. The area under the curve (AUC) for 1-, 3-, and 5-year OS in the training set was 0.78, 0.74, and 0.72, respectively. In the validation set, these figures were 0.80, 0.75, and 0.73, respectively. As for CSS, the AUC for 1-, 3-, and 5-year OS in the training set was 0.78, 0.73, and 0.72, respectively. In the validation set, these AUCs were 0.80, 0.76, and 0.74, respectively.
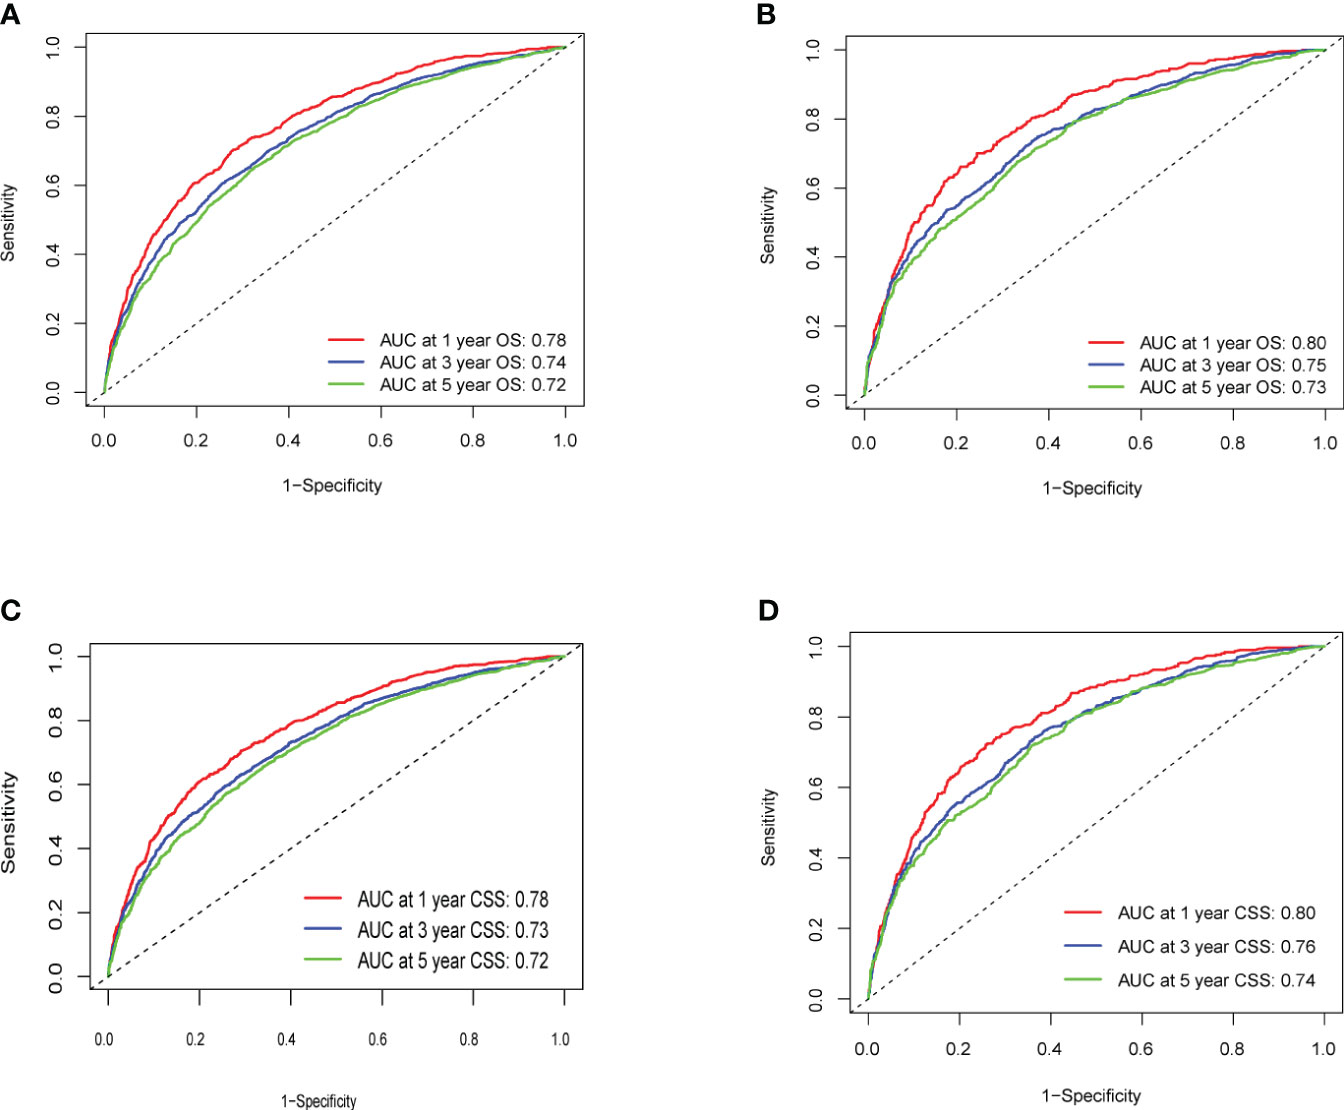
Figure 3 (A–D) ROC Curve of OS and CSS of Training Group and Validation Group. (A) Training Group OS; (B) Validation Group OS; (C) Training Group CSS; (D) Validation Group CSS.
Calibration curves for predicting 1-, 3-, and 5-year OS and CSS exhibited no deviation from the 45-degree diagonal lines in both the training set and the validation set (Figures 4, 5), signifying a high level of agreement between predicted and observed outcomes. Clinical DCA confirmed the robust clinical applicability of the nomograms in predicting 1-, 3-, and 5-year OS and CSS in both the training set (Figure 6) and the validation set (Figure 7).
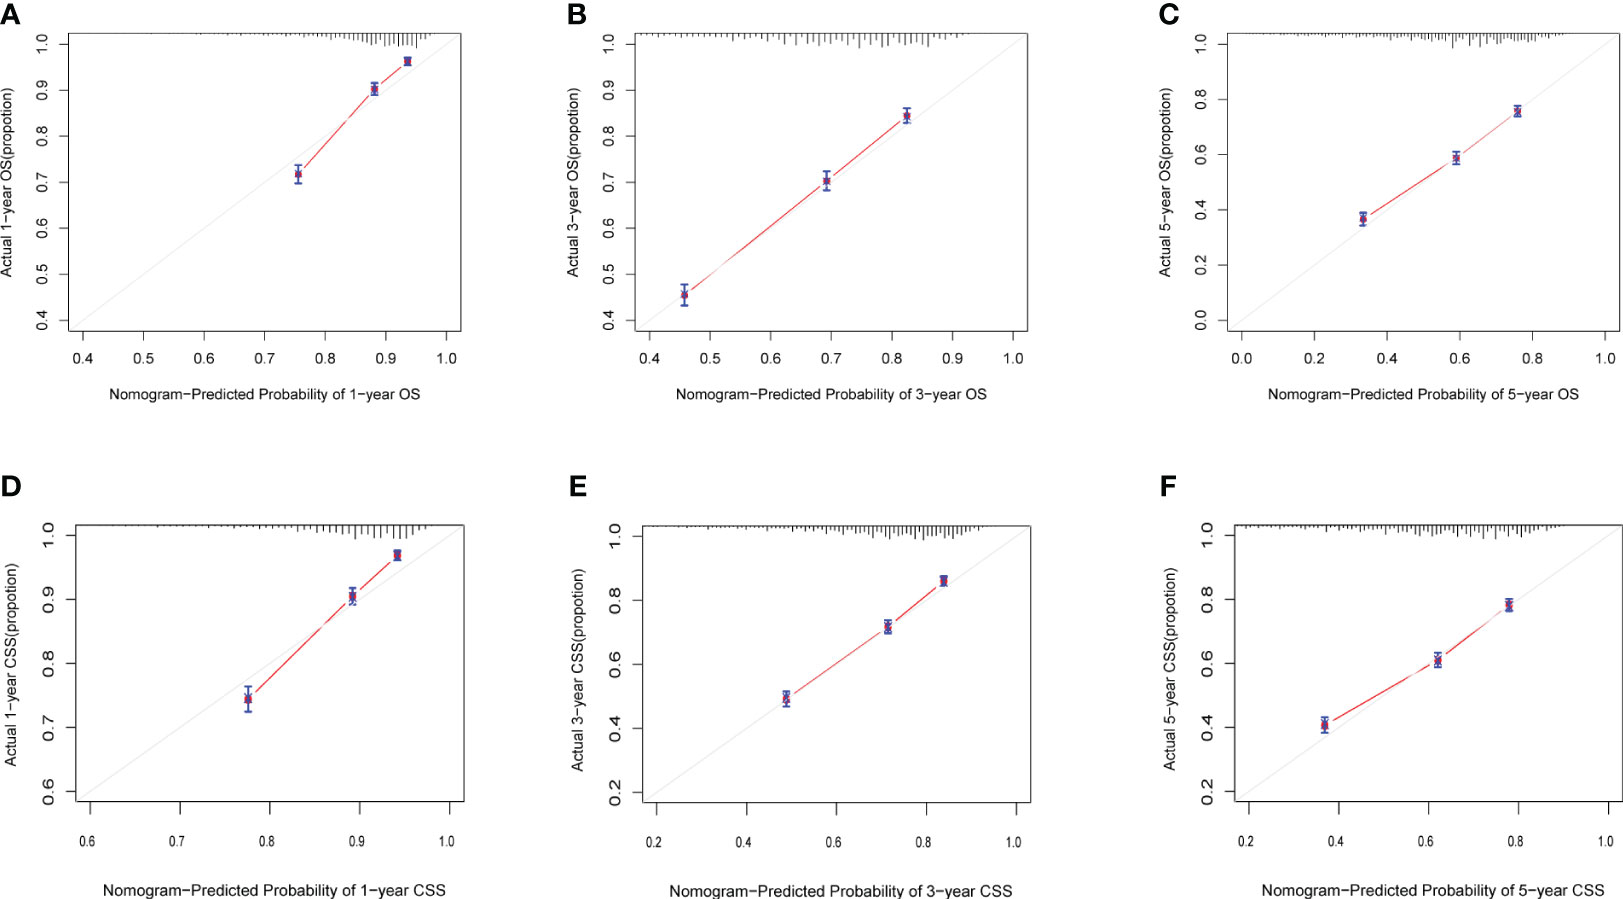
Figure 4 (A–F) Calibration curves of training group 1-, 3-, and 5-year OS and CSS. (A) Training group 1-year OS; (B) Training group 3-year OS; (C) Training group 5-year OS; (D) Training group 1-year CSS; (E) Training group 3-year CSS; (F) Training group 5-year CSS.
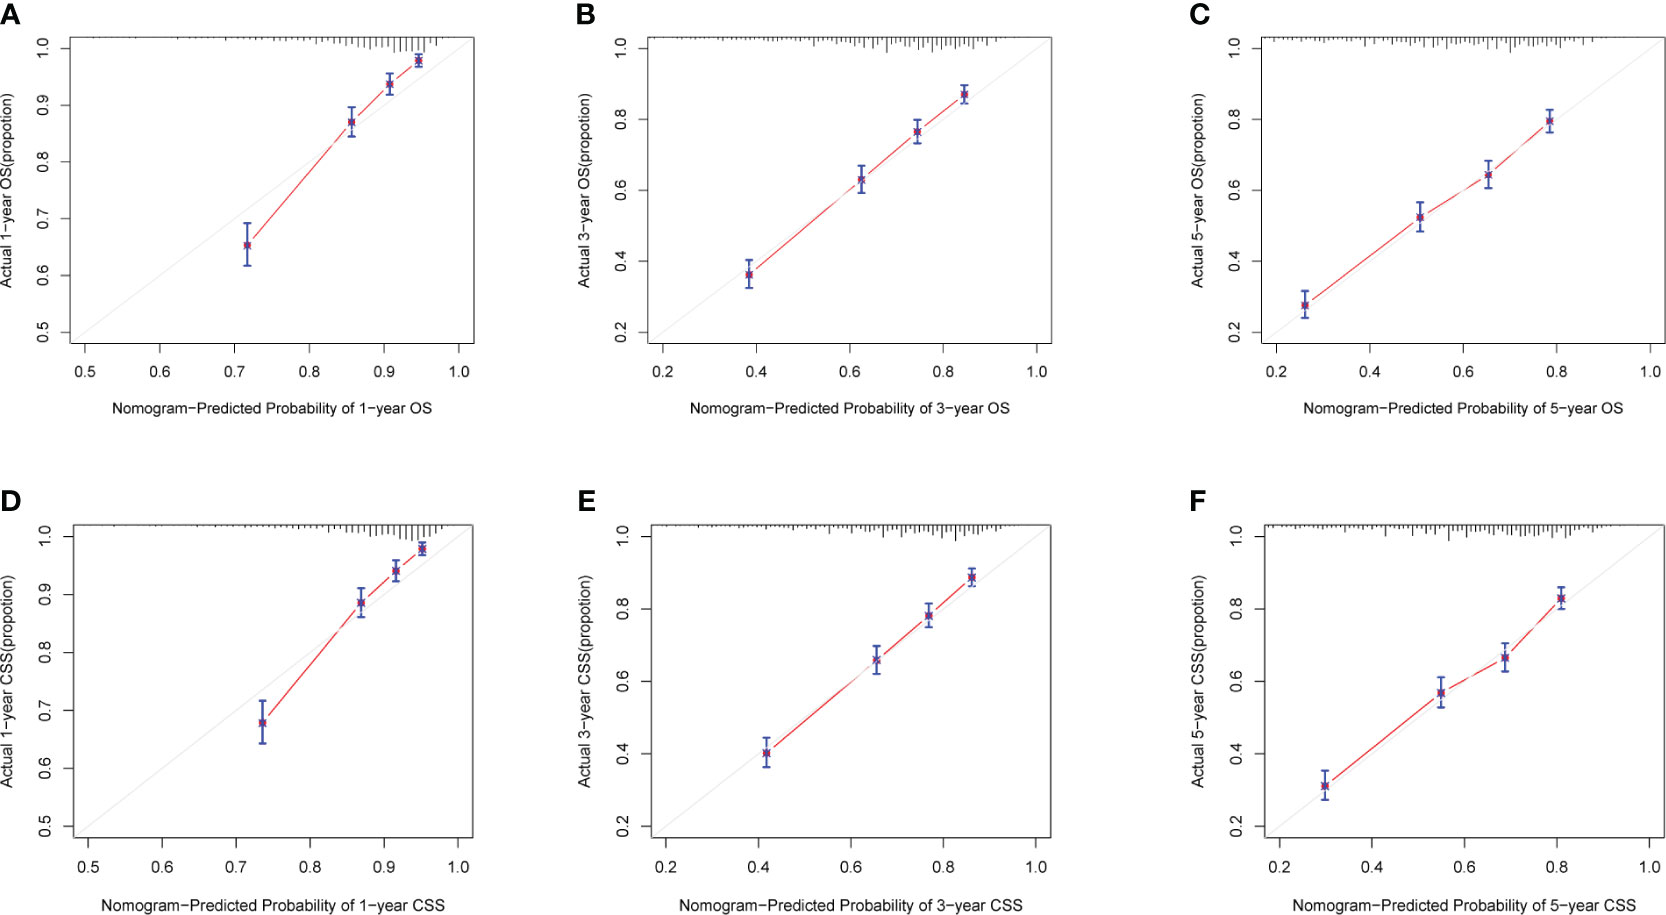
Figure 5 (A-F) Calibration curves of validation group 1-, 3-, and 5-year OS and CSS. (A) Validation group 1-year OS; (B) Training group 3-year OS; (C) Validation group 5-year OS; (D) Validation group 1-year CSS; (E) Validation group 3-year CSS; (F) Validation group 5-year CSS.
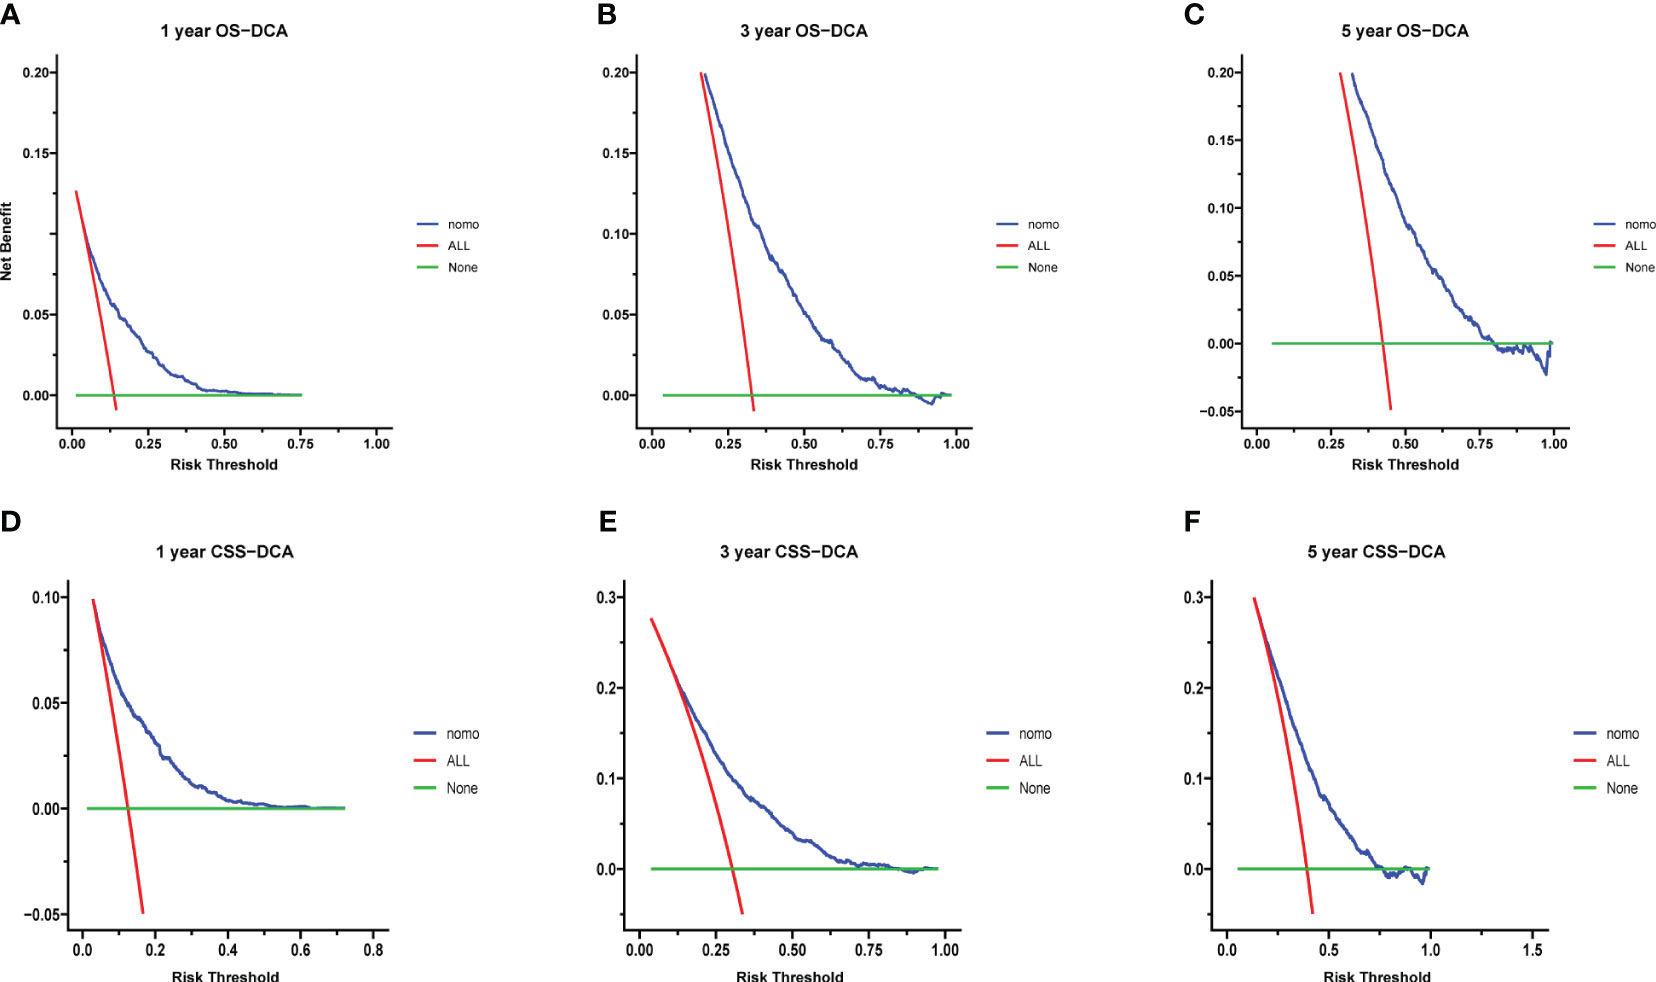
Figure 6 (A–F) Decision curves of training group 1-, 3-, and 5-year OS and CSS. (A) 1-year OS; (B) 3-year OS; (C) 5-year OS; (D) 1-year CSS; (E) 3-year CSS; (F) 5-year CSS.
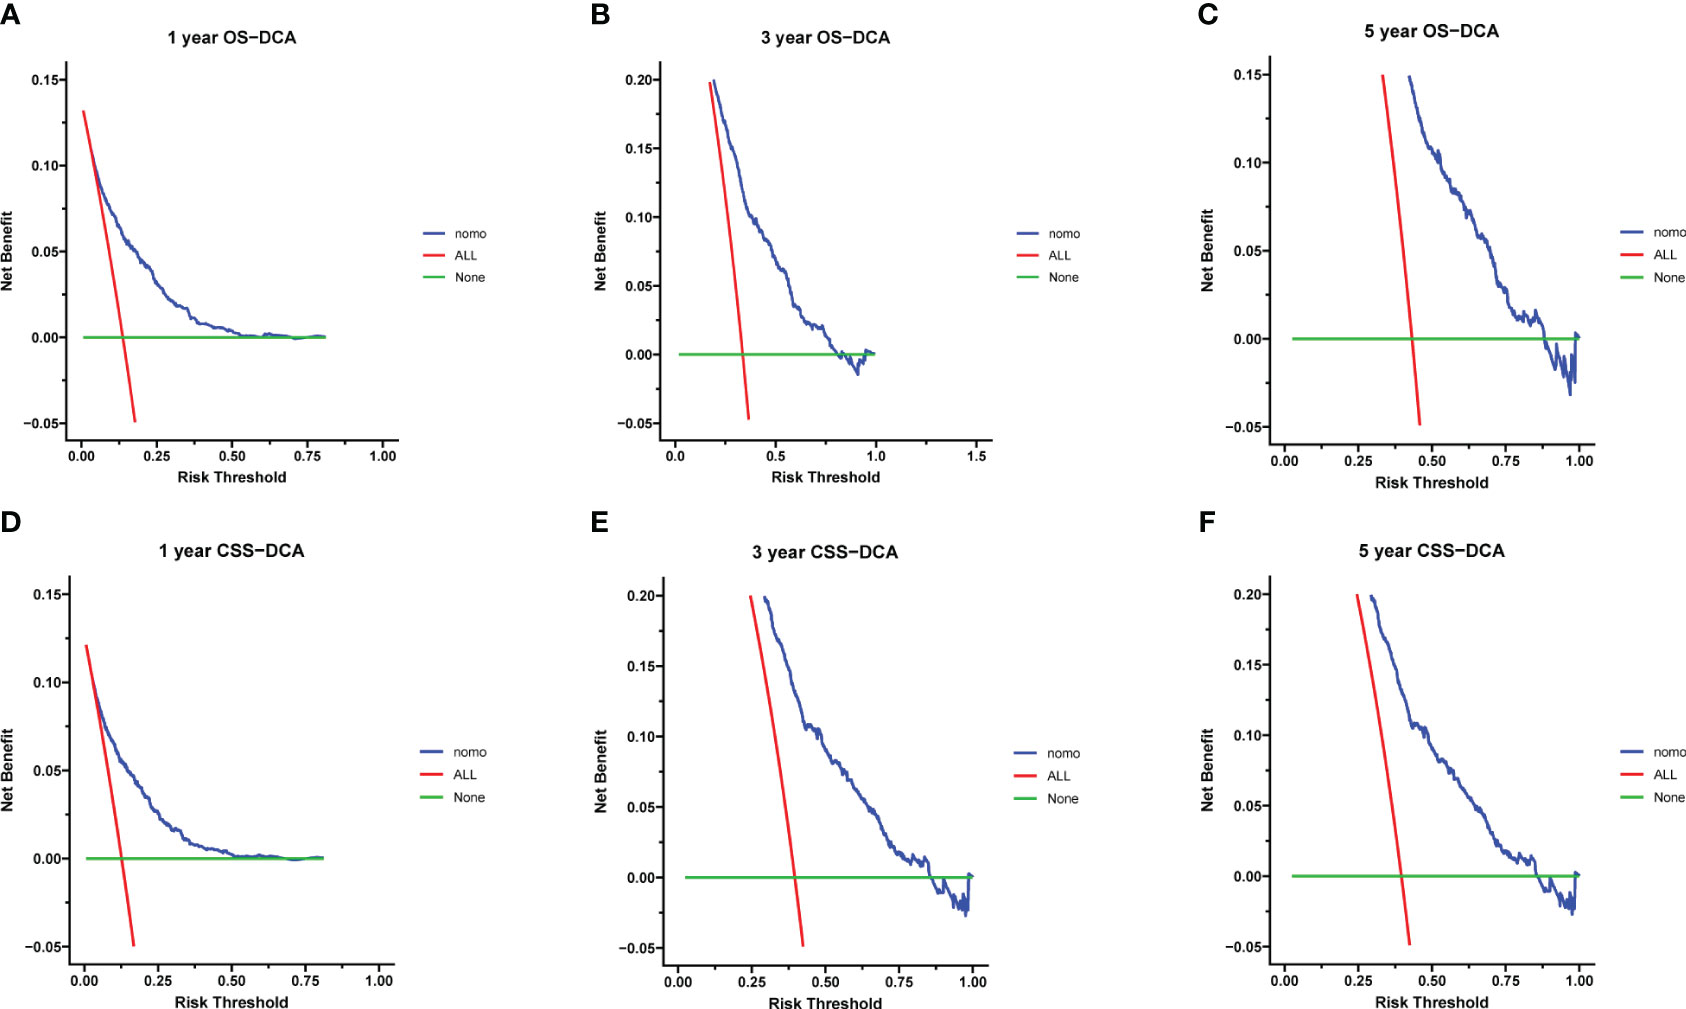
Figure 7 (A–F) Decision curves of validation group 1-, 3-, and 5-year OS and CSS (A) 1-year OS; (B) 3-year OS; (C) 5-year OS; (D) 1-year CSS; (E) 3-year CSS; (F) 5-year CSS.
In conclusion, risk scores, computed through the nomogram, facilitated effective risk stratification. Patients were stratified into three risk subgroups based on cutoff values determined by X-tile software. For the OS nomogram, patients fell into low risk (points ≤ 176.28), intermediate risk (176.28 < points ≤ 236.60), and high risk (points > 236.60) categories. Similarly, the CSS nomogram classified patients into three risk categories: low risk (points ≤ 178.67), intermediate risk (178.67 < points ≤ 245.69), and high risk (points > 245.69). Kaplan-Meier survival curves depicted distinct differentiation among the various risk subgroups (Figure 8).
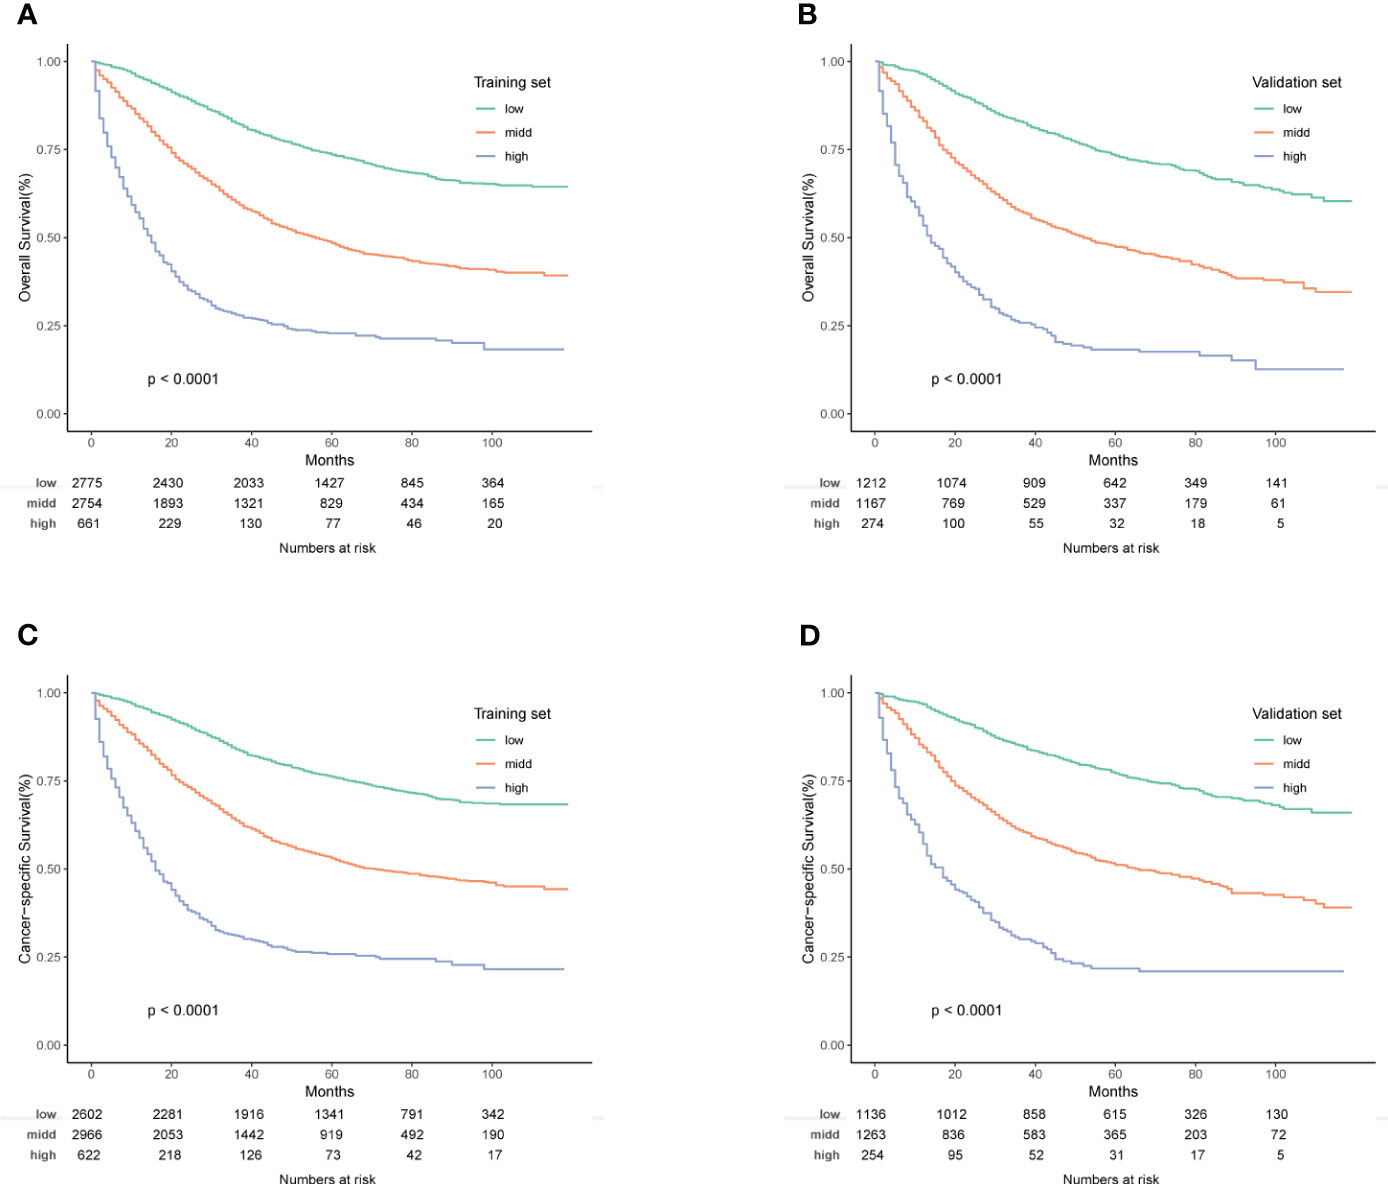
Figure 8 (A–D) Kaplan-Meier OS and CSS survival curves for different risk groups in the training and validation groups. (A) Training group of OS; (B) Validation group of OS; (C) Training group of CSS; (D) Validation group of CSS.
3.4 Subgroup analysis
As depicted in Figure 9, Kaplan-Meier analysis of the treatment group within the pT4aM0 subgroup revealed a more favorable prognosis for the S+R group. Conversely, in the T4bM0 subgroup, Kaplan-Meier analysis demonstrated that the S+R group exhibited similar OS and CSS rates compared to the S group. This suggested that postoperative radiotherapy might confer greater benefits to patients with pT4aM0 COAD. Single and multiple COX regression analyses for OS and CSS were performed for various variables in the pT4aM0 and pT4bM0 subgroups, with results presented in Supplementary Tables 2A, B and Supplementary Tables 3A, B, respectively. Forest plots were generated to visualize the findings (Supplementary Figures 1, 2). The outcomes indicated that the S+C group derived benefits across all subgroups. However, a significant benefit was observed in the S+R+C group within the pT4bM0 subgroup, while no such benefit was evident in the pT4aM0 subgroup.
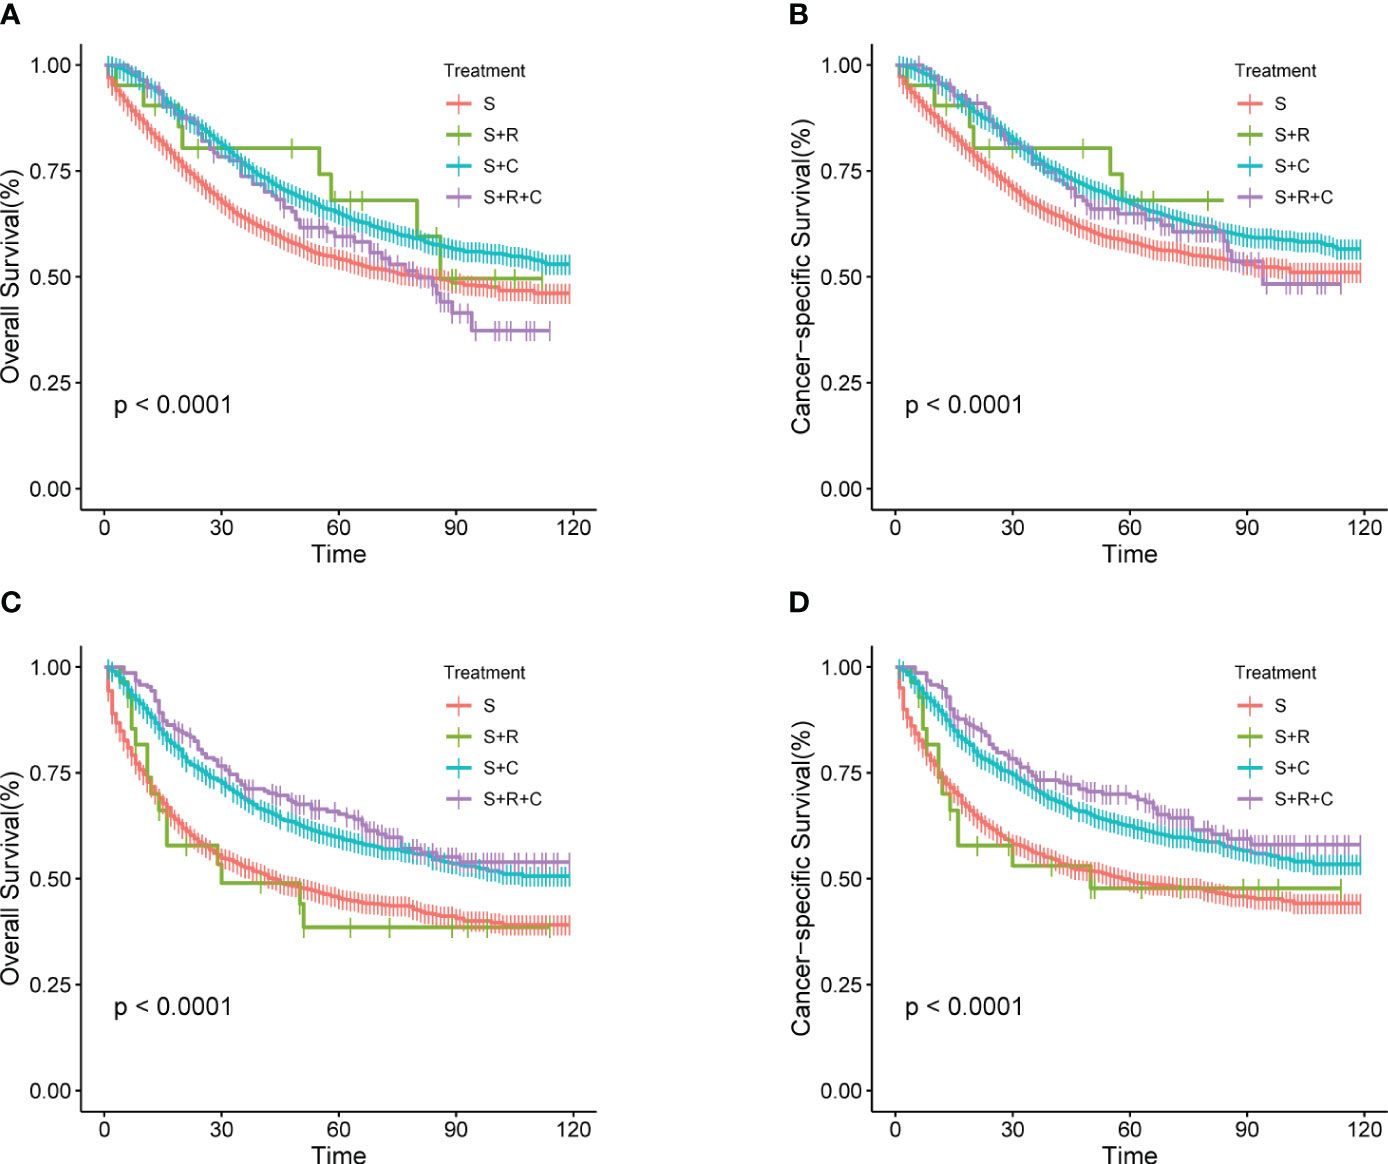
Figure 9 (A–D) Kaplan-Meier Survival curves of OS and CSS for stage pT4aM0 and pT4bM0 COAD comparing different treatments. (A) pT4aM0 group of OS; (B) pT4aM0 group of CSS; (C) pT4bM0 group of OS; (D) pT4bM0 group of CSS.
4 Discussion
The primary recommended treatment for pT4M0 COAD currently involves surgery followed by adjuvant chemotherapy, with adjuvant radiotherapy not considered a standard approach. Early studies (8, 9) indicating improved local control and disease-free survival (DFS) through radiotherapy in locally advanced COAD date back to the 1980s and 1990s. While many studies suggest enhanced survival with postoperative radiation therapy, the absence of supportive phase III trials has limited its acceptance for COAD. Notably, the only randomized controlled phase III trial has failed to establish a role for adjuvant radiotherapy (10).
The prognostic impact of radiotherapy on COAD remains unclear, and its application is generally discouraged in clinical practice. Owing to the limited availability of clinical data, prior studies in this domain often resort to analyzing information from large public databases such as the National Cancer Database (NCDB) and the SEER databases (11–14).
In this study, we conducted a Kaplan-Meier survival a0alysis for the S group, S+C group, S+R group, and S+R+C group, revealing a significant difference (P<0.05). Notably, the S+R+C group exhibited the highest OS rate and CSS rate. The S+C group demonstrated the second-highest rates, while the S group had the lowest rates. However, survival analysis between the S+C and S+R+C groups did not reveal statistically significant differences. A phase III trial has indicated similar OS and DFS for patients receiving chemotherapy, with higher toxicity observed in those undergoing single chemoradiotherapy (10).
Several studies, have investigated the progression of COAD, suggesting that the critical period for progression often occurs within 3 years post-surgery (15, 16). Our study aligned with these findings, revealing a 3-year OS of 68.97% and a 1-year OS of 86.63% for patients with pT4M0 COAD. The 3-year CSS was 71.83%, and the 1-year CSS was 87.89%.
The determinants of prognosis for COAD remain inconclusive, with varied results across studies. Wang et al. (17) have emphasized the significance of the tumor primary site, T stage, and serum CEA level, while Vergara-Fernandez et al. (18) have underscored the importance of the number of resected lymph nodes and nerve invasion. This complexity suggests that the recurrence of COAD metastasis is likely influenced by multiple and intricate factors.
To predict OS and CSS, we constructed nomograms based on multifactorial COX regression analysis, incorporating factors such as age, race, degree of differentiation, N stage, serum CEA levels, tumor size, and the number of resected lymph nodes. Validation was performed using calibration curves, ROC curves, and DCA, with further confirmation from an independent validation group.
Our findings revealed that age independently impacted prognosis, with 52.87% of patients aged ≥75 years in the entire SEER cohort. Patients in this age group faced a more than twofold higher risk of death compared to those aged <50 years (HR = 1.943, 95% CI: 1.662-2.272, P < 0.001), likely associated with poorer health status and a higher prevalence of comorbidities, consistent with previous studies (5, 6, 11, 19).
Serum CEA level was routinely used as an indicator for diagnosing and monitoring COAD (20–22). In our study, elevated serum CEA emerged as an independent risk factor for prognosis (HR = 1.319, 95% CI: 1.186-1.466, P = 0.000). Although serum CEA levels can rise in various malignant tumors and inflammatory or degenerative diseases, our study supported its role as an independent prognostic factor.
N stage, reflecting the extent of local advancement, was a significant prognostic factor. Patients with stage N1 faced a 1.611 times higher risk of death than those with stage N0 (95% CI: 1.455-1.875, P = 0.000), while stage N2 patients had a 2.67 times higher risk (95% CI: 2.394-2.977, P = 0.000). The number of resected lymph nodes, with a threshold of 12, influenced prognosis, with better outcomes for patients with ≥12 lymph nodes resected compared to those with <12 (P < 0.001, 95% CI: 0.455-0.560), consistent with prior studies (4, 18, 23, 24).
Tumor size ≥5 cm was associated with a 1.145 times higher risk of death than sizes <5 cm (95% CI: 1.048-1.25, P = 0.003). Pathopathological grades III and IV carried a higher risk of death compared to grade I (HRs: 1.299 vs. 1.555, P < 0.05), while the risk in grade II, though higher than grade I, did not reach statistical significance (P = 0.655).
In contrast to previous analyses of COAD prognosis, this study focused on a survival analysis of the treatment modality. While the radiotherapy group had a relatively small number of cases in the survival analysis, there was only a slight difference in the distribution of baseline clinical characteristics of the data (P>0.05), and therefore, propensity score matching (PSM) was not performed.
Acknowledging certain limitations in our study is essential. Being a retrospective study, it is susceptible to selection bias between groups. First, the information in the SEER database, collected by a single center, did not provide insight into whether patients received subsequent treatment at other facilities, potentially impacting their survival time. Second, the database lacked detailed information on factors such as physical status, CEA expression level, radiotherapy dose, chemotherapy regimen, and infiltration depth, which could enhance the accuracy of diagnostic and prognostic models. Third, the SEER database did not furnish comprehensive details about patients’ underlying diseases, such as severe coronary heart disease, liver and kidney diseases, or diabetes, which play a pivotal role in treatment decisions. Lastly, the patients included in the SEER database are predominantly from the United States, raising the question of the generalizability of the results to the Chinese population. Our study lacked Chinese patients for external validation. Notably, according to the modeling in this study, race independently influenced OS and CSS. Consequently, large-scale randomized controlled trials (RCTs) conducted in China are imperative to validate the potential benefits of postoperative adjuvant chemoradiotherapy.
5 Conclusion
For patients with COAD at the pT4M0 stage, the combination of surgery and adjuvant chemoradiotherapy demonstrated a significant extension of long-term survival. The nomogram, incorporating variables such as age, race, degree of differentiation, N stage, serum CEA level, tumor size, and the number of resected lymph nodes, stood as a reliable tool for predicting OS and CSS rates in this specific cohort. The utilization of this nomogram can prove instrumental for clinicians in identifying high-risk patients and formulating personalized treatment plans tailored to the unique characteristics of individuals with pT4M0 COAD.
Data availability statement
The original contributions presented in the study are included in the article/Supplementary Material. Further inquiries can be directed to the corresponding author.
Author contributions
XZ: Data curation, Software, Writing – original draft. LH: Methodology, Supervision, Writing – review & editing. QM: Data curation, Writing – review & editing. MZ: Data curation, Writing – review & editing. JL: Writing – review & editing.
Funding
The author(s) declare financial support was received for the research, authorship, and/or publication of this article. The study received support from the Major Science and Technology Project of Changzhou Health Commission (ZD202017) and the China International Medical Exchange Foundation Simcere Clinical Research Fund (Z-2014-06-2104).
Conflict of interest
The authors declare that the research was conducted in the absence of any commercial or financial relationships that could be construed as a potential conflict of interest.
Publisher’s note
All claims expressed in this article are solely those of the authors and do not necessarily represent those of their affiliated organizations, or those of the publisher, the editors and the reviewers. Any product that may be evaluated in this article, or claim that may be made by its manufacturer, is not guaranteed or endorsed by the publisher.
Supplementary material
The Supplementary Material for this article can be found online at: https://www.frontiersin.org/articles/10.3389/fonc.2023.1342289/full#supplementary-material
References
1. Bray F, Ferlay J, Soerjomataram I, Siegel RL, Torre LA, Jemal A. Global cancer statistics 2018: GLOBOCAN estimates of incidence and mortality worldwide for 36 cancers in 185 countries. CA Cancer J Clin (2021) 71(2):209–49. doi: 10.3322/caac.21492
2. Cao W, Chen Hd Fau - Yu Y-W, Yu Yw Fau - Li N, Li N Fau - Chen W-Q, Chen WQ. Changing profiles of cancer burden worldwide and in China: a secondary analysis of the global cancer statistics 2020. Chin Med J (Engl) (2021) 134(7):783–91. doi: 10.1097/CM9.0000000000001474
3. Deijen CL, Vasmel JE, de Lange-de Klerk ESM, Cuesta MA, Coene PLO, Lange JF, et al. Ten-year outcomes of a randomised trial of laparoscopic versus open surgery for colon cancer. Surg Endosc (2017) 31(6):2607–15. doi: 10.1007/s00464-016-5270-6
4. Hosseini S, Bananzadeh AM, Mohammadianpanah M, Salek R, Taghizadeh-Kermani A. Prognostic significance of adjuvant radiation therapy in adenocarcinoma of the cecum. Radiat Oncol J(2018) (2018) 36(1):45–53. doi: 10.3857/roj.2017.00332
5. Krishnamurty DM, Hawkins AT, Wells KO, Mutch MG, Silviera ML, Glasgow SC, et al. Neoadjuvant radiation therapy in locally advanced colon cancer: a cohort analysis. J Gastrointest Surg (2018) 22(5):906–12. doi: 10.1007/s11605-018-3676-2
6. Wegner RE, Abel S, Monga D, Raj M, Finley G, Nosik S, et al. Utilization of adjuvant radiotherapy for resected colon cancer and its effect on outcome. Ann Surg Oncol (2020) 27(2):825–32. doi: 10.1245/s10434-019-08042-y
7. Haddock MG. Intraoperative radiation therapy for colon and rectal cancers: a clinical review. Radiat Oncol (2017) 12(1):11. doi: 10.1186/s13014-016-0752-1
8. Amos EH, Mendenhall WM, McCarty PJ, Gage JO, Emlet JL, Lowrey GC, et al. Postoperative radiotherapy for locally advanced colon cancer. Ann Surg Oncol (1996) 3(5):431–6. doi: 10.1007/BF02305760
9. Willett CG, Goldberg S, Shellito PC, Grossbard M, Clark J, Fung C, et al. Does postoperative irradiation play a role in the adjuvant therapy of stage T4 colon cancer? Cancer J Sci Am (1999) 5(4):242–7.
10. Martenson JA Jr., Willett CG, Sargent DJ, Mailliard JA, Donohue JH, Gunderson LL, et al. Phase III study of adjuvant chemotherapy and radiation therapy compared with chemotherapy alone in the surgical adjuvant treatment of colon cancer: results of intergroup protocol 0130. J Clin Oncol (2004) 22(16):3277–83. doi: 10.1200/JCO.2004.01.029
11. Hawkins AT, Ford MM, Geiger TM, Hopkins MB, Kachnic LA, Muldoon RL, et al. Neoadjuvant radiation for clinical T4 colon cancer: A potential improvement to overall survival. Surgery (2019) 165(2):469–75. doi: 10.1016/j.surg.2018.06.015
12. Margalit O, Mamtani R, Lawrence YR, Yang YX, Reiss KA, Golan T, et al. Postoperative radiation for pathologic stage T4 colon cancers receiving adjuvant chemotherapy. Clin Colorectal Cancer (2019) 18(2):226–30.e2. doi: 10.1016/j.clcc.2019.04.004
13. Sebastian NA-O, Tan Y, Miller ED, Williams TM, Diaz DA. Surgery with and without adjuvant radiotherapy is associated with similar survival in T4 colon cancer. Colorectal Dis (2020) 22(7):779–89. doi: 10.1111/codi.14953
14. Huang Y, Gu X, Ge K, Fu G, Chu J, Wei W. The survival benefit of adjuvant radiotherapy for pathological T4N2M0 colon cancer in the Modern Chemotherapy Era: evidence from the SEER database 2004-2015. Artif Cells Nanomed Biotechnol (2020) 48(1):834–40. doi: 10.1080/21691401.2020.1770270
15. Siegel RA-O, Miller KA-O, Goding Sauer A, Fedewa SA, Butterly LF, Anderson JC, et al. Colorectal cancer statistics, 2020. CA Cancer J Clin (2020) 70(3):145–64. doi: 10.3322/caac.21601
16. Buunen M, Veldkamp R, Hop WCJ, Kuhry E, Jeekel J, Haglind E, et al. Survival after laparoscopic surgery versus open surgery for colon cancer: long-term outcome of a randomised clinical trial. Lancet Oncol (2009) 10(1):44–52. doi: 10.1016/S1470-2045(08)70310-3
17. Wang L, Hirano Y, Ishii T, Kondo H, Hara K, Obara N, et al. Left colon as a novel high-risk factor for postoperative recurrence of stage II colon cancer. World J Surg Oncol (2020) 18(1):54. doi: 10.1186/s12957-020-01818-7
18. Vergara-Fernandez O, Navarro-Navarro A, Rangel-Ríos HA, Salgado-Nesme N, Reyes-Monroy JA, Velázquez-Fernández D. Oncological implications of lymph nodes retrieval and perineural invasion in colorectal cancer: outcomes from a referral center. Rev Invest Clin (2018) 70:291–300. doi: 10.24875/RIC.18002505
19. McLaughlin C, Kim NK, Bandyopadhyay D, Deng X, Kaplan B, Matin K, et al. Adjuvant radiation therapy for T4 non-rectal colon adenocarcinoma provides a cause-specific survival advantage: A SEER database analysis. Radiother Oncol (2019) 133:50–3. doi: 10.1016/j.radonc.2018.11.026
20. Kim CG, Ahn JB, Jung M, Beom SH, Heo SJ, Kim JH, et al. Preoperative serum carcinoembryonic antigen level as a prognostic factor for recurrence and survival after curative resection followed by adjuvant chemotherapy in stage III colon cancer. Ann Surg Oncol (2017) 24(1):227–35. doi: 10.1245/s10434-016-5613-5
21. Saito G, Sadahiro S, Kamata H, Miyakita H, Okada K, Tanaka A, et al. Monitoring of Serum Carcinoembryonic Antigen Levels after Curative Resection of Colon Cancer: Cutoff Values Determined according to Preoperative Levels Enhance the Diagnostic Accuracy for Recurrence. Oncology (2017) 92(5):276–82. doi: 10.1159/000456075
22. Magaji BA, Moy FA-O, Roslani AC, Law CW. Survival rates and predictors of survival among colorectal cancer patients in a Malaysian tertiary hospital. BMC Cancer (2017) 17(1):339. doi: 10.1186/s12885-017-3336-z
23. Ren D, Wang WL, Wang G, Chen WW, Li XK, Li GD, et al. Development and internal validation of a nomogram-based model to predict three-year and five-year overall survival in patients with stage II/III colon cancer. Cancer Manag Res (2022) 14:225–36. doi: 10.2147/CMAR.S335665
Keywords: pT4M0 colon cancer, adenocarcinoma, prognosis, model, treatment modality
Citation: Zhao X, Meng Q, Zhou M, Luo J and Hu L (2024) Optimal treatment strategy and prognostic analysis for patients with non-metastatic pT4 colon adenocarcinoma. Front. Oncol. 13:1342289. doi: 10.3389/fonc.2023.1342289
Received: 23 November 2023; Accepted: 11 December 2023;
Published: 08 January 2024.
Edited by:
Francesk Mulita, General University Hospital of Patras, GreeceReviewed by:
Georgios-Ioannis Verras, Epsom and St Helier University Hospitals NHS Trust, United KingdomMarios Platon Dimopoulos, General University Hospital of Patras, Greece
Copyright © 2024 Zhao, Meng, Zhou, Luo and Hu. This is an open-access article distributed under the terms of the Creative Commons Attribution License (CC BY). The use, distribution or reproduction in other forums is permitted, provided the original author(s) and the copyright owner(s) are credited and that the original publication in this journal is cited, in accordance with accepted academic practice. No use, distribution or reproduction is permitted which does not comply with these terms.
*Correspondence: Lijun Hu, hulijun_83@126.com