 Lei Wang
 Zhiyu Fang
 Peixiang Gao
 Junfang Zheng
- 1Department of Urology, Beijing Friendship Hospital, Capital Medical University, Beijing, China
- 2Beijing Key Laboratory of Cancer Invasion and Metastasis Research, Department of Biochemistry and Molecular Biology, School of Basic Medical Sciences, Capital Medical University, Beijing, China
Growing cancer cells are addicted to glutamine. Glutamate dehydrogenase 1 (GLUD1) is one of key enzymes in glutamine metabolism and plays a critical role in the malignancy of diverse tumors. However, its role and molecular mechanism in clear cell renal cell carcinoma (ccRCC) development and progression remain unknown. In this study, analysis results of the GEO/TCGA/UALCAN database showed that GLUD1 level was downregulated in ccRCC tissues. Immunohistochemistry and western blotting results further validated the downregulation of GLUD1 level in ccRCC tissues. GLUD1 level was gradually decreased as ccRCC stage and grade progressed. Low GLUD1 level was associated with a shorter survival and higher IC50 value for tyrosine kinase inhibitors (TKIs) in ccRCC, reminding that GLUD1 level could predict the prognosis and TKIs sensitivity of ccRCC patients. High level of methylation in GLUD1 promoter was positively correlated with the downregulation of GLUD1 level and was negatively correlated with survival of ccRCC patients. GLUD1 overexpression suppressed RCC cell proliferation, colony formation and migration by inhibiting PI3K/Akt/mTOR pathway activation. Low GLUD1 level correlated with suppressive immune microenvironment (TIME) in ccRCC. Together, we found a novel tumor-suppressing role of GLUD1 in ccRCC which was different from that in other tumors and a new mechanism for inhibiting PI3K/Akt/mTOR activation and TIME in ccRCC. These results provide a theoretical basis for GLUD1 as a therapeutic target and prognostic marker in ccRCC.
Introduction
More than 400,000 new cases of renal cell carcinoma (RCC) and nearly 180,000 deaths occurred each year (1). Clear cell renal cell carcinoma (ccRCC) is the most common and invasive subtypes of RCC type (2). The prognosis of ccRCC has been drastically improved over the past decades with the emergence of tumor immunotherapy (3). Currently, most patients are treated with immune checkpoint inhibitors (ICIs) or a combination of ICIs and tyrosine kinase inhibitors (TKIs). Despite clear benefit of these treatments over large populations, there are still some patients who are innately resistant to these treatments or develop resistance within a few months (4). Therefore, there is an urgent need to develop predictive biomarkers that can guide treatment strategies at the individual level.
Glucose and glutamine are the two main nutrient sources during cell proliferation. ccRCC is addicted to glutamine (5–8). Glutamine is converted to glutamate by glutaminase (GLS or GLS2) (9). Glutamate is converted to α-ketoglutarate (α-KG) through one of two sets of enzymes, glutamate dehydrogenase 1 (GLUD1) or transaminase (10). Then, α-KG enters the tricarboxylic acid (TCA) cycle and generates ATP (11). Through the TCA cycle, glutamate also provides precursors for the biosynthesis of amino acids, nucleotides, lipids and reducing equivalents in the form of NADH (necessary for oxidative phosphorylation to synthesize ATP) and NADPH (required for lipid and nucleotide biosynthesis). Since GLUD1 regulated glutaminolysis, ATP production, biosynthesis and affected the occurrence and progression of breast cancer, gastric cancer and lung cancer (12–14), and highly proliferative human tumors display high transaminase and low GLUD expression (14). Therefore, GLUD1 might play a crucial role in ccRCC development and progression. Currently, the role and mechanism of GLUD1 in ccRCC occurrence and development remains unknown.
In this study, we found that GLUD1 expression level was downregulated in ccRCC tissues. Downregulated GLUD1 level was correlated with ccRCC malignancy, and poor prognosis and TKIs sensitivity. The increased methylation in GLUD1 promoter led to the downregulation of GLUD1 level. GLUD1 suppressed ccRCC cell proliferation, colony formation and migration by inhibiting PI3K/Akt/mammalian target of rapamycin (mTOR) pathway activation. GLUD1 level was negatively associated with the tumor immunosuppressive microenvironment (TIME). GLUD1 might be a novel prognostic, predictive marker and potential therapeutic target for ccRCC.
Materials and methods
Bioinformatics analyses
The microarray series (GSE53757) information was obtained from the National Center for Biotechnology Information Gene Expression Omnibus database (NCBI GEO, https://www.ncbi.nlm.nih.gov/gds/?term=GSE53757). The TCGA GLUD1 mRNA level data (RNA Seq v2) in RCC patients was from https://www.synapse.org/. The clinical data were from cBioPortal database (www.cbioportal.org). The protein levels of GLUD1 were from the UALCAN database (http://ualcan.path.uab.edu/).
Tissue collection
Surgical specimens of ccRCC cases and adjacent normal renal tissues were collected from nephrectomy specimens at the Affiliated Beijing Friendship Hospital, Capital Medical University in December 2017. 10 paired ccRCC and normal renal specimens were formalin-fixed and paraffin-embedded for immunohistochemistry (IHC) analysis. Another 12 paired fresh samples were immediately frozen in liquid nitrogen and stored at -80°C for use in western blotting (WB) analysis. All specimens were histologically confirmed by uro-pathologists. The study was approved by the Research Ethics Board of Affiliated Beijing Friendship Hospital and was performed according to the World Medical Association Declaration of Helsinki. All subjects included in the protocol signed a declaration of informed consent. Prior to surgery, the patients had not received any therapies.
Immunohistochemistry
IHC was performed as described before (15). The sections were incubated with anti‐GLUD1 antibody (Cat# PTM-5632, 1:100, PTM Biolabs Inc., Hangzhou, China). Image‐Pro plus 6.0 (MediaCybernetics Inc., SilverSpring, MD, USA) was used to analyze optical densitometry.
Western blotting
WB was performed as previously described (16). The primary antibodies comprised anti-Flag (Cat# AE063), anti-Akt (Cat# A17909), anti-p-Akt (Cat# AP1259), anti-mTOR (Cat# A11354), anti-p-mTOR (Cat# AP0978), anti-GAPDH (Cat# A19056) (all from Abcam, Cambridge, UK) and anti‐GLUD1 antibody (Cat# PTM-5632, PTM Biolabs Inc). The secondary antibodies comprised HPR-labeled anti-rabbit antibody (Cat# ZB-2301) and HPR-labeled anti-mouse antibody (Cat# ZB-2305) (all from ZSGB-BIO, Beijing, China).
Gene set enrichment analysis
The association between phenotypes and GLUD1 expression level was analyzed using gene set enrichment analysis (GSEA v2.2, http://www.broad.mit.edu/gsea/) as previously described (17). A gene set is considered significantly enriched when the false discovery rate (FDR) score is < 0.05.
Methylation level analysis of GLUD1 promoter and correlation analyses with phenotypes and survival
UALCAN online tool (http://ualcan.path.uab.edu/cgi-bin/ualcan-res.pl) was used to analyze methylation levels of GLUD1 promoter in ccRCC and paracancerous tissues. The correlation between methylation levels of GLUD1 promoter and GLUD1 mRNA level and correlation between the methylation level of GLUD1 promoter and clinical phenotype were analyzed by MEXPRESS tool (https://mexpress.be/index.html). MethSurv was used to perform multivariable survival analysis using DNA methylation data.
Plasmid construction, cell culture and transfection
The human renal carcinoma cell lines ACHN and 769-P were obtained from American Type Culture Collection and cultured according to the standard protocols. ACHN and 769-P cells were cultured in RPMI-1640 medium, containing fetal bovine serum (FBS) at a final concentration of 10%. All cell culture reagents were provided by HyClone (Logan, UT, USA). Lipofectamine 2000 (Invitrogen Carlsbad, CA, USA) was used for GLUD1-Flag (Zeqiong, Changsha, China) transfection according to the manufacturer’s protocol.
Cell proliferation assay
The Cell Counting Kit-8 (Dojindo, Kumamoto, Japan) colorimetric assay was conducted to measure the relative number of viable cells (18).
Colony formation assay
The single cell colony formation abilities were measured by plate colony assay in a 6-well plate (19). Triplicate experiments with triplicate samples were performed.
Wound healing assay
Cells were seeded into 6-well cell culture plate and cells were wounded with the tip of a P-20 microtube. Then, wound healing was monitored and measured.
Co-expression gene network of GLUD1
Co-expression online analysis was performed in the website (https://www.cbioportal.org/) by using the mRNA level in the TCGA_KIRC database (TCGA, Nature 2013). With P value < 0.05 as the threshold, the genes which had greater than 0.3 Spearman correlation coefficient with GLUD1 in expression level were selected. Cytoscape software (Cytoscape_v3.8.0) was used to draw gene co-expression network.
Protein-protein interaction (PPI) network construction of GLUD1-related genes
GEO2R (http://www.ncbi.nlm.nih.gov/geo/geo2r/) was applied to uncover differentially expressed genes (DEGs) between ccRCC tumors and adjacent renal tissues. DEGs were screened out using GEO2R according to the criteria of P value < 0.05 and |logFC| > 1. The DEGs which were statistically correlated with GLUD1 (|spearman coefficien| > 0.3) were defined as GLUD1-related genes.
Search Tool for the Retrieval of Interacting Genes/Proteins (STRING, http://string-db.org/) is a database used to predict the interaction among GLUD1-related DEGs. The minimum interaction value is set to 0.4 (medium confidence), and protein nodes that do not interact with other proteins are removed. Then, the network graph was visualized and analyzed using Cytoscape v3.8.0.
KEGG pathway analysis
KEGG analysis was executed by online analysis tools–Database for Annotation, Visualization, and Integrated Discovery (DAVID) (http://david.abcc.ncifcrf.gov/).
Analyses of the correlations of GLUD1 levels with the immunosuppressive microenvironment of ccRCC
The correlations of GLUD1 level with immunosuppressive cells abundances were analyzed on the TISIDB database (http://cis.hku.hk/TISIDB/index.php). Immune score was estimated using Sangerbox (http://vip.sangerbox.com/home.html) for assessing the association between tumor microenvironment components and GLUD1 expression in ccRCC. Tumor Immune Dysfunction and Exclusion (TIDE) (http://tide.dfci.harvard.edu) computational methods were used to predict T cell dysfunction.
Statistical analysis
Statistical analyses were performed using IBM SPSS 26 (SPSS, Inc., Chicago, IL, USA) and Graphpad Prism 8 (Graphpad Software, Inc., San Diego, CA, USA). The paired samples were analyzed by paired samples t-test. The unpaired samples were analyzed by independent samples t-test. The relationship between GLUD1 expression level and clinical stages was analyzed by one-way ANOVA. Overall survival analysis was evaluated by Kaplan–Meier plots and log-rank tests. Correlation between methylation levels of GLUD1 promoter and GLUD1 mRNA level was analyzed by Pearson correlation analysis. Proliferation curve results were analyzed using a repeated measures ANOVA. Correlations between gene expression levels and among GLUD1 level and immune cells infiltration were analyzed by Spearman correlation analysis. A P-value < 0.05 was deemed statistically significant.
Results
GLUD1 is downregulated in ccRCC tissues
In order to clarify the role of GLUD1 in ccRCC, we analyzed the data from GEO database (GSE53757) and the TCGA_KIRC database. We found that GLUD1 mRNA levels were significantly downregulated in ccRCC tissues compared with nontumor tissues (Figures 1A, B). Moreover, based on CPTAC database, we found that GLUD1 protein levels were also decreased in ccRCC tissues compared with normal renal tissues (Figure 1C). Subsequently, we examined GLUD1 protein levels in ccRCC tissues and adjacent renal tissues by IHC and WB, respectively. The results further confirmed that the protein level of GLUD1 in the ccRCC tissues was lower than that in the matched adjacent normal tissues (Figures 1D, E). All these results demonstrate that GLUD1 expression level is downregulated in ccRCC tissues.
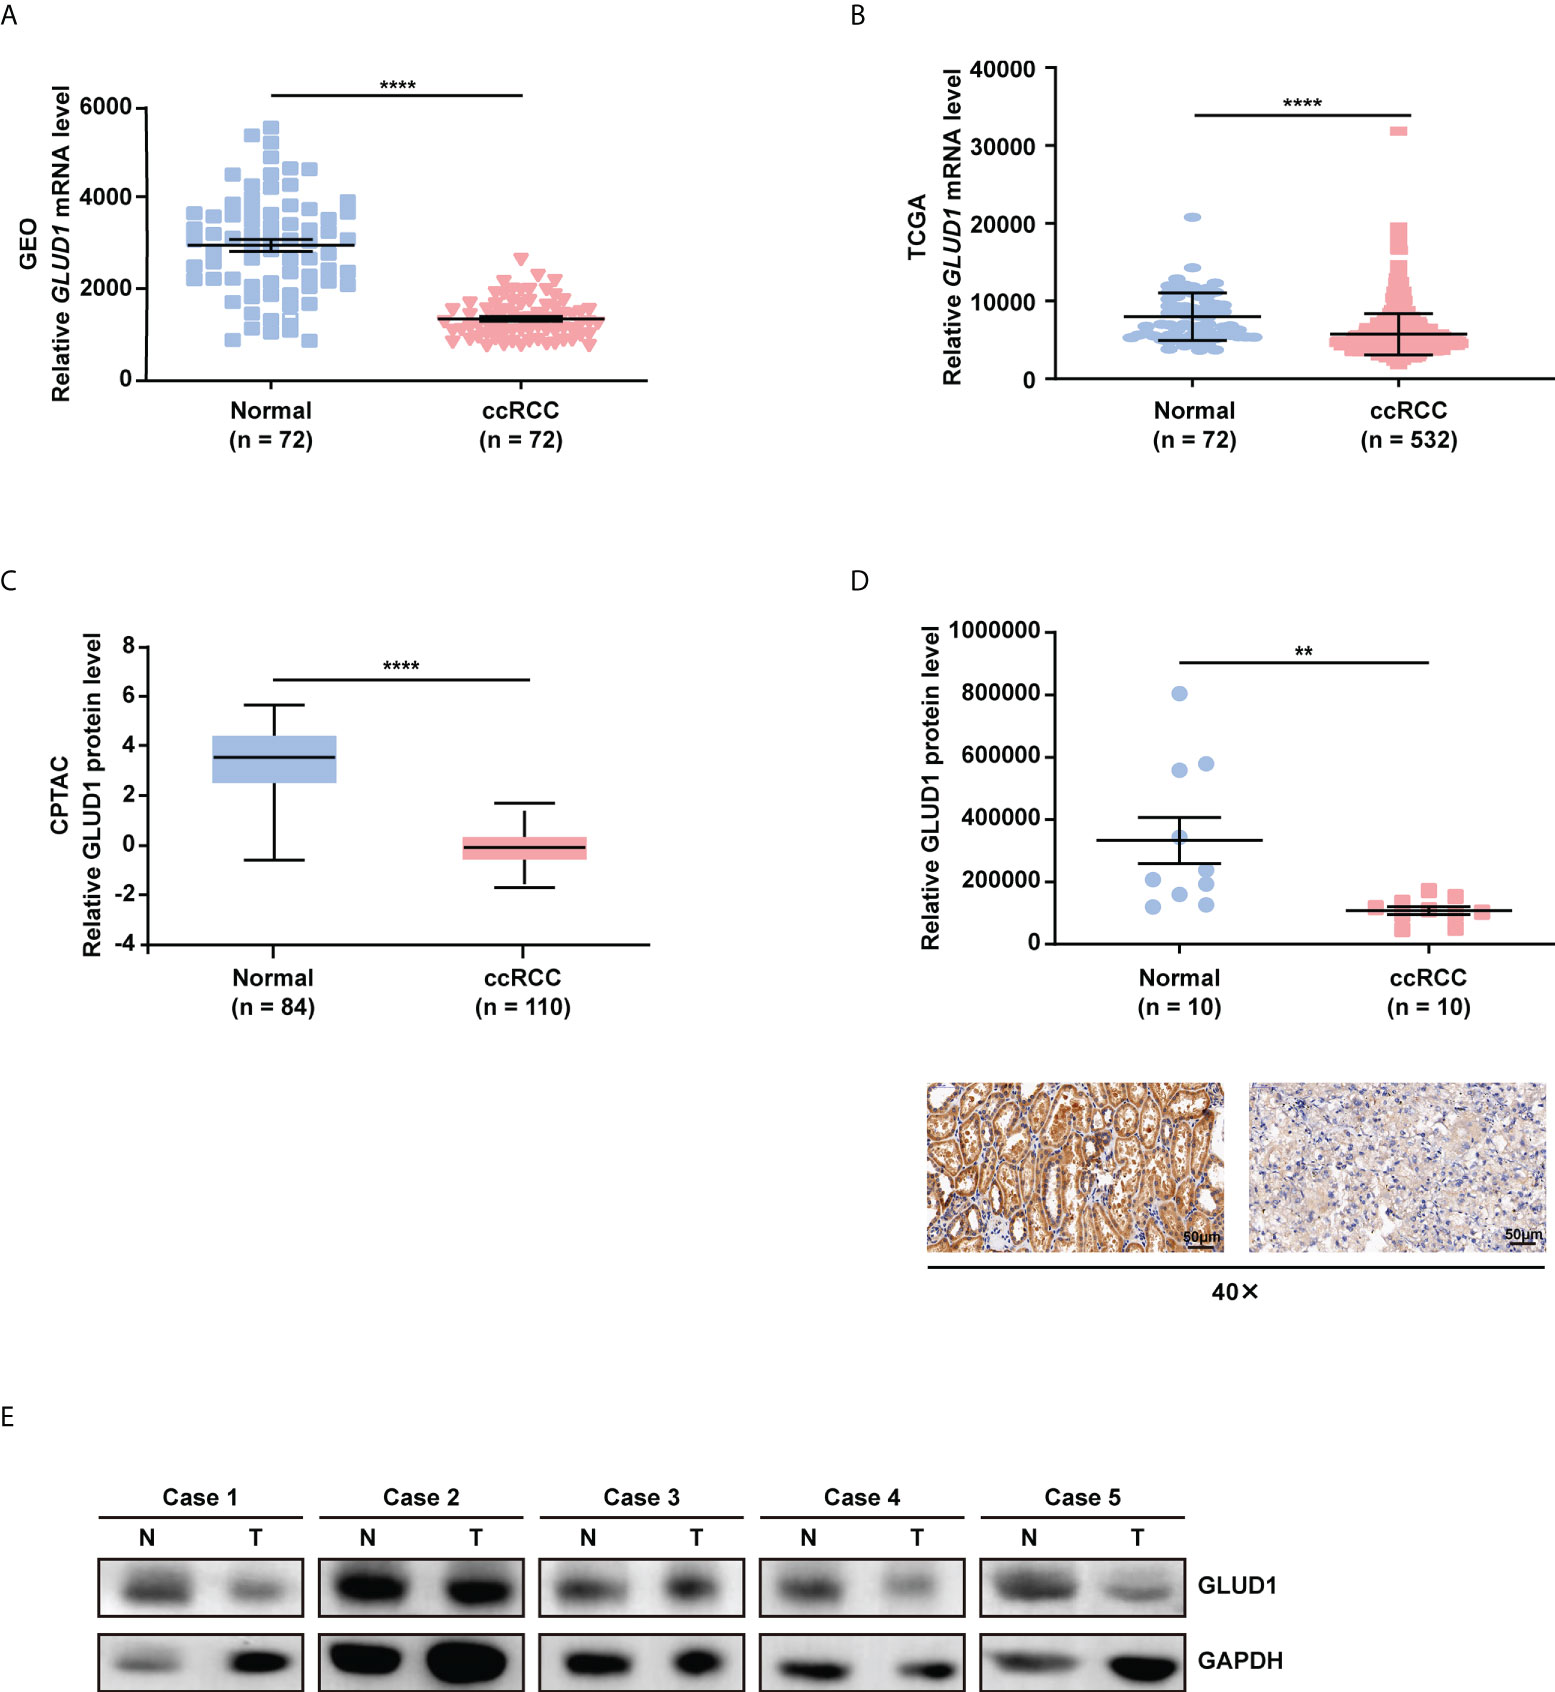
Figure 1 GLUD1 is downregulated in ccRCC tissues. (A, B) GLUD1 mRNA levels in ccRCC tissues compared with normal tissues based on GEO GSE53757 data (A) and TCGA_KIRC data (B) respectively. (C) GLUD1 protein levels in ccRCC tissues compared with adjacent normal tissues based on CPTAC data. (D) GLUD1 protein levels in ccRCC tissues and normal tissues were detected using IHC. Scatter plot displaying the expression of GLUD1 in adjacent normal tissues and ccRCC tissues. (E) GLUD1 protein levels in ccRCC tissues and paired normal tissues were detected using western blot assay. **P < 0.01; ****P < 0.0001.
GLUD1 is a potential prognostic and TKIs sensitivity predictive markers for ccRCC patients
To investigate the clinical significance of GLUD1 downregulation in ccRCC tissues, we analyzed the correlation between GLUD1 expression level and clinicopathological characteristics. GLUD1 mRNA level was gradually decreased as T stage, AJCC stage and Fuhrman grade progressed (Figures 2A–C). The low level of GLUD1 was related with recurrence and relapse of ccRCC patients (Figures 2D, E), while high level of GLUD1 was related with survival of ccRCC patients (Figure 2F). These results reveal that GLUD1 may be a tumor suppressor in ccRCC and potential prognostic marker for ccRCC patients.
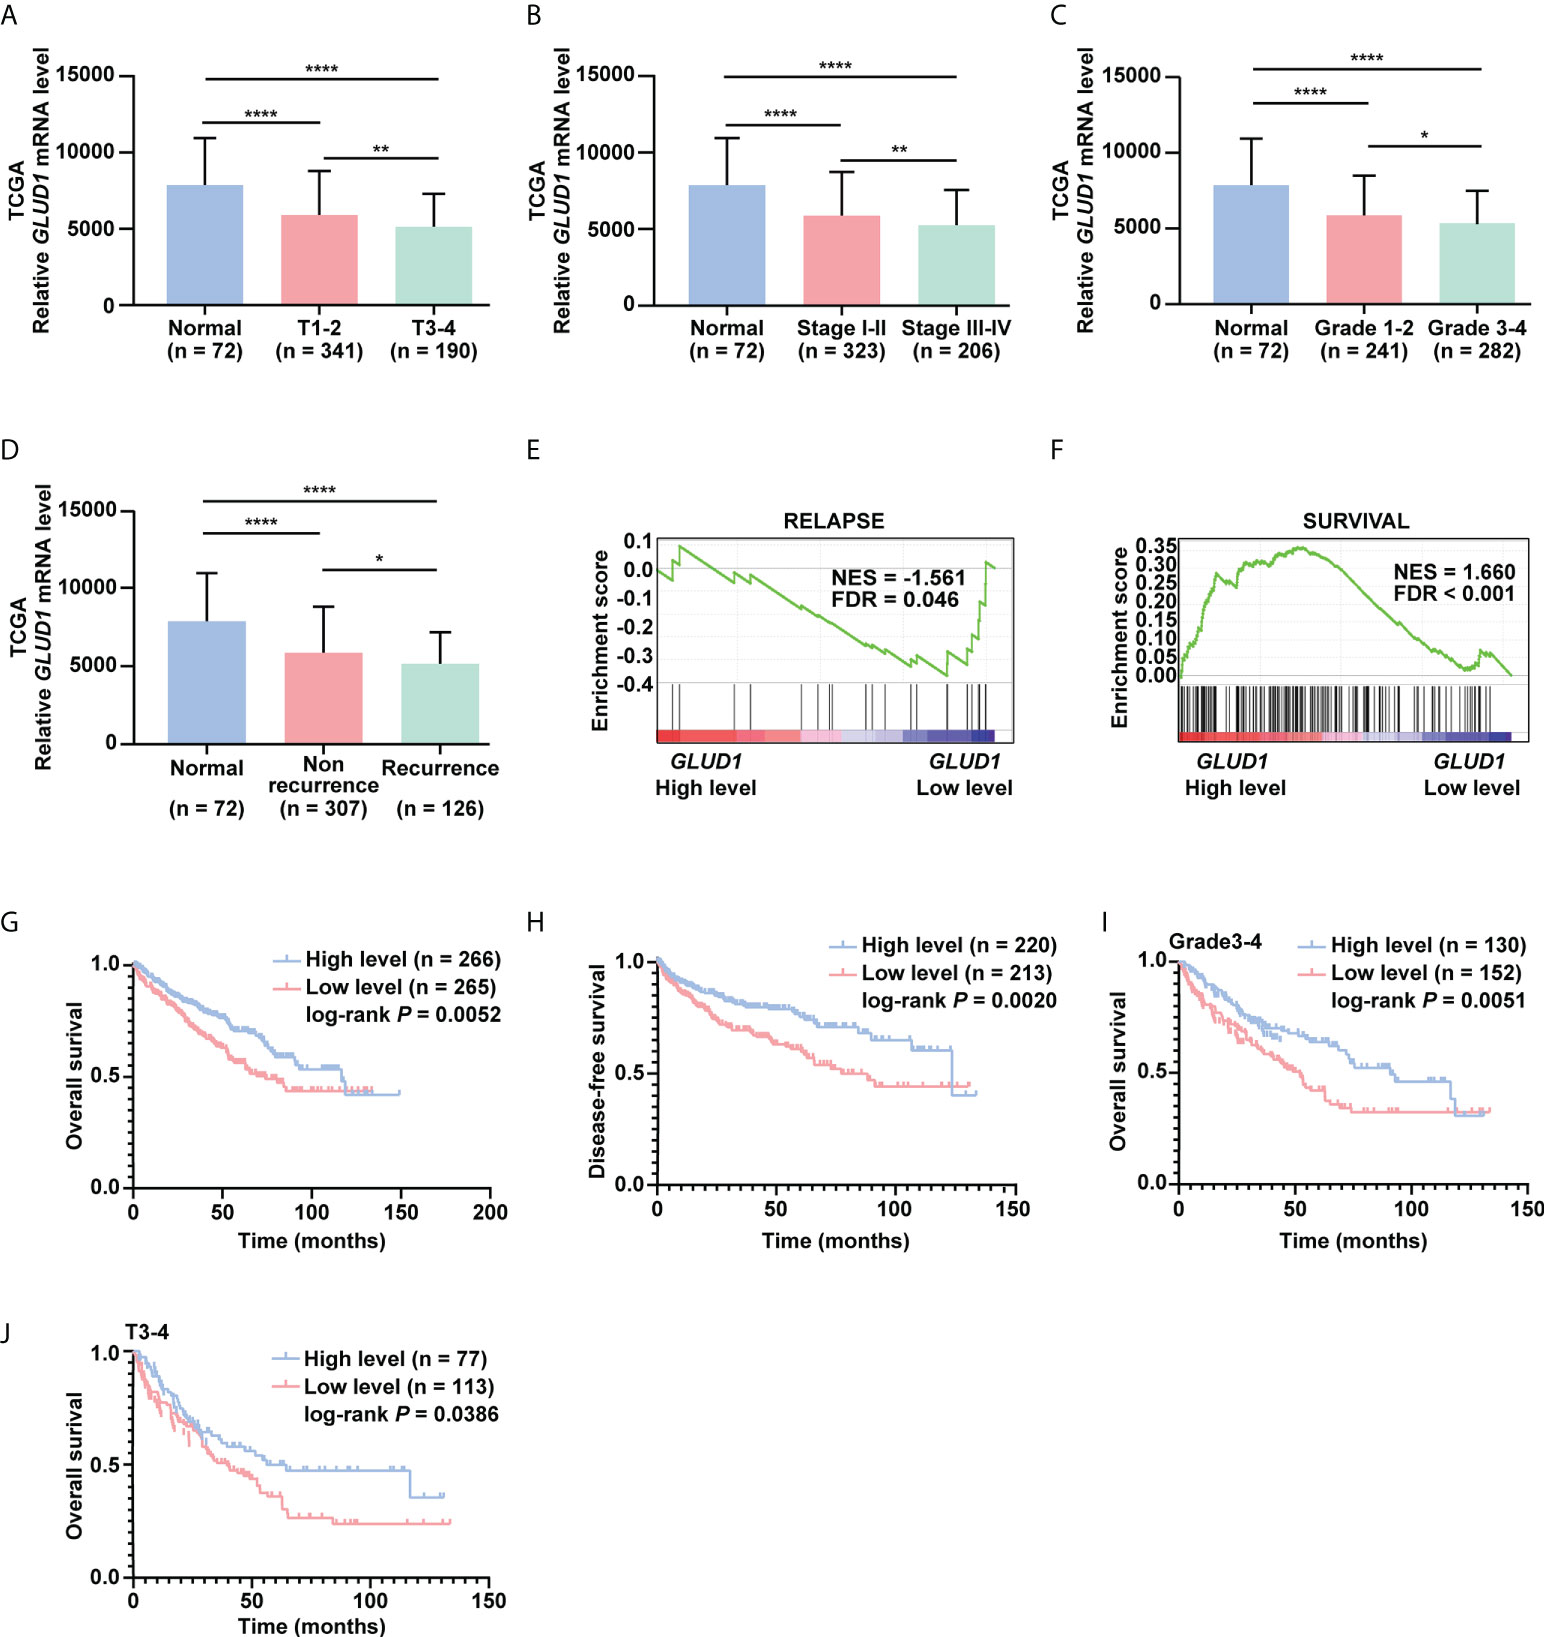
Figure 2 GLUD1 is a potential prognostic and TKI sensitivity predictive marker for ccRCC patients. (A–C) GLUD1 mRNA levels were gradually downregulated as T stage, AJCC stage and Fuhrman grade progressed. (D) GLUD1 mRNA level was negatively correlated with recurrence of ccRCC patients. (E, F) Enrichment plots of gene expression signature for relapse (SMID_BREAST_ CANCER_RELAPSE_IN_LUNG_UP) and survival (LEE_LIVER_CANCER_SURVIVAL_DN) were obtained by GSEA according to GLUD1 mRNA levels. The ccRCC samples from TCGA_KIRC database were divided into high and low GLUD1 expression groups according to the median value of GLUD1 RNA-seq quantification results. (G, H) The Kaplan-Meier (KM) curves of overall survival and disease-free survival based on TCGA_KIRC data. ccRCC patients were divided into high/low expression groups according to GLUD1 mRNA level. (I, J) KM curves of overall survival based on TCGA_KIRC data. Advanced ccRCC patients were divided into high/low expression groups according to GLUD1 mRNA level. *P < 0.05; **P < 0.01; ****P < 0.0001.
To further investigate the clinical implications of GLUD1 downregulation in ccRCC, the correlation between the GLUD1 mRNA level and survival rates of patients was analyzed based on the TCGA data. The results indicated that low GLUD1 level predicted shorter overall survival (OS) and disease-free survival (DFS) (Figures 2G, H), especially for patients in higher Fuhrman stage and T stage (Figures 2I, J). In addition, we also observed high GLUD1 expression was related with the higher sensitivity of ccRCC cells to TKIs treatment (Figures S1A, B). Collectively, these findings reveal that GLUD1 level is a potential prognostic and TKIs sensitivity predictive markers for ccRCC patients.
High level of methylation in GLUD1 promoter leads to the downregulation of GLUD1 level in ccRCC tissues and correlates with the survival of ccRCC patients
To further explore the underlying mechanism of GLUD1 downregulation, the bioinformatics analyses were performed. Results showed that GLUD1 gene had low frequency in mutation (Figure S2), suggesting that decreased GLUD1 level in ccRCC tissues does not result from gene mutation. However, the methylation level of GLUD1 promoter in ccRCC tissues was significantly increased (Figure 3A). In addition, correlation analysis results showed that the methylation level of GLUD1 promoter was negatively correlated with the GLUD1 mRNA level (Figure 3B). These results reminded that the increasing methylation level of GLUD1 promoter might be one of the mechanisms for GLUD1 downregulation in ccRCC. Based on MEXPRESS database, we found that the methylation levels of GLUD1 promoter in ccRCC tissues were significantly upregulated as neoplasm histologic grade progressed and positively correlated with lymph node metastasis (Figure 3C). We further found that the high level of methylation in GLUD1 promoter was related with shorter OS of ccRCC patients (Figure 3D). These results suggest the methylation in GLUD1 promoter has the important biological significance in ccRCC phenotypes.
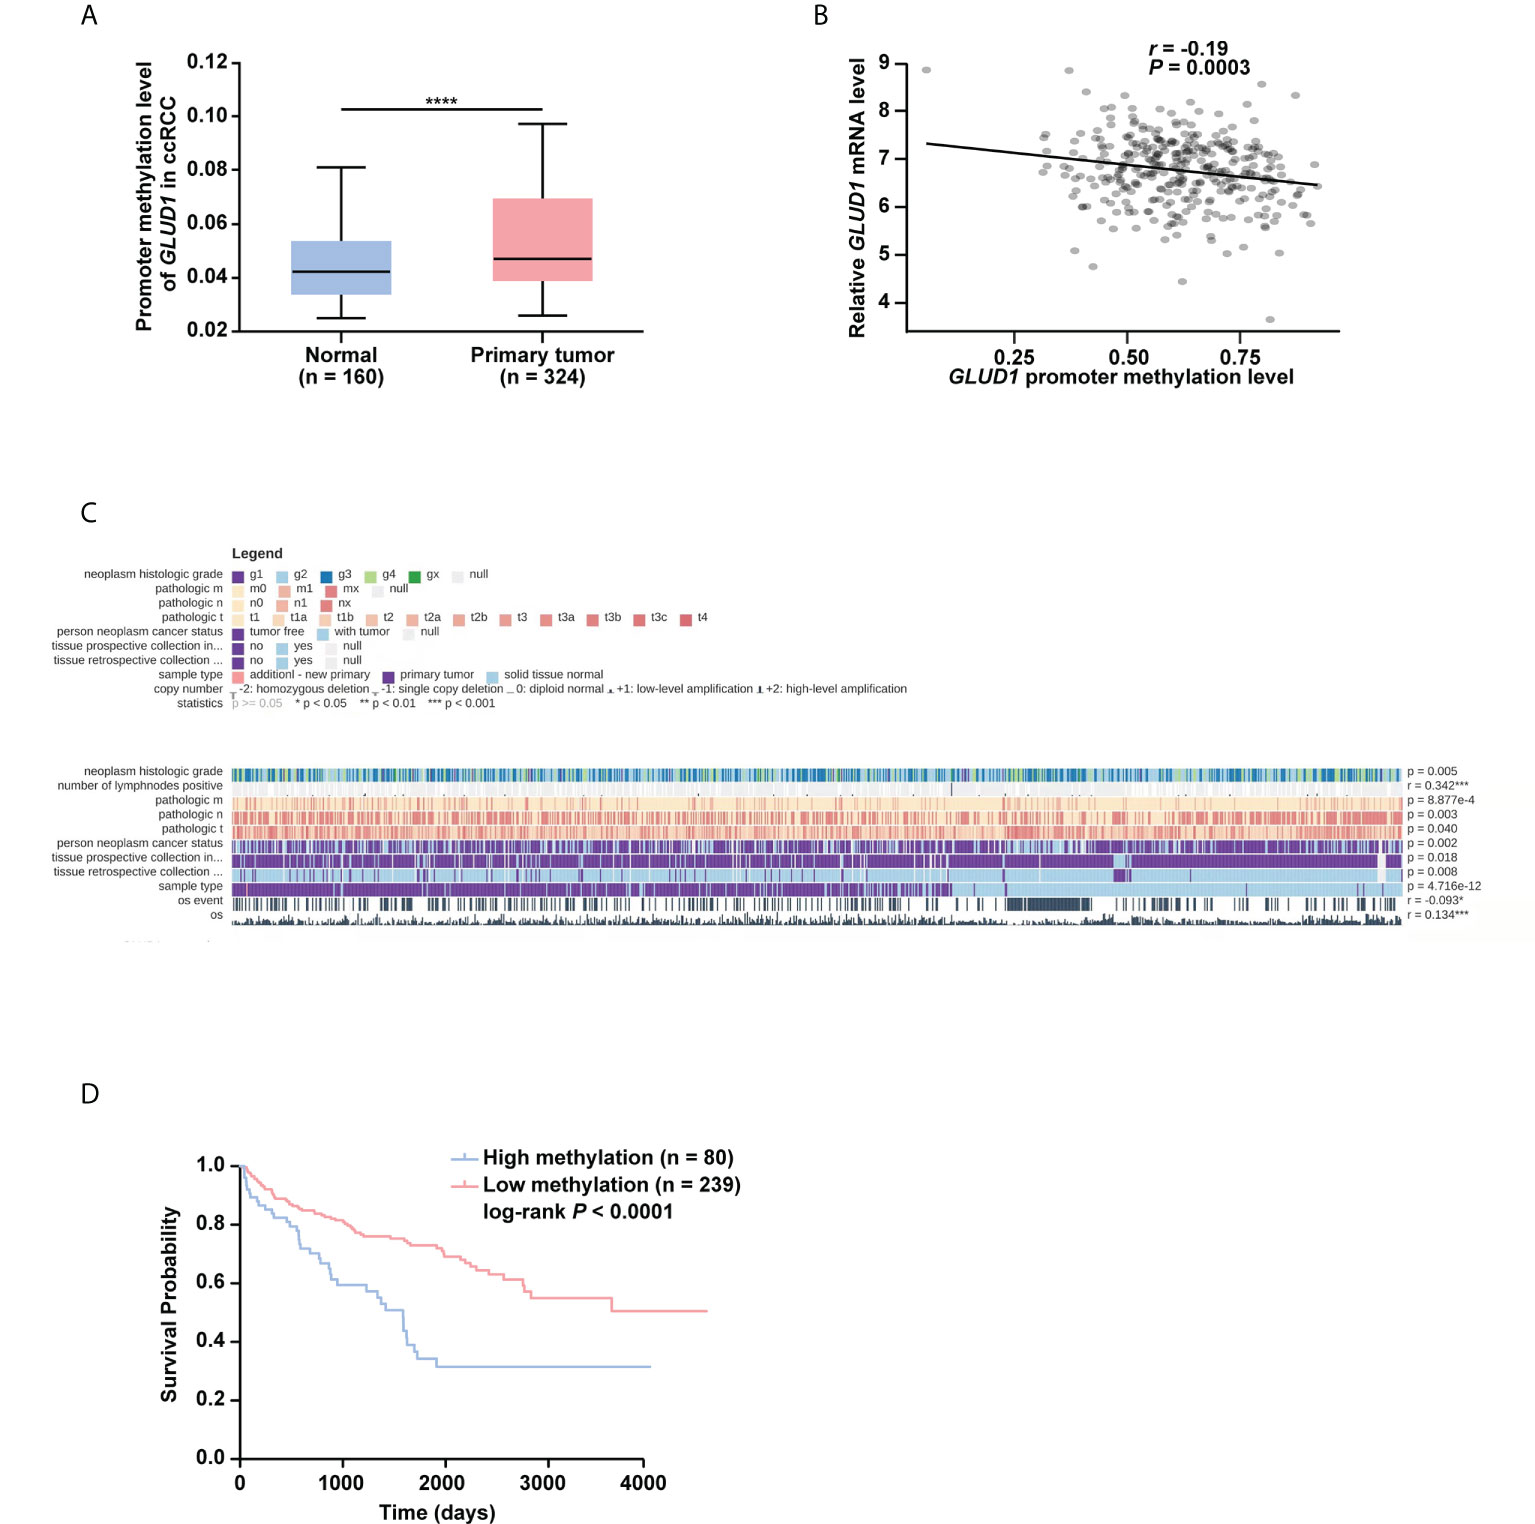
Figure 3 High level of methylation in GLUD1 promoter leads to the downregulation of GLUD1 level in ccRCC tissues and correlates with shorter survival of ccRCC patients. (A) Methylation levels of GLUD1 promoter was increased in ccRCC tissues based on the TCGA_KIRC data. The Beta value indicated the level of DNA methylation, and the P value was derived from independent sample two tailed t-test. The data were presented as mean ± SD. ****P < 0.0001. (B) The correlation between methylation levels of GLUD1 promoter and GLUD1 mRNA level. (C) The correlation between GLUD1 methylation levels and clinical parameters in the MEXPRESS database. (D) KM curve of methylation levels of GLUD1 promoter based on the TCGA data. ****P < 0.0001.
Then, we explored which methylation-related writers and erasers were responsible for elevated methylation levels of GLUD1 promoter. Results showed DNMT1, DNMT3A and DNMT3B were upregulated, while KDM1A was downregulated in ccRCC tissues (Figures S3A–D). Further Pearson correlation analysis revealed the most significant negative correlation of GLUD1 level with DNMT3A in ccRCC tissues (r = -0.3806, P < 0.0001, Figure S3E). These results suggest that DNMT3A may play a crucial role in regulating the methylation level of GLUD1 promoter in ccRCC.
GLUD1 suppresses the proliferation and migration of RCC cells
To examine the role of GLUD1 in RCC cells, GSEA was performed based on TCGA_KIRC data. Results revealed that gene sets associated with cell proliferation and invasion were significantly enriched in cases with low GLUD1 expression (Figures 4A, B). These results suggest that the low expression of GLUD1 may promote ccRCC tumorigenesis and development. To validate the biological effects of GLUD1 in ccRCC, GLUD1 was overexpressed in ACHN and 769-P cells. GLUD1 overexpression significantly suppressed the proliferation, colony formation and migration of ACHN and 769-P cells (Figures 4C–F). In summary, these data indicate that GLUD1 suppresses RCC cell proliferation and migration.
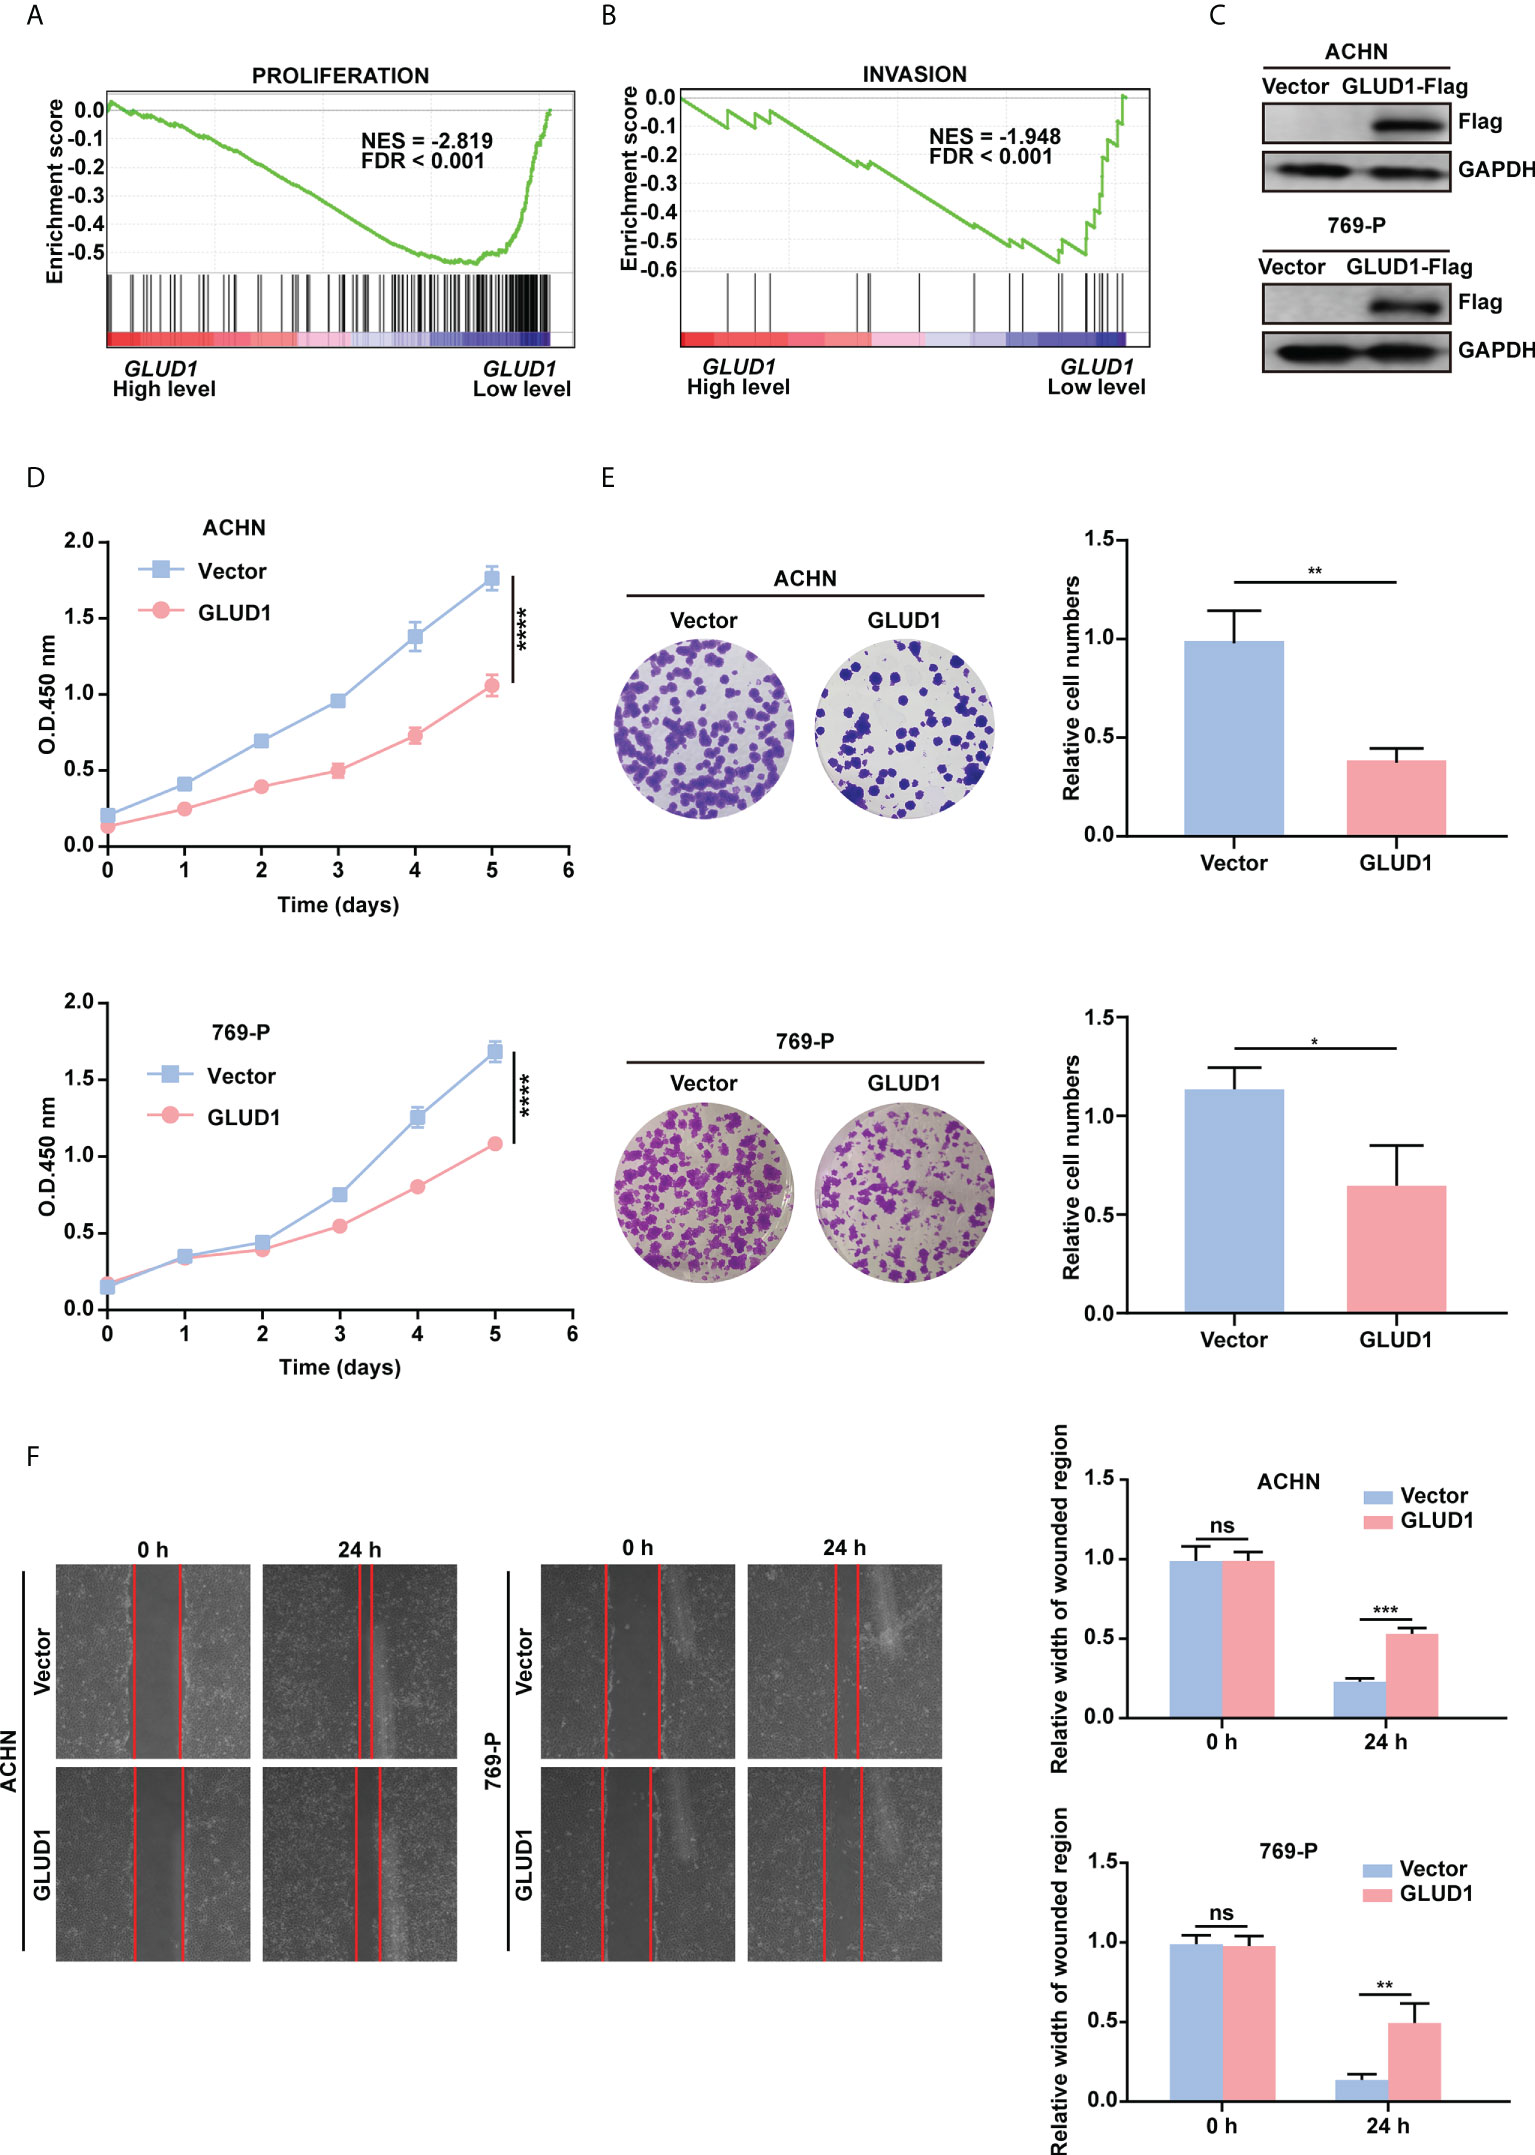
Figure 4 GLUD1 suppresses the proliferation and migration of RCC cells. (A, B) Enrichment plots of gene expression signature for proliferation (CHIANG_LIVER_CANCER_SUBCLASS_ PROLIFERATION_DN) and invasion (MINGUEZ_LIVER_CANCER_VASCULAR_INVASION_ DN) were obtained by GSEA according to GLUD1 mRNA levels. The ccRCC samples from TCGA_KIRC database were divided into high and low GLUD1 expression groups according to the median value of GLUD1 RNA-seq quantification results. (C) ACHN and 769-P cells were transfected with GLUD1-Flag expression plasmid, and protein levels were detected using western blot assay. β-actin was used as a loading control. (D–F) ACHN and 769-P cells were transfected with GLUD1-Flag. Vector-transfected ACHN and 769-P cells served as control. CCK8 viability assays were used to analyze cell viability (D). Colony formation assays were performed to detect cell proliferation (E). Wound healing assays were performed to detect cell migration (F). The relative migration distance is quantified. ns, no significance; *P < 0.05; **P < 0.01; ***P < 0.001; ****P < 0.0001.
GLUD1 suppresses ccRCC tumorigenesis and development by inhibiting PI3K/Akt/mTOR pathway
To clarify the mechanism by which GLUD1 suppressed ccRCC occurrence and development, we analyzed the genes correlated with GLUD1 expression in TCGA dataset. Co-expressed genes can better clarify the role of GLUD1 in ccRCC. We constructed co-expressed gene network and found that GLUD2, COX15, VAV3, TNFAIP6, SHLD2P3, SHLD2P1, SHLD2, etc. were moderately correlated with GLUD1 (Figure 5A).
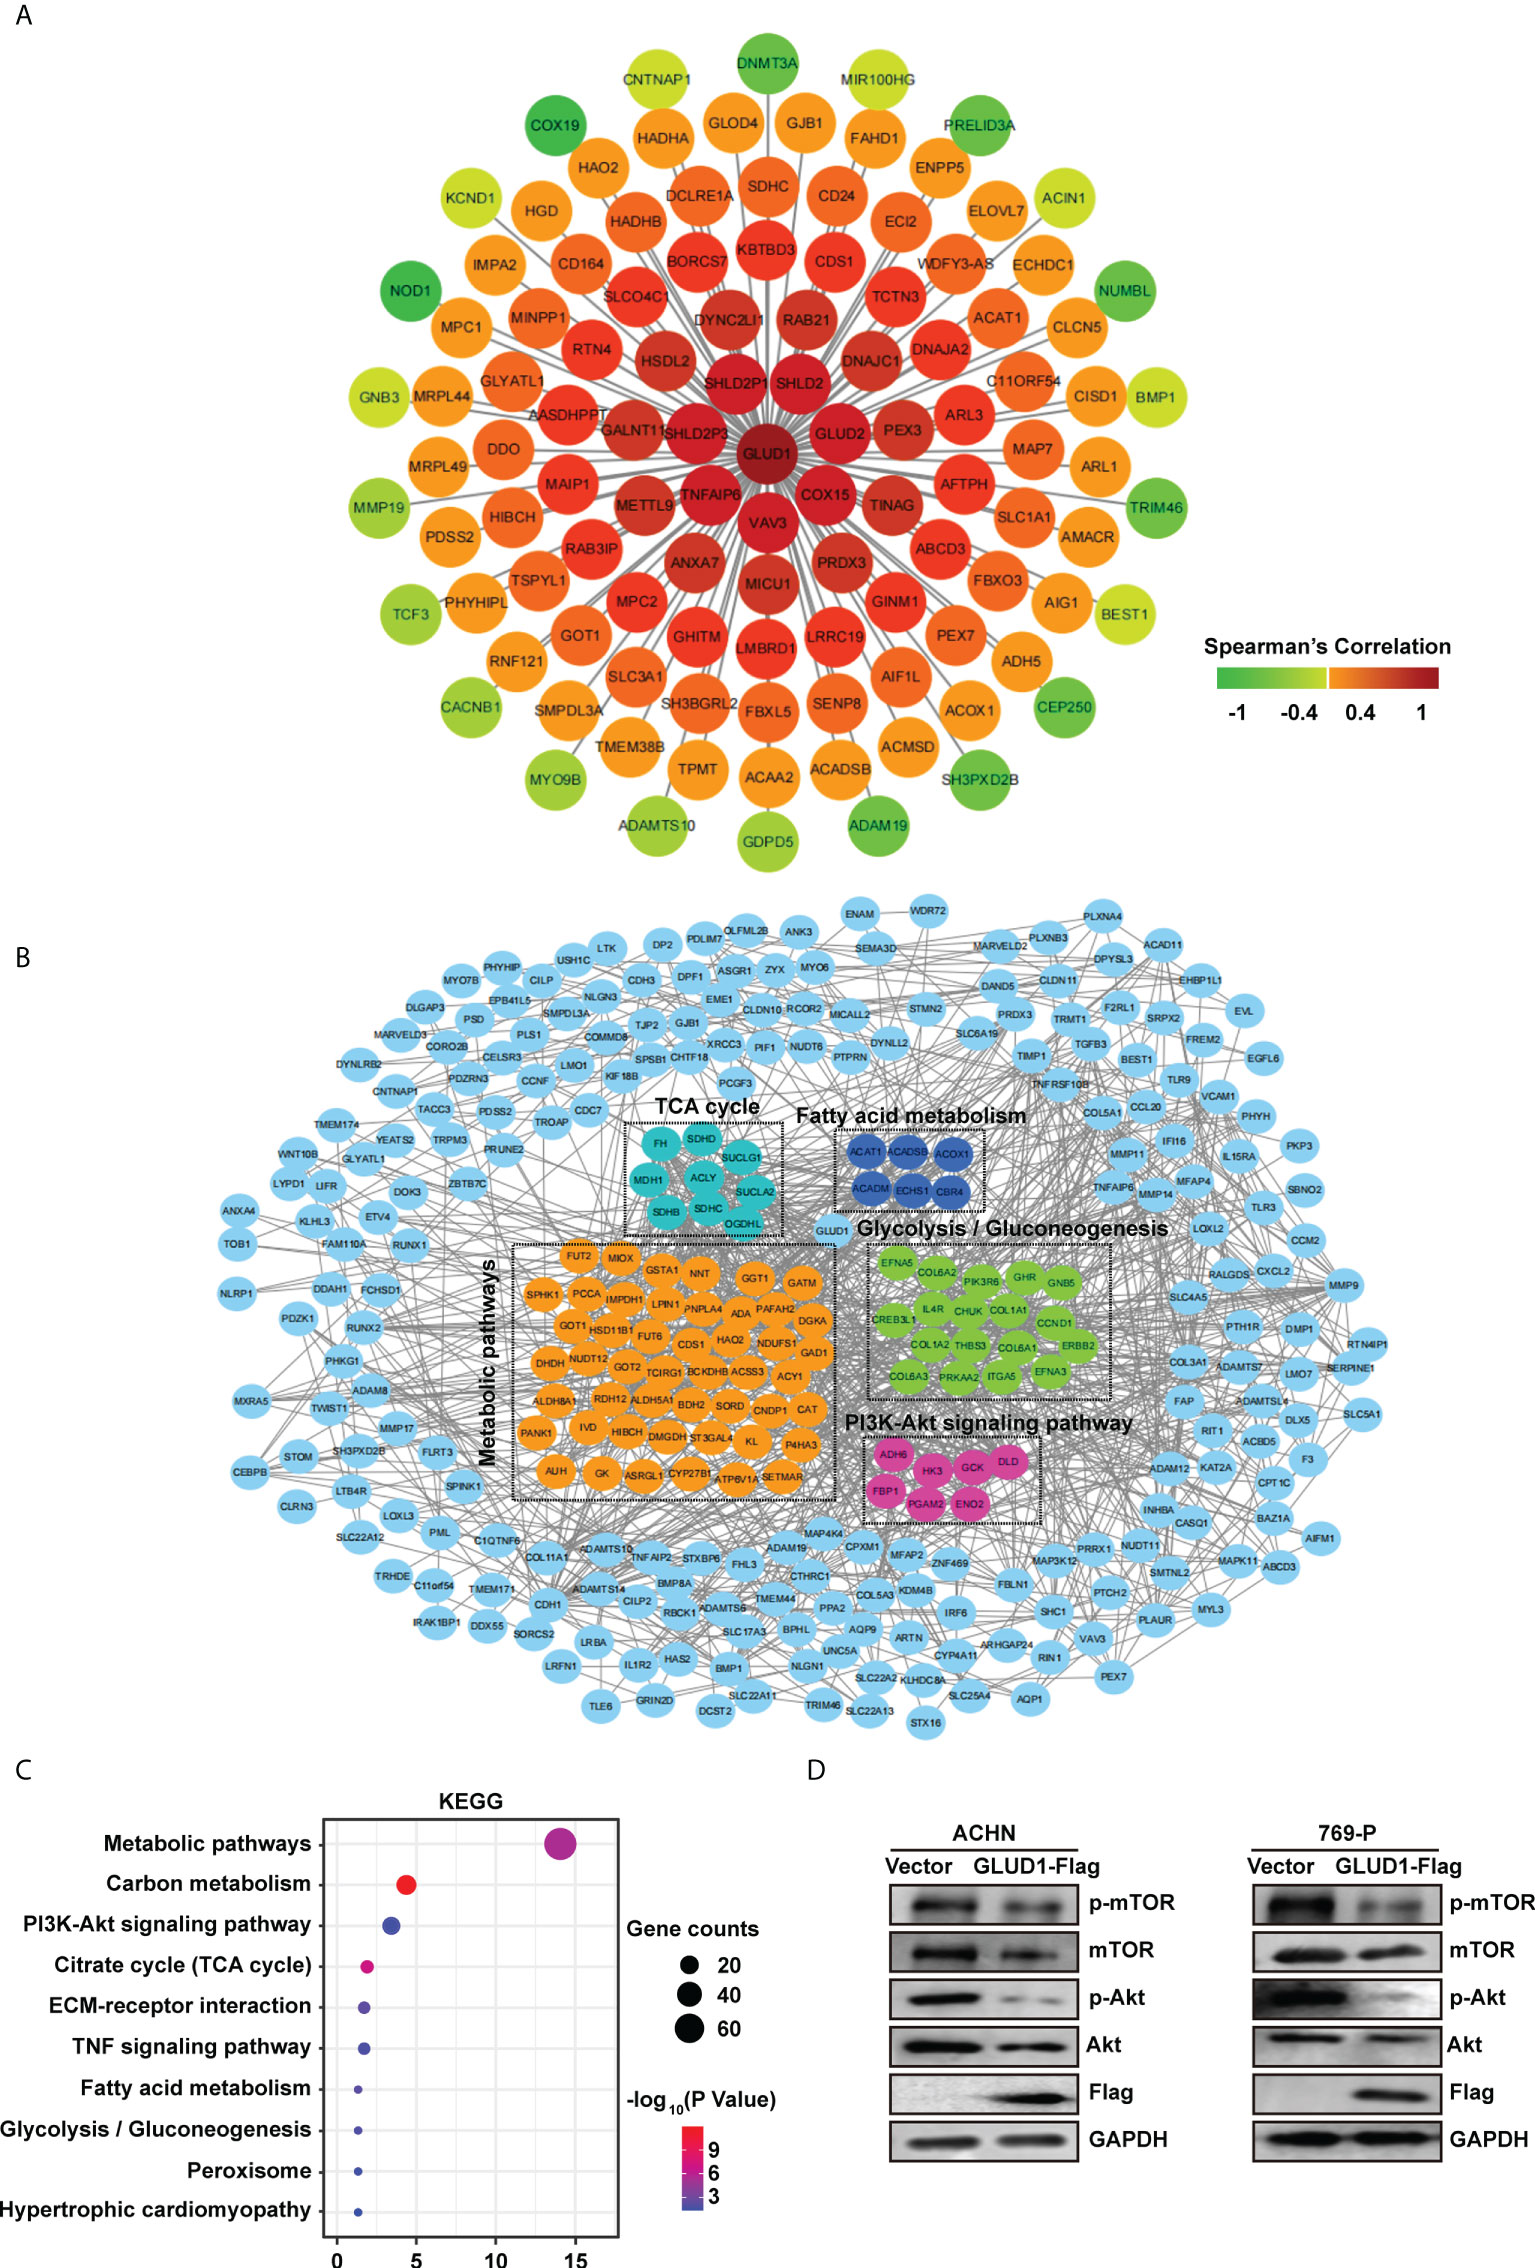
Figure 5 GLUD1 suppresses ccRCC tumorigenesis and development by inhibiting PI3K/Akt/mTOR pathway. (A) Co-expression network of GLUD1 gene in ccRCC. Genes that were negatively correlated with GLUD1 were displayed in green, and genes that were positively correlated with GLUD1 were displayed in red. The darker the color, the stronger the correlation. (B) PPI network of GLUD1-related DEGs. (C) KEGG pathway enrichment analysis of GLUD1-related differentially expressed proteins. (D) Western blot measured the levels of proteins related to PI3K/AKT/mTOR pathway in ACHN and 769-P cells with GLUD1 overexpression.
In order to elucidate the mechanism of GLUD1 in ccRCC more clearly, we chose the GLUD1-related proteins which were not only correlated with GLUD1, but also differentially expressed between ccRCC and adjacent normal tissues. GLUD1-related proteins were used to construct PPI network. We found that SDHD, ECSH1, COL6A3, CAT, ADH6, etc. were GLUD1-related proteins (Figure 5B).
Then, KEGG enrichment analysis was performed based on GLUD1-related proteins. Results showed that most of genes were enriched in PI3K/Akt/mTOR pathways (Figure 5C). The aberrant activation of PI3K/Akt/mTOR signaling is one of the most frequent events in human cancer, especially in RCC and serves to disconnect the control of cell growth, survival and metabolism from exogenous growth stimuli (20). Hence, we speculated that GLUD1 suppressed ccRCC tumorigenesis and development by inhibiting PI3K/Akt/mTOR pathway. Western blotting results revealed that GLUD1 overexpression decreased the activation levels of Akt and mTOR in RCC cells (Figure 5D). These results indicate that the low level of GLUD1 promotes ccRCC tumorigenesis and development by activating PI3K/Akt/mTOR pathway.
GLUD1 level is negatively associated with immunosuppressive microenvironment in ccRCC
The above results showed that low levels of GLUD1 altered the metabolism of ccRCC cells by activating the mTOR pathway. Altered metabolic pathways, especially mTOR pathway in tumors play key roles in tumor growth and immnosuppressive acidic tumor environment (21). The suppressive immune microenvironment (TIME) reprograms immune cell behavior by altering the cellular machinery and nutrient supply of immune cells, thereby limiting antitumor function (21). We therefore assessed the correlation of GLUD1 expression with tumor immune microenvironment. The bioinformatics analysis results showed that GLUD1 level in ccRCC cells was negatively related with the abundance of immunosuppressive cells (Treg cells, MDSCs and M2 macrophages) (Figure 6A), indicating that GLUD1 low level was correlated with the TIME in ccRCC patients. In addition, GLUD1 low level was also related with the infiltration of other immune cells, including T cells (Figure 6B). If these T cells were in functional state, they would kill cancer cells. However, TIDE analysis result revealed that low GLUD1 levels correlated with higher dysfunction scores of T cells (Figure 6C), suggesting that patients with low GLUD1 levels and more immune cell infiltration tend to have a stronger signature of T cell dysfunction, which may impair the ability of cytotoxic T cells to kill cancer cells. Therefore, GLUD1 downregulation may contribute to the TIME by enhancing dysfunctional immune cell infiltration.
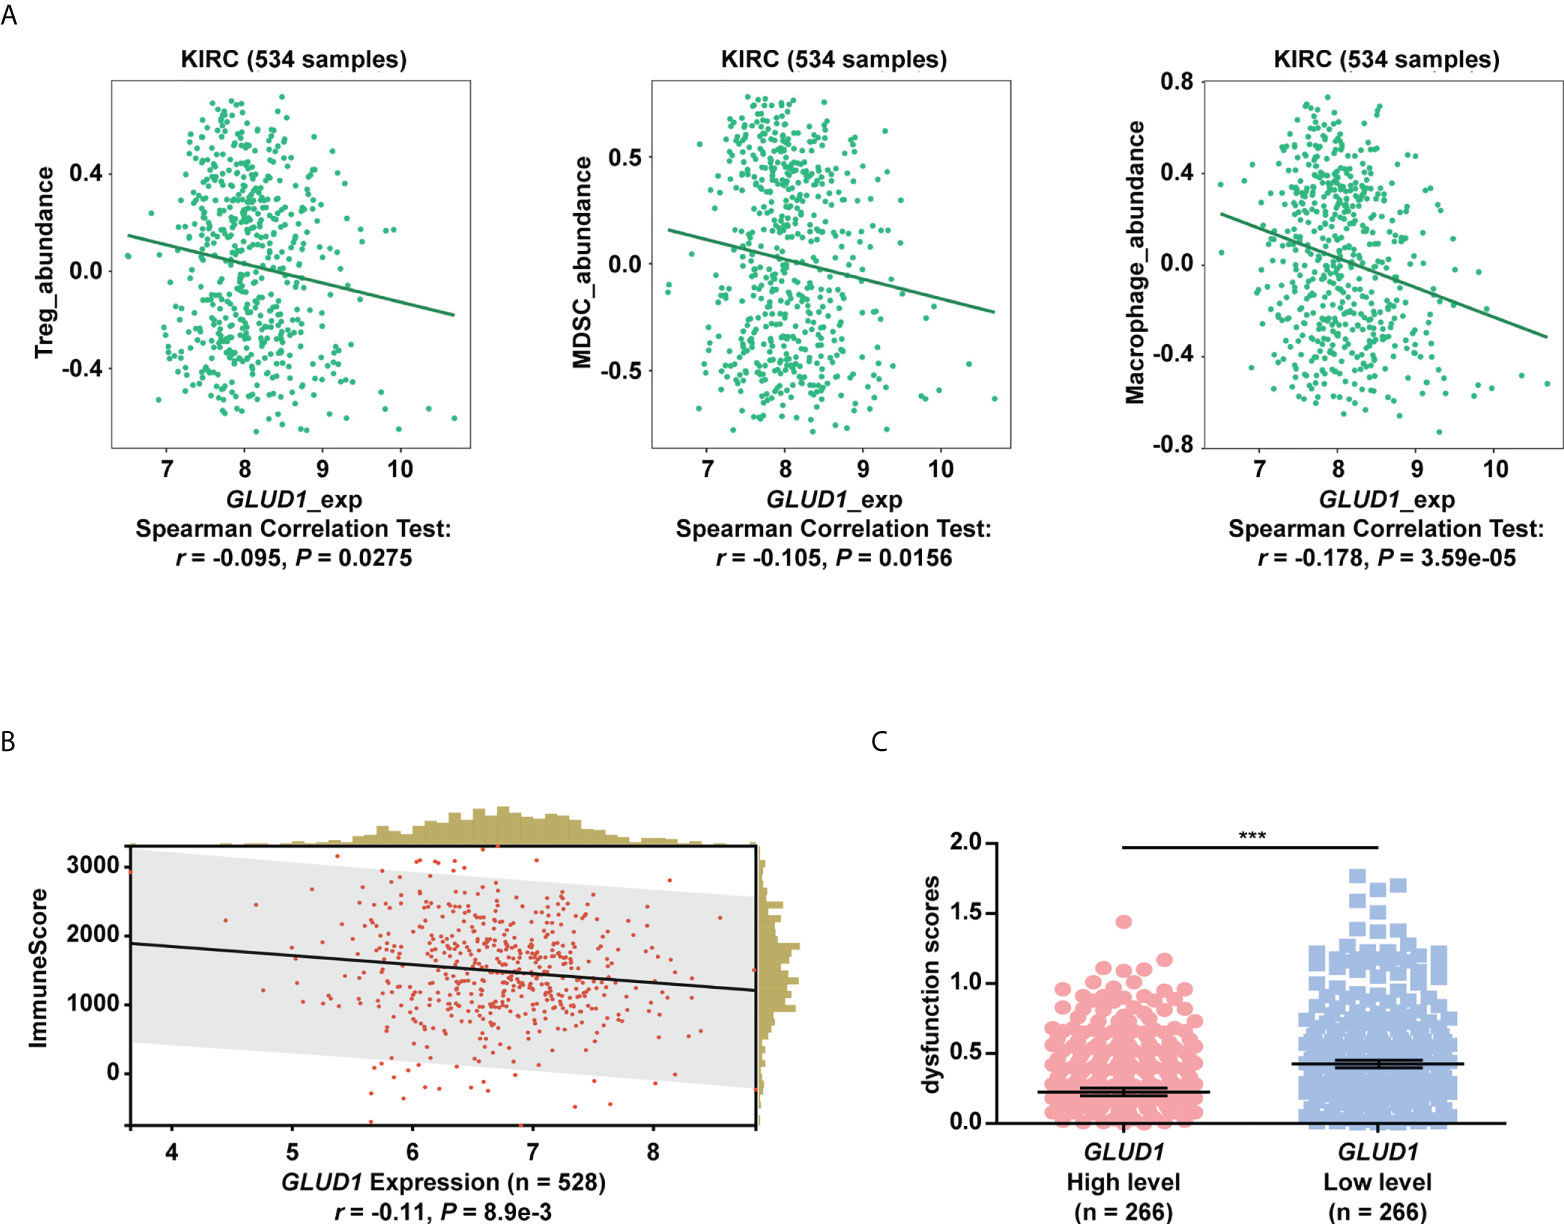
Figure 6 GLUD1 level is negatively associated with the ccRCC immunosuppressive microenvironment. (A) Correlation between GLUD1 level and immunosuppressive cell infiltration score in ccRCC patients. (B) Correlation of GLUD1 with immune cell infiltration in ccRCC. (C) The correlation between GLUD1 level and T cell dysfunction score by TIDE analysis. ***P < 0.001.
Discussion
In this study, we described GLUD1 as a novel tumor suppressor in ccRCC, which was different from tumor-promoting role in other cancers. Moreover, we found that the low level of GLUD1 was correlated with the poor prognosis and low sensitivity to TKIs therapy for ccRCC patients. GLUD1 might be helpful for identifying patients who need individualized therapies to improve their clinical outcomes.
GLUD1 was reported to be highly expressed and play the tumor-promoting roles in breast cancer, gastric cancer and lung cancer (12, 22, 23). GLUD1 promoted breast cancer growth through accelerating metabolic recycling of ammonia (22). GLUD1 enhanced gastric cancer cell proliferation, migration and invasion by activating the Notch signaling pathway (12). GLUD1 regulated redox homeostasis to promote lung cancer cell proliferation (23). However, in highly proliferative breast tumors, GLUD1 was also reported to be expressed in low level (14), indicating that the controversial role of GLUD1 in breast cancer. In ccRCC, GLUD1 level was downregulated and acted as tumor suppressor and might be a therapeutic target for ccRCC.
GLUD1 protein level was reported to be downregulated via ubiquitination and degradation. Detailly, under conditions of amino acid deprivation, GLUD1 translocated from mitochondria to the cytoplasm, where it became ubiquitinated and degraded via the E3 ligase RNF213 (24). Our study found that GLUD1 level was downregulated in ccRCC tissues not only in protein level, but also in mRNA level. We also found that the upregulation of methylation level in the GLUD1 promoter might be responsible for the downregulation of GLUD1 in ccRCC. This is a new mechanism of GLUD1 downregulation in ccRCC. By targeting GLUD1 methylation to regulate GLUD1 level might also be a therapeutic strategy for ccRCC.
Glutamine metabolism stimulates several signaling pathways that promote cell growth and proliferation. Of which, the activation of mTOR, a key signaling node regulating protein translation, cell growth and autophagy (25) is the most important event for glutamine metabolism. That glutamine was taken up in exchange for essential amino acids (EAA) is the rate-limiting step in mTOR activation of cancer cells (25, 26). α-KG from glutamine catabolism is critical for mTOR activation in cervical and osteosarcoma cancer cell lines (27). Hyperactivation of PI3K/Akt/mTOR signaling is critical for RCC cell proliferation, survival, migration and metastasis as well as angiogenesis and therapy resistance (28–31). In this study, we found a novel mechanism by which glutamine metabolism activated PI3K/Akt/mTOR in ccRCC-the downregulation of GLUD1 in glutamine metabolism pathway. Further, GLUD1 overexpression suppressed RCC cell proliferation and migration by inhibiting the PI3K/Akt/mTOR pathway activation.
In addition, GLUD1 was co-expressed with various metabolism-related genes in ccRCC. GLUD2 was downregulated in glioblastoma, and GLUD2 inhibited glioblastoma progression by promoting cell cycle arrest and leading to mitochondrial dysfunction (32). Rab21 was downregulated in ovarian cancer, which led to cytokinesis failure and induced aneuploidy, further underwent malignant transformation and tumorigenicity (33). NOD1 was highly expressed in colorectal cancer, and mediated the adhesion, migration and metastasis of colorectal cancer cells through the p38 MAPK pathway (34). DNMT3A was upregulated in liver cancer, and DNMT3A-mediated promoter hypermethylation inactivated multiple tumor suppressor genes, thus promoting liver cancer cell proliferation and colony formation (35). When we constructed the PPI network using GLDU1-related DEGs, GLUD1 was one of the hub genes of these co-expressed or related genes. This confirmed that GLUD1 played a key role in ccRCC development.
ccRCC has been reported to be a highly immunogenic malignancy that has been shown to be infiltrated by a large amount of immunocytes, including macrophages, NK cells, and T cells (36). Several studies have shown that the abundance of tumor-infiltrating lymphocytes and CD8+ T cells is inversely associated with prognosis of ccRCC patients (37, 38). As for immune cell infiltration and immunotherapy, the use of anti-PD-1 or anti-PD-L1 therapy in ccRCC patients have been reported. Nivolumab is considered as a standard care strategy for advanced ccRCC and is widely used in clinical trials (39). Depleted CD8+ T cells and M2-like macrophages co-occur in advanced disease and express ligands and receptors that support T-cell dysfunction and M2-like polarization, an immune dysfunctional circuit leading to poor prognosis (40). In the current study, we revealed an inverse correlation between GLUD1 level and immune cell infiltration, and GLUD1 promotes mTOR pathway activation. mTOR pathway activation results in the upregulation of HIF-1α and the increase in glycolysis and lactate production (41). An acidic TME favors immunosuppression, reduces response to immunotherapy, and stabilizes immunosuppressive cells (21). Meanwhile, the expression of PD-L1 protein is dependent on active Akt-mTOR signaling. The interaction of PD-L1 and PD-1 induces differentiation of naïve CD4+ T cells into Tregs and maintains Treg-suppressive functions. PD-L1 can also act as a receptor by sending reverse signals to limit tumor cell apoptosis (42). Therefore, utilizing drugs targeting GLUD1 metabolism may synergistically enhance renal cancer immunotherapy through metabolic reprogramming of the TME.
Taken together, this study revealed that GLUD1 might predict the prognosis of ccRCC patients, especially advanced ccRCC patients. GLUD1 suppressed the occurrence and development of ccRCC by inhibiting the PI3K/Akt/mTOR pathway. GLUD1 may be a potential therapeutic target for ccRCC, and a combination of GLUD1 targeted therapy and immunotherapy may provide better therapeutic efficacy for ccRCC.
Data availability statement
Publicly available datasets were analyzed in this study. This data can be found here: https://www.ncbi.nlm.nih.gov/geo/query/acc.cgi?acc=GSE53757 and https://www.cbioportal.org/study/summary?id=kirc_tcga.
Ethics statement
The studies involving human participants were reviewed and approved by the Research Ethics Board of Affiliated Beijing Friendship Hospital. The patients/participants provided their written informed consent to participate in this study.
Author contributions
LW participated in tissue collection, analysis of data, development of methodology and designing the experiment. ZF conceived the experiment, carried out the experiments and analyzed the data. PG performed the experiments and wrote the manuscript. JZ designed the experiment and reviewed the manuscript. All authors discussed the results, revised and commented on the manuscript.
Funding
This work was supported by the National Natural Science Foundation of the People’s Republic of China (Nos. 81974415, 82172923).
Conflict of interest
The authors declare that the research was conducted in the absence of any commercial or financial relationships that could be construed as a potential conflict of interest.
Publisher’s note
All claims expressed in this article are solely those of the authors and do not necessarily represent those of their affiliated organizations, or those of the publisher, the editors and the reviewers. Any product that may be evaluated in this article, or claim that may be made by its manufacturer, is not guaranteed or endorsed by the publisher.
Supplementary material
The Supplementary Material for this article can be found online at: https://www.frontiersin.org/articles/10.3389/fonc.2022.975517/full#supplementary-material
References
1. Bray F, Ferlay J, Soerjomataram I, Siegel RL, Torre LA, Jemal A. Global cancer statistics 2018: Globocan estimates of incidence and mortality worldwide for 36 cancers in 185 countries. CA Cancer J Clin (2018) 68(6):394–424. doi: 10.3322/caac.21492
2. Wolf MM, Kimryn Rathmell W, Beckermann KE. Modeling clear cell renal cell carcinoma and therapeutic implications. Oncogene (2020) 39(17):3413–26. doi: 10.1038/s41388-020-1234-3
3. Hsieh JJ, Purdue MP, Signoretti S, Swanton C, Albiges L, Schmidinger M, et al. Renal cell carcinoma. Nat Rev Dis Primers (2017) 3:17009. doi: 10.1038/nrdp.2017.9
4. Sharma R, Kadife E, Myers M, Kannourakis G, Prithviraj P, Ahmed N. Determinants of resistance to VEGF-TKI and immune checkpoint inhibitors in metastatic renal cell carcinoma. J Exp Clin Cancer Res (2021) 40(1):186. doi: 10.1186/s13046-021-01961-3
5. DeBerardinis RJ, Cheng T. Q’s next: The diverse functions of glutamine in metabolism, cell biology and cancer. Oncogene (2010) 29(3):313–24. doi: 10.1038/onc.2009.358
6. Wettersten HI, Hakimi AA, Morin D, Bianchi C, Johnstone ME, Donohoe DR, et al. Grade-dependent metabolic reprogramming in kidney cancer revealed by combined proteomics and metabolomics analysis. Cancer Res (2015) 75(12):2541–52. doi: 10.1158/0008-5472.CAN-14-1703
7. Shroff EH, Eberlin LS, Dang VM, Gouw AM, Gabay M, Adam SJ, et al. Myc oncogene overexpression drives renal cell carcinoma in a mouse model through glutamine metabolism. Proc Natl Acad Sci U.S.A. (2015) 112(21):6539–44. doi: 10.1073/pnas.1507228112
8. Gameiro PA, Yang J, Metelo AM, Perez-Carro R, Baker R, Wang Z, et al. In vivo HIF-mediated reductive carboxylation is regulated by citrate levels and sensitizes VHL-deficient cells to glutamine deprivation. Cell Metab (2013) 17(3):372–85. doi: 10.1016/j.cmet.2013.02.002
9. Wise DR, Thompson CB. Glutamine addiction: A new therapeutic target in cancer. Trends In Biochem Sci (2010) 35(8):427–33. doi: 10.1016/j.tibs.2010.05.003
10. Yoo HC, Yu YC, Sung Y, Han JM. Glutamine reliance in cell metabolism. Exp Mol Med (2020) 52(9):1496–516. doi: 10.1038/s12276-020-00504-8
11. Altman BJ, Stine ZE, Dang CV. From Krebs to clinic: Glutamine metabolism to cancer therapy. Nat Rev Cancer (2016) 16(11):749. doi: 10.1038/nrc.2016.114
12. Wu YJ, Hu ZL, Hu SD, Li YX, Xing XW, Yang Y, et al. Glutamate dehydrogenase inhibits tumor growth in gastric cancer through the notch signaling pathway. Cancer biomark (2019) 26(3):303–12. doi: 10.3233/CBM-190022
13. Craze ML, El-Ansari R, Aleskandarany MA, Cheng KW, Alfarsi L, Masisi B, et al. Glutamate dehydrogenase (GLUD1) expression in breast cancer. Breast Cancer Res Treat (2019) 174(1):79–91. doi: 10.1007/s10549-018-5060-z
14. Coloff JL, Murphy JP, Braun CR, Harris IS, Shelton LM, Kami K, et al. Differential glutamate metabolism in proliferating and quiescent mammary epithelial cells. Cell Metab (2016) 23(5):867–80. doi: 10.1016/j.cmet.2016.03.016
15. Fang Z, Sun Q, Yang H, Zheng J. SDHB suppresses the tumorigenesis and development of ccRCC by inhibiting glycolysis. Front Oncol (2021) 11:639408. doi: 10.3389/fonc.2021.639408
16. Qi Y, Ma Y, Peng Z, Wang L, Li L, Tang Y, et al. Long noncoding RNA PENG upregulates PDZK1 expression by sponging miR-15b to suppress clear cell renal cell carcinoma cell proliferation. Oncogene (2020) 39(22):4404–20. doi: 10.1038/s41388-020-1297-1
17. Zheng J, Wang L, Peng Z, Yang Y, Feng D, He J. Low level of PDZ domain containing 1 (PDZK1) predicts poor clinical outcome in patients with clear cell renal cell carcinoma. EBioMedicine (2017) 15:62–72. doi: 10.1016/j.ebiom.2016.12.003
18. Wang L, Qi Y, Wang X, Li L, Ma Y, Zheng J. ECHS1 suppresses renal cell carcinoma development through inhibiting mTOR signaling activation. BioMed Pharmacother (2020) 123:109750. doi: 10.1016/j.biopha.2019.109750
19. Ma Y, Qi Y, Wang L, Zheng Z, Zhang Y, Zheng J. SIRT5-mediated SDHA desuccinylation promotes clear cell renal cell carcinoma tumorigenesis. Free Radic Biol Med (2019) 134:458–67. doi: 10.1016/j.freeradbiomed.2019.01.030
20. Hoxhaj G, Manning BD. The PI3K-akt network at the interface of oncogenic signalling and cancer metabolism. Nat Rev Cancer (2020) 20(2):74–88. doi: 10.1038/s41568-019-0216-7
21. Luby A, Alves-Guerra M-C. Targeting metabolism to control immune responses in cancer and improve checkpoint blockade immunotherapy. Cancers (2021) 13(23):5912. doi: 10.3390/cancers13235912
22. Spinelli JB, Yoon H, Ringel AE, Jeanfavre S, Clish CB, Haigis MC. Metabolic recycling of ammonia Via glutamate dehydrogenase supports breast cancer biomass. Science (2017) 358(6365):941–6. doi: 10.1126/science.aam9305
23. Jin L, Chun J, Pan C, Kumar A, Zhang G, Ha Y, et al. The PLAG1-GDH1 axis promotes anoikis resistance and tumor metastasis through CamKK2-AMPK signaling in LKB1-deficient lung cancer. Mol Cell (2018) 69(1):87–99 e7. doi: 10.1016/j.molcel.2017.11.025
24. Shao J, Shi T, Yu H, Ding Y, Li L, Wang X, et al. Cytosolic GDH1 degradation restricts protein synthesis to sustain tumor cell survival following amino acid deprivation. EMBO J (2021) 40(20):e107480. doi: 10.15252/embj.2020107480
25. Nicklin P, Bergman P, Zhang B, Triantafellow E, Wang H, Nyfeler B, et al. Bidirectional transport of amino acids regulates mTOR and autophagy. Cell (2009) 136(3):521–34. doi: 10.1016/j.cell.2008.11.044
26. Fuchs BC, Finger RE, Onan MC, Bode BP. ASCT2 silencing regulates mammalian target-of-Rapamycin growth and survival signaling in human hepatoma cells. Am J Physiol Cell Physiol (2007) 293(1):C55–63. doi: 10.1152/ajpcell.00330.2006
27. Duran RV, Oppliger W, Robitaille AM, Heiserich L, Skendaj R, Gottlieb E, et al. Glutaminolysis activates rag-mTORC1 signaling. Mol Cell (2012) 47(3):349–58. doi: 10.1016/j.molcel.2012.05.043
28. Pal SK, Quinn DI. Differentiating mTOR inhibitors in renal cell carcinoma. Cancer Treat Rev (2013) 39(7):709–19. doi: 10.1016/j.ctrv.2012.12.015
29. Husseinzadeh HD, Garcia JA. Therapeutic rationale for mTOR inhibition in advanced renal cell carcinoma. Curr Clin Pharmacol (2011) 6(3):214–21. doi: 10.2174/157488411797189433
30. Konings IR, Verweij J, Wiemer EA, Sleijfer S. The applicability of mTOR inhibition in solid tumors. Curr Cancer Drug Targets (2009) 9(3):439–50. doi: 10.2174/156800909788166556
31. Motzer RJ, Escudier B, Oudard S, Hutson TE, Porta C, Bracarda S, et al. Efficacy of everolimus in advanced renal cell carcinoma: A double-blind, randomised, placebo-controlled phase III trial. Lancet (2008) 372(9637):449–56. doi: 10.1016/S0140-6736(08)61039-9
32. Franceschi S, Corsinovi D, Lessi F, Tantillo E, Aretini P, Menicagli M, et al. Mitochondrial enzyme GLUD2 plays a critical role in glioblastoma progression. EBioMedicine (2018) 37:56–67. doi: 10.1016/j.ebiom.2018.10.008
33. Hognas G, Tuomi S, Veltel S, Mattila E, Murumagi A, Edgren H, et al. Cytokinesis failure due to derailed integrin traffic induces aneuploidy and oncogenic transformation in vitro and in vivo. Oncogene (2012) 31(31):3597–606. doi: 10.1038/onc.2011.527
34. Jiang HY, Najmeh S, Martel G, MacFadden-Murphy E, Farias R, Savage P, et al. Activation of the pattern recognition receptor NOD1 augments colon cancer metastasis. Protein Cell (2020) 11(3):187–201. doi: 10.1007/s13238-019-00687-5
35. Zhao Z, Wu Q, Cheng J, Qiu X, Zhang J, Fan H. Depletion of DNMT3A suppressed cell proliferation and restored PTEN in hepatocellular carcinoma cell. J BioMed Biotechnol (2010) 2010:737535. doi: 10.1155/2010/737535
36. Chevrier S, Levine JH, Zanotelli VRT, Silina K, Schulz D, Bacac M, et al. An immune atlas of clear cell renal cell carcinoma. Cell (2017) 169(4):736–49. doi: 10.1016/j.cell.2017.04.016
37. Nakano O, Sato M, Naito Y, Suzuki K, Orikasa S, Aizawa M, et al. Proliferative activity of intratumoral CD8(+) T-lymphocytes as a prognostic factor in human renal cell carcinoma: Clinicopathologic demonstration of antitumor immunity. Cancer Res (2001) 61(13):5132–6.
38. Braun DA, Hou Y, Bakouny Z, Ficial M, Sant’ Angelo M, Forman J, et al. Interplay of somatic alterations and immune infiltration modulates response to PD-1 blockade in advanced clear cell renal cell carcinoma. Nat Med (2020) 26(6):909–18. doi: 10.1038/s41591-020-0839-y
39. Escudier B, Sharma P, McDermott DF, George S, Hammers HJ, Srinivas S, et al. Checkmate 025 randomized phase 3 study: Outcomes by key baseline factors and prior therapy for nivolumab versus everolimus in advanced renal cell carcinoma. Eur Urol (2017) 72(6):962–71. doi: 10.1016/j.eururo.2017.02.010
40. Braun DA, Street K, Burke KP, Cookmeyer DL, Denize T, Pedersen CB, et al. Progressive immune dysfunction with advancing disease stage in renal cell carcinoma. Cancer Cell (2021) 39(5):632–48. doi: 10.1016/j.ccell.2021.02.013
41. Chen B, Gao A, Tu B, Wang Y, Yu X, Wang Y, et al. Metabolic modulation Via mTOR pathway and anti-angiogenesis remodels tumor microenvironment using PD-L1-Targeting codelivery. Biomaterials (2020) 255:120187. doi: 10.1016/j.biomaterials.2020.120187
Keywords: GLUD1, renal cell carcinoma, prognosis, methylation, PI3K/Akt/mTOR
Citation: Wang L, Fang Z, Gao P and Zheng J (2022) GLUD1 suppresses renal tumorigenesis and development via inhibiting PI3K/Akt/mTOR pathway. Front. Oncol. 12:975517. doi: 10.3389/fonc.2022.975517
Received: 22 June 2022; Accepted: 29 August 2022;
Published: 20 September 2022.
Edited by:
Juan Carlos Gallardo, Instituto Nacional de Cardiologia Ignacio Chavez, MexicoReviewed by:
Serena Astore, San Camillo-Forlanini Hospital, ItalyMatteo Droghetti, University of Bologna, Italy
Copyright © 2022 Wang, Fang, Gao and Zheng. This is an open-access article distributed under the terms of the Creative Commons Attribution License (CC BY). The use, distribution or reproduction in other forums is permitted, provided the original author(s) and the copyright owner(s) are credited and that the original publication in this journal is cited, in accordance with accepted academic practice. No use, distribution or reproduction is permitted which does not comply with these terms.
*Correspondence: Junfang Zheng, zhengjf@ccmu.edu.cn
†These authors have contributed equally to this work and share first authorship