 Fujin Fang
 Chengyou Liu3
 Rui Xu
 Xiaobing Shen
- 1Key Laboratory of Environmental Medical Engineering and Education Ministry, School of Public Health, Southeast University, Nanjing, China
- 2Department of Preventive Medicine, School of Public Health, Southeast University, Nanjing, China
- 3Department of Medical Engineering, Nanjing First Hospital, Nanjing, China
- 4Department of Clinical Laboratory, The Third People’s Hospital of Bengbu, Bengbu, China
Background: Gastric cancer (GC) remains a common disease with a poor prognosis worldwide. The SET binding protein 1 (SETBP1) has been implicated in the pathogenesis of several cancers and plays a dual role as an oncogene and a tumor suppressor gene. However, the role and underlying mechanism of SETBP1 in GC remain unclear.
Materials and Methods: We used next-generation RNA sequencing (RNA-seq) data from The Cancer Genome Atlas (TCGA) to explore the correlation between SETBP1 expression and tumor progression. We then quantified SETBP1 expression in GC cells with real-time quantitative polymerase chain reactions (RT-qPCR). The chi-square test and logistic regression were used to assess the correlation between SETBP1 expression and clinicopathological features. Kaplan-Meier survival analysis and Cox proportional hazards regression model were used to assess the relationship between SETBP1 expression and survival. Finally, gene set enrichment analyses (GSEA) were used to examine GC-related signaling pathways in low and high SETBP1 expressing samples.
Results: We found SETBP1 expression levels in GC tissues to be significantly lower than in adjacent non-tumor tissues in the TCGA database. In addition, SETBP1 expression differed significantly between groups classified by tumor differentiation. Furthermore, SETBP1 expression in diffuse-type GC was significantly higher than in intestinal-type GC. However, it did not differ significantly across pathological- or T-stage groups. RT-qPCR and comprehensive meta-analysis showed that SETBP1 expression is downregulated in GC cells and tissues. Interestingly, SETBP1 expression in poorly- or un-differentiated GC cells was higher than in well-differentiated GC cells. Moreover, the chi-square test and logistic regression analyses showed that SETBP1 expression correlates significantly with tumor differentiation. Kaplan–Meier curves indicated that patients with relatively high SETBP1 expression had a poor prognosis. Multivariate analyses indicated that SETBP1 expression might be an important predictor of poor overall survival in GC patients. GSEA indicated that 20 signaling pathways were significantly enriched in samples with high and low SETBP1 expression.
Conclusion: SETBP1 may play a dual role in GC progression.
Introduction
While the global incidence of gastric cancer (GC) is declining, it remains one of the most common causes of cancer-related death worldwide. There are three major subtypes of GC under the Lauren classification system but four subtypes under the World Health Organization (WHO) classification system (1, 2). Many GCs are associated with various pathogenic infections, including Helicobacter pylori and the Epstein-Barr virus (EBV) (3). While significant effort has been made in diagnosing and treating GC, the clinical outcomes of patients with advanced GC remain poor. The 5-year survival rate of GC patients is about 20−30% in most areas of the world (4). Only recently have researchers started to appreciate how heterogeneous GC is. Nevertheless, GC remains a deadly disease. Current treatment options or earlier detection strategies have not provided meaningful control of GC. Therefore, it remains crucial to provide novel strategies for reducing GC risk.
The SET binding protein 1 (SETBP1) gene encodes a large protein of 1542 amino acids localized in the cell nucleus and cytoplasm (5, 6). SETBP1 was originally found to interact with SET, a small protein inhibitor of tumor suppressors protein phosphatase 2 phosphatase activator (PP2A) and non-metastatic protein 23 H1 (NM23-H1) (7–9). It is now widely recognized as a tumor-associated gene (5), and alteration of SETBP1 expression has been implicated in several tissue-specific diseases (10–12), including cancer. The downregulation of SETBP1 expression has been reported to promote non-small cell lung cancer progression by inducing cellular epithelial-mesenchymal transition (EMT) and disordered immune status (5). In addition, SETBP1 accumulation has been found to induce P53 inhibition and genotoxic stress in neural progenitors underlying neurodegeneration in Schinzel-Giedion syndrome (13). Furthermore, overexpression of tripartite motif-containing 29 (TRIM29) is closely associated with adverse clinical outcomes in ovarian cancer and promotes the proliferation, migration, and invasion of ovarian cancer cells via the SETBP1/SET/PP2A carcinogenic signal axis (14).
SETBP1 mutations in patients have also received wide attention, especially in blood diseases (15–18). Carratt et al. demonstrated that mutant SETBP1 enhances activation of the mitogen-activated protein kinase 1 (MAPK) pathway by the proto-oncogene GTPase NRAS, promoting aggressive leukemia (19). In addition, SETBP1 mutations have been reported to drive leukemic transformation in ASXL transcriptional regulator 1 (ASXL1)-mutated myelodysplastic syndrome (MDS) (20). Moreover, a father and son diagnosed with atypical chronic myeloid leukemia (aCML) were both found to carry SETBP1 mutations, which are present in 24.3% of aCML patients (21). Therefore, SETBP1 mutations are believed to be a biomarker in disease diagnosis (22, 23). However, their relationship with GC progression remains unclear.
This study examines the relationship between SETBP1 expression and the clinicopathological features of GC patients to advance understanding of the underlying signaling pathways related to SETBP1 expression and GC progression. Our findings provide additional evidence of its suitability as a prognostic biomarker for GC.
Materials and Methods
Data Collection
The Cancer Genome Atlas (TCGA) is a landmark cancer genomics program that molecularly characterized over 20,000 primary cancers and matched normal samples representing 33 cancer types. The next-generation RNA sequencing (RNA-seq) data of 407 GC-related samples, 375 GC tissue and 32 adjacent non-tumor tissue samples, were retrieved from the TCGA database (https://portal.gdc.cancer.gov/). The details of the patients are provided in Table S1. We then compared the SETBP1 expression in cancer tissues and paracarcinoma tissues.
In addition, 11 datasets were downloaded from Gene Expression Omnibus (GEO) database: GSE13195, GSE13911, GSE26899, GSE27342, GSE29272, GSE33335, GSE37023, GSE54129, GSE63089, GSE64591, and GSE65801. These datasets include 761 GC tissue samples and 475 adjacent non-tumor tissue samples. Information on these GEO datasets is provided in Table S2.
These datasets were analyzed as previously described (24, 25) using the R software to assess the differential expression of SETBP1. The standardized mean difference (SMD) was calculated as the effect size for continuous outcomes. The accuracy of the results is reported as a 95% confidence interval (CI). The chi-squared (χ2) and heterogeneity (I2) statistical tests were used to evaluate heterogeneity among datasets. The fixed effects were calculated using a fixed-effects model with P>0.05 or I2<50% and a random-effects model otherwise.
SETBP1 Expression Analysis and Survival Analysis
The Perl programming language was used to sort and merge the downloaded TCGA gene expression data. It was also used to obtain the survival data from clinical databases and eliminate the data without information on complete survival time and survival status. The limma package of the R statistical software was used to extract the mRNA expression data from the datasets. The limma and beeswarm packages were used to visualize the extracted data and plot scatter difference diagrams in R. SETBP1 expression data was matched with the complete survival information. A total of 319 patients with complete information that met our requirements were retained for analysis. Based on the median SETBP1 expression value, patients were divided into two groups: high SETBP1 expression and low SETBP1 expression. The survival package of the R software was used for visualization and to obtain the Kaplan-Meier survival curve.
A comprehensive meta-analysis was performed using Review Manager 5.3 software to assess differences in SETBP1 expression in the GEO database. The SMD with a 95% CI was used to calculate a combined value. The heterogeneity among the included datasets was evaluated by χ2 and I2 statistical tests. A fixed-effects model was used to calculate the combined effect with P>0.05 or I2<50%, and a random-effects model was used otherwise. The results are presented as a forest diagram.
Cell Culture
Human gastric mucosal epithelial cells (GES-1) were maintained in Dulbecco’s Modified Eagle Medium (DMEM) (Gibco; Waltham, MA, USA) supplemented with 10% Fetal Bovine Serum (FBS) and 1% penicillin-streptomycin in a humidified incubator at 37°C with 5% CO2.
The human GC cell lines HGC-27, MGC-803, AGS, and MKN-28 were cultured in Roswell Park Memorial Institute (RPMI) 1640 (Gibco) or DMEM (Gibco), according to the manufacturer’s specifications and supplemented with 10% FBS and 1% penicillin-streptomycin at 37°C with 5% CO2.
RT-PCR and RT-qPCR
RNA extraction was performed with TRIzol reagent (Invitrogen Life Technologies; Carlsbad, CA, USA). RNA samples were treated with gDNA remover reagent (GenStar) according to the manufacturer’s instructions to remove genomic DNA (gDNA). cDNA was synthesized using the RT-Phusion kit (Thermo Fisher Scientific; Waltham, MA, USA). Gene-specific mRNA levels were quantified using standard and quantitative RT-PCR (RT-qPCR) using the ΔΔCt method. The primer sequences are listed in Table 1.

Table 1 List of primers.
Univariate and Multivariate Cox Regression Analyses
Univariate and multivariate analyses were performed using a Cox proportional hazard regression model. The hazard ratio (HR) and 95% CI were calculated, the independent predictive value of the clinicopathological features and SETBP1 expression on survival was quantitatively assessed, and the independent prognostic effect of SETBP1 on survival was estimated by adjusting for confounders. First, the Perl programming language was used to sort and merge the original clinical data; unknown or incomplete clinical information was removed. Then, the clinical data was matched with the SETBP1 expression data. Finally, the matched data were analyzed by univariate and multivariate Cox regression. According to the median SETBP1 expression value, the patients were divided into two groups: high SETBP1 expression and low SETBP1 expression. The data were analyzed and visualized using the survival and survminer packages of the R software with the coxph and ggforest commands.
Gene Set Enrichment Analysis
The signaling pathways related to SETBP1 in GC were explored using GSEA (v.4.2.3). GSEA was performed between datasets with SETBP1 expression levels. The phenotype was determined by SETBP1 expression level based on the TCGA database. The annotated gene set was selected (c2.cp.kegg.v6.2.symbols.gmt) as the reference gene set. A total of 1000 gene sets were used in each analysis to identify pathways with significant differences. Each analysis was performed with 1000 permutations to identify pathways that differed significantly. The normalized enrichment score (NES), nominal p-value, and false discovery rate (FDR) q-value were used to assess the importance of the association between gene sets and pathways.
Statistical Analysis
The differential expression of SETBP1 between GC tissues and adjacent non-tumor tissues was assessed with a Mann-Whitney U test. The differences in SETBP1 expression across multiple groups were compared using a Student’s t-test or Bonferroni correction. The χ2 test was used to evaluate associations between SETBP1 expression and clinicopathological features. Kaplan-Meier analysis and log-rank test were used to compare the significant differences in survival rates between the high- and the low-SETBP1 expression groups. A Cox proportional hazard regression model was used for univariate and multivariate survival analysis. Statistical analyses were performed with the IBM SPSS (v.23.0), GraphPad Prism (version 9.0), and R (version 2.15.3) software. Results with P<0.05 was considered statistically significant.
Results
The Differential Expression of SETBP1 in GC
RNA-seq data for 407 samples, representing 375 GC tissue and 32 adjacent non-tumor tissue samples, were downloaded from the TCGA database. We found SETBP1 expression to be significantly lower in GC tissues than in adjacent non-tumor tissues (P<0.0001; Figure 1A). In addition, SETBP1 expression was significantly different in groups classified according to tumor differentiation (P<0.0001), where SETBP1 expression was significantly higher in the poor group (G3, poorly differentiated; G4, undifferentiated) compared to the well or moderate groups (G1, well-differentiated; G2, moderately differentiated; Figure 1B). Moreover, SETBP1 expression in diffuse type GC was significantly higher than in intestinal type GC based on the Lauren classification system (P<0.0001; Figure 1C). However, SETBP1 expression did not differ statistically across pathological stages (Figure 1D) or T stages (Figure 1E).
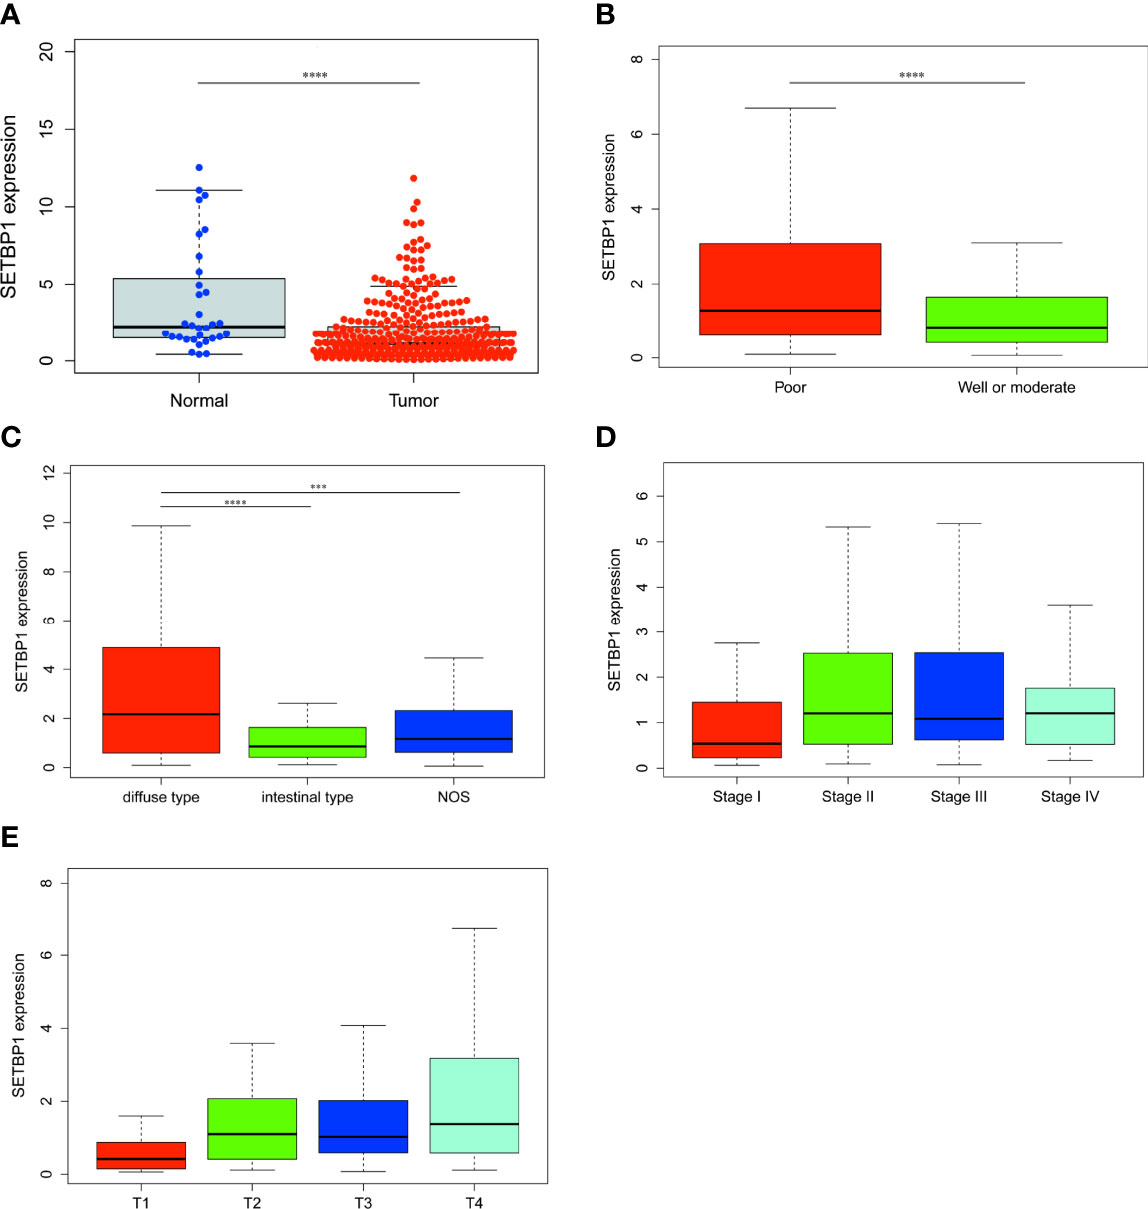
Figure 1 The differential expression of SETBP1 and its relationship with clinicopathological features based on TCGA data. (A) Differential expression of SETBP1 between GC tissues and adjacent non-tumor tissues. (B) The expression of SETBP1 is divided into groups by tumor differentiation (C), Lauren classification (D), pathological stage (E) and T stage. Poor, G3 (Poorly differentiated) and G4 (Undifferentiated); Well or moderate, G1 (Well differentiated) and G2 (Moderately differentiated). ****P < 0.0001, unpaired two-sided Student’s t-test. Error bars indicate mean and SD. There are no statistically significant differences across pathological stage or T stage groups. ****P < 0.0001, ***P < 0.001, Bonferroni correction was used for multiple comparison. NOS, Not otherwise specified.
Confirmation of SETBP1 Differential Expression by RT-qPCR and SMD
>To confirm SETBP1 differential expression in the TCGA database, RT-qPCR was used to evaluate SETBP1 expression in five cell lines. SETBP1 expression in GC cells (HGC-27, MGC-803, AGS, and MKN-28) was significantly lower than that in GES-1 cells (P<0.0001; Figure 2A). Interestingly, SETBP1 expression in well-differentiated GC cells (MKN-28) was significantly lower than in poorly differentiated (MGC-803; P<0.05) and undifferentiated (HGC-27; P<0.01) GC cells (Figure 2A). Moreover, the confirmation of SETBP1 expression was performed using the GEO datasets, providing an I2 value of 91% (P<0.00001) and a combined SMD for SETBP1 of -0.45 based on the random-effects model (95% CI: -0.64–0.25; Figure 2B), indicating that SETBP1 is expressed at low levels in GC.
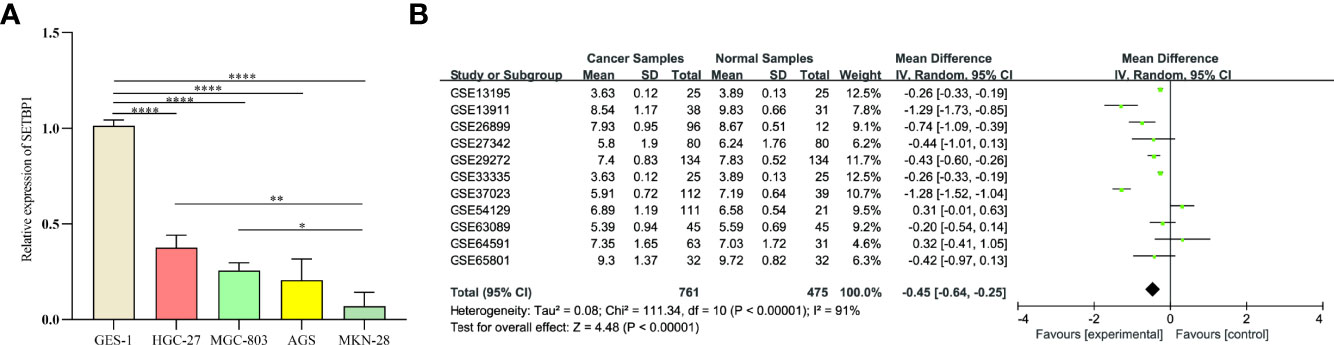
Figure 2 Real-time quantitative polymerase chain reaction analysis and forest plot of SETBP1 expression data from GEO datasets. (A) RT-qPCR analysis of SETBP1 mRNA expression in human gastric mucosal epithelial cells (GES-1) and human GC cell lines (HGC-27, MGC-803, AGS and MKN-28). Data are the mean ± s.d. of three independent experiments. ****P < 0.0001, **P < 0.01, *P < 0.05, unpaired two-sided Student’s t-test. (B) The pooled of SETBP1 is -0.45 (95% CI, -0.64–0.25) by the random effects model. SMD, standard mean difference; CI, confidence interval.
Highly Expressed Genes Are Associated With Poor Overall Survival in GC
The prognosis of high SETBP1 expression in GC was assessed based on the TCGA using Kaplan-Meier risk estimation. High SETBP1 expression was more significantly correlated with poor overall survival than low SETBP1 expression (P=0.012; Figure 3). The 50% survival probability in the high SETBP1 expression group was about half the number of survival days in the low SETBP1 expression group (Figure 3).
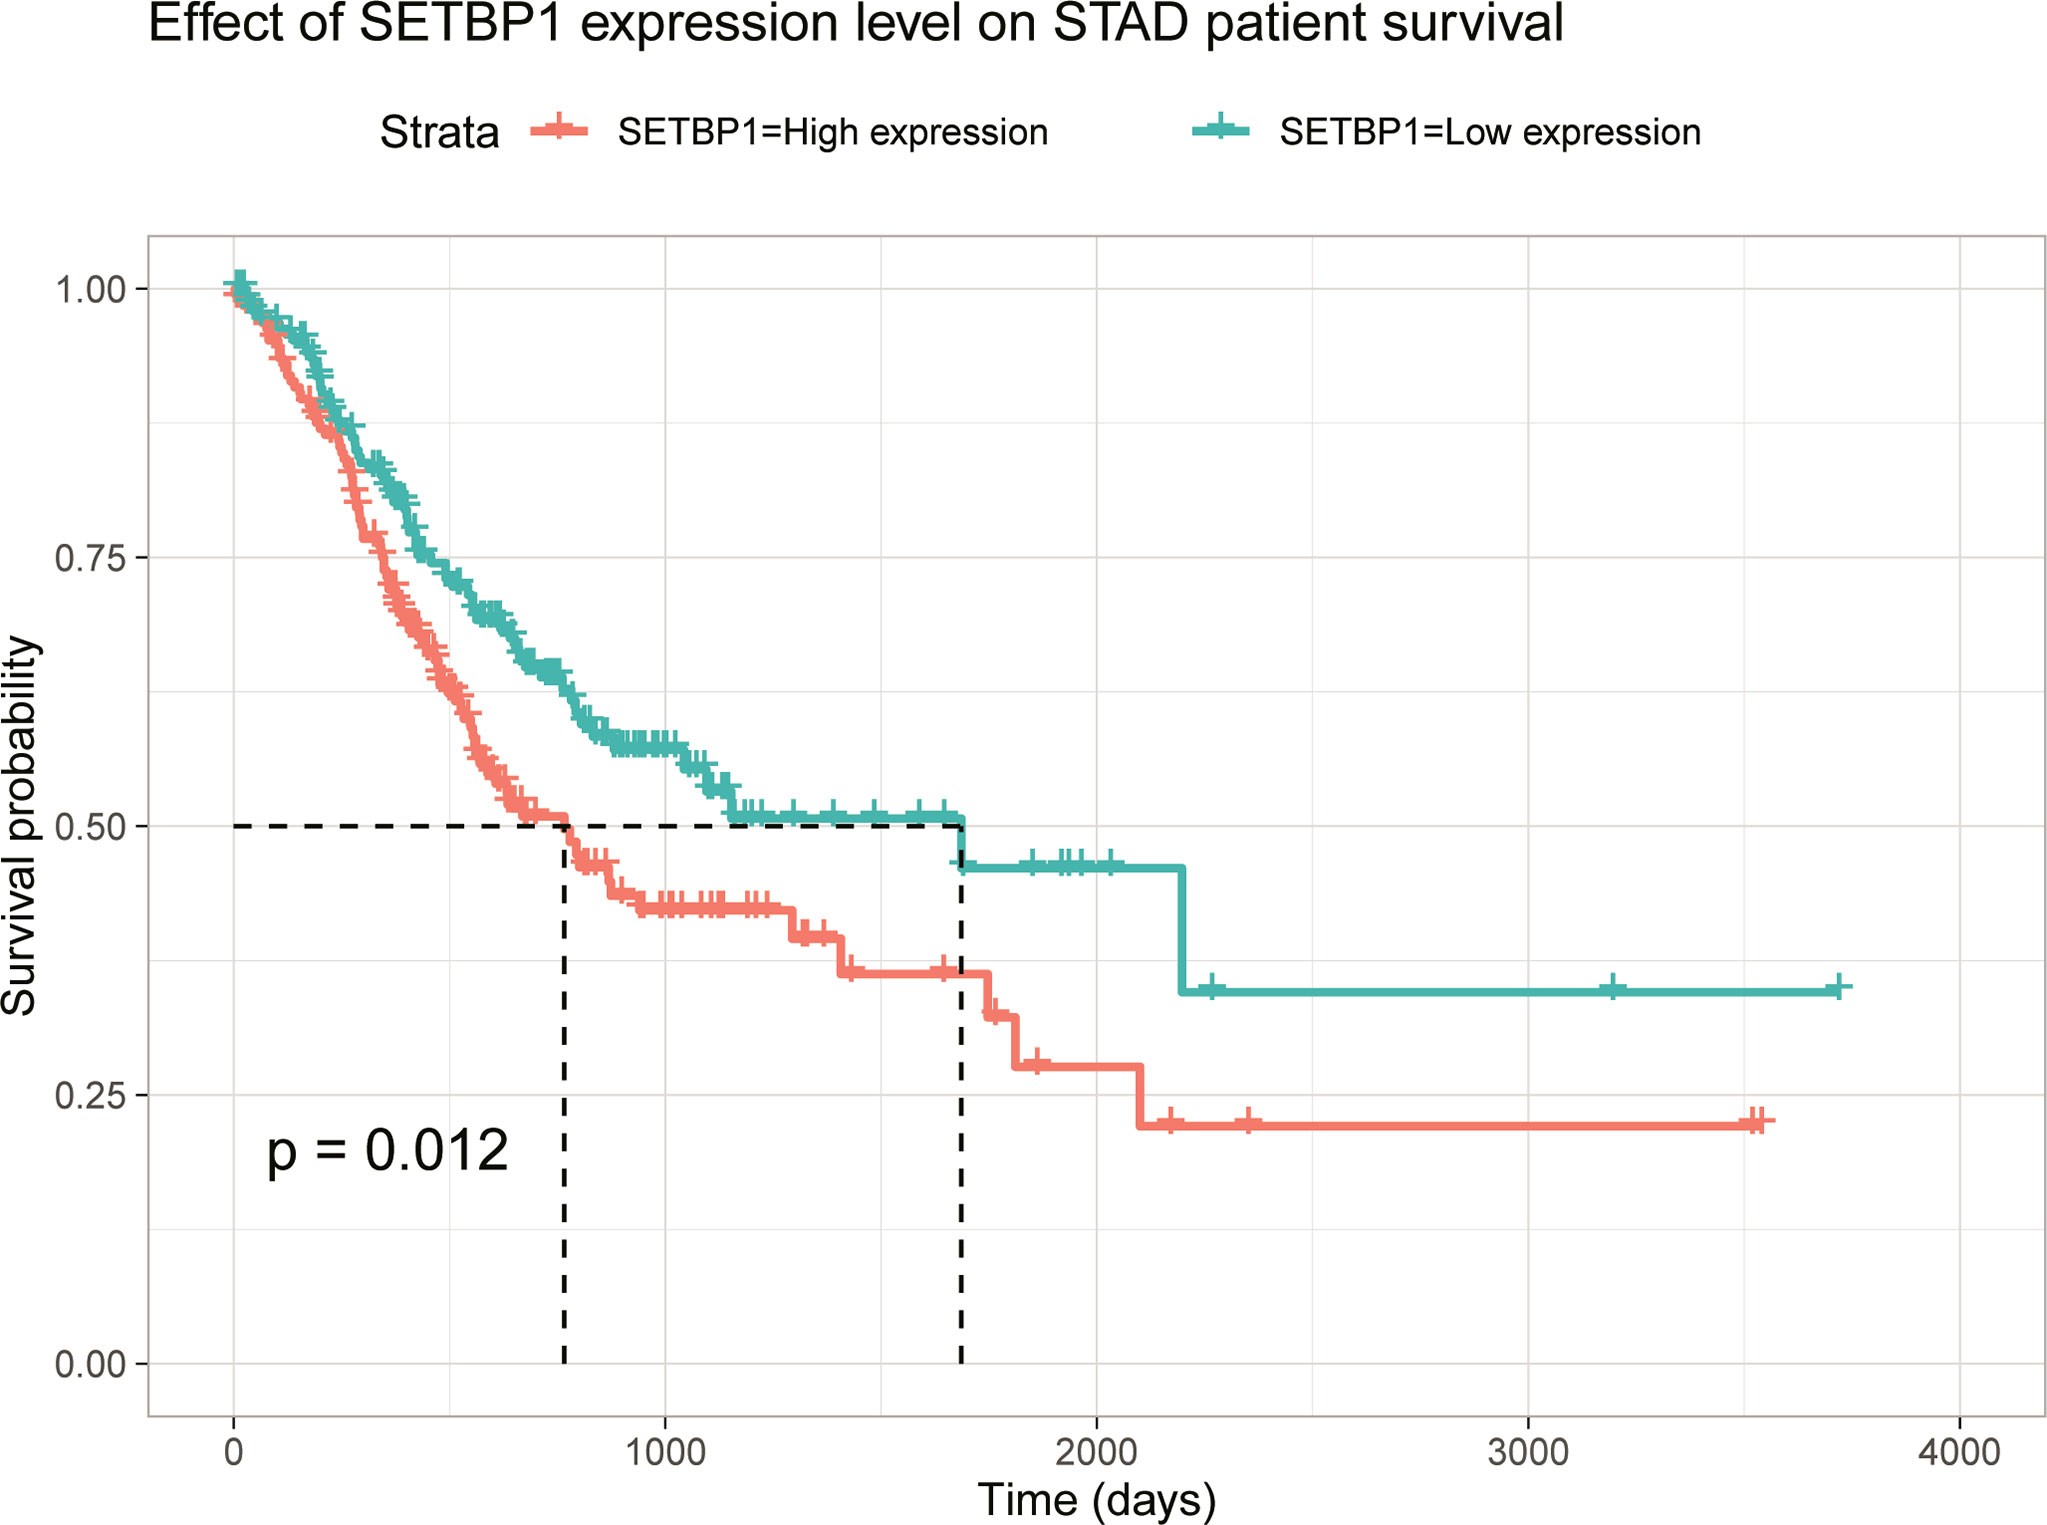
Figure 3 Kaplan-Meier curve for the relationship between SETBP1 expression and the prognosis of GC patients based on the TCGA database (P=0.012).
The Relationship Between SETBP1 Expression and Clinicopathological Features
We assessed the relationship between SETBP1 expression and clinicopathological features, finding that high SETBP1 expression was significantly correlated with tumor differentiation (P=0.001; Table 2). Logistic regression analyses indicated that higher SETBP1 expression in GC was significantly associated with age (odds ratio [OR]=1.541 for ≥65 vs. <65, P=0.041), tumor differentiation (OR = 0.490 for poor vs. well or moderate, P=0.001), pathological stage (OR=2.679 for stage II vs. stage I, P=0.005; OR=2.118 for stage III vs. stage I, P=0.026; OR=2.912 for stage IV vs. stage I, P=0.015), T stage (OR=3.750 for T2 vs. T1, P=0.029; OR=3.329 for T3 vs. T1, P=0.039; OR=5.625 for T4 vs. T1, P=0.004; Table 3).
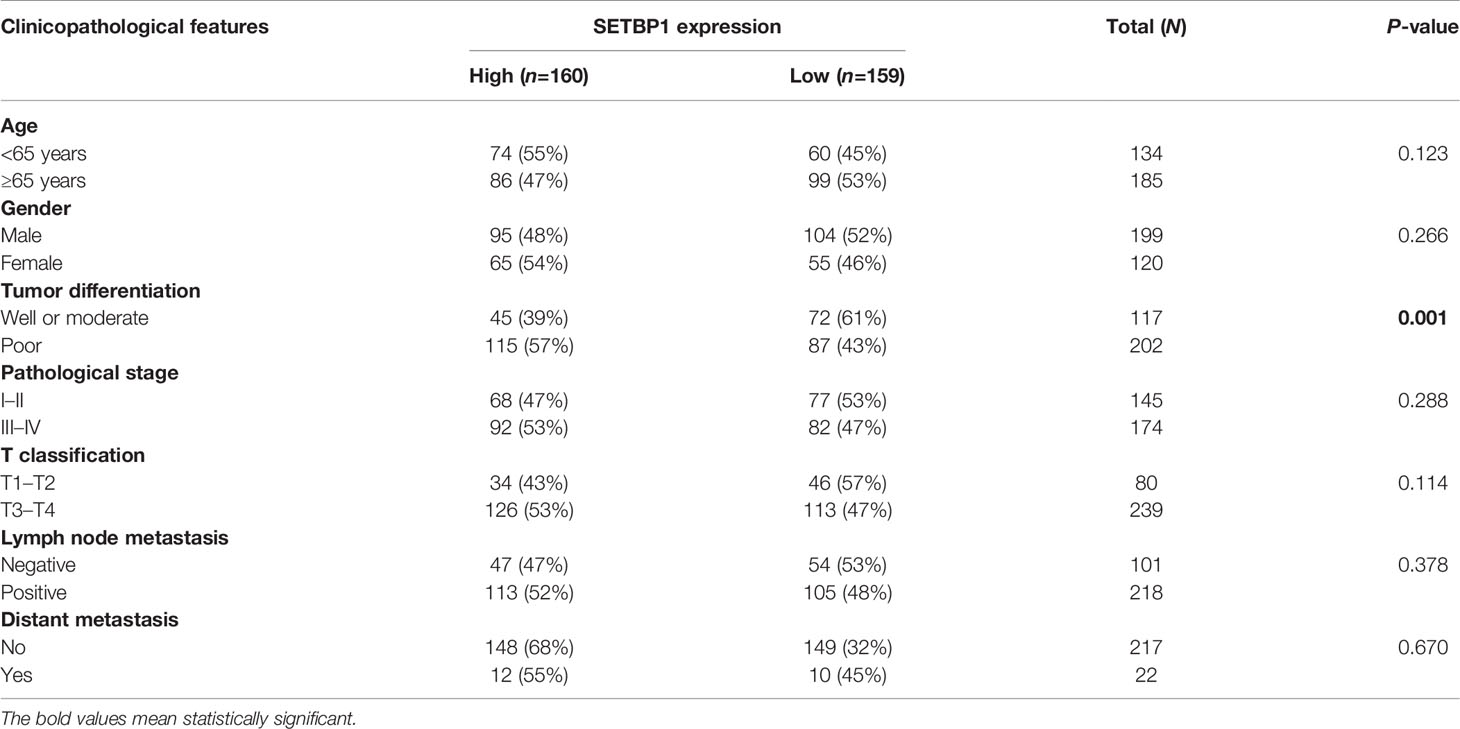
Table 2 The relationship between SETBP1 expression and clinicopathological features in GC.

Table 3 SETBP1 expression correlated with clinicopathological features in GC.
Univariate and Multivariate Analysis of the Relationship Between SETBP1 Expression and GC
Overall survival was significantly correlated with SETBP1 expression in GC patients. Therefore, univariate and multivariate analyses of the relationship between SETBP1 expression in GC patients were performed to jointly assess the effects of SETBP1 expression and clinicopathological features on the overall survival. The univariate analysis showed that age (HR=1.027; 95% CI: 1.008-1.047; P=0.006), pathological stage (HR=1.535; 95% CI: 1.221-1.931; P=0.000), T stage (HR=1.298; 95% CI: 1.023-1.645; P=0.032), M stage (HR=2.048; 95% CI: 1.096-3.827; P=0.025), N stage (HR=1.267; 95% CI: 1.069-1.502; P=0.006) were important survival predictors (Table 4). Furthermore, multivariate analysis showed that increased SETBP1 expression might be a prominent freestanding predictor of poor overall survival in GC (HR=1.114; 95% CI: 1.020-1.218; P=0.017) (Table 4; Figure 4).
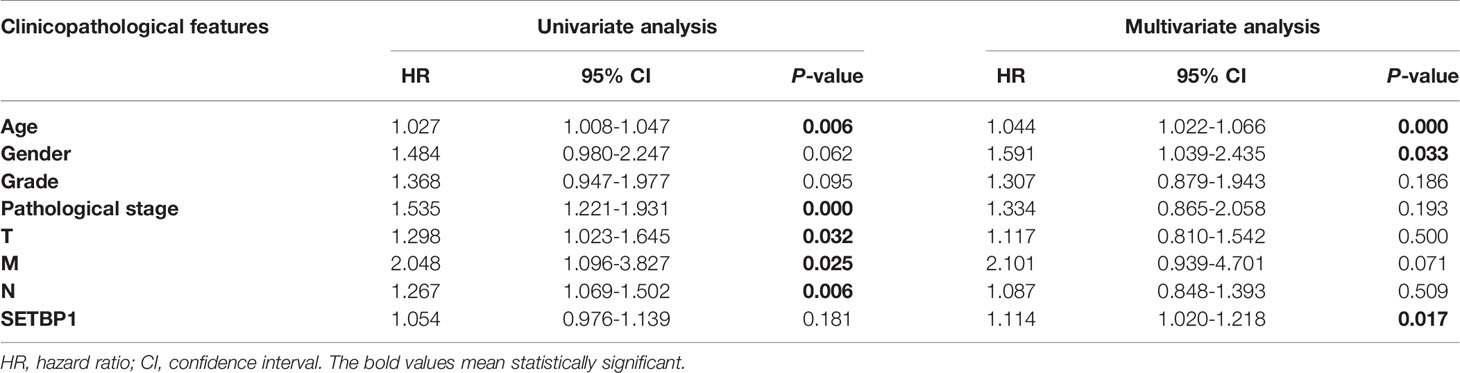
Table 4 Univariate and multivariate analysis of the relationship between SETBP1 expression and GC patients.
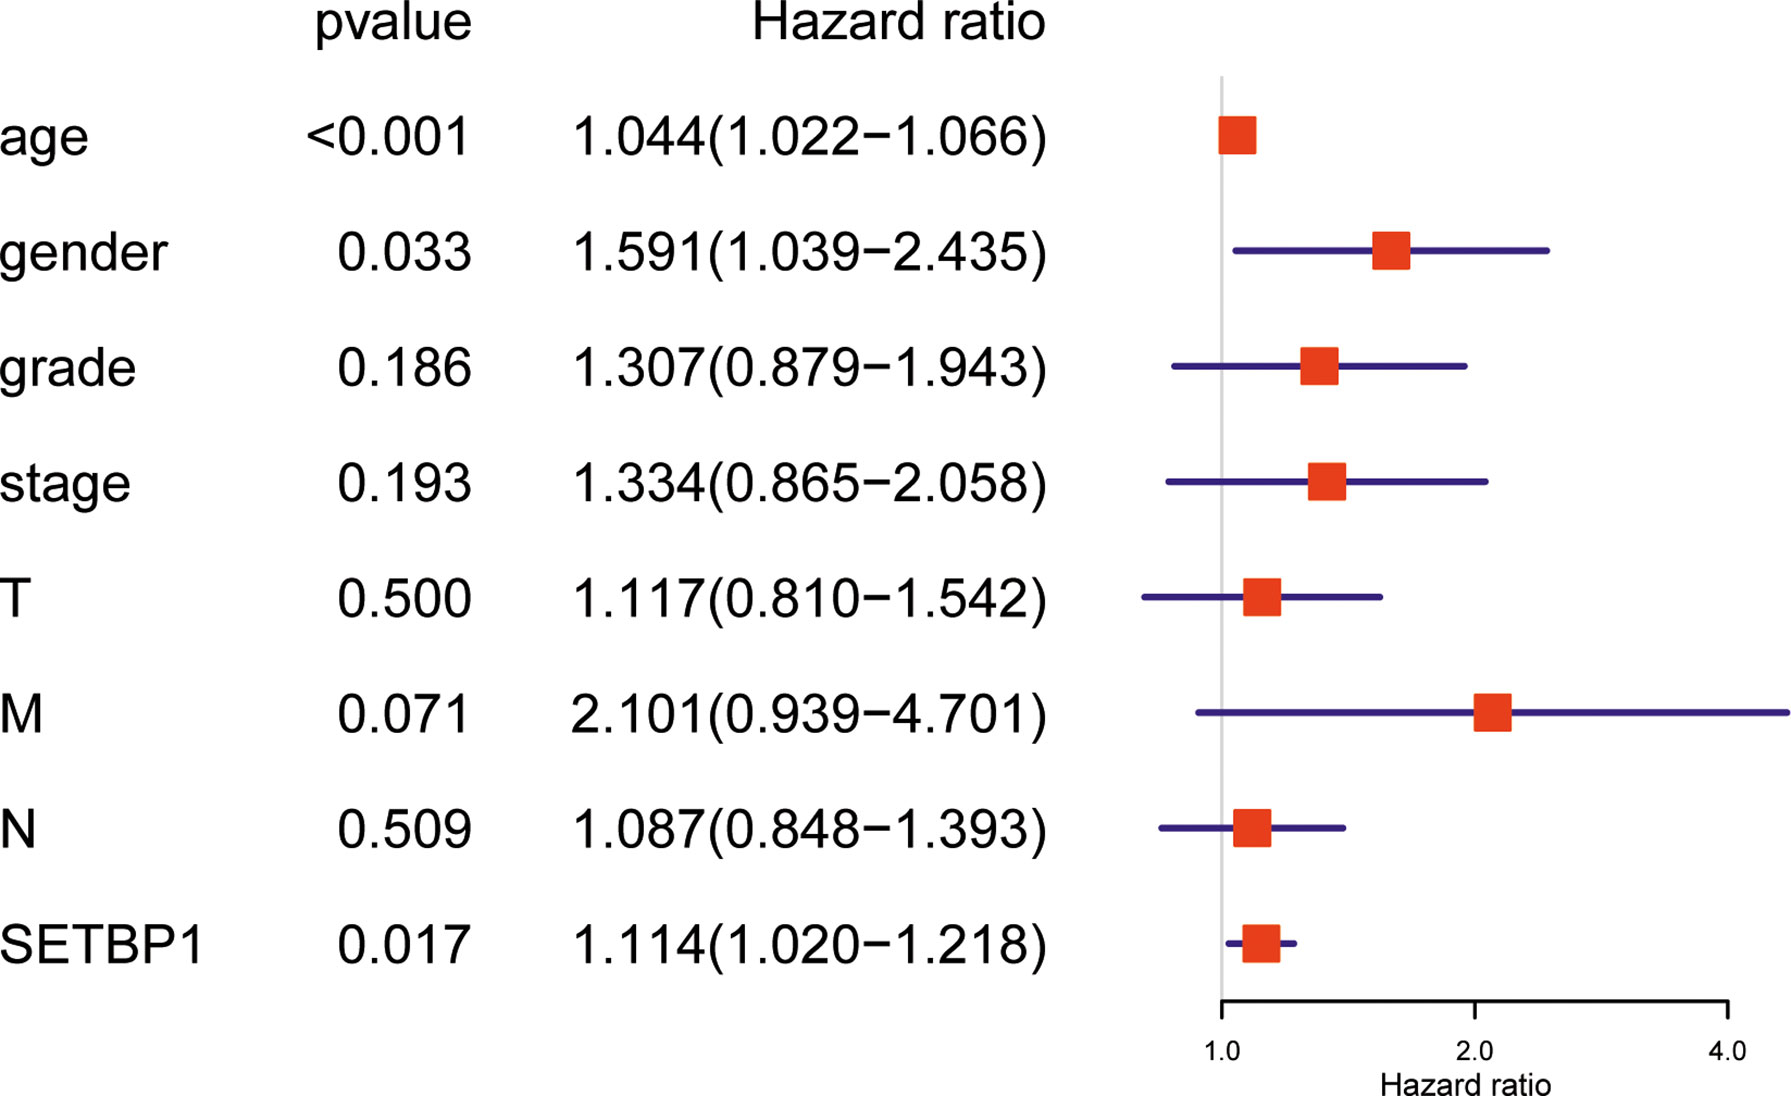
Figure 4 Forest plot for the multivariate Cox proportional hazard regression model. SETBP1 could act as an independent predictor of poor survival rate (HR, 1,114; 95% CI, 1.020-1.218; P = 0.017) in different grading of GC patients. HR, hazard ratio; CI, confidence interval.
Identify the Signaling Pathways Associated With SETBP1
This study explored the function of SETBP1 and its associated signaling pathways through GSEA in the TCGA database based on NES, FDR q-values, and nominal p-values to identify significantly enriched signaling pathways. We identified 10 and 10 signaling pathways significantly enriched for genes differentially expressed in the high and low SETBP1 expression groups, respectively. The neuroactive ligand receptor interaction, calcium signaling pathway, jak stat signaling pathway, extracellular matrix (ECM) receptor interaction, pathways in cancer, Wnt signaling pathway, mammalian target of rapamycin (mTOR) signaling pathway, basal cell carcinoma, melanogenesis, and cytokine-cytokine receptor interaction gene sets were significantly enriched in the high SETBP1 expression group. In addition, the pyrimidine metabolism, oxidative phosphorylation, proteasome, glutathione metabolism, aminoacyl tRNA biosynthesis, fructose and mannose metabolism, DNA replication, nucleotide excision repair, mismatch repair, amino sugar and nucleotide sugar metabolism gene sets were significantly enriched in the low SETBP1 expression group (Table 5; Figures 5, S1, and S2).
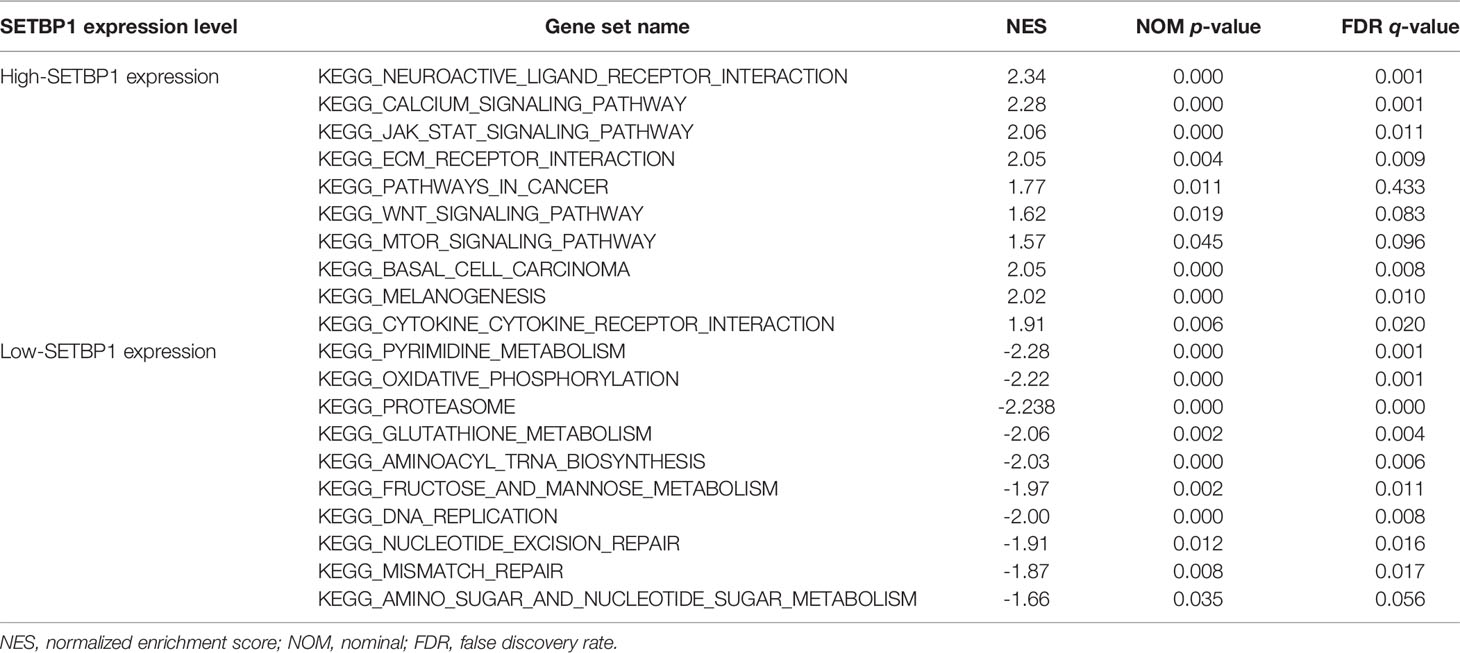
Table 5 Gene sets enriched in the SETBP1 expression phenotype.
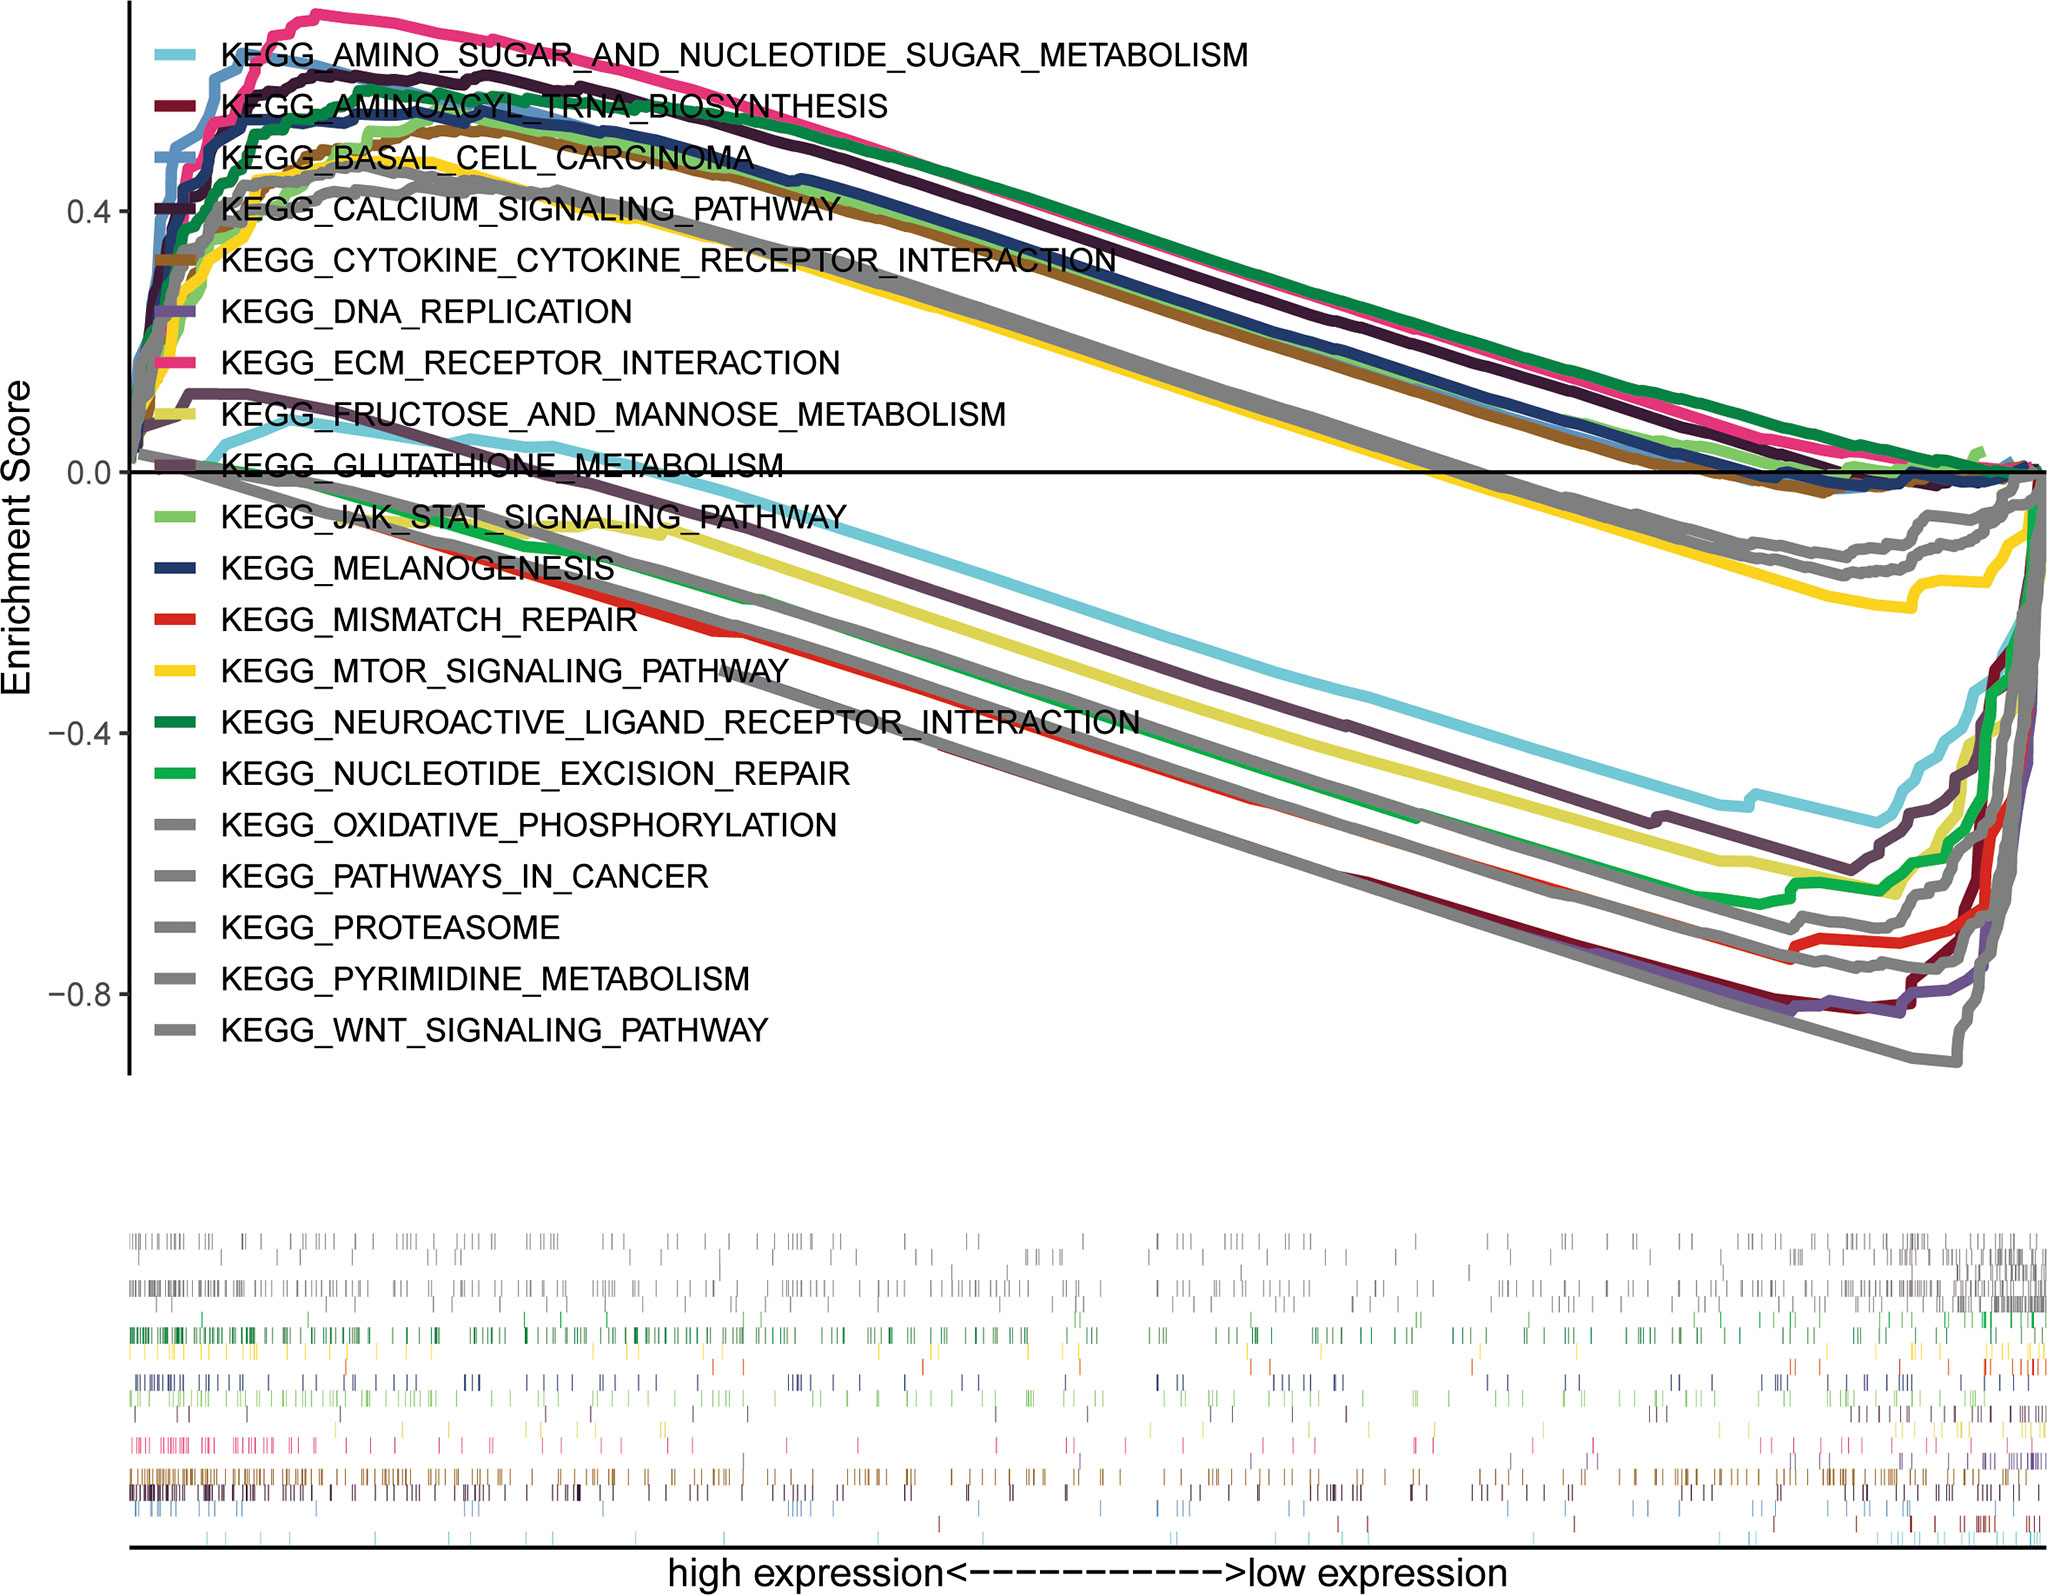
Figure 5 A combined enrichment maps from genomic enrichment analysis, enrichment scores and genomes were included.
Discussion
SETBP1 expression has been extensively studied in various diseases, including cancers, where it is abnormal compared with normal tissues. These studies have involved several cancer types, including non-small cell lung cancer (5), hematologic malignancies (26), colorectal cancer (27), ovarian cancer (14), breast cancer (12), and gastric cancer (28, 29). However, SETBP1 appears to play a dual role in different cancer types. It has been shown that SETBP1 is highly expressed in some cancers, driving carcinogenesis. SETBP1 has been reported to be overexpressed in acute myeloid leukemia (AML), protecting the SET protein from proteasome degradation, and leading to increased levels of full-length SET protein. Patients with SETBP1 overexpression have a significantly shorter overall survival (30). In addition, TRIM29 can facilitate SETBP1 transcriptional activation via the vascular endothelial zinc finger 1 (VEZF1) transcription factor, promoting ovarian cancer progression (14). Moreover, SETBP1 was identified as an oncogene contributing to breast cancer development (12).
Conversely, lower SETBP1 expression was found to promote non-small cell lung cancer progression by inducing cellular EMT and disordered immune status (5). It has also been reported that SETBP1 expression is similar or lower in colorectal cancer tissue compared to normal colonic mucosa (27). Furthermore, SETBP1 mutations have been found to be involved in serval cancers, including myeloid neoplasms (15), lung cancer (31, 32) and colorectal cancer (27). Therefore, the role of SETBP1 in cancer remains controversial and in GC remains obscure.
Our study uncovered a relationship between SETBP1 and GC. We showed that SETBP1 expression was significantly lower in GC tissues than in adjacent non-tumor tissues in the TCGA database (Figure 1A). However, the small number of normal tissue samples (32) may increase the risk of bias due to sampling error. We performed a meta-analysis to confirm low SETBP1 expression in GC based on the GEO database (Figure 2B), finding the TCGA and GEO results to be consistent. Furthermore, we showed that SETBP1 expression in GC cell lines (HGC-27, MGC-803, AGS, and MKN-28) was significantly lower than that in the GES-1 cell line (Figure 2A), consistent with earlier studies (5, 27). Therefore, the findings of this study indicate that SETBP1 may act as a tumor suppressor gene.
Interestingly, the Kaplan-Meier survival analysis showed that the high SETBP1 expression group had a worse overall GC survival prognosis than the low SETBP1 expression group (Figure 3). In addition, the multivariate analysis showed that high SETBP1 expression was related to poor overall survival and other clinicopathological features (Figure 4; Table 4). Interestingly, these results were consistent with those of our previous work (Figure 1B), with a worse prognosis associated with a lower grade (33). These findings were confirmed in our human GC cell experiments. SETBP1 expression in poorly differentiated (MGC-803) or undifferentiated (HGC-27) GC cells was higher than in well-differentiated GC cells (MKN-28). In addition, intestinal type cancers are common and reported to have a better prognosis than diffuse type cancers. In this study, SETBP1 expression in diffuse-type GC was significantly higher than in intestinal-type GC. Therefore, lower SETBP1 expression may confer better overall survival in GC patients, indicating that SETBP1 may act as an oncogene. Consequently, our findings appear contradictory and indicate that SETBP1 may have a dual role in GC development.
The SETBP1-associated signaling pathways in GC were identified via GSEA, with 10 and 10 KEGG pathways enriched in high- and low-SETBP1 expression groups, respectively (Table 5). In the high SETBP1 expression group, the neuroactive ligand receptor interaction signaling pathway is related to tumor TNM stage, lymph node metastasis, and poor prognosis with GC (34). In addition, it can trigger the downstream phosphoinositide 3-kinase (PI3K)/protein kinase B (Akt) signal pathway that is often associated with cancer (35). The calcium signaling pathway plays a role in multiple cellular processes involved in metabolism, secretion, fertilization, proliferation, and smooth muscle contraction (36–38). The Janus kinase (JAK)/signal transducer and activator of transcription (STAT) signaling pathway is universally expressed and involved in many important biological processes, including cell proliferation, differentiation, apoptosis, and immune regulation (39). The ECM-receptor interaction pathway plays an important role in the tumor shedding, adhesion, degradation, movement, and hyperplasia processes (40). Similar to the PI3K/Akt signal pathway, the pathways in cancer, basal cell carcinoma signaling pathway (41), mTOR signaling pathway (42), Wnt signaling pathway (43) and melanogenesis signaling pathway (44) are common cancer-related pathways. The cytokine receptor signaling pathway is an immune-related signaling pathway that affects tumor progression (45). Therefore, SETBP1 may promote tumor progression by regulating various signaling pathways.
In the low SETBP1 expression group, the pyrimidine metabolism signaling pathway is critical for the generation of pyrimidines for DNA replication, RNA synthesis, and cellular bioenergetics. Increased nucleotide metabolism supports the uncontrolled growth of tumors (46). Oxidative phosphorylation is upregulated in some cancers, including leukemia, lymphoma, and pancreatic ductal adenocarcinoma (47). Proteasome (48), glutathione metabolism (49), aminoacyl tRNA biosynthesis (50), fructose and mannose metabolism (51), and amino sugar and nucleotide sugar metabolism (52, 53) are all common metabolism-related signaling pathways. DNA replication (54), nucleotide excision repair (55), and mismatch repair (56) are nucleic acid biosynthesis-related signaling pathways contributing to the cell cycle. Therefore, SETBP1 can function either as an oncoprotein or tumor suppressor, and further studies on its role in GC are required.
GC is a heterogeneous disease that affects a large number of individuals per year and remains an unmet clinical problem (57). Due to the high mortality of GC, various studies have sought to identify biomarkers to support earlier detection and improve the survival status of GC patients. In this study, we have shown that SETBP1 may have a dual role in GC development. However, our study had some limitations. Further studies with larger sample sizes and on the possible dynamic regulatory mechanism by which SETBP1 contributes to GC are required to determine whether SETBP1 functions as an oncoprotein or tumor suppressor in GC. Additional studies are needed to understand how to treat GC and cancer in general. Hopefully, as research progresses, their findings will provide important insights into these critical issues.
Data Availability Statement
Publicly available datasets were analyzed in this study. This data can be found here: TCGA database (https://portal.gdc.cancer.gov/). GEO: GSE13195, GSE13911, GSE26899, GSE27342, GSE29272, GSE33335, GSE37023, GSE54129, GSE63089, GSE64591, GSE65801.
Author Contributions
FF contributed to the conception and design of the current study and was responsible for drafting the manuscript. In addition, FF also completed the experimental part. CL, QL, RX, and TZ contributed to process the data and revised the manuscript. The corresponding author (XS) is responsible for ensuring that the descriptions are accurate and agreed by all authors. All authors contributed to the article and approved the submitted version.
Conflict of Interest
The authors declare that the research was conducted in the absence of any commercial or financial relationships that could be construed as a potential conflict of interest.
Publisher’s Note
All claims expressed in this article are solely those of the authors and do not necessarily represent those of their affiliated organizations, or those of the publisher, the editors and the reviewers. Any product that may be evaluated in this article, or claim that may be made by its manufacturer, is not guaranteed or endorsed by the publisher.
Acknowledgments
We thank Dr. Xiaowei Chen from Southeast university for all of the support in using the R language.
Supplementary Material
The Supplementary Material for this article can be found online at: https://www.frontiersin.org/articles/10.3389/fonc.2022.908943/full#supplementary-material
Supplementary Figure 1 | The significantly enriched signaling pathways associated with the increased SETBP1 expression. (A) Neuroactive ligand receptor interaction, (B) calcium signaling pathway, (C) jak stat signaling pathway, (D) ECM receptor interaction, (E) pathways in cancer, (F) Wnt signaling pathway, (G) mTOR signaling pathway, (H) basal cell carcinoma, (I) melanogenesis, (J) cytokine cytokine receptor interaction.
Supplementary Figure 2 | The significantly enriched signaling pathways associated with the decreased SETBP1 expression. (A) pyrimidine metabolism, (B) oxidative phosphorylation, (C) proteasome, (D) glutathione metabolism, (E) aminoacyl tRNA biosynthesis, (F) fructose and mannose metabolism, (G) DNA replication, (H) nucleotide excision repair, (I) mismatch repair, (J) amino sugar and nucleotide sugar metabolism.
Supplementary Table 1 | Clinicopathological features of patients with GC. Tumor, node, metastasis (TNM) classification.
Supplementary Table 2 | Relevant information of the selected GEO series dataset.
References
1. Chen YC, Fang WL, Wang RF, Liu CA, Yang MH, Lo SS, et al. Clinicopathological Variation of Lauren Classification in Gastric Cancer. Pathol Oncol Res (2016) 22(1):197–202. doi: 10.1007/s12253-015-9996-6
2. Hu B, El Hajj N, Sittler S, Lammert N, Barnes R, Meloni-Ehrig A. Gastric Cancer: Classification, Histology and Application of Molecular Pathology. J Gastrointest Oncol (2012) 3(3):251–61. doi: 10.3978/j.issn.2078-6891.2012.021
3. Sexton RE, Al Hallak MN, Diab M, Azmi AS. Gastric Cancer: A Comprehensive Review of Current and Future Treatment Strategies. Cancer Metastasis Rev (2020) 39(4):1179–203. doi: 10.1007/s10555-020-09925-3
4. Yang L, Ying X, Liu S, Lyu G, Xu Z, Zhang X, et al. Gastric Cancer: Epidemiology, Risk Factors and Prevention Strategies. Chin J Cancer Res (2020) 32(6):695–704. doi: 10.21147/j.issn.1000-9604.2020.06.03
5. Li HR, Gao J, Jin C, Jiang JH, Ding JY. Downregulation of Setbp1 Promoted Non-Small Cell Lung Cancer Progression by Inducing Cellular Emt and Disordered Immune Status. Am J Transl Res (2020) 12(2):447–62.
6. Oakley K, Han Y, Vishwakarma BA, Chu S, Bhatia R, Gudmundsson KO, et al. Setbp1 Promotes the Self-Renewal of Murine Myeloid Progenitors Via Activation of Hoxa9 and Hoxa10. Blood (2012) 119(25):6099–108. doi: 10.1182/blood-2011-10-388710
7. Fan Z, Beresford PJ, Oh DY, Zhang D, Lieberman J. Tumor Suppressor Nm23-H1 Is a Granzyme a-Activated Dnase During Ctl-Mediated Apoptosis, and the Nucleosome Assembly Protein Set Is Its Inhibitor. Cell (2003) 112(5):659–72. doi: 10.1016/s0092-8674(03)00150-8
8. Li M, Makkinje A, Damuni Z. The Myeloid Leukemia-Associated Protein Set Is a Potent Inhibitor of Protein Phosphatase 2a. J Biol Chem (1996) 271(19):11059–62. doi: 10.1074/jbc.271.19.11059
9. Minakuchi M, Kakazu N, Gorrin-Rivas MJ, Abe T, Copeland TD, Ueda K, et al. Identification and Characterization of Seb, a Novel Protein That Binds to the Acute Undifferentiated Leukemia-Associated Protein Set. Eur J Biochem (2001) 268(5):1340–51. doi: 10.1046/j.1432-1327.2001.02000.x
10. Coccaro N, Tota G, Zagaria A, Anelli L, Specchia G, Albano F. Setbp1 Dysregulation in Congenital Disorders and Myeloid Neoplasms. Oncotarget (2017) 8(31):51920–35. doi: 10.18632/oncotarget.17231
11. Coe BP, Witherspoon K, Rosenfeld JA, van Bon BW, Vulto-van Silfhout AT, Bosco P, et al. Refining Analyses of Copy Number Variation Identifies Specific Genes Associated With Developmental Delay. Nat Genet (2014) 46(10):1063–71. doi: 10.1038/ng.3092
12. Chen LL, Zhang ZJ, Yi ZB, Li JJ. Microrna-211-5p Suppresses Tumour Cell Proliferation, Invasion, Migration and Metastasis in Triple-Negative Breast Cancer by Directly Targeting Setbp1. Br J Cancer (2017) 117(1):78–88. doi: 10.1038/bjc.2017.150
13. Banfi F, Rubio A, Zaghi M, Massimino L, Fagnocchi G, Bellini E, et al. Setbp1 Accumulation Induces P53 Inhibition and Genotoxic Stress in Neural Progenitors Underlying Neurodegeneration in Schinzel-Giedion Syndrome. Nat Commun (2021) 12(1):4050. doi: 10.1038/s41467-021-24391-3
14. Qiao HY, Zhang Q, Wang JM, Jiang JY, Huyan LY, Yan J, et al. Trim29 Regulates the Setbp1/Set/Pp2a Axis Via Transcription Factor Vezf1 to Promote Progression of Ovarian Cancer. Cancer Lett (2022) 529:85–99. doi: 10.1016/j.canlet.2021.12.029
15. Makishima H. Somatic Setbp1 Mutations in Myeloid Neoplasms. Int J Hematol (2017) 105(6):732–42. doi: 10.1007/s12185-017-2241-1
16. Yao XY, Zhou JD, Yang J, Zhang W, Ma JC, Wen XM, et al. Setbp1 Mutations in Chinese Patients With Acute Myeloid Leukemia and Myelodysplastic Syndrome. Pathol Res Pract (2018) 214(5):706–12. doi: 10.1016/j.prp.2018.03.010
17. Winkelmann N, Schafer V, Rinke J, Kaiser A, Ernst P, Scholl S, et al. Only Setbp1 Hotspot Mutations Are Associated With Refractory Disease in Myeloid Malignancies. J Cancer Res Clin Oncol (2017) 143(12):2511–9. doi: 10.1007/s00432-017-2518-z
18. Leonardi E, Bettella E, Pelizza MF, Aspromonte MC, Polli R, Boniver C, et al. Identification of Setbp1 Mutations by Gene Panel Sequencing in Individuals With Intellectual Disability or With “Developmental and Epileptic Encephalopathy”. Front Neurol (2020) 11:593446. doi: 10.3389/fneur.2020.593446
19. Carratt SA, Braun TP, Coblentz C, Schonrock Z, Callahan R, Smith BM, et al. Mutant Setbp1 Enhances Nras-Driven Mapk Pathway Activation to Promote Aggressive Leukemia. Leukemia (2021) 35(12):3594–9. doi: 10.1038/s41375-021-01278-2
20. Inoue D, Kitaura J, Matsui H, Hou HA, Chou WC, Nagamachi A, et al. Setbp1 Mutations Drive Leukemic Transformation in Asxl1-Mutated Mds. Leukemia (2015) 29(4):847–57. doi: 10.1038/leu.2014.301
21. Wang L, Du F, Zhang HM, Wang HX. Evaluation of a Father and Son With Atypical Chronic Myeloid Leukemia With Setbp1 Mutations and a Review of the Literature. Braz J Med Biol Res (2015) 48(7):583–7. doi: 10.1590/1414-431X20154557
22. Hou HA, Kuo YY, Tang JL, Chou WC, Yao M, Lai YJ, et al. Clinical Implications of the Setbp1 Mutation in Patients With Primary Myelodysplastic Syndrome and Its Stability During Disease Progression. Am J Hematol (2014) 89(2):181–6. doi: 10.1002/ajh.23611
23. Linder K, Iragavarapu C, Liu D. Setbp1 Mutations as a Biomarker for Myelodysplasia /Myeloproliferative Neoplasm Overlap Syndrome. biomark Res (2017) 5:33. doi: 10.1186/s40364-017-0113-8
24. Chen X, Li X, Hu X, Jiang F, Shen Y, Xu R, et al. Lum Expression and Its Prognostic Significance in Gastric Cancer. Front Oncol (2020) 10:605. doi: 10.3389/fonc.2020.00605
25. Li X, Chen X, Hu X, Shen Y, Xu R, Wu L, et al. Overexpression of Gucy1a2 Correlates With Poor Prognosis in Gastric Cancer Patients. Front Oncol (2021) 11:632172. doi: 10.3389/fonc.2021.632172
26. Acuna-Hidalgo R, Deriziotis P, Steehouwer M, Gilissen C, Graham SA, van Dam S, et al. Overlapping Setbp1 Gain-Of-Function Mutations in Schinzel-Giedion Syndrome and Hematologic Malignancies. PLoS Genet (2017) 13(3):e1006683. doi: 10.1371/journal.pgen.1006683
27. Torrejon B, Cristobal I, Carames C, Prieto-Potin I, Chamizo C, Santos A, et al. Analysis of Potential Alterations Affecting Setbp1 as a Novel Contributing Mechanism to Inhibit Pp2a in Colorectal Cancer Patients. World J Surg (2018) 42(11):3771–8. doi: 10.1007/s00268-018-4684-9
28. Zhang C, Zhang M, Ge S, Huang W, Lin X, Gao J, et al. Reduced M6a Modification Predicts Malignant Phenotypes and Augmented Wnt/Pi3k-Akt Signaling in Gastric Cancer. Cancer Med (2019) 8(10):4766–81. doi: 10.1002/cam4.2360
29. Li Q, Wu R, Wu F, Chen Q. Kmt2d Promotes Proliferation of Gastric Cancer Cells: Evidence From Ctdna Sequencing. J Clin Lab Anal (2021) 35(4):e23721. doi: 10.1002/jcla.23721
30. Cristobal I, Blanco FJ, Garcia-Orti L, Marcotegui N, Vicente C, Rifon J, et al. Setbp1 Overexpression Is a Novel Leukemogenic Mechanism That Predicts Adverse Outcome in Elderly Patients With Acute Myeloid Leukemia. Blood (2010) 115(3):615–25. doi: 10.1182/blood-2009-06-227363
31. Zhang YW, Zhang LR, Li R, Chang DW, Ye YQ, Minna JD, et al. Genetic Variations in Cancer-Related Significantly Mutated Genes and Lung Cancer Susceptibility. Ann Oncol (2017) 28(7):1625–30. doi: 10.1158/1538-7445.AM2017-1275
32. Du M, Thompson J, Fisher H, Zhang P, Huang CC, Wang L. Genomic Alterations of Plasma Cell-Free Dnas in Small Cell Lung Cancer and Their Clinical Relevance. Lung Cancer (2018) 120:113–21. doi: 10.1016/j.lungcan.2018.04.008
33. Li Y, Hu C. Prevalence and Prognosis of Synchronous Distant Metastatic Tonsil Squamous Cell Carcinomas. Int J Med Sci (2021) 18(2):528–33. doi: 10.7150/ijms.50966
34. Gong B, Li Y, Cheng Z, Wang P, Luo L, Huang H, et al. Grik3: A Novel Oncogenic Protein Related to Tumor Tnm Stage, Lymph Node Metastasis, and Poor Prognosis of Gc. Tumour Biol (2017) 39(6):1010428317704364. doi: 10.1177/1010428317704364
35. He J, Zhang N, Zhu Y, Jin R, Wu F. Msc Spheroids-Loaded Collagen Hydrogels Simultaneously Promote Neuronal Differentiation and Suppress Inflammatory Reaction Through Pi3k-Akt Signaling Pathway. Biomaterials (2021) 265:120448. doi: 10.1016/j.biomaterials.2020.120448
36. Berridge MJ. Inositol Trisphosphate and Calcium Signaling. Nature (1993) 361(6410):315–25. doi: 10.1038/361315a0
37. Mikoshiba K. Role of Ip3 Receptor Signaling in Cell Functions and Diseases. Adv Biol Regul (2015) 57:217–27. doi: 10.1016/j.jbior.2014.10.001
38. Berridge MJ. Inositol Trisphosphate and Calcium Signalling Mechanisms. Biochim Biophys Acta (2009) 1793(6):933–40. doi: 10.1016/j.bbamcr.2008.10.005
39. Xin P, Xu X, Deng C, Liu S, Wang Y, Zhou X, et al. The Role of Jak/Stat Signaling Pathway and Its Inhibitors in Diseases. Int Immunopharmacol (2020) 80:106210. doi: 10.1016/j.intimp.2020.106210
40. Bao Y, Wang L, Shi L, Yun F, Liu X, Chen Y, et al. Transcriptome Profiling Revealed Multiple Genes and Ecm-Receptor Interaction Pathways That May Be Associated With Breast Cancer. Cell Mol Biol Lett (2019) 24:38. doi: 10.1186/s11658-019-0162-0
41. Kim DP, Kus KJB, Ruiz E. Basal Cell Carcinoma Review. Hematol Oncol Clin North Am (2019) 33(1):13–24. doi: 10.1016/j.hoc.2018.09.004
42. Huang S. Mtor Signaling in Metabolism and Cancer. Cells (2020) 9(10):2278. doi: 10.3390/cells9102278
43. Duchartre Y, Kim YM, Kahn M. The Wnt Signaling Pathway in Cancer. Crit Rev Oncol Hematol (2016) 99:141–9. doi: 10.1016/j.critrevonc.2015.12.005
44. Zhao M, Hu J, Ni H, Jiang Z, Wang L. [Research Progress in Melanogenesis Signaling Pathway]. Sheng Wu Gong Cheng Xue Bao (2019) 35(9):1633–42. doi: 10.13345/j.cjb.190084
45. O'Sullivan LA, Liongue C, Lewis RS, Stephenson SEM, Ward AC. Cytokine Receptor Signaling Through the Jak-Stat-Socs Pathway in Disease. Mol Immunol (2007) 44(10):2497–506. doi: 10.1016/j.molimm.2006.11.025
46. Siddiqui A, Ceppi P. A Non-Proliferative Role of Pyrimidine Metabolism in Cancer. Mol Metab (2020) 35:100962. doi: 10.1016/j.molmet.2020.02.005
47. Ashton TM, McKenna WG, Kunz-Schughart LA, Higgins GS. Oxidative Phosphorylation as an Emerging Target in Cancer Therapy. Clin Cancer Res (2018) 24(11):2482–90. doi: 10.1158/1078-0432.CCR-17-3070
48. Chen JJ, Lin F, Qin ZH. The Roles of the Proteasome Pathway in Signal Transduction and Neurodegenerative Diseases. Neurosci Bull (2008) 24(3):183–94. doi: 10.1007/s12264-008-0183-6
49. Bachhawat AK, Yadav S. The Glutathione Cycle: Glutathione Metabolism Beyond the Gamma-Glutamyl Cycle. IUBMB Life (2018) 70(7):585–92. doi: 10.1002/iub.1756
50. Rubio Gomez MA, Ibba M. Aminoacyl-Trna Synthetases. RNA (2020) 26(8):910–36. doi: 10.1261/rna.071720.119
51. Lieu EL, Kelekar N, Bhalla P, Kim J. Fructose and Mannose in Inborn Errors of Metabolism and Cancer. Metabolites (2021) 11(8):479. doi: 10.3390/metabo11080479
52. Skarbek K, Milewska MJ. Biosynthetic and Synthetic Access to Amino Sugars. Carbohydr Res (2016) 434:44–71. doi: 10.1016/j.carres.2016.08.005
53. Mikkola S. Nucleotide Sugars in Chemistry and Biology. Molecules (2020), 25(23):5755. doi: 10.3390/molecules25235755
54. Ekundayo B, Bleichert F. Origins of DNA Replication. PLoS Genet (2019) 15(9):e1008320. doi: 10.1371/journal.pgen.1008320
55. Spivak G. Nucleotide Excision Repair in Humans. DNA Repair (Amst) (2015) 36:13–8. doi: 10.1016/j.dnarep.2015.09.003
56. Li Z, Pearlman AH, Hsieh P. DNA Mismatch Repair and the DNA Damage Response. DNA Repair (Amst) (2016) 38:94–101. doi: 10.1016/j.dnarep.2015.11.019
Keywords: gastric cancer, SETBP1, TCGA, GSEA, prognostic marker
Citation: Fang F, Liu C, Li Q, Xu R, Zhang T and Shen X (2022) The Role of SETBP1 in Gastric Cancer: Friend or Foe. Front. Oncol. 12:908943. doi: 10.3389/fonc.2022.908943
Received: 31 March 2022; Accepted: 20 June 2022;
Published: 11 July 2022.
Edited by:
Kenneth KW To, The Chinese University of Hong Kong, ChinaReviewed by:
Kristbjorn Orri Gudmundsson, National Cancer Institute at Frederick (NIH), United StatesXue Wanjiang, Affiliated Hospital of Nantong University, China
Copyright © 2022 Fang, Liu, Li, Xu, Zhang and Shen. This is an open-access article distributed under the terms of the Creative Commons Attribution License (CC BY). The use, distribution or reproduction in other forums is permitted, provided the original author(s) and the copyright owner(s) are credited and that the original publication in this journal is cited, in accordance with accepted academic practice. No use, distribution or reproduction is permitted which does not comply with these terms.
*Correspondence: Xiaobing Shen, xb.shen@seu.edu.cn