 Ping Du
 Lihong Liu*
- Department of Pharmacy, Research Unit, Beijing Chao-Yang Hospital, Capital Medical University, Beijing, China
Sotorasib is a novel targeted inhibitor of Kirsten rat sarcoma (KRAS) (G12C) that has shown exciting tumor-suppressing effects not only for single targeted agents but also for combination with immune checkpoint inhibitors. However, no integrative analysis of the pharmacokinetics (PK) and pharmacometabolomics (PM) of sotorasib has been reported to date. In the present study, a sensitive and robust high-performance liquid chromatography–tandem mass spectrometry (HPLC-MS/MS) method was firstly developed and fully validated for the quantitation of sotorasib in rat plasma. After one-step protein precipitation, sotorasib and an internal standard (carbamazepine) were separated on a Waters XBrige C18 column (50 mm × 2.1 mm, 3.5 μm) and analyzed in electrospray ionization positive ion (ESI+) mode. The optimized method was fully validated according to guidance and was successfully applied for the PK study of sotorasib at a dose of 10 mg/kg. In addition, a longitudinal and transversal PM was employed and correlated with PK using partial least squares model and Pearson’s analysis. With multivariate statistical analysis, the selected six (AUC model) and nine (Cmax model) metabolites completely distinguished the high- and low-exposure groups after sotorasib treatment, which indicates that these potential biomarkers can predict drug exposure or toxicity. The results of this study will not only shed light on how sotorasib disturbs the metabolic profiles and the relationship between PK and PM but also offer meaningful references for precision therapy in patients with the KRAS (G12C) mutation.
1 Introduction
Cancer, which has increased incidence and mortality rates, has become one of the chronic diseases that seriously endanger human health. According to the latest literature and statistics, there are 19.3 million new cancer cases worldwide and 10 million deaths in 2020 (1). Mutation in Kirsten rat sarcoma (KRAS) viral oncogene homolog, which can potentiate the tumor-promoting activity, is one of the most common carcinogenic events in endodermal cancer (2). In fact, KRAS mutations have been identified predominantly in lung (approximately 25% of cases), pancreatic (about 95% of case), and colorectal (approximately 35% of cases) cancers (3). In KRAS mutated tumors, 80% of the carcinogenic mutations occur in codon 12, and the most popular mutation sites are KRAS (G12D), KRAS (G12V), and KRAS (G12C) (4). The following characteristics of KRAS have led to many challenges in its druggability development: 1) KRAS binds to guanosine diphosphate (GDP) and guanosine triphosphate (GTP) with picomolar affinity, which seriously hinders the development of nucleotide competitive inhibitors, and 2) the KRAS protein lacks ideal small-molecule binding pockets, which makes it difficult to design high-affinity allosteric inhibitors (5). However, when KRAS (G12C) is in an inactive GDP-bound state, the structure-based optimization inhibitor is covalently bound to the mutant cysteine residue and holds a pocket in the switch II region (SIIP). Due to its excellent antitumor efficacy in preclinical analyses, sotorasib, a novel targeted inhibitor of KRAS (G12C), precisely blocks the KRAS (G12C) inactive GDP-bound state. Additionally, sotorasib has shown exciting tumor-suppressing effects not only for single targeted agents but also for combination with immune checkpoint inhibitors (6). At present, based on previous clinical trials (7–9), sotorasib has been approved by the US Food and Drug Administration (FDA) for the treatment of locally advanced/metastatic KRAS (G12C) solid tumors (10).
It is well known that comprehensive understanding of the pharmacokinetics (PK), pharmacodynamics (PD), and pharmacometabolomics (PM) is an indispensable element for further improving the risk–benefit ratio of patients. Despite the high-performance liquid chromatography–tandem mass spectrometry (HPLC-MS/MS) methods published by Madhyastha et al. (11) and Retmana et al. (12) for the quantification of sotorasib in mouse plasma and tissue homogenates, a wider linear range (1.08–5,040 and 2–2,000 ng/ml, respectively), a higher lower limit of quantitation (LLOQ; 1.08 and 2 ng/ml, respectively), and the laborious sample extraction (liquid–liquid extraction coupled with evaporation and three-step protein precipitation, respectively) will decrease the quantitative throughput and efficiency to some extent, especially for large preclinical and clinical sample sizes. Undoubtedly, the detection sensitivity of the reported method still has much room for improvement. However, as far as we know, no HPLC-MS/MS analysis or PK has been delivered for the rapid and robust quantitation of sotorasib in rat plasma. Therefore, taking into account the urgency of cancer therapy and the emerging need for preclinical and clinical blood concentrations/exposures or robust analytical methods, a reliable and reproducible HPLC-MS/MS assay was developed, validated, and successfully applied for the quantitation of sotorasib in rat plasma. The results may provide a significant mirror for future KRAS-targeted therapy, PK investigation, and therapeutic drug monitoring in preclinical or clinical studies/trials.
Metabolomics is one of the most powerful tools used to investigate the interaction between the genetic background and the exogenous and endogenous factors of human health (13). The concept of PM was firstly illustrated in a study which demonstrated that metabolomic information in drug-free urine samples is predictive of both drug metabolism and the toxicity of paracetamol (14). Indeed, PM can not only reveal the terminal metabolic profile by drug treatment but also reflect the metabolic status between tissues and fluids, which will be beneficial to understanding the biological mechanisms of diseases or drugs (15, 16). Unfortunately, to the best of our knowledge, no comprehensive metabolic profiling studies pertaining to sotorasib treatment both in vitro and in vivo, especially with regard to metabolite reprogramming/perturbation caused by drug treatment, have been reported.
In view of the shortcomings described above, the objective of this study was originally proposed as to longitudinally and transversally illustrate the metabolic fingerprint induced by sotorasib in rats using our previously reported HPLC-MS/MS method (17, 18). Furthermore, by means of several multivariate statistical analyses, an integrative analysis of PM and PK was employed in order to predict the metabolic phenotype and drug exposure. Overall, we will reveal the first in-depth interrogation of trajectory changes that benefit propitious understanding of how sotorasib interacts with small molecular metabolites. Moreover, several candidate predictive biomarkers were investigated and validated for drug response or toxicity. The results of this study will not only shed light on how sotorasib disturbs the metabolic profiles and the relationship between PK and PM but also offer meaningful references for precision therapy in patients with the KRAS (G12C) mutation.
2 Materials and Methods
2.1 Chemicals
Sotorasib (lot: DC2229802; purity, ≥98%) was purchased from DC Chemicals Company (Shanghai, China). The internal standard (IS) (carbamazepine; purity, ≥99%) was obtained from the National Institutes for Food and Drug Control (Beijing, China). All standards of metabolites and stable isotope-labeled internal standards (ILIS) were obtained from the following companies: Sigma-Aldrich (St. Louis, MO, USA), Cayman Chemical (Ann Arbor, MI, USA), Bidepharm (Shanghai, China), Steraloids (Newport, RI, USA), and Cambridge Isotope Laboratories (Andover, MA, USA) (Supplementary Table S1). Detailed information is provided in a previous work (18). Methanol (MeOH), acetonitrile (ACN), isopropanol (IPA), and formic acid were of high-performance liquid chromatography (HPLC) grade and were utilized to prepare stock or working solutions, mobile phases. Drug-free heparinized plasma was collected from healthy rats. Ultrapure water was produced using the Milli-Q reference water purification system.
2.2 Analytical Instruments and HPLC-MS/MS Conditions
For the PK study, a chromatographic system of Shimadzu LC-20ADXR (Kyoto, Japan) coupled with a mass spectrometer (QTRAP 5500; SCIEX, Concord, Canada) was utilized for chromatographic separation and mass quantitation (19). The column temperature was set to 40°C on a reversed-phase C18 column (50 mm × 2.1 mm i.d., 3.5 μm) (XBrige; Waters, Milford, MA, USA), and the total run time was 3.0 min. Both mobile phases contained 0.1% formic acid. Gradient elution was adopted to comply with the compounds’ baseline separation (0–0.1 min, 90% water phase; 0.1–1.2 min, 10% water phase; 1.2–2.2 min, 0% water phase; and 2.2–3.0 min, 90% water phase). The flow rate was fixed at 0.4 ml/min with an injection volume of 2 μl. A time-efficient washing procedure composed of MeOH/water/ACN/IPA (1:1:1:1, v/v/v/v) was applied during the entire analyses. Multiple reaction monitoring (MRM) was utilized with the following parameters: ion spray voltage, 5,500 V; temperature, 550°C; curtain gas, 20.0 psi; ion source, gas 1 at 55.0 psi; and turbo ion source, gas 2 at 55.0 psi. A proton adduct [M+H]+ ion and double MRM transitions were used, which were set at m/z 561.4→317.1 (qualifier) and m/z 561.4→134.1 (quantifier) for sotorasib and at 237.0→194.1 for the IS.
For metabolic profiling analysis, the HPLC-MS/MS system (Spark Holland; API 5500, SCIEX, Concord, Canada) was adopted for targeted metabolomic analysis. The chromatography columns (Waters BEH, HSS T3) and elution solvent (gradient elution) were all evaluated and employed according to our previous study (18). The column temperature was set at 20°C with an injection volume of 5 μl. The water and organic phases (ACN/IPA = 7:2, v/v) contained 0.1% formic acid, and gradient elution was achieved within 27 min. The detailed optimized MRM parameters are shown in Supplementary Table S1 and in a previous study (18).
2.3 Stock and Working Solutions, Calibration Standards, and Quality Control Samples
Stock solutions of sotorasib and IS were equipped using ACN at a concentration of 1.0 mg/ml and further diluted for the calibration standards and quality control (QC) samples at a final concentration of 500 µg/ml separately. The working IS solution was prepared in MeOH at a concentration of 10 ng/ml. The working calibration solutions of sotorasib were completed in dilution (MeOH/water = 1:1, v/v) to obtain concentrations of 5, 10, 20, 50, 100, 100, 200, 500, 1,000, 2,000, and 5,000 ng/ml. Similarly, the QC working solutions of analytes were prepared to obtain final concentrations of 10, 200, and 4,000 ng/ml. All solutions were stored in a −80°C freezer pending analysis. For the PK study, calibrations were made in blank rat plasma to achieve a nominal concentration range of 0.5–500 ng/ml. QC plasma samples were prepared in blank rat plasma at nominal concentrations of 1, 20, and 400 ng/ml.
Additionally, pooled standard solutions of all metabolites and ILIS were prepared for the calibration curve (0.2–5,000 ng/ml) in this PM study. To ensure reliable quantitation of all analytes and better comparability in routine analysis, plasma QC samples were produced by mixing equal volumes of unknown plasma from all the unknown plasma samples. Briefly, six aliquots of pooled QCs were constructed as actual and interpolated the analytical sequence to test the status of the HPLC-MS/MS system.
2.4 Sample Preparation
During the PK study, all unknown plasma samples were mixed for 1 min and 20 μl aliquot of plasma was pipetted into an Eppendorf centrifuge tube. Protein precipitation was adopted for the preparation of the sample. After the addition of 10 μl IS working solution (10 ng/ml) and 80 μl MeOH, proteins were extracted by vortex mixing for approximately 30 s. The supernatant was centrifuged at 13,500 rpm for 10 min at 4°C. The extraction solutions were then pipetted into autosampler vials.
For the analysis of the metabolic characteristics, a one-step protein precipitation method was also employed. Briefly, an aliquot of 50 μl plasma was added with 10 μl IS mixture (eight ISs, 400 ng/ml) and 140 μl precipitation solution (−20°C methanol). Afterward, the mixture was vortexed for 2 min and centrifuged (13,500 rpm, 10 min at 4°C). The upper solutions were injected into the HPLC-MS/MS system for analysis.
2.5 Bioanalytical Method Validation for Pharmacokinetics
Validation of the biological method was executed in line with the guidelines issued by the FDA (20) and the Chinese Pharmacopeia (version 2015) (21).
To evaluate the specificity and selectivity, six individual heparin-anticoagulated rat plasma samples were processed. Each sample was prepared as double blank (neither analytes nor IS), blank (only IS), LLOQ, and unknown rat plasma. The chromatographic integrity and possible disturbance were compared.
Sensitivity analysis was carried out in the form of LLOQ, which is the lowest concentration with accuracy and precision of less than or equal to ±20% and a signal-to-noise (S/N) ratio higher than 5:1. To evaluate the carryover, three consecutive double-blank samples were injected following the upper limit of quantification (ULOQ) standard.
With regard to the intra- and inter-accuracy and precision, the LLOQ (0.5 ng/ml), low QC (LQC, 1 ng/ml), medium QC (MQC, 20 ng/ml), and high QC (HQC, 400 ng/ml) were set and assessed (n = 6). Calibration standard weighted linear regression (1/x2) was carried out in duplicate. The calibration curves were defined by the ratio of the peak area of the analyte (sotorasib) and IS (19).
The recovery of sotorasib and IS was investigated by comparing the peak areas of each sotorasib and IS at three QC levels, where plasma was added with the analyte before and after the extraction (19).
Matrix effect (ME) was evaluated at QC levels in six replicates by comparing their responses to those of the reference solutions without the presence of any matrix at QC levels. The corresponding peak area ratios of the analyte to IS in spiked plasma post-extraction (A) were then compared with those of the water-substituted samples (B) at equivalent concentrations. This ratio (A/B × 100) is defined as ME. The MEs of IS were determined in a similar manner. The criterion for the acceptability of the data was the inter-subject variability range within 15% (19).
Stability was investigated at LQC and HQC concentrations in six replicates. The stability conditions incorporated the short-term (at ambient temperature for 24 h), freeze–thaw (−80°C to ambient temperature, three sequential cycles), post-preparation (autosampler, 24 h), and long-term (−80°C for 3 months) status. If the %Bias is within ±15%, the stability is considered acceptable.
2.6 Pharmacokinetic Study and Incurred Sample Reanalysis
Six Sprague–Dawley rats (180–220 g, 8-week-old males; animal license: SCXK-2019-0008) were purchased from Beijing Vital River Laboratory Animal Technologies Co., Ltd. (Beijing, China). All rats were fed in a specific pathogen-free (SPF) conditioned room to allow acclimatization for 1 week. Animal experiments were implemented in line with the Guidelines for the Care and Use of Laboratory Animals, and animal ethics was approved by Beijing Chao-Yang Hospital, Capital Medical University. Rats were orally administered sotorasib dissolved with 1% Tween-80 and 2% hydroxypropyl methylcellulose (HPMC) in water at a dose of 10 mg/kg. Biological samples (approximately 500 μl) were collected from ophthalmic veins into heparin-anticoagulated collection tubes before administration and at 15 min, 30 min, and 1, 1.5, 2, 2.5, 3, 4, and 8 h after administration. Plasma samples were acquired by direct centrifugation at 3,500 rpm for 10 min at 4°C.
Incurred sample reanalysis (ISR) was carried out to critically support reliable determination using the HPLC-MS/MS method. Twelve incurred samples, which were from around Cmax (maximum concentration) and in the elimination phase, were reanalyzed in separate batches. As for the acceptance criteria, the concentrations of the initial quantitation and reanalysis should be ≤20% of the mean values for at least two of the three repeats (20, 22).
2.7 Uncertainty of Measurement
It is noted that uncertainty of measurement (UM) is a meaningful indicator of robust and reliable quantitation (23). The bottom-up approach was utilized to evaluate the measurement uncertainty according to previous literature (23, 24). Both standard uncertainty and expanded uncertainty (k = 2, 95% confidence limits) were evaluated in light of the Guide to the Expression of Uncertainty in Measurement. The procedures for estimating measurement uncertainty require that the analysis process be traceable, determine the performance characteristics of the equipment, and determine the source and impact of the uncertainty. Several sources of uncertainty, such as volumetric operations, weighting, multiple-point calibration (linear regression), and recovery, were considered in the present work. Samples at a concentration of 20 ng/ml (n = 18) were analyzed to evaluate the measurement uncertainty of the HPLC-MS/MS method (22).
2.8 Pharmacometabolomics of Sotorasib
A total of 289 metabolites, which contained amino acids, bile acids, and vitamins, were included in the metabolomics method being considered. All biologically active metabolites can be quantitated within 27 min. The calculation linearity ranged from 0.2 to 5,000 ng/ml, which provided powerful capability for the successful quantitation of low-abundance compounds. For the longitudinal PM of sotorasib, the same plasma samples were utilized before (0 h, pre-dose) and after administration (post-dose, until 8 h). For the transversal PM, raw metabolomic data were divided into two parts: before (pre-dose) and after (post-dose) administration. The metabolomic profiling and trajectory effects of sotorasib were investigated and analyzed using multiple variable statistical analysis methods.
2.9 Multivariate Statistical Analysis and Data Processing
Raw data files were processed and checked using Analyst 1.6.3 and MultiQuant 3.0.1 (SCIEX, Concord, Canada). The concentrations of the analytes were calculated according to the calibration curve. Pharmacokinetic parameters, such as Cmax and the area under the curve (AUC), were calculated using Phoenix WinNonLin software (Pharsight 8.3, Mountain View, CA, USA). Pearson’s correlation was employed to investigate the correlation between the metabolomic data and PK parameters using IBM SPSS 26.0 (Armonk, NY, USA). SIMCA-P software (v14.1; Umetric, Umeå, Sweden) was employed to build mathematical models, including unsupervised principal component analysis (PCA), supervised orthogonal projection to latent structures discriminant analysis (OPLS-DA), and partial least squares (PLS). Compounds with values of variable importance in the projections (VIP) >1 and statistical significance of p < 0.05 were selected for further identification and metabolic pathway analysis. One hundred or 200 random permutation tests were employed to examine overfitting and random effects, which can assess the predictive ability of the model. Meanwhile, significant variables with p < 0.05 and fold change (FC) >2 or <0.5 were considered potential biomarkers. Pathway analysis was achieved using online MetaboAnaylst 5.0 (http://www.metaboanalyst.ca). A p-value less than 0.05 was considered statistically significant.
3 Results
3.1 Method Development for the Quantitation of Sotorasib
To optimize the mass spectrometric conditions, an injection pump was utilized to obtain the highest response of any analytes. Qualified and quantitative detection was performed using ESI+ and MRM. The product ion fragmentations are shown in Figure 1A. The most abundant and better separated product ions were identified for determination. Finally, baseline separation can be carried out, with retention times of 1.46 and 1.58 min for sotorasib and IS, respectively (Figure 1B).
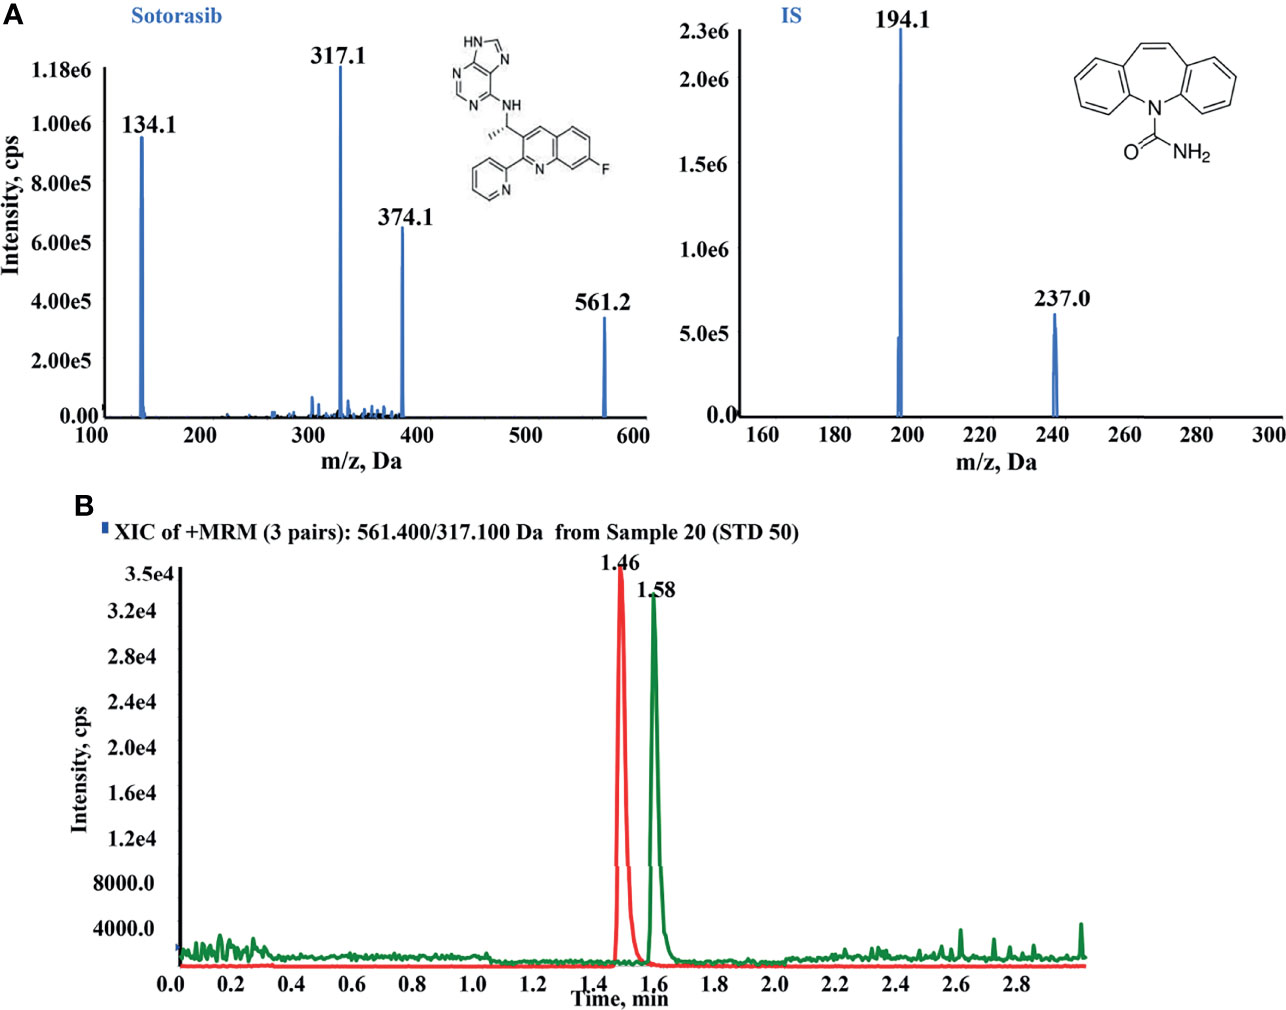
Figure 1 High-performance liquid chromatography–tandem mass spectrometry (HPLC-MS/MS) conditions for the quantitation of sotorasib. (A) Product ion mass spectra and chromatogram of sotorasib and the internal standard (IS; carbamazepine) in ESI+ mode. (B) Typical chromatogram of sotorasib (1.46 min) and IS (1.58 min) at the indicated retention times.
3.2 Method Validation for the Quantitation of Sotorasib
3.2.1 Selectivity and Specificity
The selectivity and specificity results are an important assurance of the performance quality of the HPLC-MS/MS method. As shown in Figure 2, no interference peak was found under the present HPLC-MS/MS conditions at the indicated retention times, demonstrating the better selectivity and specificity of the employed method.
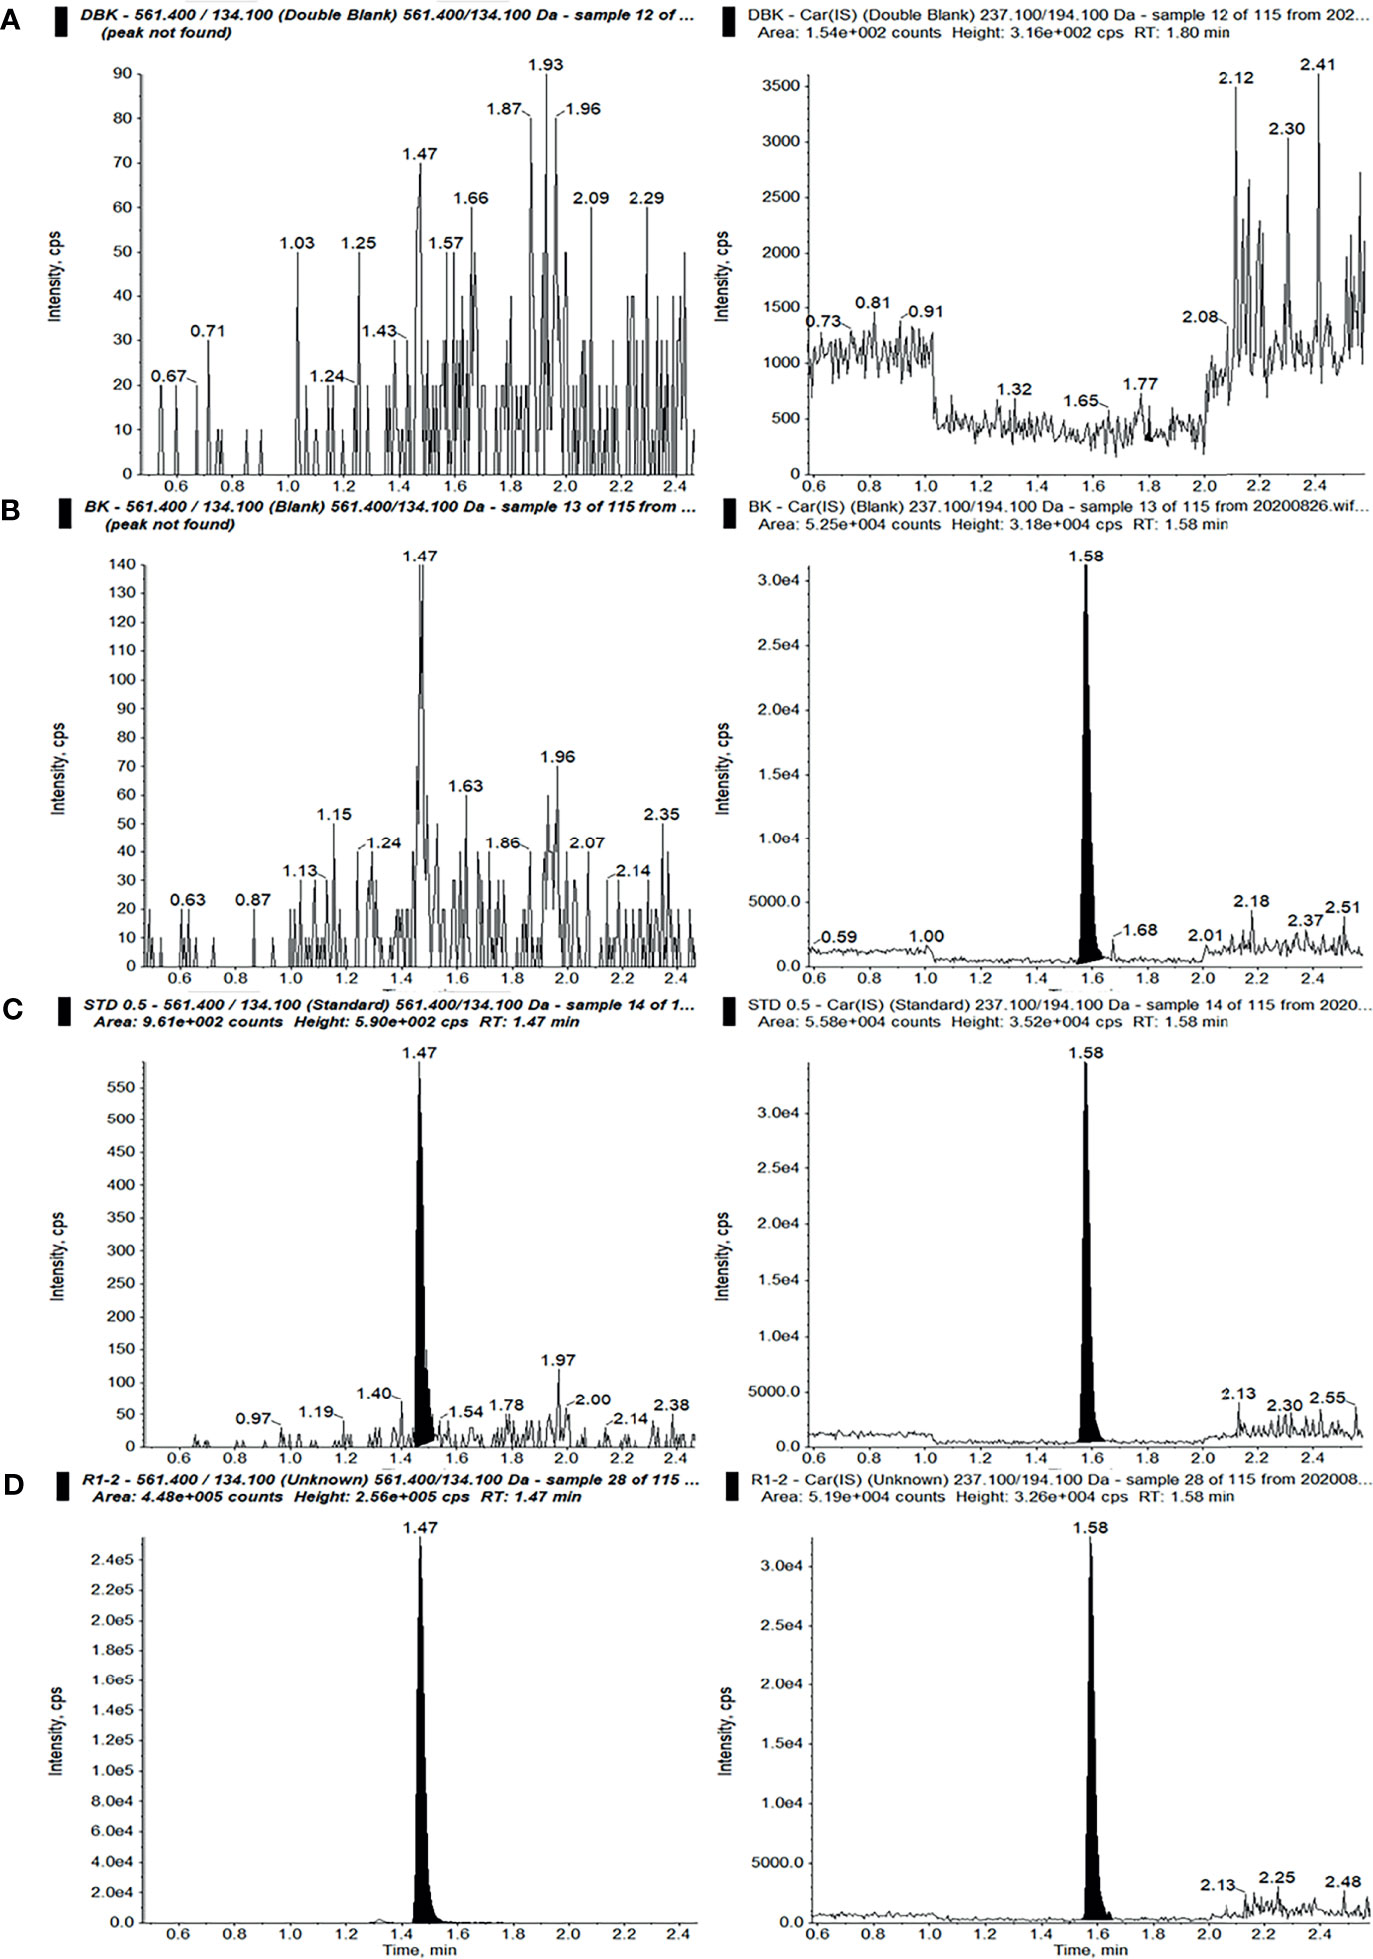
Figure 2 Ion chromatograms of sotorasib (left) and the internal standard (IS) (right) in double-blank plasma without analyte and IS (A), blank plasma with IS (B), blank plasma with sotorasib at the lower limit of quantitation (LLOQ) with IS (C), and an unknown sample after administration of a 10-mg/kg dose of sotorasib (D) (298.36 ng/ml, 15 min after administration).
3.2.2 Accuracy, Precision, Carryover, and Linearity
The accuracy and precision results (Table 1) indicated that a LLOQ of 0.5 ng/ml could meet the requirements of the test. Also, the limit of detection of sotorasib was 0.5 ng/ml at an S/N ratio ≥3. As listed in Table 1, the intra- and inter-day accuracy and precision values were all less than or equal to ±4.42% and 9.42%, respectively.
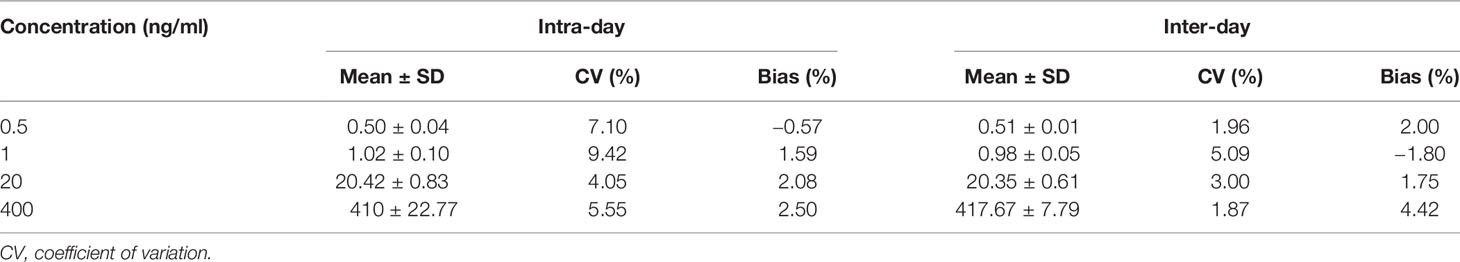
Table 1 Intra- and inter-day accuracy and precision of the HPLC-MS/MS method in rat plasma (n = 6).
During the validation procedure, carryover was evaluated. Finally, a washing/rinsing solution of MeOH/water (1:1, v/v) was selected to overcome carryover, and suitable accuracy and quantitative determination was achieved. No carryover was observed under the present conditions. A calibration curve was obtained within the range of 0.5–500 ng/ml with a correlation coefficient (r) of more than 0.990.
3.2.3 Recovery, Matrix Effect, and Stability
Protein precipitation (PPT) is a common, high-throughput, and energy-efficient method for sample extraction. After step-by-step validation, a simple one-step PPT using an aliquot of 20 µl plasma was used for sample preparation. As shown in Table 2, the recovery results demonstrated that the mean recovery of sotorasib was consistently within the range of 78.20%–84.80% and with a CV of ≤6.54%. The range of the IS-normalized matrix effects was 123.35%–124.83%, with a CV of <0.10%, which proved the consistent matrix enhancement, to some extent. Besides, the accuracy/precision results also indicated that the PPT procedure could satisfy the requirements for the quantitative determination of sotorasib (Table 1).
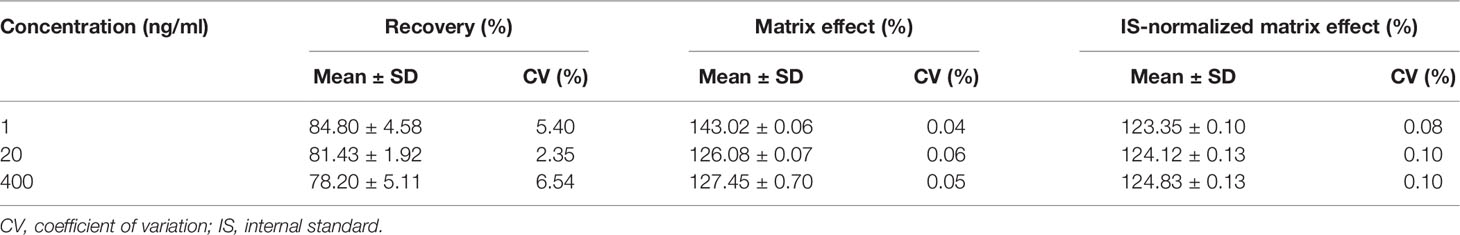
Table 2 Recovery and matrix effects of sotorasib (n = 6).
Regarding stability, the results for the low and high QC samples are presented in Table 3. The bias and CV values were all within ±15%. Sotorasib was stable under several storage conditions in plasma or in solution, such as at ambient temperature for 6 h, freeze–thaw procedures for three cycles, post-preparation in the autosampler for 24 h, working solution at −80°C for 10 days, and long-term stability at −80°C for 3 months. Overall, the present stability results were consistent with those in previous studies (11, 12).
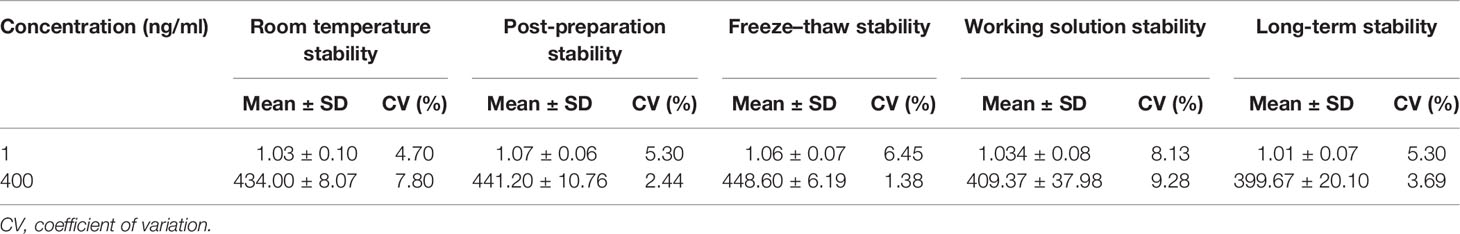
Table 3 Stability of sotorasib under different storage conditions (n = 6).
3.3 Uncertainty of Measurement
The results in Figures 3A, B showed that uncertainty of determination could be attributed to the uncertainty of repeatability, sample weighting, solution preparation, sample extraction and recovery, the HPLC-MS/MS system, and the calibration curve. The largest uncertainty at a concentration of 20 ng/ml was from recovery. The final expression of measurement uncertainty at a concentration of 20 ng/ml was 20.42 ± 8.06 ng/ml (mean value ± expanded uncertainty) for sotorasib with a coverage factor value of k = 2 (95% confidence limits). Taken together, when preparing sample extraction, attention should be paid to the state of plasma, the setting of the calibration range, and pretreatment of the biological sample to minimize its impact on the uncertainty (22).
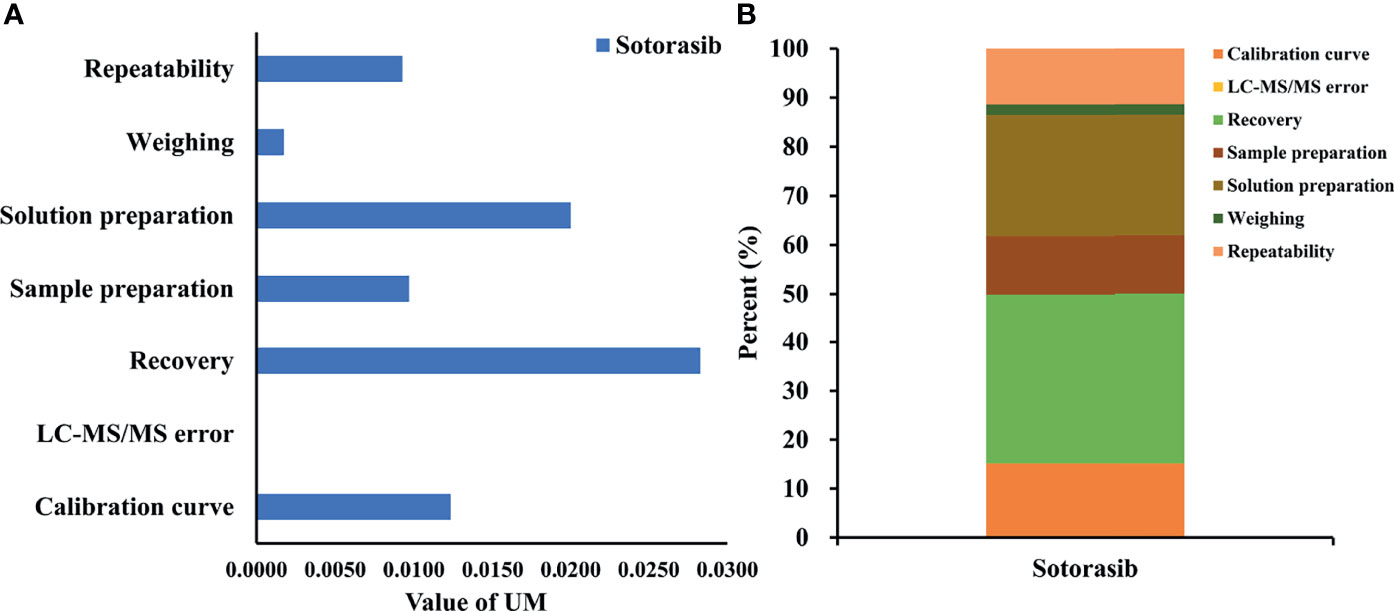
Figure 3 Uncertainty of measurement and proportion for determining sotorasib at a concentration of 20 ng/ml. (A) Statistical histogram of the uncertainty components. (B) The percentage of each element in the uncertainty components.
3.4 Pharmacokinetics and Incurred Sample Reanalysis
After oral administration, sotorasib was rapidly metabolized. Figure 4 describes the individual concentration–time profiles and the ISR. The summarized PK parameters are listed in Table 4. The results of PK were almost consistent with those of other reported studies at similar doses (11, 12).
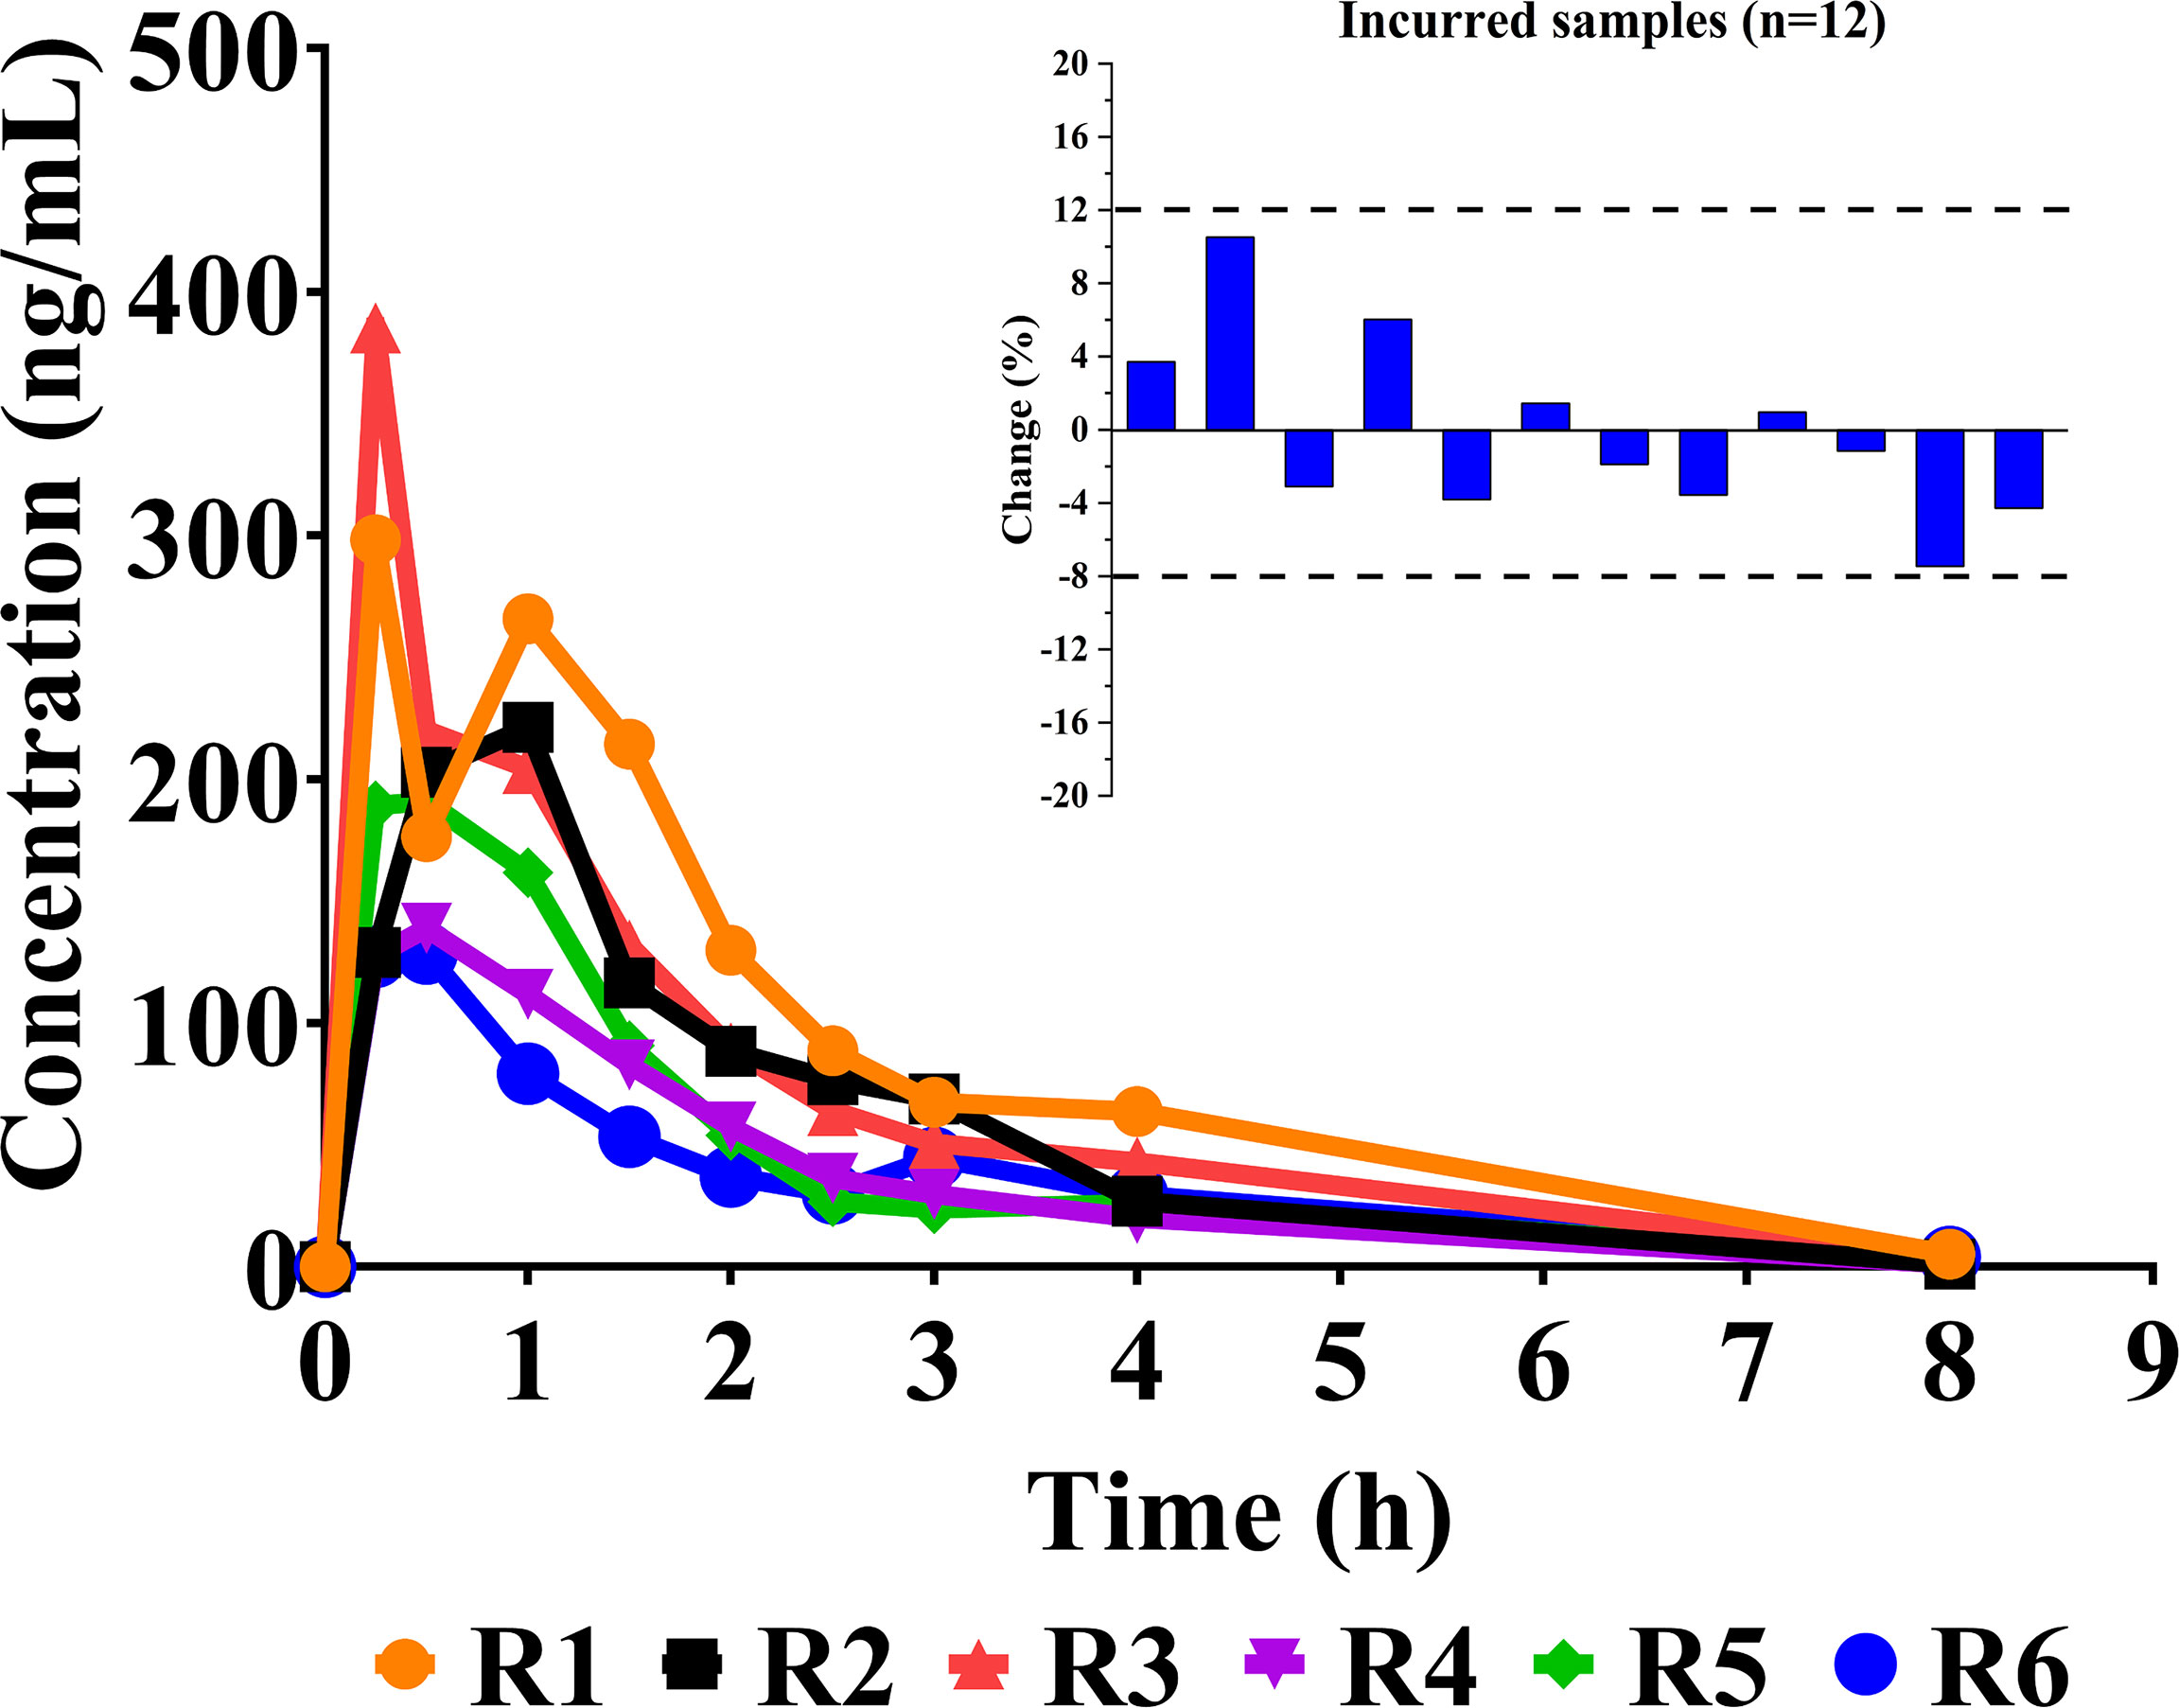
Figure 4 Individual concentration–time curves of sotorasib in rats after its oral administration at a dose of 10 mg/kg (n = 6). Also shown is a graphical representation of the results of incurred sample reanalysis (ISR).
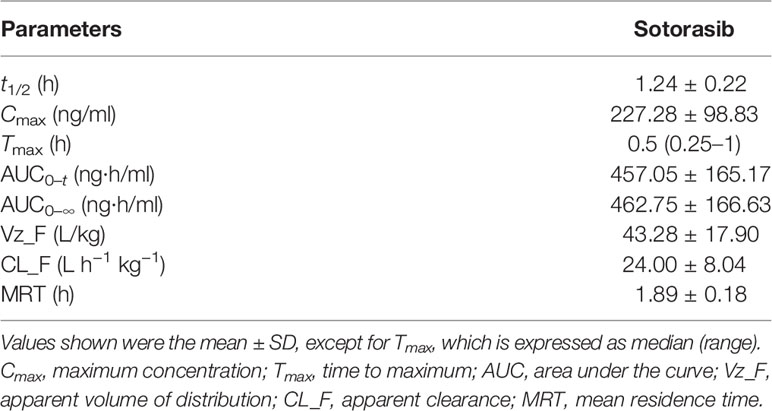
Table 4 Pharmacokinetic parameters of sotorasib in rats (n = 6).
3.5 Longitudinal and Transversal Metabolomics of Sotorasib
As shown in Figure 5A, the logitudinal metabolic characteristics of sotorasib were clustered according to the sampling time points, and the metabolic fingerprint at 8 h was different from those of others using the no-overfitting OPLS-DA model (R2 = 0.126, Q2 = −0.29) (Figure 5B). The metabolites with VIP > 1 are listed in Supplementary Figure S1. Meanwhile, a correlation analysis was also employed for all logitudinal metabolic data (Figure 5C), and the results of heatmap clustering of the changed metabolites indicated that the disturbance at the 8-h time point was visibly different (Figure 5D).
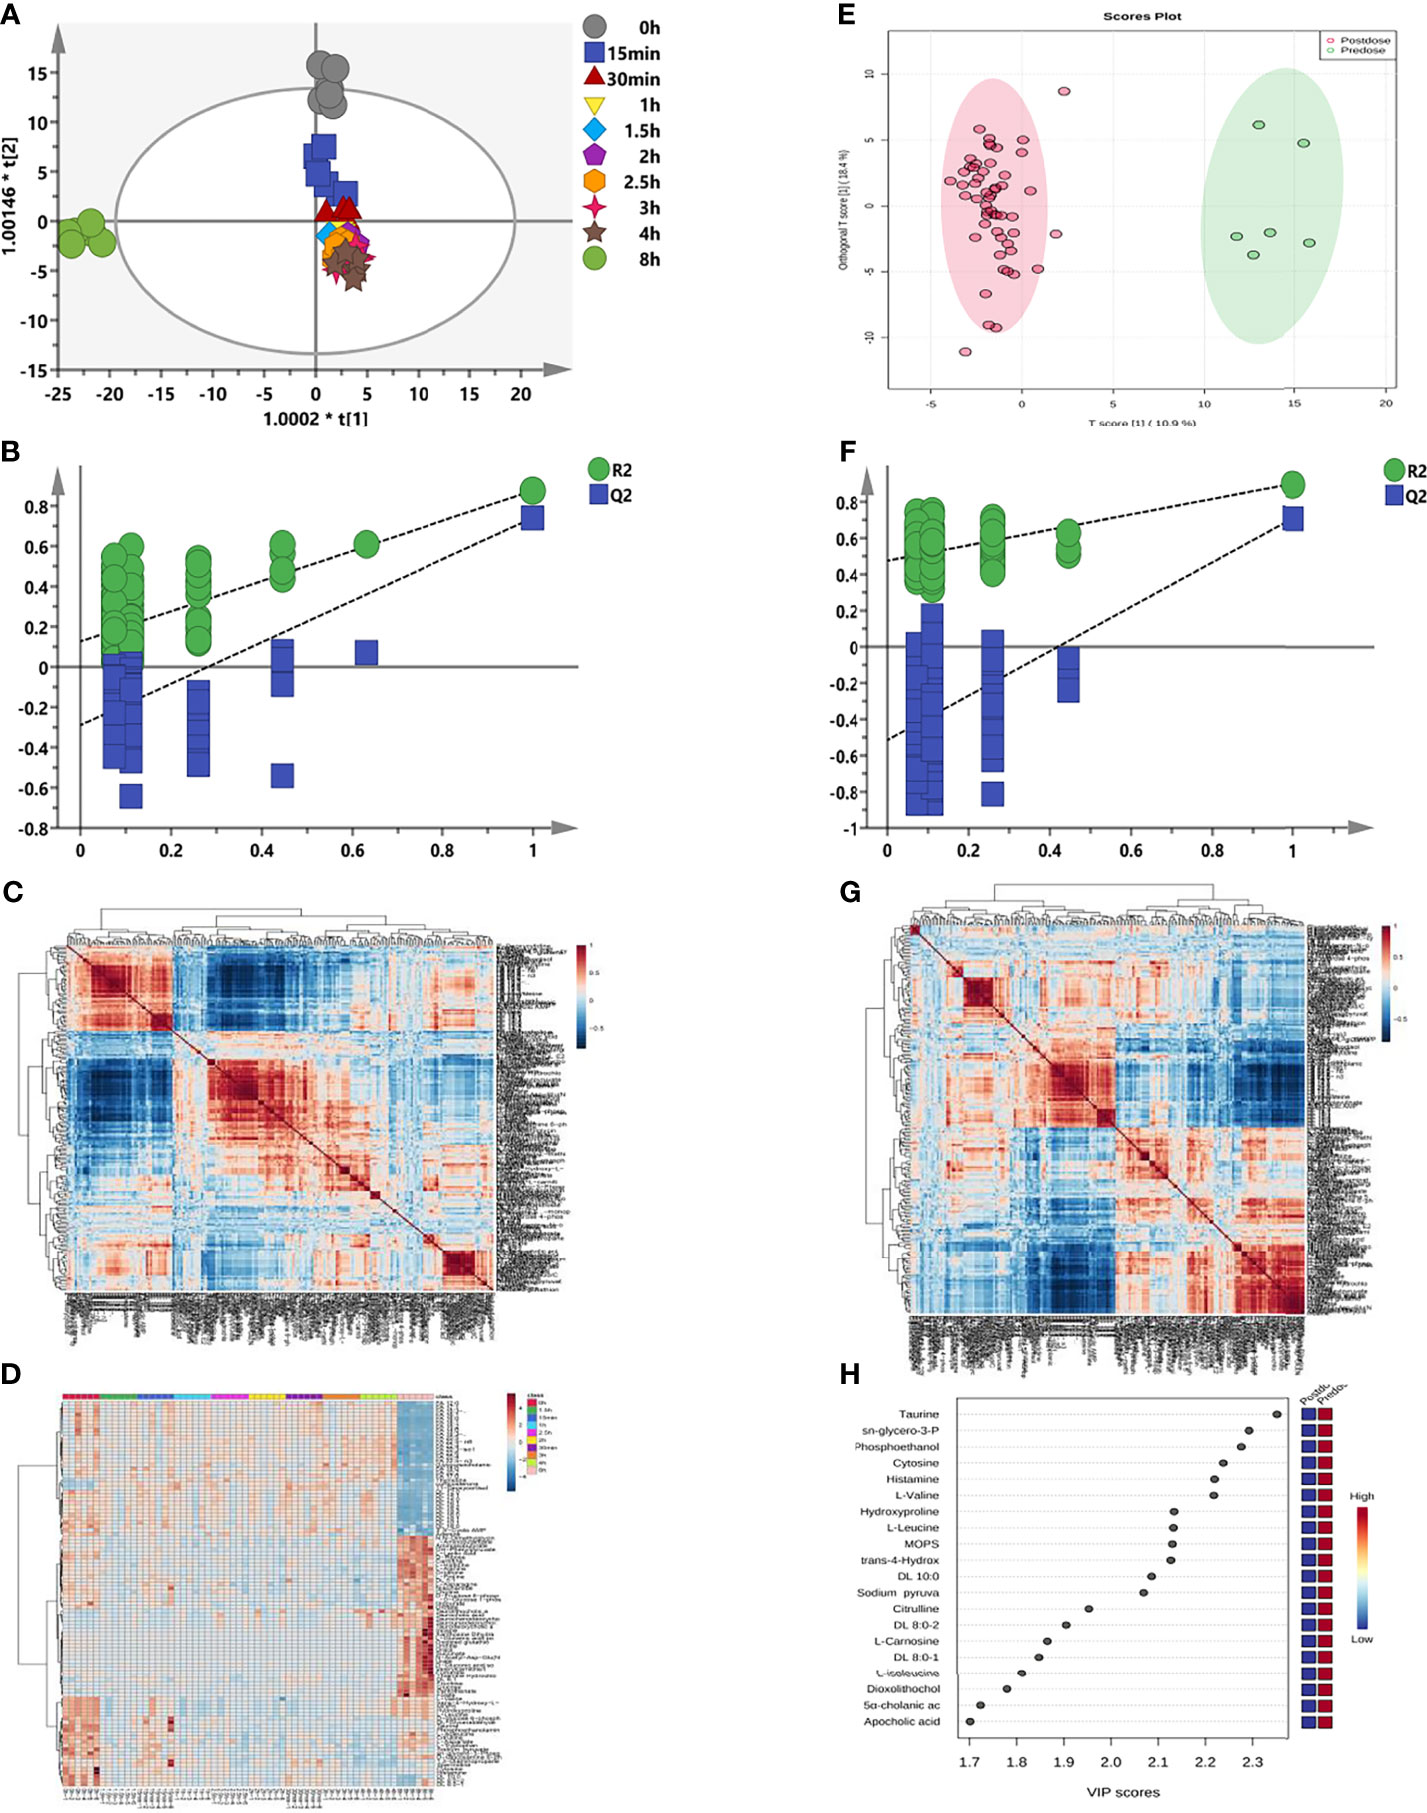
Figure 5 Longitudinal and transversal metabolic profiles of sotorasib. (A) Longitudinal orthogonal projection to latent structures discriminant analysis (OPLS-DA) score plot according to the different time points. (B) Random permutation test with 200 iterations from (A) for longitudinal metabolomics. (C) Longitudinal hierarchical cluster analysis (HCA) of the metabolite–metabolite correlations in response to sotorasib treatment. (D) Longitudinal heatmap clustering of the changed metabolites. (E) Transversal OPLS-DA plot. (F) Transversal permutation test with 200 iterations. (G) Transversal HCA correlation analysis before and after sotorasib treatment. (H) Transversal metabolomics for variable importance in the projections (VIP) values of the top 20 metabolites due to sotorasib treatment.
Subsequently, comparison of the metabolic differences before and after sotorasib treatment (Figure 5E) demonstrated distinct segregation of all metabolites with the no-overfitting OPLS-DA model (R2 = 0.475, Q2 = −0.515) (Figure 5F). In addition, the hierarchical cluster correlation analysis showed that all metabolites presented obvious correlations due to sotorasib treatment (Figure 5G). Afterwards, calculation of the variable importance of the model (VIP) determined 20 metabolites with the highest VIP values (displayed in Figure 5H), such as amino acids (e.g., taurine, L-valine, and L-leucine) and carnitines (e.g., DL 10:0, DL 8:0-1, and DL 8:0-2).
Considering the metabolic disturbance due to drug treatment, we further evaluated the transversal trajectories displayed in Figure 6. The results of the receiver operating characteristic (ROC) curve analysis demonstrated a total of 30 metabolites with AUC > 0.9 (listed in Figure 6A), which means that these potential biomarkers may be used for further investigation. After importing the raw data, 67 significantly changed metabolites were found between pre- and post-dose (Supplementary Table S2), and 19 metabolic pathways were disturbed, with the most significant pathway being taurine and hypotaurine metabolism (impact = 0.42857, p < 0.05) (Figure 6B and Supplementary Table S3). The volcano map of the FC results showed that a total of six metabolites were upregulated and 11 metabolites were downregulated after dosing (Figure 6C). Detailed information on the upregulated and downregulated metabolites is shown in Figures 6D, E. A reliable QC is indispensable for metabolomics. The PCA charts of the QC and unknown samples are shown in Supplementary Figure S2.
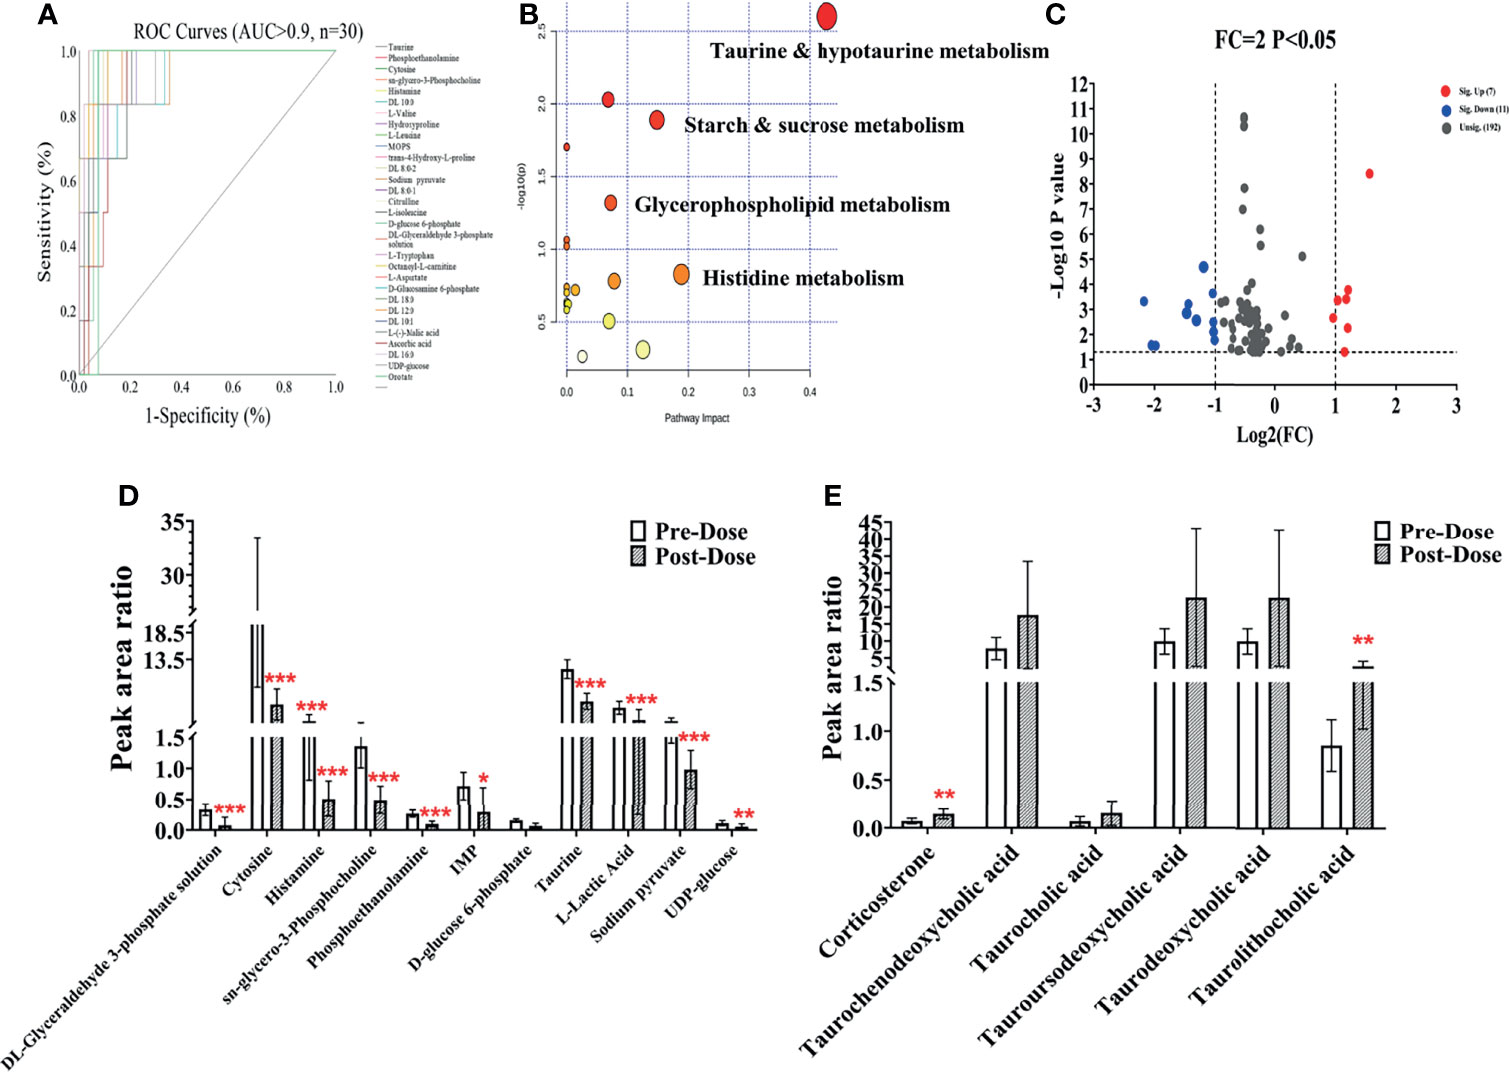
Figure 6 Metabolic changes after sotorasib treatment. (A) Receiver operating characteristic (ROC) curves of the metabolites administered sotorasib (AUC > 0.9, n = 30). (B) Overview of the pathway enrichment analysis of the altered metabolites between pre- and post-doses. (C) Volcano map of the metabolites with variable importance in the projections (VIP) >1 and fold change (FC) values >2 and <0.5 (p < 0.05). (D, E) Downregulated (n = 11) (D) and upregulated (n = 6) (E) metabolites compared with the pre-dose group. *p < 0.05; **p < 0.01; ***p < 0.001.
3.6 Correlation Analysis Between Metabolomics and Pharmacokinetics
For systemic investigation of the novel KRAS inhibitor of sotorasib, a modeled correlation analysis was performed using the PLS model. After examining the raw data, the metabolites clustered tightly in the PCA (Supplementary Figure S3). In the initial model, the two key PK parameters—AUC and Cmax—were adopted because of their predictive value for drug efficacy or toxicity (25). Thus, analysis of X (the predictive variable of 208 metabolic peak areas)–Y (the response variable of AUC or Cmax) was employed and modeled. A two-component PLS model was adopted to obtain a visible positive linear regression (R2 = 0.9898 and R2 = 0.9919) (Figures 7A, C, respectively). As described in this loading plot (Figures 7B, D), the X variable on the top right or lower left corner represents positive or negative correlation to the AUC or Cmax, respectively. Moreover, a total of 73 (AUC) and 82 (Cmax) VIP > 1.0 X variables were recognized in view of the contribution of these variables to the PLS model (red triangles), which were chosen for subsequent prediction of the AUC and Cmax, respectively.
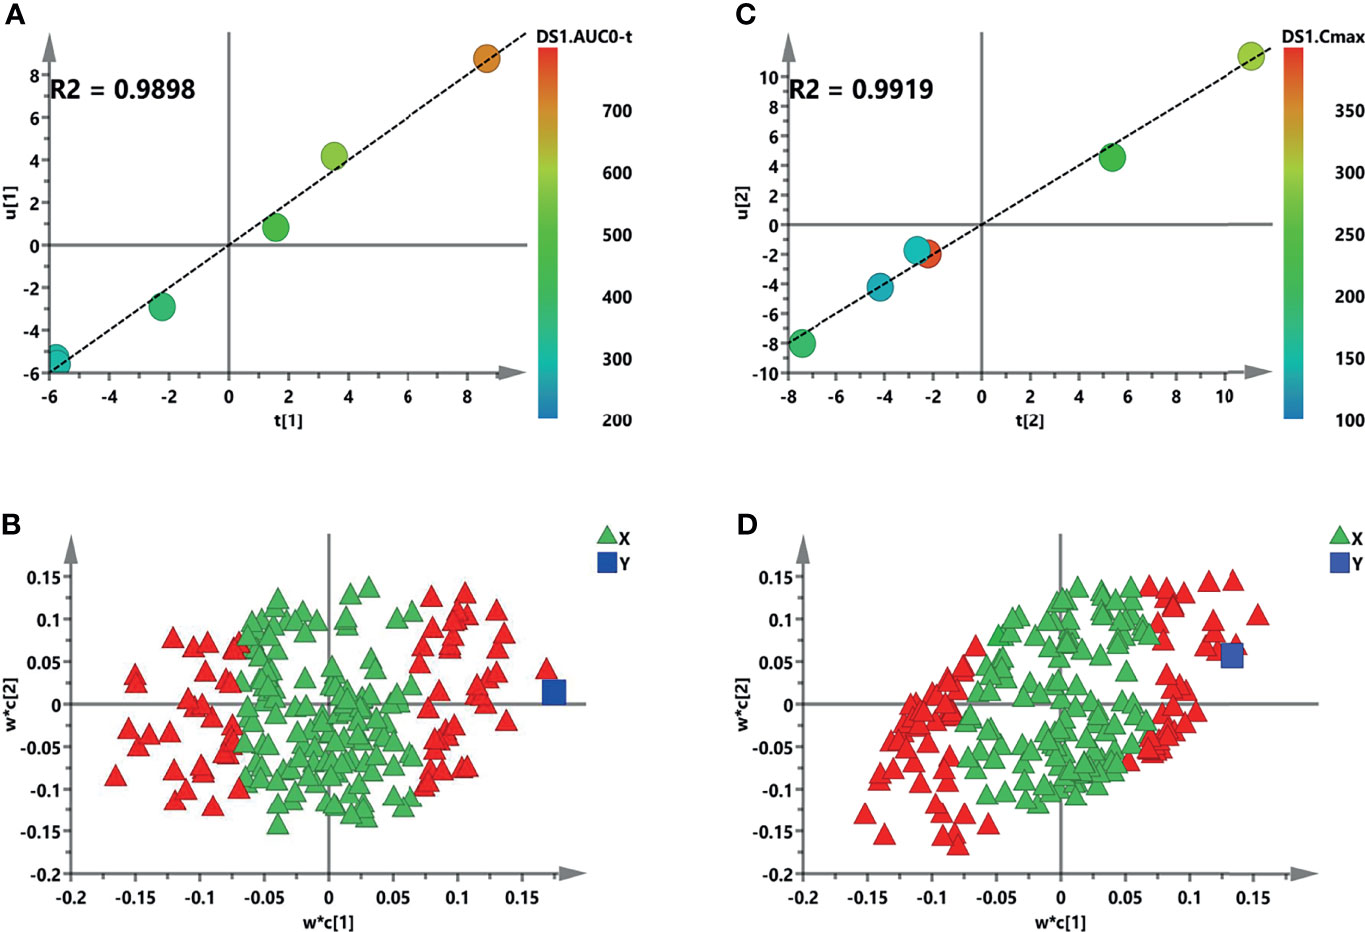
Figure 7 Initial partial least squares (PLS) models of the pre-dose metabolic profiles for predicting the pharmacokinetic (PK) parameters of sotorasib. (A, B) Score plots for the first latent variable of the AUC0–t and Cmax prediction models, respectively. Each dot represents a rat, plotted as the first latent variable (X block) vs. the AUC or Cmax (Y block). Color from blue to red represents the response variable from low to high. (C, D) Loading plots for the AUC and Cmax prediction models, respectively. The blue box represents the response variable. Each triangle represents a metabolite, and the triangles in red represent the metabolites with variable importance in the projections (VIP) >1.0.
3.7 Prediction of AUC and Cmax Based on Significant Metabolites
The individual PK profiles and key parameters are illustrated in Supplementary Figure S4. The FC values were 2.99 and 2.41 times. Pearson’s correlation analysis was used for the association between the PK parameters and VIP > 1.0 variables. Regarding the predictive model, six and nine VIP > 1.0 screened variables were significantly correlated with the AUC and Cmax, respectively (Table 5). Moreover, three common metabolites, namely, N,N-dimethylglycine, adenine, and OH-phenylpyruvate, were found in both predictive models. As illustrated in Figure 8A, a refined PLS model was constructed based on previous variables, which helped explain about 99.3% variation (R2Y) and predict 97.9% variation (Q2) for AUC. Simultaneously, as shown in Figure 8C, it could explain about 97.95% variation (R2Y) and predict 88.1% variation (Q2) in Cmax. The variables listed in Table 5 were considered potential biomarkers for predicting the AUC or Cmax. To validate the predictive ability of the above screened potential biomarkers, the rats were divided into a high-value and a low-value group according to their AUC and Cmax. Discrimination based on the screened biomarkers was performed using OPLS-DA models. As described in Figure 8B (R2X = 0.876, R2Y = 0.907, Q2 = 0.624) and Figure 8D (R2X = 0.988, R2Y = 0.974, Q2 = 0.796), the selected six (AUC model) and nine (Cmax model) metabolites completely distinguished the high- and low-value groups, which indicates that these potential biomarkers can potentially predict drug response or toxicity.
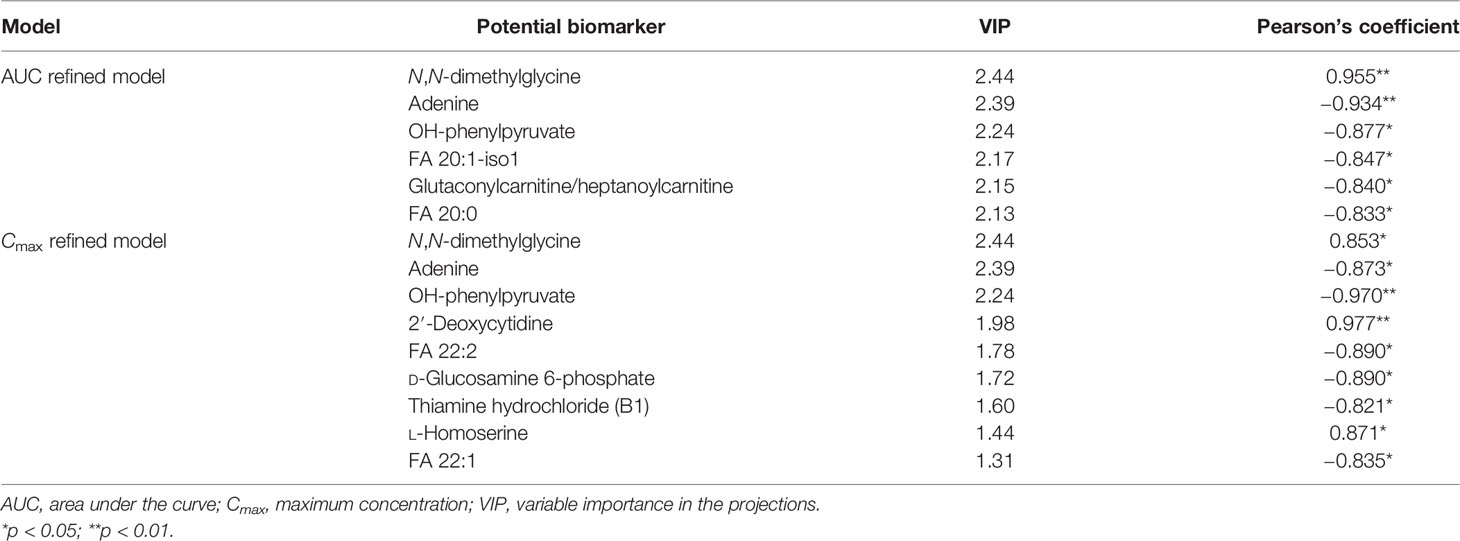
Table 5 Potential predictive biomarkers for the pharmacokinetics of sotorasib.
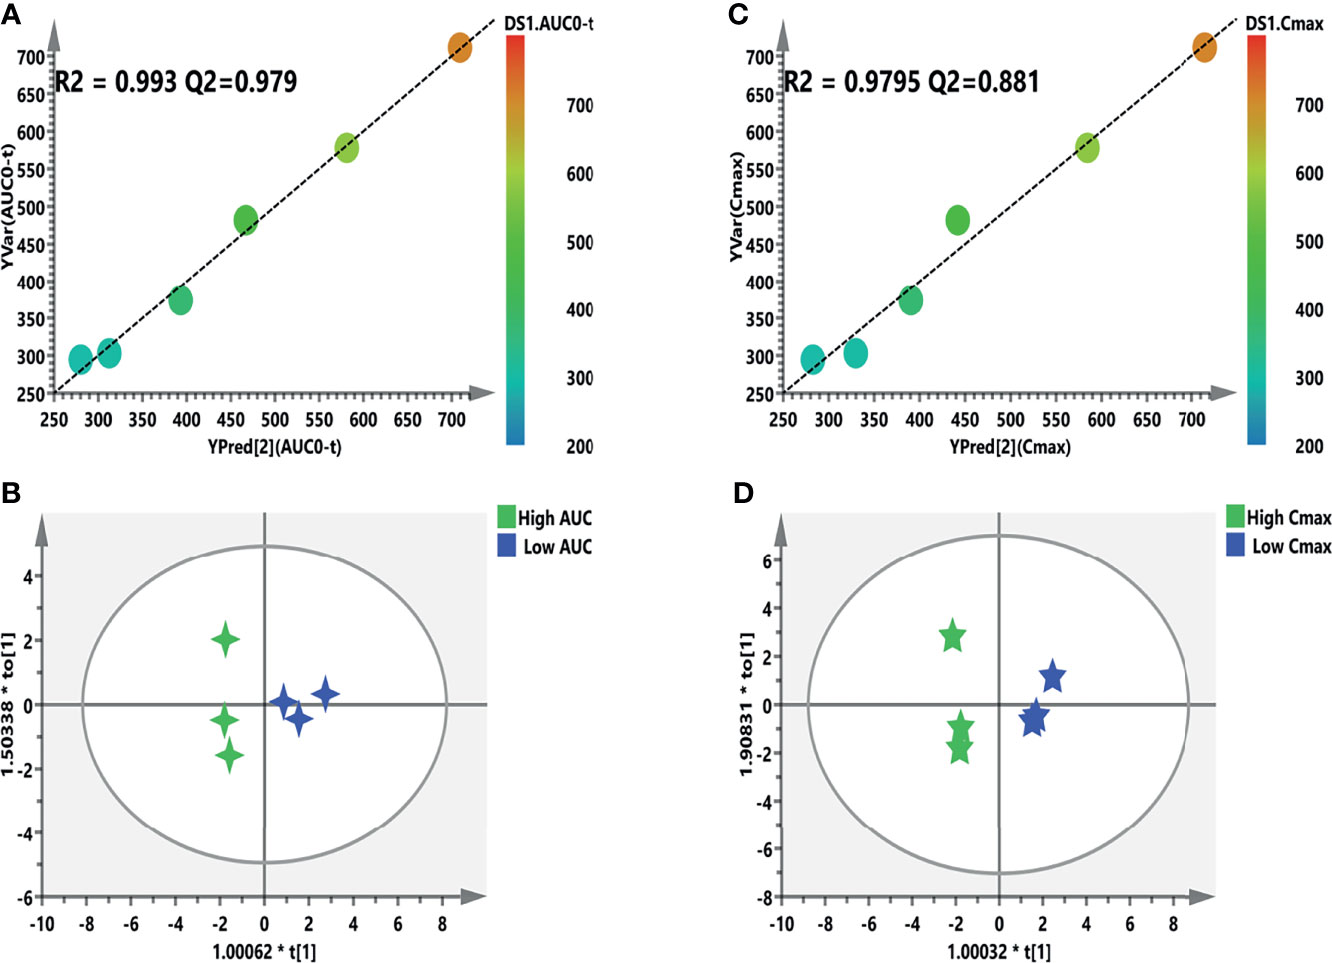
Figure 8 Refined models predicting the individualized pharmacokinetic (PK) parameters based on the screened biomarkers. (A, C) Regression plots of the predicted vs. the measured PK parameters (AUC or Cmax). Color from blue to red indicates the corresponding PK values from low to high. (B, D) Orthogonal projection to latent structures discriminant analysis (OPLS-DA) models discriminating the subgroups based on the screened biomarkers. AUC, area under the curve; Cmax, maximum concentration.
4 Discussion
Despite a lot of efforts and works done to fight cancer worldwide, it has become one of the metabolic diseases, and the incidence and mortality rates are increasing year by year (1). Emerging evidence indicates that cancer is a metabolic disease, and metabolic reprogramming is one of the important hallmarks of cancer (26, 27). On May 28, 2021, sotorasib was granted accelerated approval by the US FDA for the treatment of advanced or metastatic non-small cell lung cancer (NSCLC) patients with the KRAS (G12C) mutation (8). Recently, integration analysis of PK and PM can not only provide a useful approach for the systemic investigation of therapeutic drugs but also reveal the internal pharmacological mechanism from the perspective of metabolite disturbance and drug exposure (28).
During the process of analytical method development, different chromatographic columns were examined and compared. Sotorasib showed a wide peak on the reversed-phase Symmetry C18 column (50 mm × 2.1 mm, 5 μm) using ACN as the organic phase. The broadening peak could be modified on the Waters XBrige C18 column (50 mm × 2.1 mm, 3.5 μm), and chromatography separation was accomplished with high efficiency. The shape of the peaks showed the best separation with better symmetry. MeOH and ACN were both evaluated, and the peak shape and response were greatly improved when using ACN. By carefully optimizing the composition and pH, the organic phase was ACN (A) and the aqueous phase was water (B). All mobile phases contained 0.1% formic acid. The column temperature was investigated at ambient temperature, 40°C, and at 55°C. Given the whole responses and the separation efficiency, 40°C and ambient temperature were set for the column temperature and the autosampler. Despite analogs or stable ILIS being better for the determination of analytes due to the analogous LC conditions, carbamazepine as the IS was suitable for the analyte, which satisfied this PK study.
The results of the method validation of the PK study, including selectivity, accuracy, precision, matrix effects, recovery, and stability, met the criteria of the guidelines of bioanalytical method validation (Tables 1–3). Retmana et al. (12) have recently reported on the PK of sotorasib following single oral administration of 20 mg/kg in mice. Upon administration, sotorasib exhibited rapid absorption, with Cmax being achieved in <15 min. The other parameters were as follows: Tmax = 0.21 ± 0.06 h, Cmax = 4,231 ± 1,208 ng/ml, t1/2 = 0.60 ± 0.06 h, and AUC0–4 = 3,766 ± 896 ng·h/ml. Madhyastha et al. (11) compared the PK parameters after two administrations (intravenous vs. oral) at a dose of 50 mg/kg. With oral administration, the t1/2, Cmax, Tmax, and AUC0–∞ were 1.90 h, 123 ng/ml, 0.25 h, and 170 ng·h/ml, respectively.
The LLOQ of sotorasib was set at 0.5 ng/ml, with acceptable accuracy and precision, and the sensitivity was used to determine samples with low plasma concentrations. The results of the PK parameters were consistent with those in previous literature (11, 12). The robust and convenient HPLC-MS/MS method developed in this study had been applied successfully for PK, but further application is in the quantitation of sotorasib in human plasma. In our future works, we will continue to optimize the present assay and overcome this applicable limitation, which will undoubtedly benefit the therapeutic urgency of KRAS (G12C) inhibitors.
It is well known that sotorasib has broken the “non-druggable” curse and is the first KRAS-targeted drug approved by the FDA (10). PM is one of the most critical approaches to explore the mechanism, predict the drug response or toxicity, and optimize personalized drug dosage in order to improve efficacy and safety (18, 29–33). To date, no metabolic profile study has been published regarding the PM of sotorasib in vivo or in vitro. In this study, both longitudinal and transversal trajectories were assessed using multivariable statistics. In the longitudinal results, the characteristics of the 8-h metabolites were obviously different from those in other sampling time points, which indicates that the metabolic profile compared to the PK showed a delayed and an opposite trend. Additionally, the metabolic phenotype after sotorasib treatment was significantly segregated, and the metabolic pathways were also disturbed. Pan et al. (34) have recently published serum metabolomics in lung cancer-bearing mice after treatment with anlotinib. Compared with the control group, 13 differential metabolites and five potential metabolic pathways (i.e., glyoxylate and dicarboxylate metabolism; tryptophan metabolism; glycine, serine, and threonine metabolism; phenylalanine metabolism; and valine, leucine, and isoleucine biosynthesis) were observed. In this study, we found that the amino acids (e.g., L-valine, hydroxyproline, L-leucine, L-isoleucine, L-tryptophan, and L-aspartate), carnitines (e.g., DL 10:0, DL 8:0-2, DL 8:0-1, DL 16:0, DL 12:0, DL 10:1, and DL 18:0), and taurines were significantly changed upon sotorasib administration (Supplementary Table S2). Tryptophan plays a critical role in protein synthesis and is a precursor of bioactive compounds. It is an essential amino acid and regulator of antitumor immune response and cancer progression (35). Besides, the metabolism of tryptophan through the kynurenine pathway into free tryptophan has key functions in neurotransmission (36) and immune response regulation, and the accumulation of small-molecule inhibitors targeting tryptophan metabolism has been evaluated in the clinical phase (37). The branched-chain amino acids (BCAAs) such as L-valine, L-leucine, and L-isoleucine play crucial roles in the glucose or nutrition metabolism pathways [e.g., the mammalian target of rapamycin (mTOR) and phosphoinositide 3-kinase/protein kinase (PI3K/AKT) pathways] (38, 39). In this exploratory study, three common potential biomarkers—N,N-dimethylglycine (a derivative of the amino acid glycine), adenine, and OH-phenylpyruvate—were selected to predict drug exposure. As previously reported, reprogrammed BCAA metabolism can directly promote cancer progression and development (40). Besides, Ni et al. (41) reported that six metabolites (glycine, valine, methionine, citrulline, arginine, and C16 carnitine), using the PLS-DA model, were indicated to distinguish lung cancer from healthy controls and may be screening biomarkers for patients with lung cancer. Glycine or its derivative may be used for diagnosing lung cancer or real-time monitoring/predicting the efficacy of sotorasib. It has been reported that cholic acid or bile acid plays a pivotal role in the process of traditional Chinese medicine for the treatment of malignant tumors. A previous study demonstrated that bile acid metabolism, such as taurine, chenodeoxycholic acid, cholic acid, and deoxycholic acid, was regulated by mirabilite in colorectal cancer, and the results of this study—on the disturbance of metabolites before and after sotorasib administration—were basically consistent with those in published literature on the treatment of colorectal cancer (42).
Since the first description by Yoon et al. for the immunosuppressive drug tacrolimus, PM has been increasingly applied to predict the drug response, safety/toxicity, and the PK profile (43). After checking for outliers, a two-stage PLS analysis including an initial and a refined model was constructed between the metabolites and PK parameters (AUC and Cmax). Finally, a total of six and nine metabolites were selected and further validated to further verify the predictive efficiency (Figure 8). Although this study used a limited number of samples, several metabolite biomarkers were firstly discovered and were utilized to predict drug exposure/toxicity. Amino acids, carnitines, adenine, and fatty acids are important metabolites in metabolomics and have recently attracted the attention of an increasing number of cancer research studies. Oncogenic KRAS can activate the ACLY enzyme to promote the conversion of citrate to acetyl-CoA and enhance de novo fatty acid biosynthesis (44). Gene expression and metabolic flux analyses have shown that mutant KRAS upregulates the expression of the GLUT1 glucose transporter to promote glucose uptake, as well as inducing the expressions of the rate-limiting enzymes of glycolysis (hexokinases 1 and 2) or other key glycolytic enzymes (e.g., PFK1, ENO1, and LDHA), which enhances the glycolytic flux and promotes the production of intermediates (e.g., glucose-6-P and fructose-6-P) (45). Although substantial progress has been made in the interplay between KRAS mutation and metabolic reprogramming, a lot of work is still needed to fully discover the crosstalk of sotorasib from other aspects besides the PK and PM.
To date, no investigation has been reported regarding the comprehensive metabolic fingerprint after sotorasib treatment and the correlation with the PK parameters. Indeed, several limitations should be mentioned. Firstly, although the recovery and matrix effect criteria were not defined in the guidelines for quantitative biological sample determination, there is much opportunity for improvement in the biological sample pretreatment methods of plasma in this PK study. Secondly, the sample size of this exploratory research was small, and more data and external validation may be needed to pool and verify these results. Thirdly, due to the non-availability of blood samples from cancer patients, we only investigated the metabolomic profile in rats after a single administration of sotorasib. A more in-depth understanding of these concerns will pave the way for the development of well-tolerated and effective therapies for patients with KRAS-driven cancer. Taken together, our work is the first to reveal the comprehensive metabolite trajectories induced by sotorasib and the predictive drug exposure/toxicity biomarkers in rats, which will provide a notable scientific contribution to prevention or therapy in patients with the KRAS (G12C) mutation.
5 Conclusion
A robust and sensitive HPLC-MS/MS assay was firstly developed and fully validated for the quantitation of sotorasib in rat plasma. Both longitudinal and transversal metabolism characteristics were revealed systemically. After treatment with sotorasib, 19 metabolic pathways were disturbed, and the most significant pathway was taurine and hypotaurine metabolism. A total of six metabolites were upregulated and 11 metabolites were downregulated after dosing when the FC setting was 2. Moreover, an integrated PM and PK analysis was employed to predict the metabolic phenotype and drug exposure of sotorasib. Using two-stage PLS and OPLS-DA models, six and nine screened variables were significantly correlated with the AUC and Cmax of sotorasib, respectively, and the potential predictive biomarkers could discriminate between the high- and low-exposure groups with reliable model validation. Collectively, our work is the first to reveal the comprehensive metabolite trajectories induced by sotorasib and to investigate biomarkers for predicting drug exposure/toxicity, which will provide a notable scientific contribution to prevention or therapy in patients with the KRAS (G12C) mutation.
Data Availability Statement
The original contributions presented in the study are included in the article/Supplementary Material. Further inquiries can be directed to the corresponding author.
Ethics Statement
The animal study was reviewed and approved by the Animal Care and Ethics Committee of Beijing Chao-Yang Hospital, Capital Medical University.
Author Contributions
PD: conceptualization, investigation, and writing—original draft. TH: methodology. TH and ZA: writing—review and editing. LL: resources and supervision. All authors contributed to the article and approved the submitted version.
Conflict of Interest
The authors declare that the research was conducted in the absence of any commercial or financial relationships that could be construed as a potential conflict of interest.
Publisher’s Note
All claims expressed in this article are solely those of the authors and do not necessarily represent those of their affiliated organizations, or those of the publisher, the editors and the reviewers. Any product that may be evaluated in this article, or claim that may be made by its manufacturer, is not guaranteed or endorsed by the publisher.
Acknowledgments
Special thanks to Dr Guoyong Wang (Leto Laboratories Co., Ltd, Beijing, China) for supplying the chemicals.
Supplementary Material
The Supplementary Material for this article can be found online at: https://www.frontiersin.org/articles/10.3389/fonc.2022.778035/full#supplementary-material
References
1. Sung H, Ferlay J, Siegel RL, Laversanne M, Soerjomataram I, Jemal A, et al. Global Cancer Statistics 2020: GLOBOCAN Estimates of Incidence and Mortality Worldwide for 36 Cancers in 185 Countries. CA Cancer J Clin (2021) 71(3):209–49. doi: 10.3322/caac.21660
2. Mustachio LM, Chelariu-Raicu A, Szekvolgyi L, Roszik J. Targeting KRAS in Cancer: Promising Therapeutic Strategies. Cancers (2021) 13(6):1204. doi: 10.3390/cancers13061204
3. Kim D, Xue JY, Lito P. Targeting KRAS (G12C): From Inhibitory Mechanism to Modulation of Antitumor Effects in Patients. Cell (2020) 183(4):850–9. doi: 10.1016/j.cell.2020.09.044
4. Prior IA, Lewis PD, Mattos C. A Comprehensive Survey of Ras Mutations in Cancer. Cancer Res (2012) 72(10):2457–67. doi: 10.1158/0008-5472.CAN-11-2612
5. Cox AD, Fesik SW, Kimmelman AC, Luo J, Der CJ. Drugging the Undruggable RAS: Mission Possible? Nat Rev Drug Discov (2014) 13(11):828–51. doi: 10.1038/nrd4389
6. Canon J, Rex K, Saiki AY, Mohr C, Cooke K, Bagal D, et al. The Clinical KRAS (G12C) Inhibitor AMG 510 Drives Anti-Tumour Immunity. Nature (2019) 575(7781):217–23. doi: 10.1038/s41586-019-1694-1
7. Govindan R, Fakih M, Price T, Falchook G, Desai J, Kuo J, et al. Phase I Study of AMG 510, A Novel Molecule Targeting KRAS G12C Mutant Solid Tumours. Ann Oncol (2019) 30:v163–4. doi: 10.1093/annonc/mdz244.008
9. Fakih M, Desai J, Kuboki Y, Strickler JH, Price TJ, Durm GA, et al. Codebreak 100: Activity of AMG 510, a Novel Small Molecule Inhibitor of KRASG12C, in Patients With Advanced Colorectal Cancer. J Clin Oncol (2020) 38(15_suppl):4018. doi: 10.1200/JCO.2020.38.15_suppl.4018
10. Uprety D, Adjei AA. KRAS: From Undruggable to a Druggable Cancer Target. Cancer Treat Rev (2020) 89:102070. doi: 10.1016/j.ctrv.2020.102070
11. Madhyastha N, Samantha SK, Dittakavi S, Markose M, Mallurwar SR, Zainuddin M, et al. Validated HPLC-MS/MS Method for Quantitation of AMG 510, a KRAS G12C Inhibitor, in Mouse Plasma and Its Application to a Pharmacokinetic Study in Mice. BioMed Chromatogr (2021) 35(4):e5043. doi: 10.1002/bmc.5043
12. Retmana IA, Loos NH, Schinkel AH, Beijnen JH, Sparidans RW. Quantification of KRAS Inhibitor Sotorasib in Mouse Plasma and Tissue Homogenates Using Liquid Chromatography-Tandem Mass Spectrometry. J Chromatogr B (2021) 1174:122718. doi: 10.1016/j.jchromb.2021.122718
13. Schmidt DR, Patel R, Kirsch DG, Lewis CA, Vander Heiden MG, Locasale JW. Metabolomics in Cancer Research and Emerging Applications in Clinical Oncology. CA: Cancer J Clin (2021) 0:1–26. doi: 10.3322/caac.21670
14. Clayton TA, Lindon JC, Cloarec O, Antti H, Charuel C, Hanton G, et al. Pharmaco-Metabonomic Phenotyping and Personalized Drug Treatment. Nature (2006) 440(7087):1073–7. doi: 10.1038/nature04648
15. Thomas T, Stefanoni D, Reisz JA, Nemkov T, Bertolone L, Francis RO, et al. COVID-19 Infection Results in Alterations of the Kynurenine Pathway and Fatty Acid Metabolism That Correlate With IL-6 Levels and Renal Status. JCI Insight (2020) 5(14):e140327. doi: 10.1172/jci.insight.140327
16. Kaddurah-Daouk R, Weinshilboum R, Network PR. Metabolomic Signatures for Drug Response Phenotypes: Pharmacometabolomics Enables Precision Medicine. Clin Pharmacol Ther (2015) 98(1):71–5. doi: 10.1002/cpt.134
17. Hu T, Shi C, Liu L, Li P, Sun Y, An Z. A Single-Injection Targeted Metabolomics Profiling Method for Determination of Biomarkers to Reflect Tripterygium Glycosides Efficacy and Toxicity. Toxicol Appl Pharmacol (2020) 389:114880. doi: 10.1016/j.taap.2020.114880
18. Hu T, An Z, Sun Y, Wang X, Du P, Li P, et al. Longitudinal Pharmacometabonomics for Predicting Malignant Tumor Patient Responses to Anlotinib Therapy: Phenotype, Efficacy and Toxicity. Front Oncol (2020) 10:2373. doi: 10.3389/fonc.2020.548300
19. Du P, Guan Y, An Z, Li P, Liu L. A Selective and Robust UPLC-MS/MS Method for the Simultaneous Quantitative Determination of Anlotinib, Ceritinib and Ibrutinib in Rat Plasma and Its Application to a Pharmacokinetic Study. Analyst (2019) 144(18):5462–71. doi: 10.1039/C9AN00861F
20. Evaluation, Research CFD. Bioanalytical Method Validation Guidance For Industry. Center for Drug Evaluation and Research of the U.S. Maryland: Department of Health and Human Services Food and Drug Administration. (2018). Available at: https://www.fda.gov/downloads/Drugs GuidanceComplianceRegulatoryInformation/Guidances/UCM070107.pdf. 2018updated 2018-01-01%\ 2020-05-11 11:19:00
21. Chinese PC. The Pharmacopoeia of the People’s Republic of China, 2015 Edition Part IV 2015 2015-01-01%\ 2020-03-16 20:55:00. Beijing (2015)
22. Du P, Li P, Zhao R, Liu H, Liu L. Optimized UPLC-MS/MS Method for the Quantitation of Olanzapine in Human Plasma: Application to a Bioequivalence Study. Bioanalysis (2019) 11(13):1291–302. doi: 10.4155/bio-2019-0114
23. Meyer VR. Measurement Uncertainty. J Chromatogr AData Anal Chromatogr (2007) 1158(1–2):15–24. doi: 10.1016/j.chroma.2007.02.082
24. Du P, Wang G, Yang S, Li P, Liu L. Quantitative HPLC-MS/MS Determination of Nuc, the Active Metabolite of Remdesivir, and Its Pharmacokinetics in Rat. Anal Bioanal Chem (2021) 413(23):5811–20. doi: 10.1007/s00216-021-03561-8
25. Xing X, Ma P, Huang Q, Qi X, Zou B, Wei J, et al. Predicting Pharmacokinetics Variation of Faropenem Using a Pharmacometabonomic Approach. J Proteome Res (2019) 19(1):119–28. doi: 10.1021/acs.jproteome.9b00436
26. Seyfried TN, Shelton LM. Cancer as a Metabolic Disease. Nutr Metab (2010) 7(1):1–22. doi: 10.1186/1743-7075-7-7
27. Hanahan D, Weinberg RA. Hallmarks of Cancer: The Next Generation. Cell (2011) 144(5):646–74. doi: 10.1016/j.cell.2011.02.013
28. Varshavi D, Varshavi D, Everett JR. The Role of Pharmacometabonomics in Predicting Drug Pharmacokinetics. Future Sci (2016) 1(1):5–8. doi: 10.4155/ipk-2016-0010
29. An Z, Wang X, Li P, He J, Liu L. Exploring the Metabolic Characteristics and Pharmacokinetic Variation of Paroxetine in Healthy Volunteers Using a Pharmacometabonomic Approach. J Pharm Biomed Anal (2021) 204:114224. doi: 10.1016/j.jpba.2021.114224
30. Du P, Wang G, Zhao R, Hu T, Li H, An Z. Eicosanoids Metabolomic Profile of Remdesivir Treatment in Rat Plasma by High-Performance Liquid Chromatography Mass Spectrometry. Front Pharmacol (2021) 12:747450. doi: 10.3389/fphar.2021.747450
31. Mussap M, Loddo C, Fanni C, Fanos V. Metabolomics in Pharmacology-A Delve Into the Novel Field of Pharmacometabolomics. Expert Rev Clin Pharmacol (2020) 13(2):115–34. doi: 10.1080/17512433.2020.1713750
32. Du P, Hu T, An Z, Li P, Liu L. Simultaneous Quantitative Determination of Arachidonic Acid and Cascade Metabolites in Rat Serum by UPLC-MS/MS: Application for Longitudinal Metabolomics of Anlotinib. Analyst (2020) 145(14):4972–81. doi: 10.1039/D0AN00867B
33. Nicholson JK, Everett JR, Lindon JC. Longitudinal Pharmacometabonomics for Predicting Patient Responses to Therapy: Drug Metabolism, Toxicity and Efficacy. Expert Opin Drug Metab Toxicol (2012) 8(2):135–9. doi: 10.1517/17425255.2012.646987
34. Pan X, Chen W, Nie M, Liu Y, Xiao Z, Zhang Y, et al. A Serum Metabolomic Study Reveals Changes in Metabolites During the Treatment of Lung Cancer-Bearing Mice With Anlotinib. Cancer Manage Res (2021) 13:6055. doi: 10.2147/CMAR.S300897
35. Opitz CA, Patterson LFS, Mohapatra SR, Dewi DL, Sadik A, Platten M, et al. The Therapeutic Potential of Targeting Tryptophan Catabolism in Cancer. Br J Cancer (2020) 122(1):30–44. doi: 10.1038/s41416-019-0664-6
36. Platten M, Nollen EA, Röhrig UF, Fallarino F, Opitz CA. Tryptophan Metabolism as a Common Therapeutic Target in Cancer, Neurodegeneration and Beyond. Nat Rev Drug Discov (2019) 18(5):379–401. doi: 10.1038/s41573-019-0016-5
37. Cheong JE, Ekkati A, Sun L. A Patent Review of IDO1 Inhibitors for Cancer. Expert Opin Ther Patents (2018) 28(4):317–30. doi: 10.1080/13543776.2018.1441290
38. Lynch CJ, Adams SH. Branched-Chain Amino Acids in Metabolic Signalling and Insulin Resistance. Nat Rev Endocrinol (2014) 10(12):723–36. doi: 10.1038/nrendo.2014.171
39. Jewell JL, Russell RC, Guan K-L. Amino Acid Signalling Upstream of Mtor. Nat Rev Mol Cell Biol (2013) 14(3):133–9. doi: 10.1038/nrm3522
40. Hattori A, Tsunoda M, Konuma T, Kobayashi M, Nagy T, Glushka J, et al. Cancer Progression by Reprogrammed BCAA Metabolism in Myeloid Leukaemia. Nature (2017) 545(7655):500–4. doi: 10.1038/nature22314
41. Ni J, Xu L, Li W, Zheng C, Wu L. Targeted Metabolomics for Serum Amino Acids and Acylcarnitines in Patients With Lung Cancer. Exp Ther Med (2019) 18(1):188–98. doi: 10.3892/etm.2019.7533
42. Sun H, Zhang H-l, Zhang A-h, Zhou X-h, Wang X-q, Han Y, et al. Network Pharmacology Combined With Functional Metabolomics Discover Bile Acid Metabolism as a Promising Target for Mirabilite Against Colorectal Cancer. RSC Adv (2018) 8(53):30061–70. doi: 10.1039/C8RA04886J
43. Phapale P, Kim SD, Lee H, Lim M, Kale D, Kim YL, et al. An Integrative Approach for Identifying a Metabolic Phenotype Predictive of Individualized Pharmacokinetics of Tacrolimus. Clin Pharmacol Ther (2010) 87(4):426–36. doi: 10.1038/clpt.2009.296
44. Carrer A, Trefely S, Zhao S, Campbell SL, Norgard RJ, Schultz KC, et al. Acetyl-Coa Metabolism Supports Multistep Pancreatic Tumorigenesis. Cancer Discov (2019) 9(3):416–35. doi: 10.1158/2159-8290.CD-18-0567
Keywords: sotorasib, pharmacokinetics, pharmacometabolomics, integrative analysis, HPLC-MS/MS
Citation: Du P, Liu L, Hu T and An Z (2022) Integrative Analysis of Pharmacokinetic and Metabolomic Profiles for Predicting Metabolic Phenotype and Drug Exposure Caused by Sotorasib in Rats. Front. Oncol. 12:778035. doi: 10.3389/fonc.2022.778035
Received: 29 September 2021; Accepted: 28 February 2022;
Published: 05 April 2022.
Edited by:
Peter Mu-Hsin Chang, Taipei Veterans General Hospital, TaiwanReviewed by:
Yaping Shao, Dalian Medical University, ChinaMin Hee Kang, Texas Tech University Health Sciences Center, United States
Jiun-I Lai, National Yang-Ming University, Taiwan
Copyright © 2022 Du, Liu, Hu and An. This is an open-access article distributed under the terms of the Creative Commons Attribution License (CC BY). The use, distribution or reproduction in other forums is permitted, provided the original author(s) and the copyright owner(s) are credited and that the original publication in this journal is cited, in accordance with accepted academic practice. No use, distribution or reproduction is permitted which does not comply with these terms.
*Correspondence: Ping Du, pingdu2012@163.com; Lihong Liu, liulihong@bjcyh.com