Corrigendum: Prediction of Microvascular Invasion and Its M2 Classification in Hepatocellular Carcinoma Based on Nomogram Analyses
 Shengsen Chen
 Chao Wang2†
 Yuwei Gu
 Rongwei Ruan
 Shi Wang
- 1Department of Endoscopy, Cancer Hospital of the University of Chinese Academy of Sciences (Zhejiang Cancer Hospital), Institute of Cancer and Basic Medicine (IBMC), Chinese Academy of Sciences, Hangzhou, China
- 2Department of Emergency, Huashan Hospital affiliated to Fudan University, Shanghai, China
- 3Department of Rehabilitation Medicine, Huashan Hospital affiliated to Fudan University, Shanghai, China
Background and Aims: As a key pathological factor, microvascular invasion (MVI), especially its M2 grade, greatly affects the prognosis of liver cancer patients. Accurate preoperative prediction of MVI and its M2 classification can help clinicians to make the best treatment decision. Therefore, we aimed to establish effective nomograms to predict MVI and its M2 grade.
Methods: A total of 111 patients who underwent radical resection of hepatocellular carcinoma (HCC) from January 2017 to December 2019 were retrospectively collected. We utilized logistic regression and least absolute shrinkage and selection operator (LASSO) regression to identify the independent predictive factors of MVI and its M2 classification. Integrated discrimination improvement (IDI) and net reclassification improvement (NRI) were calculated to select the potential predictive factors from the results of LASSO and logistic regression. Nomograms for predicting MVI and its M2 grade were then developed by incorporating these factors. Area under the curve (AUC), calibration curve, and decision curve analysis (DCA) were respectively used to evaluate the efficacy, accuracy, and clinical utility of the nomograms.
Results: Combined with the results of LASSO regression, logistic regression, and IDI and NRI analyses, we founded that clinical tumor-node-metastasis (TNM) stage, tumor size, Edmondson–Steiner classification, α-fetoprotein (AFP), tumor capsule, tumor margin, and tumor number were independent risk factors for MVI. Among the MVI-positive patients, only clinical TNM stage, tumor capsule, tumor margin, and tumor number were highly correlated with M2 grade. The nomograms established by incorporating the above variables had a good performance in predicting MVI (AUCMVI = 0.926) and its M2 classification (AUCM2 = 0.803). The calibration curve confirmed that predictions and actual observations were in good agreement. Significant clinical utility of our nomograms was demonstrated by DCA.
Conclusions: The nomograms of this study make it possible to do individualized predictions of MVI and its M2 classification, which may help us select an appropriate treatment plan.
Introduction
Primary liver cancer is one of the most common cancers worldwide and globally ranks fifth and fourth in morbidity and mortality, respectively (1). In China, liver cancer was reported as the fourth most common cancer in 2015, and its mortality ranked second among malignant tumors (2), with approximately 466,100 new cases and 422,000 deaths (3). As the most common type of liver cancer, hepatocellular carcinoma (HCC) has high invasiveness, and its 5-year recurrence rate after surgery is nearly 70% (4, 5), which results in a poor prognosis (6). Despite the diagnosis and treatment of HCC having been greatly improved, recurrence within 5 years after operation still remains a huge challenge (7). Microvascular invasion (MVI), an indicator (only diagnosed by histopathological examination) of HCC aggressive behavior (8), is defined as the cancer cell nest appearing in vessels lined with endothelium under microscopy (9, 10). When MVI is present, tumor cells can spread and metastasize in the liver, forming portal vein tumor thrombi or multiple lesions or distant metastasis (11). So MVI is considered as a critical pathological factor correlated with tumor recurrence and survival (12) and has been used as a prognostic reference index in the treatment options for both primary and recurrent HCC (13, 14). In resected HCC specimens, MVI was detected in approximately 7.8% to 74.4% of cases (15), and the MVI detection rate in early HCC varied greatly from 12.4% to 37.3% (16).
Recently, the three-tiered MVI grading system (MVI-TTG) has been proposed and it classifies the specimens as M0 (no MVI), M1 (1–5 sites of MVI and located at ≤1 cm away from the tumor-adjacent liver tissue), and M2 (>5 MVI sites or at >1 cm away from the tumor-adjacent liver tissue) (17). The MVI-TTG scheme is simple and clear, is easy to implement, and can stratify HCC patients in different risks for recurrence and survival (18). In the presence of MVI, HCC patients with M2 classification showed a worse prognosis after radical resection than those with M1 classification. Moreover, the M2 grade of MVI is a high-risk factor for postoperative residual cancer recurrence and intrahepatic metastasis (18). Therefore, we should pay attention not only to the presence or absence of MVI but also to its M2 classification.
If HCC patients who require liver resection are at high risk of MVI, it is recommended to widen the surgical margin to eradicate MVI and improve clinical prognosis (19). When MVI is present and classified as M2 grade, more intense comprehensive treatment such as adjuvant transarterial chemoembolization (TACE) may need to be taken to prevent HCC postoperative recurrence and metastasis (20). Given that MVI, especially its M2 grade, is the poor prognostic factor of HCC (18), there is an urgent need to build effective and accurate prediction models that can predict MVI and its M2 classification to optimize the management of patients (21). A few studies have built and validated some nomograms for MVI prediction, but the inclusion criteria of HCC patients were heterogeneous and so were the clinical characteristics of selected patients in these studies (22). Additionally, the study on the risk prediction of M2 classification in the presence of MVI is still rare currently.
Therefore, in this study, we aimed to determine the effective predictors of MVI and its M2 classification and use these factors to establish corresponding nomograms, which could aid clinicians to select appropriate therapeutic strategies for MVI-positive HCC patients and make the follow-up after curative treatment more targeted.
Methods
Patients and Study Design
We retrospectively collected a total of 111 HCC patients with liver resection from January 2017 to December 2019. The criteria for the exclusion of patients were as follows: 1) abdominal contrast-enhanced CT and blood index tests were performed more than 1 week before surgery; 2) the surgical margin was not confirmed to be R0 defined in a previous report (23); 3) patients underwent hepatectomy more than one time; 4) patients received radiofrequency ablation (RFA), TACE, neoadjuvant chemotherapy, and/or radiotherapy before surgery; 5) patients who have a history of other malignant tumors; 6) MVI status was not evaluated by histopathological examination; 7) HCCs with macrovascular or extrahepatic invasion; and 8) incomplete clinical data. The flowchart of the patient selection is summarized in Figure 1.
FIGURE 1
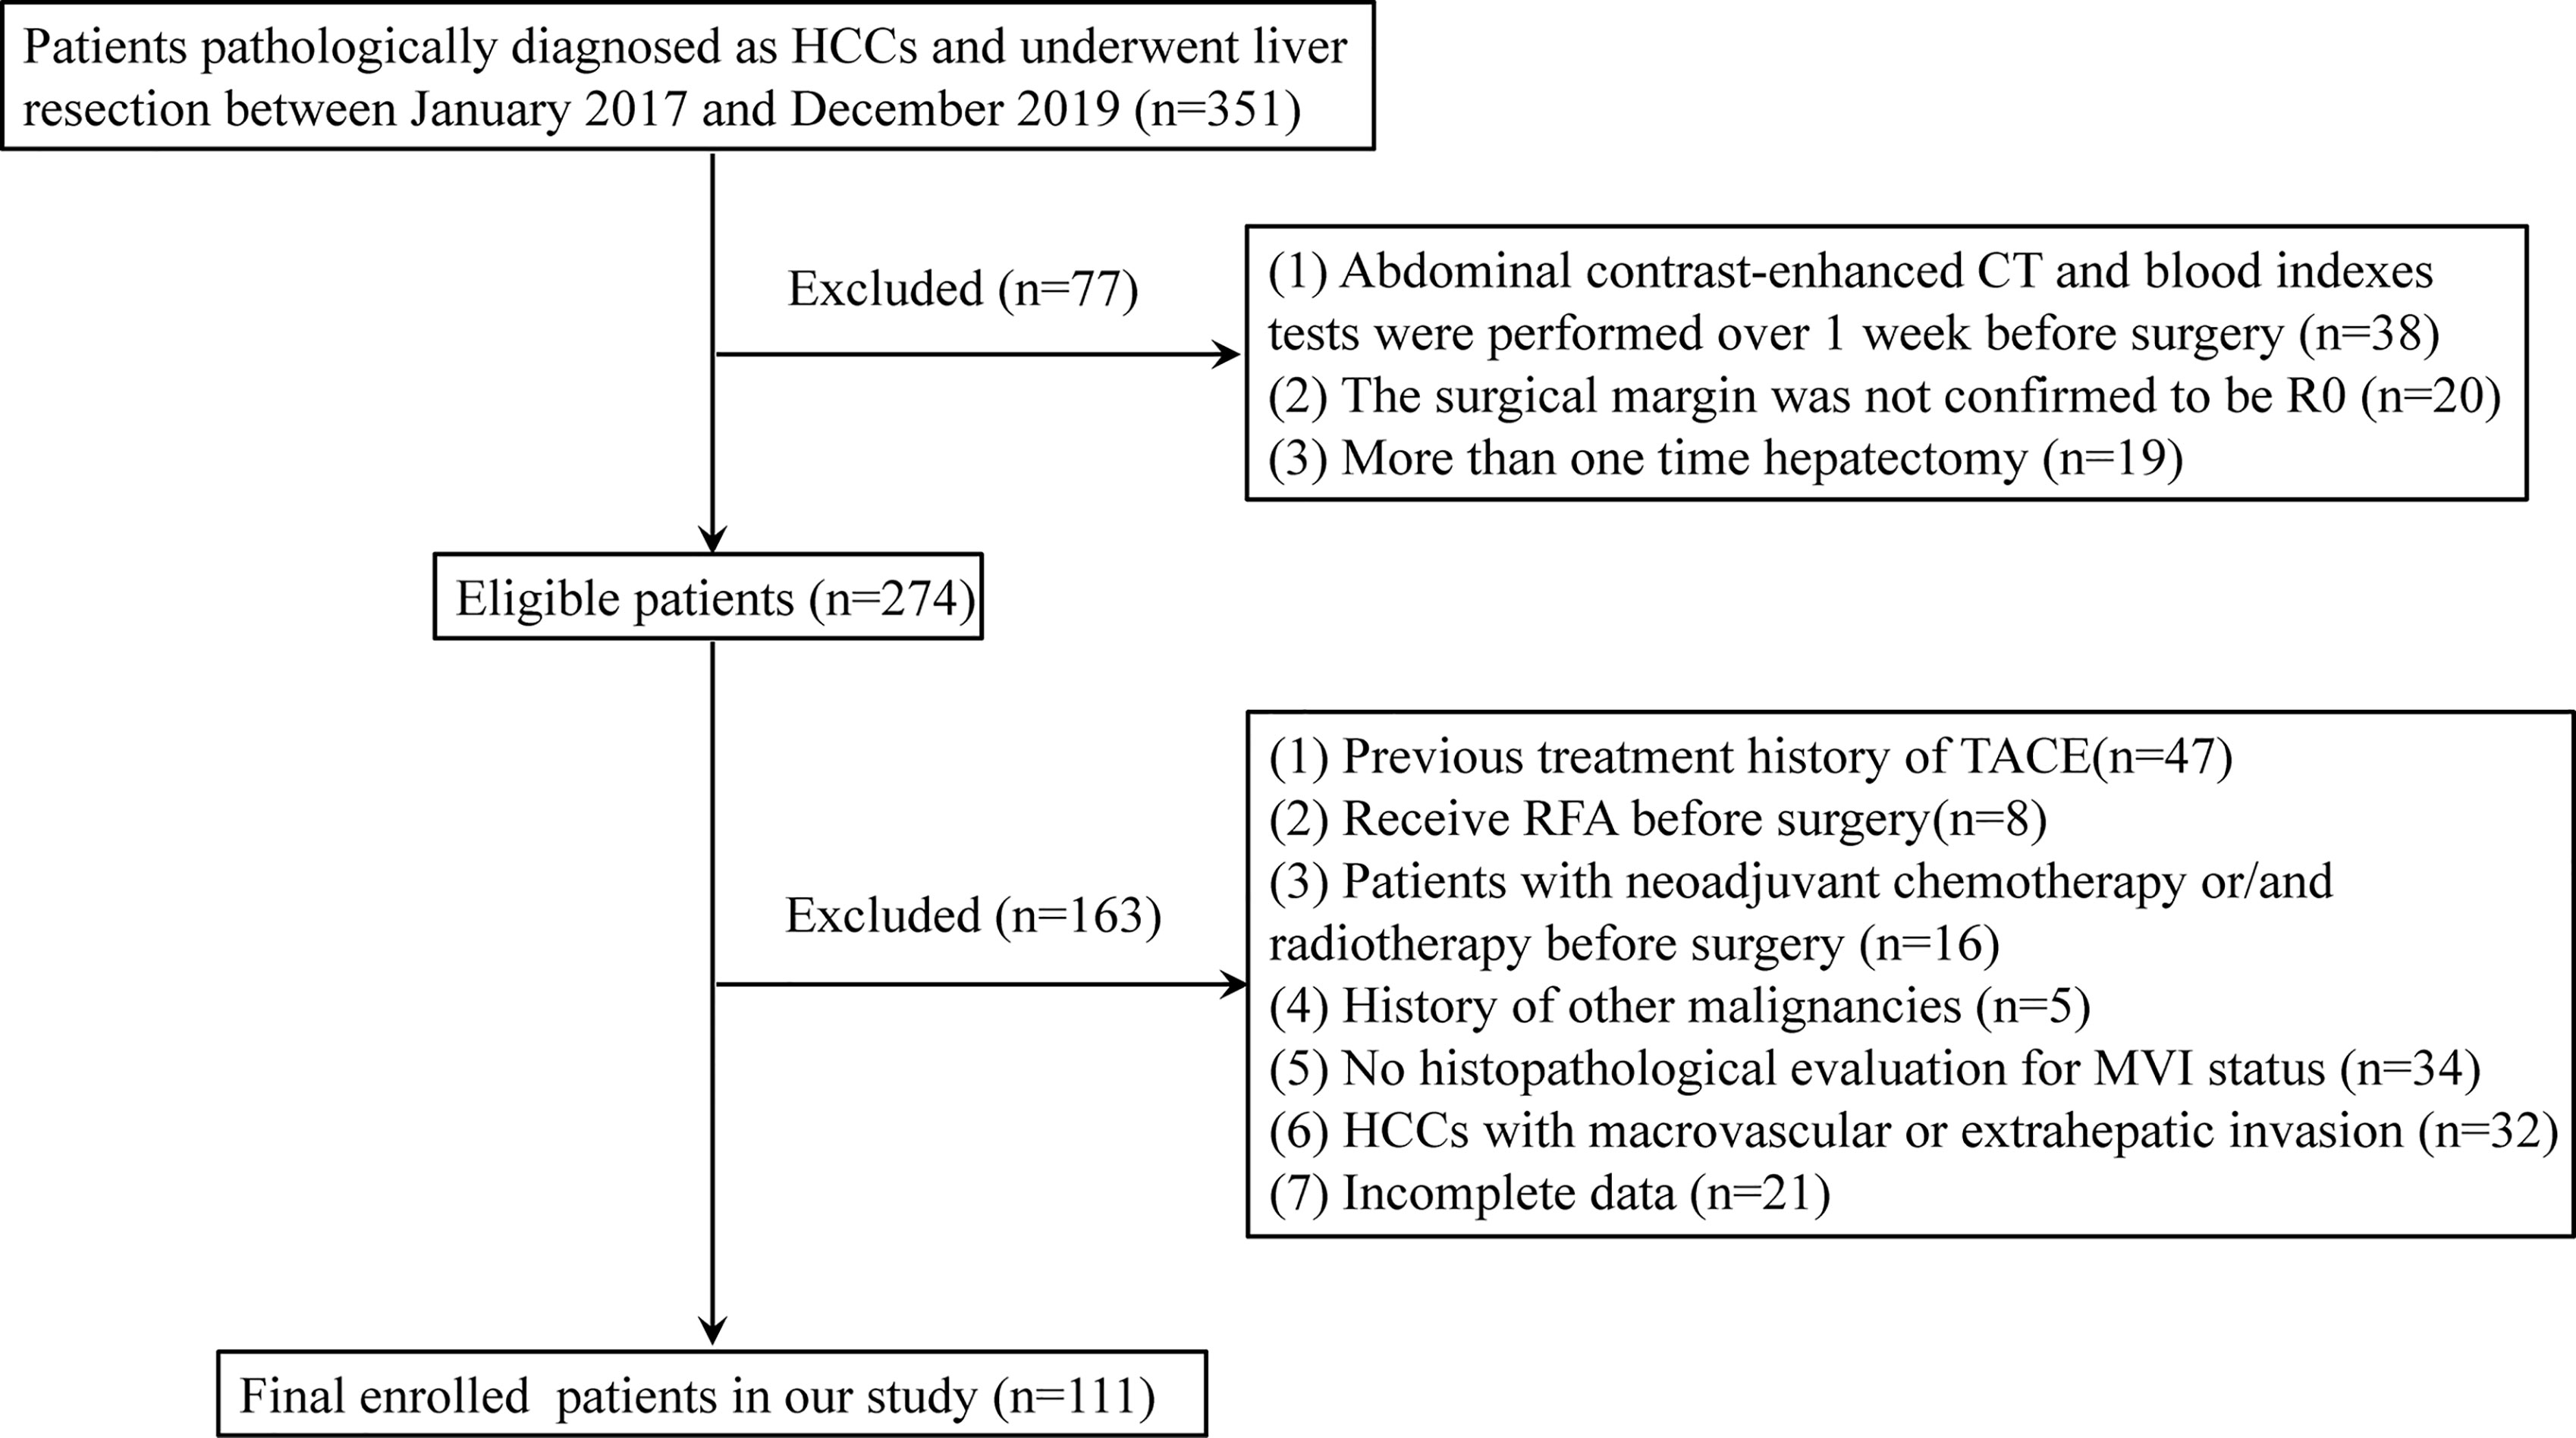
Figure 1 Flowchart of the patients included in the analysis.
Clinical Variables and Pathological Characteristics
Basic information on admission such as age, sex, symptoms at diagnosis, and some laboratory indicators was collected including blood routine test, liver and kidney function, hepatitis B tests, and tumor markers. Besides, data of tumor size, liver cirrhosis, number of HCC lesions, tumor location, tumor margin, and tumor capsule were extracted from the results of preoperative abdominal contrast-enhanced CT scans. The cardiopulmonary function was also evaluated by cardiac ultrasound and pulmonary function test to make sure the patients can tolerate the operation. The postoperative tissue specimens were further assessed by pathological examination to confirm the presence or absence of MVI. As described above, patients with positive MVI were classified into M1 and M2 according to the three-tiered MVI grading system (17). Other pathological characteristics like satellite nodule and the Edmondson–Steiner classification were also collected.
Statistical Analysis
Continuous variables which were expressed as median (range) were compared using the Mann–Whitney U test. The χ2 test or Fisher’s exact test was used to calculate statistical differences of categorical variables. All variables related to the MVI and its M2 classification in the univariate analysis were regarded as candidates for multivariate logistic analysis. The least absolute shrinkage and selection operator (LASSO) regression model was used to reduce data dimensionality and select the most significant elements with non-zero coefficients (24). The integrated discrimination improvement (IDI) is the difference in the discrimination slopes for a prediction model with and without one variable, which indicates whether the discrimination slope of a model will improve if one important parameter is added. The net reclassification improvement (NRI) is an index that attempts to quantify how well a new model correctly reclassifies subjects. So IDI and NRI can be used for the comparison between an original model and a new model (the original model plus one additional component) (25).
The final predictors correlated with MVI and its M2 classification were determined by LASSO regression, logistic regression, and IDI and NRI analyses and used to establish the corresponding nomograms. The nomogram can proportionally convert each regression coefficient in the logistic regression to a scale of 0 to 100 points (26). The points of each independent variable were summed, and the predicted probabilities were derived from the total points. The predictive performance and accuracy of the nomograms were evaluated by AUC and calibration curve, respectively. Decision curve analysis (DCA) was performed by calculating the net benefits at different points of threshold probabilities to evaluate the clinical utility of the nomograms. In all analyses, P <0.05 was considered to indicate statistical significance. All analyses were performed using SPSS version 22.0 (SPSS Inc, Chicago, IL, USA) and R version 4.0.3.
Results
Clinicopathological Characteristics
A total of 111 patients with HCC were retrospectively enrolled in this study. The median age was 57 years (range 37–80), 97 (87.4%) patients were male, 14 (12.6%) patients were female, 40 (36.0%) patients had symptoms at diagnosis, and the median tumor size (longest tumor diameter) was 7 cm (range 1.5–22). Based on the eighth TNM staging system recommended by the AJCC, among 111 HCC patients, 8 cases (7.2%) were classified as stage I, 38 cases (34.2%) were classified as stage II, 60 cases (54.1%) were classified as stage III, and 5 cases (4.5%) were classified as stage IV. MVI was found in 72 of 111 (64.86%) patients, whereas M2 grade was presented in 47 of 72 (65.28%) MVI-positive patients. The detailed clinicopathological characteristics are listed in Tables 1 and 2.
TABLE 1
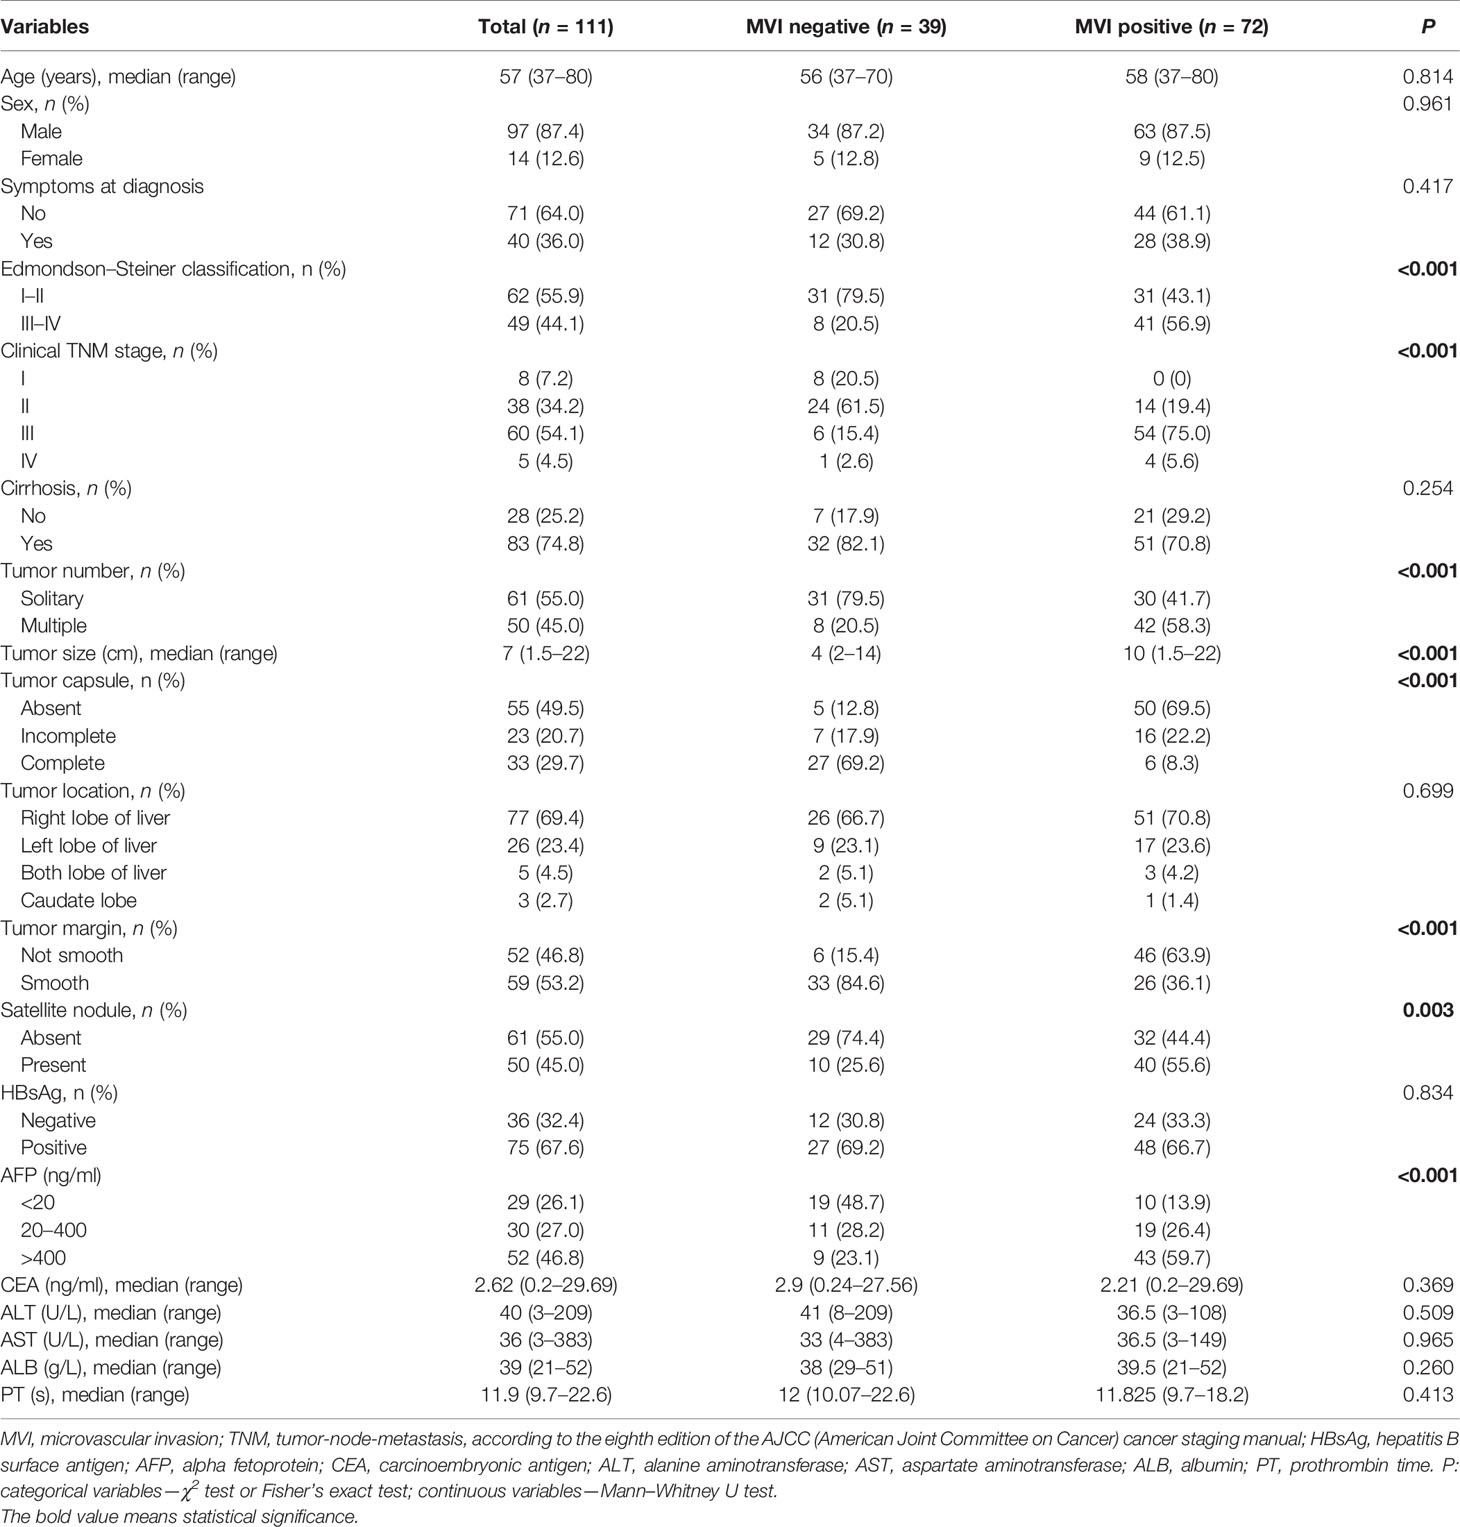
Table 1 Clinical characteristics of HCC patients and their correlations with MVI status.
TABLE 2
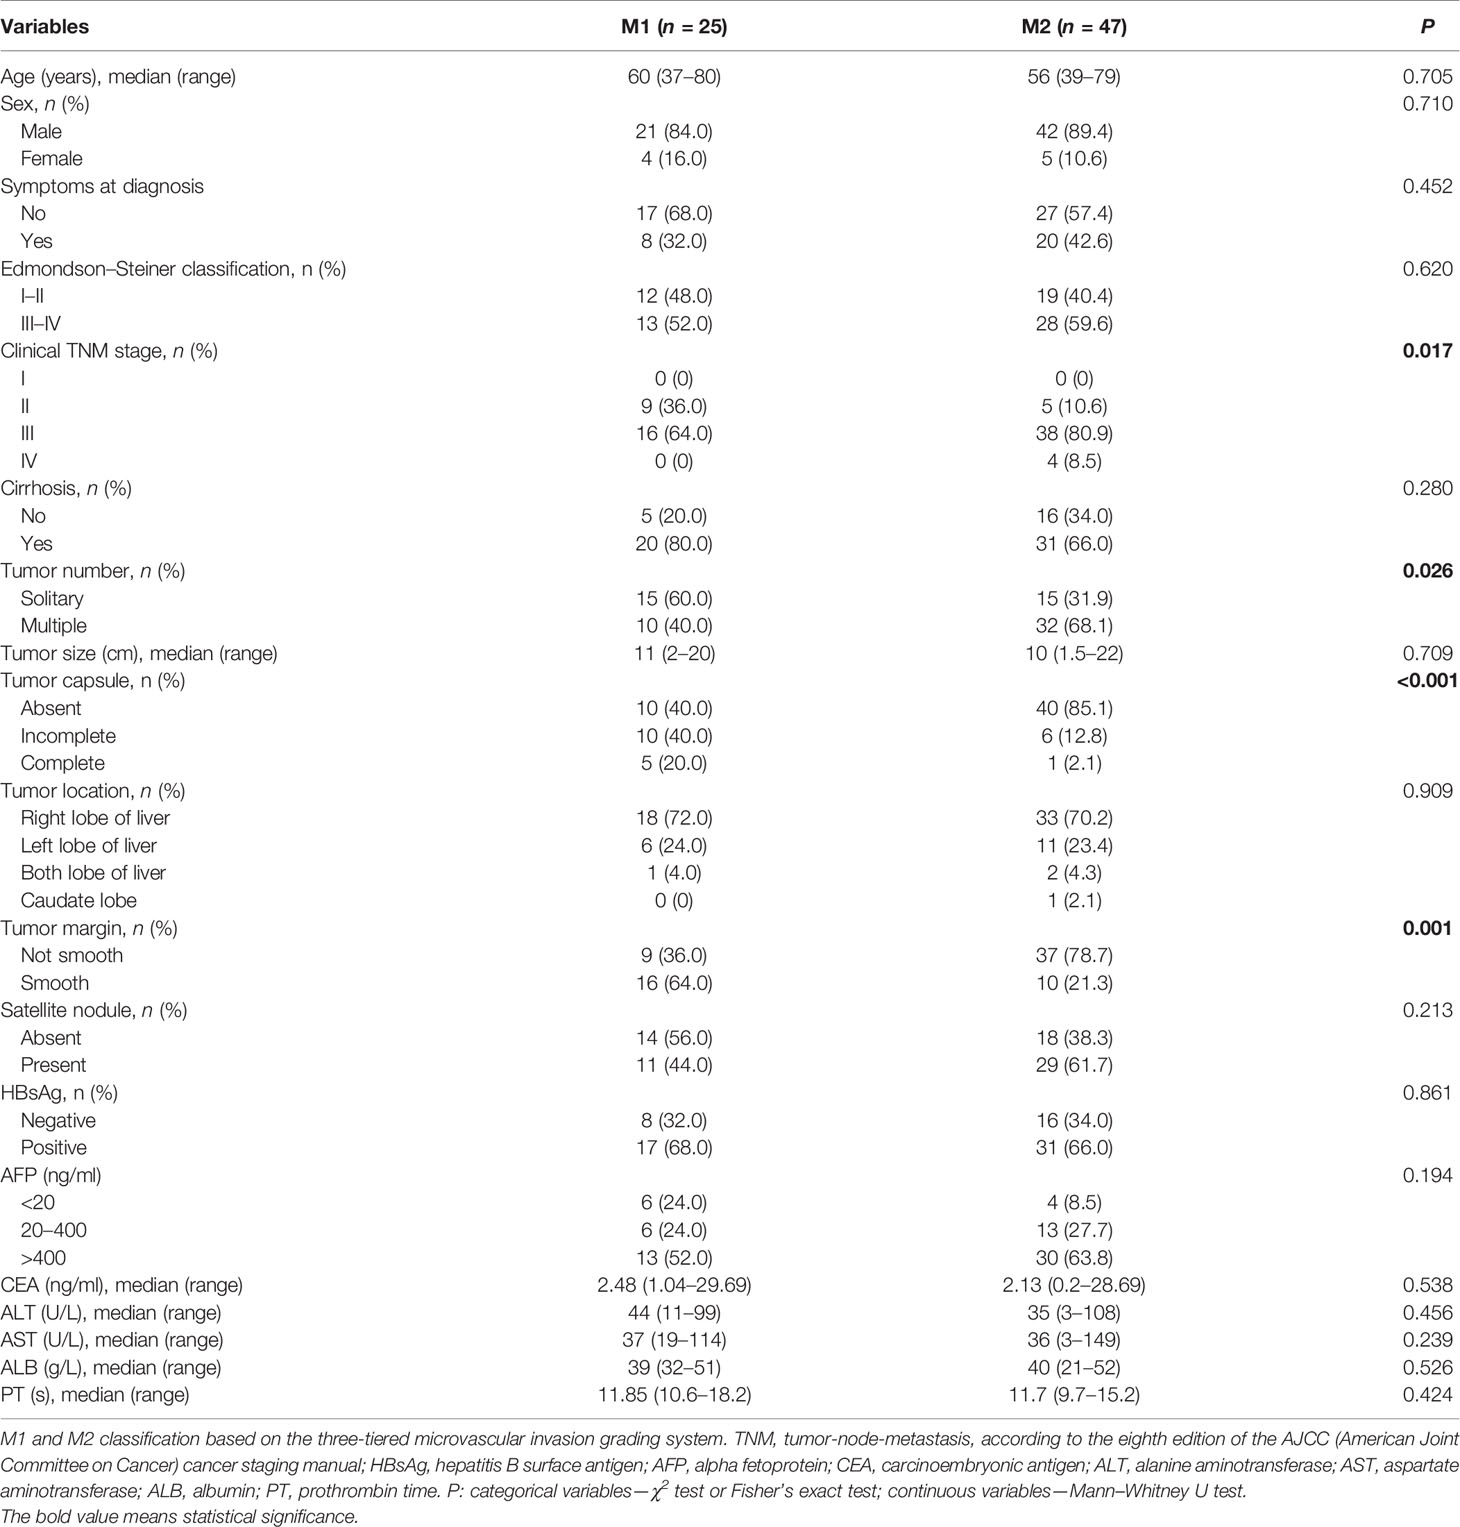
Table 2 Clinical characteristics comparison in HCC patients with different degrees of MVI.
Independent Significant Factors for the Presence of MVI and Its M2 Grade
In comparison of the clinicopathological characteristics between the MVI-positive and MVI-negative groups, eight variables, namely, clinical TNM stage, α-fetoprotein (AFP), Edmondson–Steiner classification, tumor size, tumor number, tumor capsule, tumor margin, and satellite nodule, were significantly associated with the MVI according to the univariate analysis (Table 1). Nevertheless, among MVI-positive cases, only clinical TNM stage, tumor number, tumor capsule, and tumor margin showed statistical correlation with M2 grade (Table 2). Furthermore, clinical TNM stage, Edmondson–Steiner classification, tumor size, tumor capsule, tumor margin, and AFP were found to be independent risk factors of MVI by multivariate analysis; interestingly, when MVI was present, three variables of tumor number, tumor capsule, and tumor margin were highly associated with M2 grade from the result of multivariate analysis (Table 3).
TABLE 3
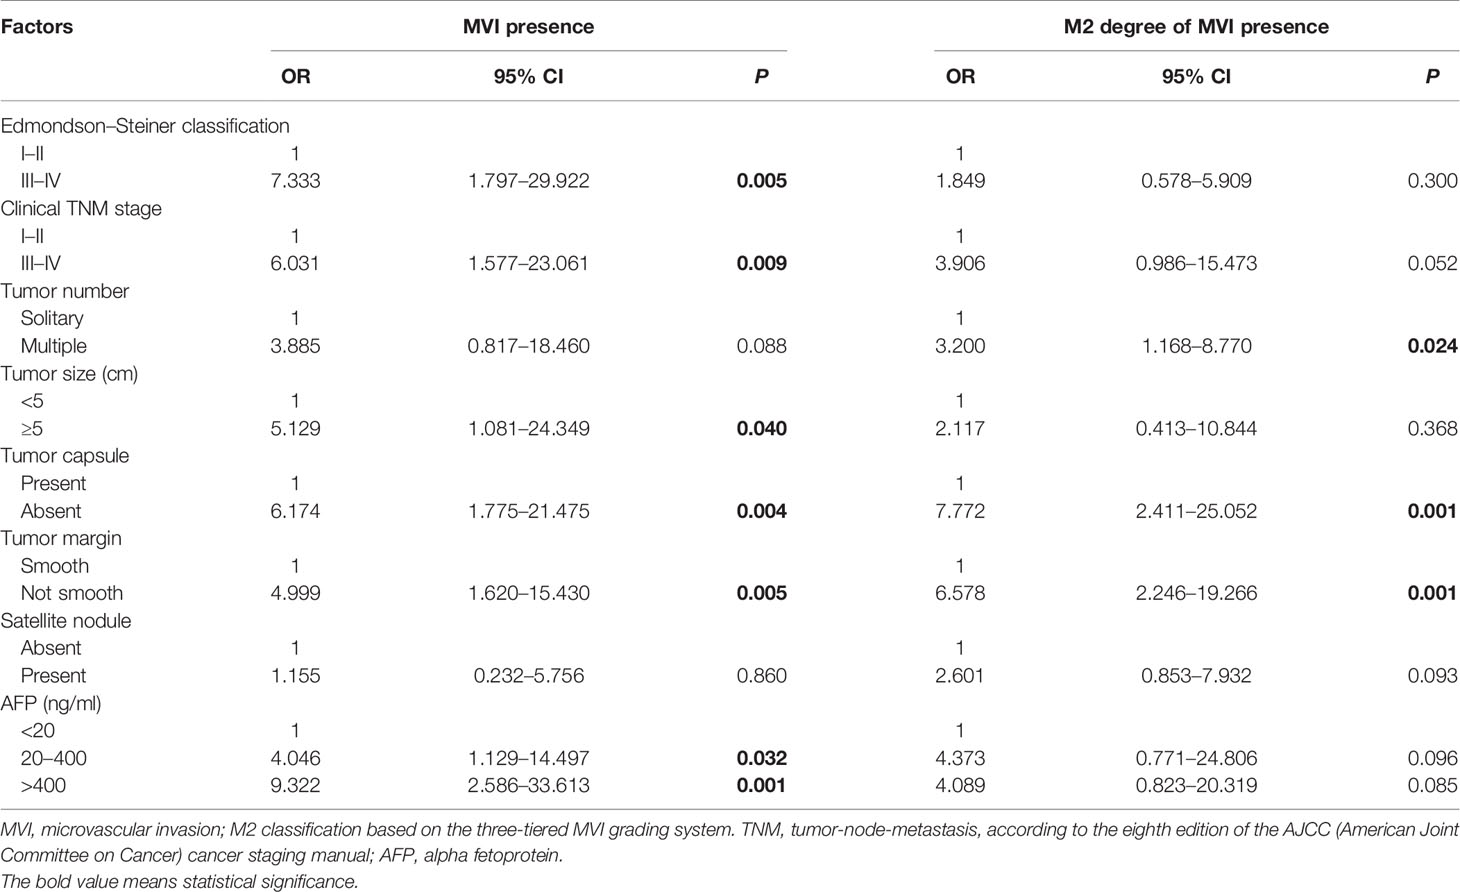
Table 3 Risk factors for MVI and its M2 grade identified by logistic multivariate analysis.
Identification of Predictive Factors by LASSO Regression
In total, 19 variables were analyzed by LASSO regression and 8 candidate factors were determined to be associated with MVI (Figure 2A). These factors were clinical TNM stage, alanine aminotransferase (ALT), AFP, Edmondson–Steiner classification, tumor size, tumor capsule, tumor margin, and tumor number. Among the patients with MVI presence, clinical TNM stage, tumor capsule, tumor margin, and aspartate transaminase (AST) were selected and identified as risk factors of M2 grade by using LASSO regression analysis (Figure 2B). The coefficients of selected parameters associated with MVI and its M2 grade are shown in Table S1.
FIGURE 2
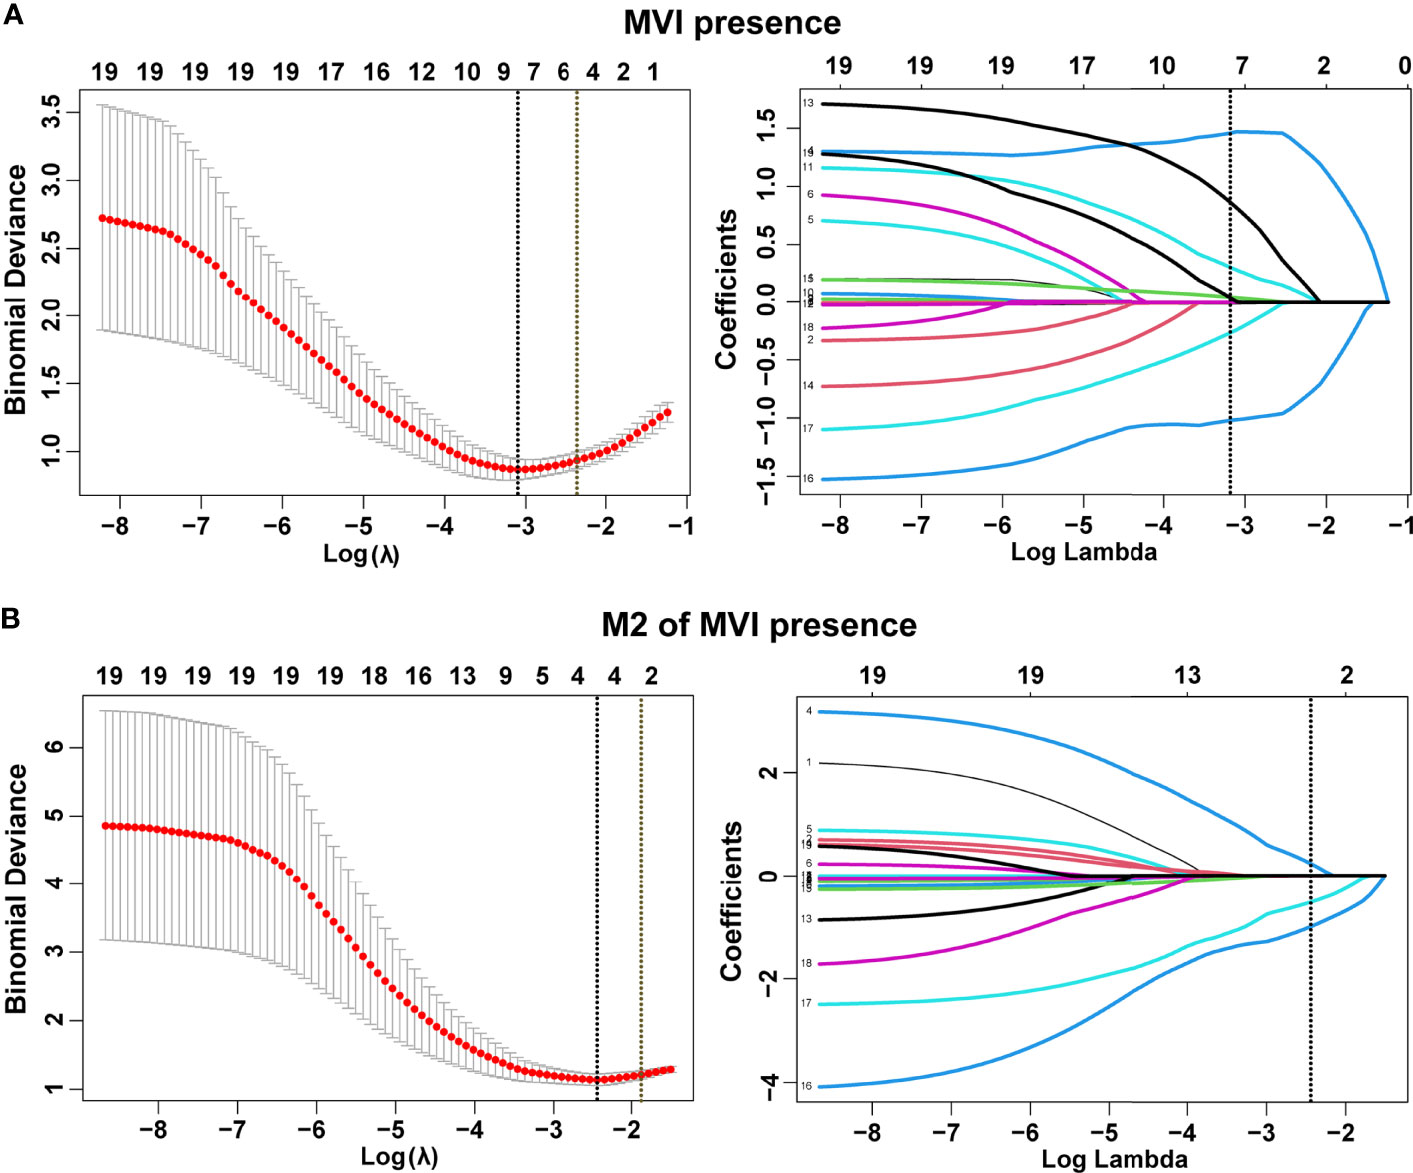
Figure 2 Selection of demographic and clinical features using the least absolute shrinkage and selection operator (LASSO) regression model. Selection of tuning parameter (λ) in the LASSO model by three-fold cross-validation based on minimum criteria for MVI (A) and its M2 grade (B). Dotted vertical lines were drawn at the optimal values using the minimum criteria and the 1 standard error of the minimum criteria (1-SE criteria). All features with non-zero coefficients are indicated on the right of (A, B).
Confirmation of the Best Prediction Model for MVI and M2 Grade
The base model (model 1) was then created by incorporating six variables (Edmondson–Steiner classification, clinical TNM stage, tumor size, tumor capsule, tumor margin, and AFP) determined to be associated with MVI both in logistic and LASSO analyses. By severally adding ALT and tumor number to model 1, we constructed two new models named model 2 and model 3. Taking model 1 as the reference, model 2 did not exhibit superiority for predicting MVI. Adding tumor number to model 1 did not appreciably change the AUC and IDI, but led to a significant improvement in the continuous NRI (cNRI) (Table 4), which indicated that model 2 was superior to model 1 in MVI prediction. Moreover, among HCC patients with MVI presence, tumor capsule and tumor margin were both confirmed by LASSO and logistic regression to be related with M2 grade. So the second base model (model A) was established by incorporating tumor capsule and tumor margin. Subsequently, we developed model B, model C, and model D by respectively adding clinical TNM stage, AST, and tumor number to the base model A and found that model B and model D are better than model A for predicting M2 grade in the presence of MVI (model B vs. model A, cNRI = 0.507, p = 0.017; model D vs. model A, cNRI = 0.562, p = 0.019), whereas model C did not show any superiority in M2 prediction (Table 4), suggesting that clinical TNM stage and tumor number can be definitely considered as the risk factors of M2 grade when MVI is present.
TABLE 4
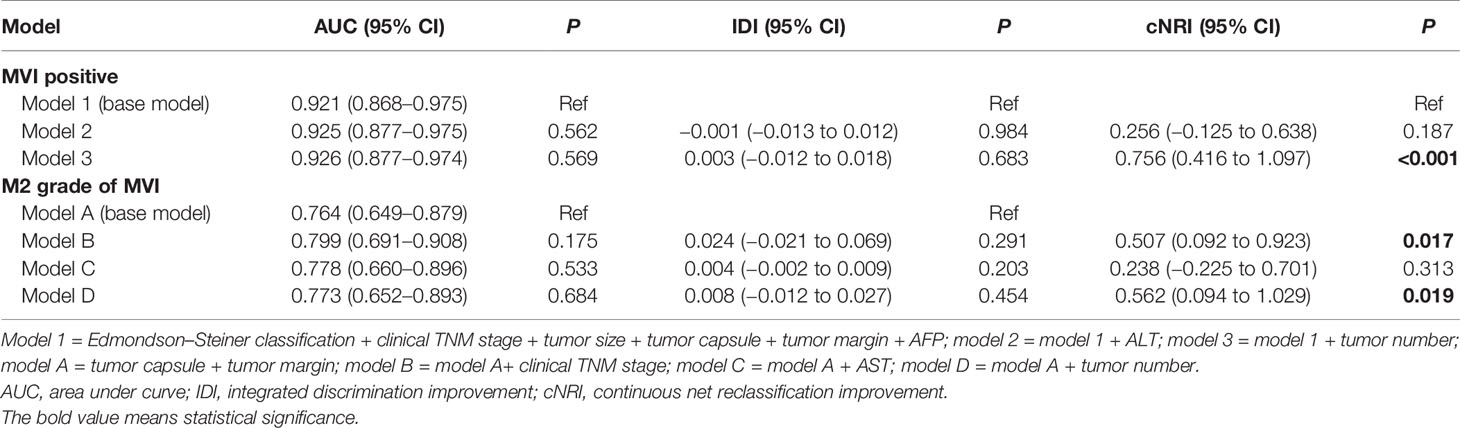
Table 4 Comparison of different prediction models for estimating the risk of MVI and its M2 grade.
Development and Validation of Nomograms for Predicting MVI and Its M2 Grade
A nomogram incorporating Edmondson–Steiner classification, clinical TNM stage, tumor size, tumor capsule, tumor margin, AFP, and tumor number was constructed for MVI prediction (Figure 3A). In the presence of MVI, a second nomogram for predicting M2 grade was developed by using four variables, namely, clinical TNM stage, tumor capsule, tumor margin, and tumor number (Figure 3B). Calibration curves of the two nomograms demonstrated good consistency between the predicted and observed results regarding the MVI status and its M2 classification (Figure 3C). The AUC of the nomogram predicting MVI was 0.926, and the AUC of the nomogram for M2 grade prediction in MVI-positive cases was 0.803 (Figure 3D).
FIGURE 3
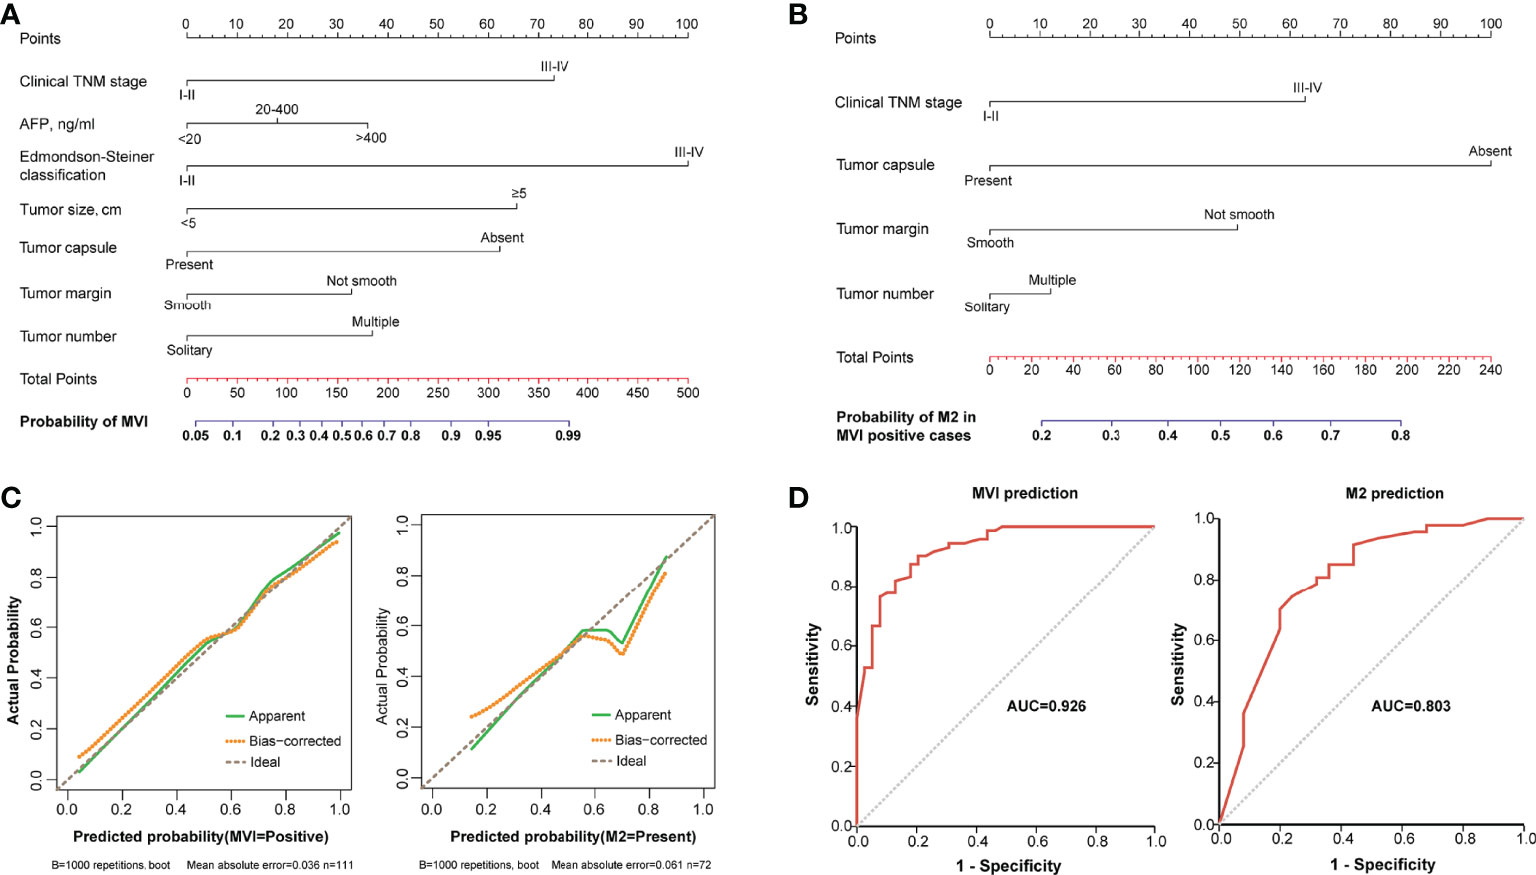
Figure 3 The nomograms and their calibration and discrimination. (A) The MVI nomogram was built by incorporating clinical TNM stage, AFP, Edmondson–Steiner classification, tumor size, tumor capsule, tumor margin, and tumor number. (B) Among the MVI-positive cases, clinical TNM stage, tumor capsule, tumor margin, and tumor number were used to establish another nomogram for predicting M2 grade. Locate the patient’s characteristic on a variable row and draw a vertical line straight up to the points’ row (top) to assign a point value for the variable. Adding up the total number of points and drop a vertical line from the total points’ row to obtain the probability of predictive outcomes. (C) The calibration curves of the two nomograms based on internal validation with a bootstrap resampling frequency of 1,000. (D) The ROC curves with AUCs of 0.926 and 0.803 to demonstrate the discriminatory ability of the two nomograms.
Clinical Use of the Nomograms for MVI and Its M2 Grade Prediction
Each variable displayed in the two nomograms was assigned a risk score. The detailed scores of these variables are presented in Table S2. The final total scores that ranged from 0 to 407 (MVI nomogram) and 0 to 225 (M2 nomogram) were obtained by summing the scores of each variable. The optimal cutoff values of the total scores were confirmed by the maximum Youden index in ROC curve analysis (Tables S3 and S4). Based on the cutoff scores of 172 from the MVI nomogram and 163 from the M2 nomogram, HCC patients were being divided into low- and high-risk groups. The high-risk groups had a significantly greater probability of having MVI and were classified as M2 grade (Figure 4). Then DCA results revealed that using the two nomograms to predict MVI and its M2 grade for almost all threshold probabilities at different points added more net benefit than the treat-all or treat-none strategies (Figures 5A, B), suggesting good clinical utility of the two nomograms. For the purpose of understanding their significance more intuitively, clinical impact curves of the nomograms for prediction in MVI and its M2 grade were plotted (Figures 5C, D), and the distance between the curve of the high-risk predicted number (the gray curve) and the curve of the high-risk actual number (the red curve) was very close in almost all high-risk threshold points, indicating that the two models had remarkable predictive power.
FIGURE 4
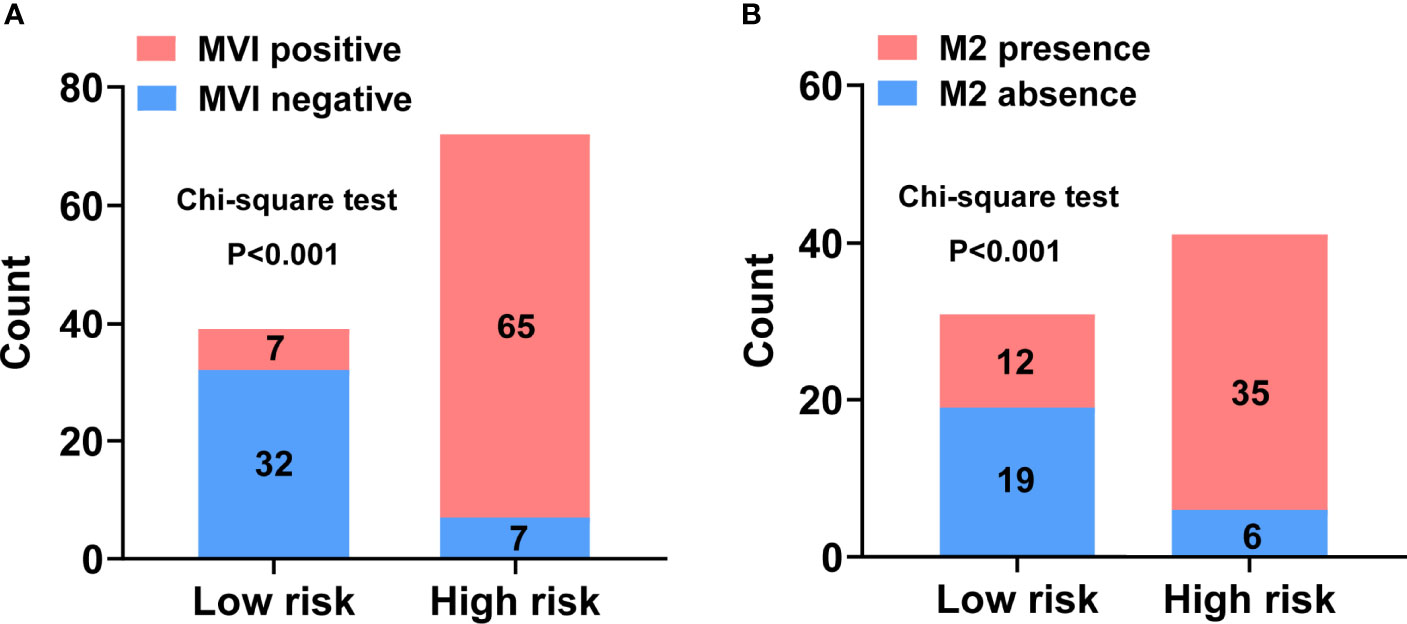
Figure 4 Discriminatory power of the nomograms for MVI and its M2 grade with bar charts. Risk classification of the predictive nomograms conducted by the maximum Youden index, and the performance in distinguishing the MVI (A) and its M2 grade (B). P-values were calculated by the chi-square test.
FIGURE 5
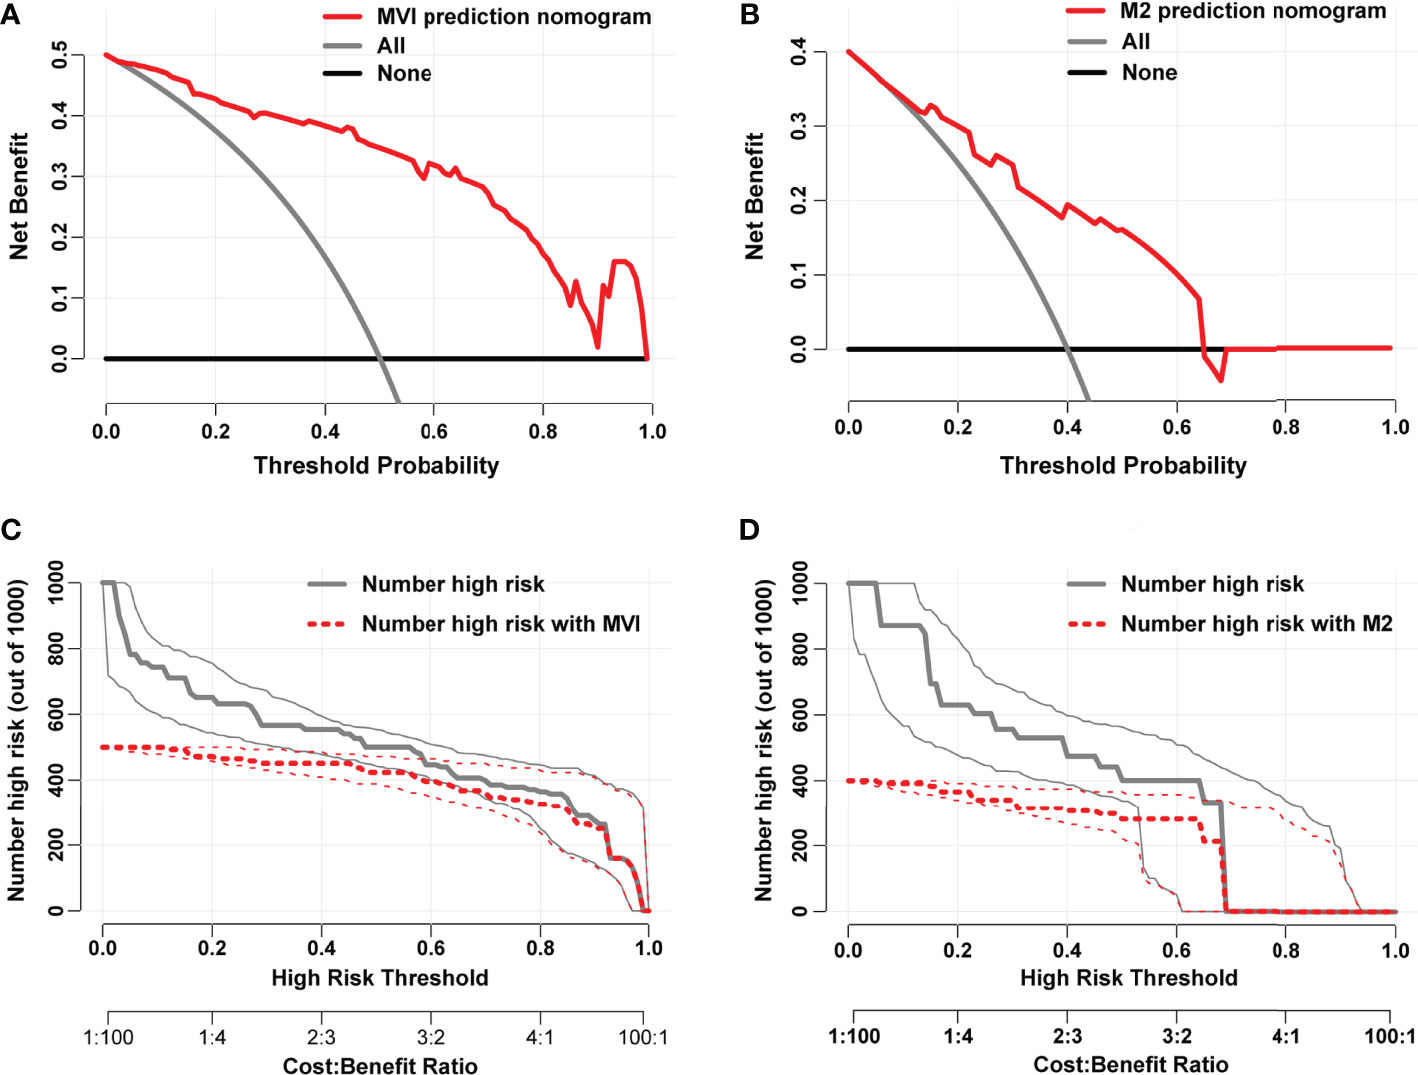
Figure 5 Decision curves of the nomograms for predicting presence of MVI (A) and its M2 grade (B). The horizontal solid black line represents the hypothesis that no patients experienced the presence of MVI or its M2 grade, and the solid gray line represents the hypothesis that all patients met the endpoint. Clinical impact curves of the nomograms for MVI and its M2 grade prediction, respectively, were plotted in (C, D). At different threshold probabilities within a given population, the number of high-risk patients and the number of high-risk patients with the outcome were shown.
Discussion
The long-term prognosis of HCC patients at early- to intermediate-stage after curative therapies is still poor, mainly due to the high recurrence rate after primary resection (7). Being considered as an important marker of HCC aggressive behavior, MVI could greatly affect intrahepatic metastasis of tumor cells via the portal circulation (27) and lead to tumor recurrence after curative surgery (28). Among MVI-positive cases, the M2 grade is an obvious indicator of HCC poor prognosis. The tumor microenvironment of HCC with MVI-M2 grade provides a favorable condition for tumor rapid growth and aggressive invasion, resulting in a true R0 surgical resection which is difficult to achieve (18). MVI and its M2 classification based on MVI-TTG only can be diagnosed by histopathological examination after surgical resection (17). Hence, it is important to find the significant risk factors of MVI and its M2 grade and develop prediction models by using these factors, which could provide optimal management decision. In the present study, approximately 64.86% of patients (72/111) with HCC harbored MVI, and among these MVI-positive cases, 47 patients (65.28%) were classified as M2 grade. Our analysis also suggested that later clinical tumor stage, higher AFP, more advanced Edmondson–Steiner classification, larger tumor size, tumor capsule absence, non-smooth tumor margin, and multiple tumor number were significantly associated with MVI, and patients with MVI-M2 among these MVI-positive cases were more likely to have later clinical tumor stage, absent tumor capsule, non-smooth tumor margin, and multiple tumor number.
Almost all studies indicated that tumor size was associated with MVI. However, the correlation between tumor size classification and MVI remained controversial. A study from an international multicenter database showed that the incidence of MVI increased with the tumor size of resected HCC (tumor size, MVI incidence: ≤3 cm, 25%; 3.1–5 cm, 40%; 5.1–6.5 cm, 55%; >6.5 cm, 63%) (29). Kim et al. (30) and Siegel et al. (31) respectively reported that tumor size more than 2 or 3 cm was a risk factor of MVI. In our study, we found that tumor size was also correlated with MVI; especially HCCs more than 5 cm increased the probability of MVI formation. Interestingly, in MVI-positive patients, there is no significant difference in tumor size between M1 and M2 grades. It is speculated that tumor size may only play a role in tumor cells if they can invade the microvessels. Once MVI is present, the tumor size perhaps has little to do with the site number of MVI. According to histological examination, MVI-positive tumors have a strong aggressive tendency to invade the tumor encapsulation, making the tumor margin irregular (32). Among MVI-positive patients, 67% HCCs were found irregular or had non-smooth margin (33). Consistently, in this study, absent tumor capsule and non-smooth tumor margin were demonstrated to be the independent risk factors of MVI. Besides, we also found that tumor capsule and tumor margin have a significant difference between M1 and M2 grades in MVI-positive cases.
What is more, several studies have identified that multiple tumors and elevated AFP levels are associated with an increased probability of vascular invasion in HCCs (9, 34, 35). Similarly, our study demonstrated that AFP was also significantly associated with MVI presence, but the tumor number did not seem to be an independent risk factor of MVI. The P-value (0.088) of tumor number in multivariate analysis for MVI risk factor estimation was close to 0.05, which might show statistical significance if this study had a much larger sample size. In contrast, high serum AFP level did not appear to correlate with MVI-M2 grade, while MVI-positive patients with multiple tumors were more likely to be M2 grade according to our multivariate logistic analysis, meaning that the serum AFP level does not affect the number of MVI sites but cases with multiple tumors have more MVI sites. Clinical TNM stage is an important reference for evaluating the prognosis of HCC patients and is a comprehensive variable that integrates tumor size, number of tumor lesions, lymph node metastasis, and distant metastasis, and generally assessed by radiological imaging before surgery. The Edmondson–Steiner classification represents the degree of HCC differentiation. The preoperative true diagnosis of HCC is usually by liver biopsy. When HCC diagnosis was confirmed, information of the HCC differentiation also can be obtained simultaneously. In multivariate logistic analysis, we found that clinical TNM stage and Edmondson–Steiner classification were significantly related to MVI yet not the independent predictors of MVI-M2 grade. From the result of multivariate logistic analysis for M2 risk factors, clinical TNM stage P-value (0.052) was extremely close to 0.05. Meanwhile, given the remarkable impact of clinical TNM stage on the prognosis of HCC patients, we speculated that this variable may also be a predictor of MVI-M2 grade.
Subsequently, we found that clinical TNM stage, AFP, Edmondson–Steiner classification, tumor size, tumor capsule, tumor margin, tumor number, and ALT were risk factors for MVI formation based on the LASSO regression analysis. Also, in patients with MVI presence, clinical TNM stage, AST, tumor capsule, and tumor margin were related to M2 classification. However, in the logistic regression results, ALT and tumor number were not independent risk factors for MVI, and clinical stage and AST were not associated with M2 grade when MVI was present. In addition, according to the LASSO regression results, there was no correlation between tumor number and M2 grade among MVI-positive patients. Therefore, in order to further explore whether ALT and tumor number are independent risk factors for the formation of MVI, we established model 2 and model 3 by respectively adding ALT and tumor number to model 1 (base model incorporating clinical TNM stage, AFP, Edmondson–Steiner classification, tumor size, tumor capsule, and tumor margin). The cNRI analysis revealed a remarkable MVI prediction improvement in model 3, whereas no significant MVI prediction improvement was observed in model 2 compared with model 1, which means that tumor number can be considered as an independent predictive factor of MVI presence. Additionally, to further clarify whether clinical stage, tumor number, and AST correlate with M2 classification in the presence of MVI, we constructed three new models named model B, model C, and model D by adding clinical tumor stage, AST, and tumor number, respectively, to model A (base model including tumor capsule and tumor margin). Taking model A as reference, the cNRI analysis showed that model B and model D significantly improved the M2 prediction, but model C did not have improvement of predictive ability for M2 in MVI-positive cases, indicating that clinical tumor stage and tumor number are the true predictors of M2 grade.
The nomogram has been recognized as a user-friendly and practical prediction tool with high accuracy and good discriminative power and is widely used in the evaluation of prognosis or an outcome event (36, 37). Hence, a nomogram was developed for MVI prediction by incorporating Edmondson–Steiner classification, clinical TNM stage, tumor margin, AFP level, tumor size, tumor capsule, and tumor number, and a nomogram including clinical TNM stage, tumor capsule, tumor margin, and tumor number was also built for predicting M2 classification in the presence of MVI. Both nomograms demonstrated good consistency between the predicted probabilities and the actual observations according to the optimal calibration curves. Furthermore, satisfactory diagnostic performance was found in these two nomograms with AUCs of 0.926 (AUCMVI) and 0.803 (AUCM2). Then the cutoff values of total points were determined as 172 in the MVI nomogram and 163 in the M2 nomogram according to the maximum Youden index from ROC analysis. Patients with a total score of >172 were a high-risk subgroup of MVI and those with a score of >163 were considered as high-risk of M2 grade when MVI was present, which could guide us to make the best treatment decision. Moreover, we also opted to conduct a DCA to determine the clinical utility of our nomogram. DCA is a novel method to evaluate the clinical benefits of diagnostic tests and prediction models (38). Here, great net benefit of the established nomograms with the risk threshold more than 0.2 was shown in DCA, indicating good clinical utility of the two nomograms. In addition, excellent predictive power of the two nomograms was further determined by plotting the clinical impact curves.
Although most previous studies generally split the dataset randomly into two groups of training set and validation set, this was not adopted in our study due to limitation of sample size. Besides, this approach did not fully utilize all available data to develop the prediction model, resulting in statistical inefficiency or even waste (39). HCC patients of our study both had positive and negative HBsAg, and the established nomogram showed satisfactory discriminative performance regardless of HBV infection, indicating that our prediction model might comparably be suitable for HCC caused by viral hepatitis and non-viral hepatitis. It is a pity that this study still had several limitations. Firstly, this was a retrospective study with a small sample size and had an inevitable case selection bias. So a large sample size prospective study with balanced populations is required to further confirm the reliability of our nomograms in the future. Secondly, our study was only conducted at a single institute and did not have any validation. It is necessary to validate our results by using data from multiple centers. Finally, the nomograms were established just based on the limited clinical data; thus, specific genetic markers need to be identified and incorporated into nomograms to further advance the prediction accuracy of the nomograms.
In conclusion, the Edmondson–Steiner classification, clinical TNM stage, tumor margin, AFP level, tumor size, tumor capsule, and tumor number were identified as significant predictive factors for MVI in HCC patients, and clinical TNM stage, tumor capsule, tumor margin, and tumor number were confirmed as independent predictors of M2 grade among MVI-positive cases. Then two wieldy nomograms were developed by incorporating these variables above, making individualized prediction of MVI and its M2 grade more objective and accurate. Judging from the two nomogram scoring systems, more aggressive treatment may be recommended to reduce potential future recurrence if patients are considered as high risk of MVI and perhaps classified into M2 grade. Last but not least, our nomograms can improve individualized therapy design and facilitate monitoring plan selection, which may lead to effective and curative treatment initiation for HCC patients.
Data Availability Statement
The raw data supporting the conclusions of this article will be made available by the authors, without undue reservation.
Ethics Statement
The studies involving human participants were reviewed and approved by the Ethics Committee of Zhejiang Cancer Hospital. Written informed consent for participation was not required for this study in accordance with the national legislation and the institutional requirements.
Author Contributions
SW and SC conceived the idea and designed the study. RR and JY collected the data. CW and YG analyzed the data. SC, CW, and YG drafted the manuscript. All authors contributed to the article and approved the submitted version.
Funding
This study was funded by the Medical Health Science and Technology Project of Zhejiang Province(No.2022KY619).
Conflict of Interest
The authors declare that the research was conducted in the absence of any commercial or financial relationships that could be construed as a potential conflict of interest.
Publisher’s Note
All claims expressed in this article are solely those of the authors and do not necessarily represent those of their affiliated organizations, or those of the publisher, the editors and the reviewers. Any product that may be evaluated in this article, or claim that may be made by its manufacturer, is not guaranteed or endorsed by the publisher.
Acknowledgments
We would like to thank the researchers and study participants for their contributions.
Supplementary Material
The Supplementary Material for this article can be found online at: https://www.frontiersin.org/articles/10.3389/fonc.2021.774800/full#supplementary-material
References
1. Sung H, Ferlay J, Siegel RL, Laversanne M, Soerjomataram I, Jemal A, et al. Global Cancer Statistics 2020: GLOBOCAN Estimates of Incidence and Mortality Worldwide for 36 Cancers in 185 Countries. CA: Cancer J Clin (2021) 0:1–41. doi: 10.3322/caac.21660
2. Zhou M, Wang H, Zeng X, Yin P, Zhu J, Chen W, et al. Mortality, Morbidity, and Risk Factors in China and Its Provinces, 1990-2017: A Systematic Analysis for the Global Burden of Disease Study 2017. Lancet (2019) 394:1145–58. doi: 10.1016/S0140-6736(19)30427-1
3. Chen W, Zheng R, Baade PD, Zhang S, Zeng H, Bray F, et al. Cancer Statistics in China, 2015. CA Cancer J Clin (2016) 66:115–32. doi: 10.3322/caac.21338
4. Islami F, Miller KD, Siegel RL, Fedewa SA, Ward EM, Jemal A. Disparities in Liver Cancer Occurrence in the United States by Race/Ethnicity and State. CA Cancer J Clin (2017) 67:273–89. doi: 10.3322/caac.21402
5. Sherman M. Recurrence of Hepatocellular Carcinoma. N Engl J Med (2008) 359:2045–7. doi: 10.1056/NEJMe0807581
6. Erstad DJ, Tanabe KK. Prognostic and Therapeutic Implications of Microvascular Invasion in Hepatocellular Carcinoma. Ann Surg Oncol (2019) 26:1474–93. doi: 10.1245/s10434-019-07227-9
7. Tabrizian P, Jibara G, Shrager B, Schwartz M, Roayaie S. Recurrence of Hepatocellular Cancer After Resection: Patterns, Treatments, and Prognosis. Ann Surg (2015) 261:947–55. doi: 10.1097/SLA.0000000000000710
8. Wang H, Qian YW, Wu MC, Cong WM. Liver Resection Is Justified in Patients With BCLC Intermediate Stage Hepatocellular Carcinoma Without Microvascular Invasion. J Gastrointest Surg (2020) 24:2737–47. doi: 10.1007/s11605-019-04251-8
9. Rodriguez-Peralvarez M, Luong TV, Andreana L, Meyer T, Dhillon AP, Burroughs AK. A Systematic Review of Microvascular Invasion in Hepatocellular Carcinoma: Diagnostic and Prognostic Variability. Ann Surg Oncol (2013) 20:325–39. doi: 10.1245/s10434-012-2513-1
10. Chong H, Yang L, Sheng R, Yu Y, Wu D, Rao S, et al. Multi-Scale and Multi-Parametric Radiomics of Gadoxetate Disodium–Enhanced MRI Predicts Microvascular Invasion and Outcome in Patients With Solitary Hepatocellular Carcinoma ≤ 5 cm. Eur Radiol (2021) 31:4824–38. doi: 10.1007/s00330-020-07601-2
11. Wang L, Jin YX, Ji YZ, Mu Y, Zhang SC, Pan SY. Development and Validation of a Prediction Model for Microvascular Invasion in Hepatocellular Carcinoma. World J Gastroenterol (2020) 26:1647–59. doi: 10.3748/wjg.v26.i14.1647
12. Lim KC, Chow PK, Allen JC, Chia GS, Lim M, Cheow PC, et al. Microvascular Invasion is a Better Predictor of Tumor Recurrence and Overall Survival Following Surgical Resection for Hepatocellular Carcinoma Compared to the Milan Criteria. Ann Surg (2011) 254:108–13. doi: 10.1097/SLA.0b013e31821ad884
13. Xiao H, Chen ZB, Jin HL, Li B, Xu LX, Guo Y, et al. Treatment Selection of Recurrent Hepatocellular Carcinoma With Microvascular Invasion at the Initial Hepatectomy. Am J Transl Res (2019) 11:1864–75.
14. Imai K, Yamashita YI, Yusa T, Nakao Y, Itoyama R, Nakagawa S, et al. Microvascular Invasion in Small-Sized Hepatocellular Carcinoma: Significance for Outcomes Following Hepatectomy and Radiofrequency Ablation. Anticancer Res (2018) 38:1053–60. doi: 10.21873/anticanres.12322
15. Hu HT, Wang Z, Kuang M, Wang W. Need for Normalization: The Non-Standard Reference Standard for Microvascular Invasion Diagnosis in Hepatocellular Carcinoma. World J Surg Oncol (2018) 16:50. doi: 10.1186/s12957-018-1347-0
16. Chen ZH, Zhang XP, Wang H, Chai ZT, Sun JX, Guo WX, et al. Effect of Microvascular Invasion on the Postoperative Long-Term Prognosis of Solitary Small HCC: A Systematic Review and Meta-Analysis. HPB (Oxf) (2019) 21:935–44. doi: 10.1016/j.hpb.2019.02.003
17. Cong W, Bu H, Chen J, Dong H, Zhu Y, Feng L, et al. Practice Guidelines for the Pathological Diagnosis of Primary Liver Cancer: 2015 Update. World J Gastroentero (2016) 22:9279. doi: 10.3748/wjg.v22.i42.9279
18. Sheng X, Ji Y, Ren GP, Lu CL, Yun JP, Chen LH, et al. A Standardized Pathological Proposal for Evaluating Microvascular Invasion of Hepatocellular Carcinoma: A Multicenter Study by LCPGC. Hepatol Int (2020) 14:1034–47. doi: 10.1007/s12072-020-10111-4
19. Yang P, Si A, Yang J, Cheng Z, Wang K, Li J, et al. A Wide-Margin Liver Resection Improves Long-Term Outcomes for Patients With HBV-Related Hepatocellular Carcinoma With Microvascular Invasion. Surgery (2019) 165:721–30. doi: 10.1016/j.surg.2018.09.016
20. Wang H, Du PC, Wu MC, Cong WM. Postoperative Adjuvant Transarterial Chemoembolization for Multinodular Hepatocellular Carcinoma Within the Barcelona Clinic Liver Cancer Early Stage and Microvascular Invasion. Hepatobil Surg Nutr (2018) 7:418–28. doi: 10.21037/hbsn.2018.09.05
21. Wu TH, Hatano E, Yamanaka K, Seo S, Taura K, Yasuchika K, et al. A Non-Smooth Tumor Margin on Preoperative Imaging Predicts Microvascular Invasion of Hepatocellular Carcinoma. Surg Today (2016) 46:1275–81. doi: 10.1007/s00595-016-1320-x
22. Mao S, Yu X, Yang Y, Shan Y, Mugaanyi J, Wu S, et al. Preoperative Nomogram for Microvascular Invasion Prediction Based on Clinical Database in Hepatocellular Carcinoma. Sci Rep Uk (2021) 11. doi: 10.1038/s41598-021-93528-7
23. Wang K, Liu J, Yan ZL, Li J, Shi LH, Cong WM, et al. Overexpression of Aspartyl-(Asparaginyl)-Beta-Hydroxylase in Hepatocellular Carcinoma is Associated With Worse Surgical Outcome. Hepatology (2010) 52:164–73. doi: 10.1002/hep.23650
24. Sauerbrei W, Royston P, Binder H. Selection of Important Variables and Determination of Functional Form for Continuous Predictors in Multivariable Model Building. Stat Med (2007) 26:5512–28. doi: 10.1002/sim.3148
25. Pencina MJ, D’Agostino RS, Steyerberg EW. Extensions of Net Reclassification Improvement Calculations to Measure Usefulness of New Biomarkers. Stat Med (2011) 30:11–21. doi: 10.1002/sim.4085
26. Cho CS, Gonen M, Shia J, Kattan MW, Klimstra DS, Jarnagin WR, et al. A Novel Prognostic Nomogram is More Accurate Than Conventional Staging Systems for Predicting Survival After Resection of Hepatocellular Carcinoma. J Am Coll Surg (2008) 206:281–91. doi: 10.1016/j.jamcollsurg.2007.07.031
27. Roayaie S, Blume IN, Thung SN, Guido M, Fiel MI, Hiotis S, et al. A System of Classifying Microvascular Invasion to Predict Outcome After Resection in Patients With Hepatocellular Carcinoma. Gastroenterology (2009) 137:850–5. doi: 10.1053/j.gastro.2009.06.003
28. Sumie S, Nakashima O, Okuda K, Kuromatsu R, Kawaguchi A, Nakano M, et al. The Significance of Classifying Microvascular Invasion in Patients With Hepatocellular Carcinoma. Ann Surg Oncol (2014) 21:1002–9. doi: 10.1245/s10434-013-3376-9
29. Pawlik TM, Delman KA, Vauthey JN, Nagorney DM, Ng IO, Ikai I, et al. Tumor Size Predicts Vascular Invasion and Histologic Grade: Implications for Selection of Surgical Treatment for Hepatocellular Carcinoma. Liver Transpl (2005) 11:1086–92. doi: 10.1002/lt.20472
30. Kim BK, Han KH, Park YN, Park MS, Kim KS, Choi JS, et al. Prediction of Microvascular Invasion Before Curative Resection of Hepatocellular Carcinoma. J Surg Oncol (2008) 97:246–52. doi: 10.1002/jso.20953
31. Siegel AB, Wang S, Jacobson JS, Hershman DL, Lim EA, Yu J, et al. Obesity and Microvascular Invasion in Hepatocellular Carcinoma. Cancer Invest (2010) 28:1063–9. doi: 10.3109/07357907.2010.483500
32. Hu H, Zheng Q, Huang Y, Huang XW, Lai ZC, Liu J, et al. A Non-Smooth Tumor Margin on Preoperative Imaging Assesses Microvascular Invasion of Hepatocellular Carcinoma: A Systematic Review and Meta-Analysis. Sci Rep (2017) 7:15375. doi: 10.1038/s41598-017-15491-6
33. Chou CT, Chen RC, Lin WC, Ko CJ, Chen CB, Chen YL. Prediction of Microvascular Invasion of Hepatocellular Carcinoma: Preoperative CT and Histopathologic Correlation. AJR Am J Roentgenol (2014) 203:W253–9. doi: 10.2214/AJR.13.10595
34. Lei Z, Li J, Wu D, Xia Y, Wang Q, Si A, et al. Nomogram for Preoperative Estimation of Microvascular Invasion Risk in Hepatitis B Virus–Related Hepatocellular Carcinoma Within the Milan Criteria. JAMA Surg (2016) 151:356. doi: 10.1001/jamasurg.2015.4257
35. Zhang C, Zhao R, Chen F, Zhu Y, Chen L. Preoperative Prediction of Microvascular Invasion in Non-Metastatic Hepatocellular Carcinoma Based on Nomogram Analysis. Transl Oncol (2021) 14:100875. doi: 10.1016/j.tranon.2020.100875
36. Iasonos A, Schrag D, Raj GV, Panageas KS. How to Build and Interpret a Nomogram for Cancer Prognosis. J Clin Oncol (2008) 26:1364–70. doi: 10.1200/JCO.2007.12.9791
37. Shariat SF, Capitanio U, Jeldres C, Karakiewicz PI. Can Nomograms be Superior to Other Prediction Tools? Bju Int (2009) 103:492–7. doi: 10.1111/j.1464-410X.2008.08073.x
38. Vickers AJ, Cronin AM, Elkin EB, Gonen M. Extensions to Decision Curve Analysis, A Novel Method for Evaluating Diagnostic Tests, Prediction Models and Molecular Markers. BMC Med Inform Decis Mak (2008) 8:53. doi: 10.1186/1472-6947-8-53
Keywords: hepatocellular carcinoma, microvascular invasion (MVI), M2 classification, prediction model, nomogram
Citation: Chen S, Wang C, Gu Y, Ruan R, Yu J and Wang S (2022) Prediction of Microvascular Invasion and Its M2 Classification in Hepatocellular Carcinoma Based on Nomogram Analyses. Front. Oncol. 11:774800. doi: 10.3389/fonc.2021.774800
Received: 11 October 2021; Accepted: 20 December 2021;
Published: 14 January 2022.
Edited by:
Alessandro Vitale, University Hospital of Padua, ItalyReviewed by:
Andrea Laurenzi, University Hospital of Bologna Policlinico S. Orsola-Malpighi, ItalyBaltasar Pérez Saborido, Hospital Universitario Río Hortega, Spain
Copyright © 2022 Chen, Wang, Gu, Ruan, Yu and Wang. This is an open-access article distributed under the terms of the Creative Commons Attribution License (CC BY). The use, distribution or reproduction in other forums is permitted, provided the original author(s) and the copyright owner(s) are credited and that the original publication in this journal is cited, in accordance with accepted academic practice. No use, distribution or reproduction is permitted which does not comply with these terms.
*Correspondence: Shi Wang, wangshi@zjcc.org.cn
†These authors have contributed equally to this work