 Minghao Wu1,2*†
 Yanyan Zhang2†Jianing Zhang2†
 Yuwei Zhang2Yina Wang3
 Feng Chen4
 Yahong Luo5
 Shuai He5
 Yulin Liu6Qian Yang6Yanying Li7Hong Wei8Hong Zhang9Nian Lu10
 Sicong Wang11
 Yan Guo11
 Zhaoxiang Ye2*
 Ying Liu2*
- 1Department of Radiology, Beijing Tiantan Hospital, Capital Medical University, Beijing, China
- 2Department of Radiology, Tianjin Medical University Cancer Institute and Hospital, National Clinical Research Center for Cancer, Key Laboratory of Cancer Prevention and Therapy, Tianjin’s Clinical Research Center for Cancer, Tianjin, China
- 3Department of Medical Oncology, 1st Affiliated Hospital, Zhejiang University School of Medicine, Hangzhou, China
- 4Department of Radiology, 1st Affiliated Hospital, Zhejiang University School of Medicine, Hangzhou, China
- 5Department of Medical Imaging, Cancer Hospital of China Medical University, Liaoning Cancer Hospital and Institute, Shenyang, China
- 6Department of Radiology, Hubei Cancer Hospital, Tongji Medical College, Huazhong University of Science and Technology, Wuhan, China
- 7Department of Thoracic Oncology, Cancer Center, West China Hospital, Sichuan University, Chengdu, China
- 8Department of Radiology, West China Hospital, Sichuan University, Chengdu, China
- 9Department of Radiology, Tianjin Chest Hospital, Tianjin, China
- 10Department of Radiology, Sun Yat-sen University Cancer Center, State Key Laboratory of Oncology in Southern China, Guangzhou, China
- 11Prognostic Diagnosis, GE Healthcare China, Beijing, China
Objective: Based on non-contrast-enhanced (NCE)/contrast-enhanced (CE) computed tomography (CT) images, we try to identify a combined-radiomics model and evaluate its predictive capacity regarding response to anti-PD1 immunotherapy of patients with non-small-cell lung cancer (NSCLC).
Methods: 131 patients with NSCLC undergoing anti-PD1 immunotherapy were retrospectively enrolled from 7 institutions. Using largest lesion (LL) and target lesions (TL) approaches, we performed a radiomics analysis based on pretreatment NCE-CT (NCE-radiomics) and CE-CT images (CE-radiomics), respectively. Meanwhile, a combined-radiomics model based on NCE-CT and CE-CT images was constructed. Finally, we developed their corresponding nomograms incorporating clinical factors. ROC was used to evaluate models’ predictive performance in the training and testing set, and a DeLong test was employed to compare the differences between different models.
Results: For TL approach, both NCE-radiomics and CE-radiomics performed poorly in predicting response to immunotherapy. For LL approach, NCE-radiomics nomograms and CE-radiomics nomograms incorporating with clinical factor of distant metastasis all showed satisfactory results, reflected by the AUCs in the training (AUC=0.84, 95% CI: 0.75-0.92; AUC=0.77, 95% CI: 0.67-0.87) and test sets (AUC=0.78, 95% CI: 0.64-0.92, AUC=0.73, 95% CI: 0.57-0.88), respectively. Compared with the NCE-radiomics nomograms, the combined-radiomics nomogram showed incremental predictive capacity in the training set (AUC=0.85, 95% CI: 0.77-0.92) and test set (AUC=0.81, 95% CI: 0.67-0.94), respectively, but no statistical difference (P=0.86, P=0.79).
Conclusion: Compared with radiomics based on single NCE or CE-CT images, the combined-radiomics model has potential advantages to identify patients with NSCLC most likely to benefit from immunotherapy, and may effectively improve more precise and individualized decision support.
Introduction
Immunotherapy has revolutionized the therapeutic strategies for non-small cell lung cancer (NSCLC) (1–4). More recently, immune checkpoint inhibitors (ICIs) antibodies targeting the PD-(L)1 axis have revolutionized cancer treatment and improved long-term survival among some patients with locally advanced and metastatic NSCLC (5, 6). Unfortunately, only a small proportion (20-50%) of patients with advanced solid tumors respond to immunotherapy (7–9). Moreover, due to multiple mechanisms of immunotherapy (10), atypical patterns produced by immunotherapy (e.g., durable and/or delayed responses, pseudoprogression, and hyperprogression) cannot be adequately captured by traditional response criteria (11, 12). As immunotherapy is expensive and could bring serious immune-related adverse events (irAEs, such as pneumonitis), it is necessary to stratify patients according to potential benefit before immunotherapy.
Currently, different biomarkers have been investigated with variable success in the selection of patients eligible for cancer immunotherapy, such as FDA-approved PD-L1 expression, microsatellite instability-high and/or mismatch repair status, and tumor mutation burden (TMB) (13–15). However, due to the intratumoral heterogeneity and evolution over time (16, 17), the effective use of these biomarkers as predictive biomarkers is seriously affected by sampling bias (18) and the absence of standardization between different tests (19). Another issue is that patients with negative PD-L1 status may still benefit from anti-PD(L)1 immunotherapy (4, 20, 21). To better predict response to immunotherapy, there is an urgent need to identify alternative predictive biomarkers.
Radiomics can extract quantitative imaging features in a high-throughput manner and assess tumor microenvironment and heterogeneity (22). In recent years, radiomics-based biomarkers have shown success in predicting response to ICIs (23–27). Nevertheless, previous studies have focused on the role of radiomics based on single CE-CT or NCE-CT images, especially CE-CT images (28, 29). A recent study about the diagnosis of solitary pulmonary nodule indicated that the tumor biological heterogeneity depicted by radiomics features may be confounded by the intravenously injected contrast material (30). However, a study suggested there may be a potential complementary value between CE-CT and NCE-CT radiomics in predicting colorectal cancer survival (31). Currently, it is still unknown whether NCE-CT or CE-CT is more favorable for extracting radiomics features in predicting response to ICIs.
In the current study, we compared the efficacy of radiomics models based on NCE and CE-CT images from largest target lesion (LL) and target lesions (TL) approaches in predicting response to ICIs in NSCLC, respectively. At the same time, we also developed a combined-radiomics model based on both NCE-CT and CE-CT images from the LL approach to further improve the prediction efficiency. Finally, we aimed to develop and validate combined-radiomics nomograms based on pretreatment NCE-CT and CE-CT images incorporating clinical factors to predict response to NSCLC immunotherapy. The workflow is presented in Figure 1.
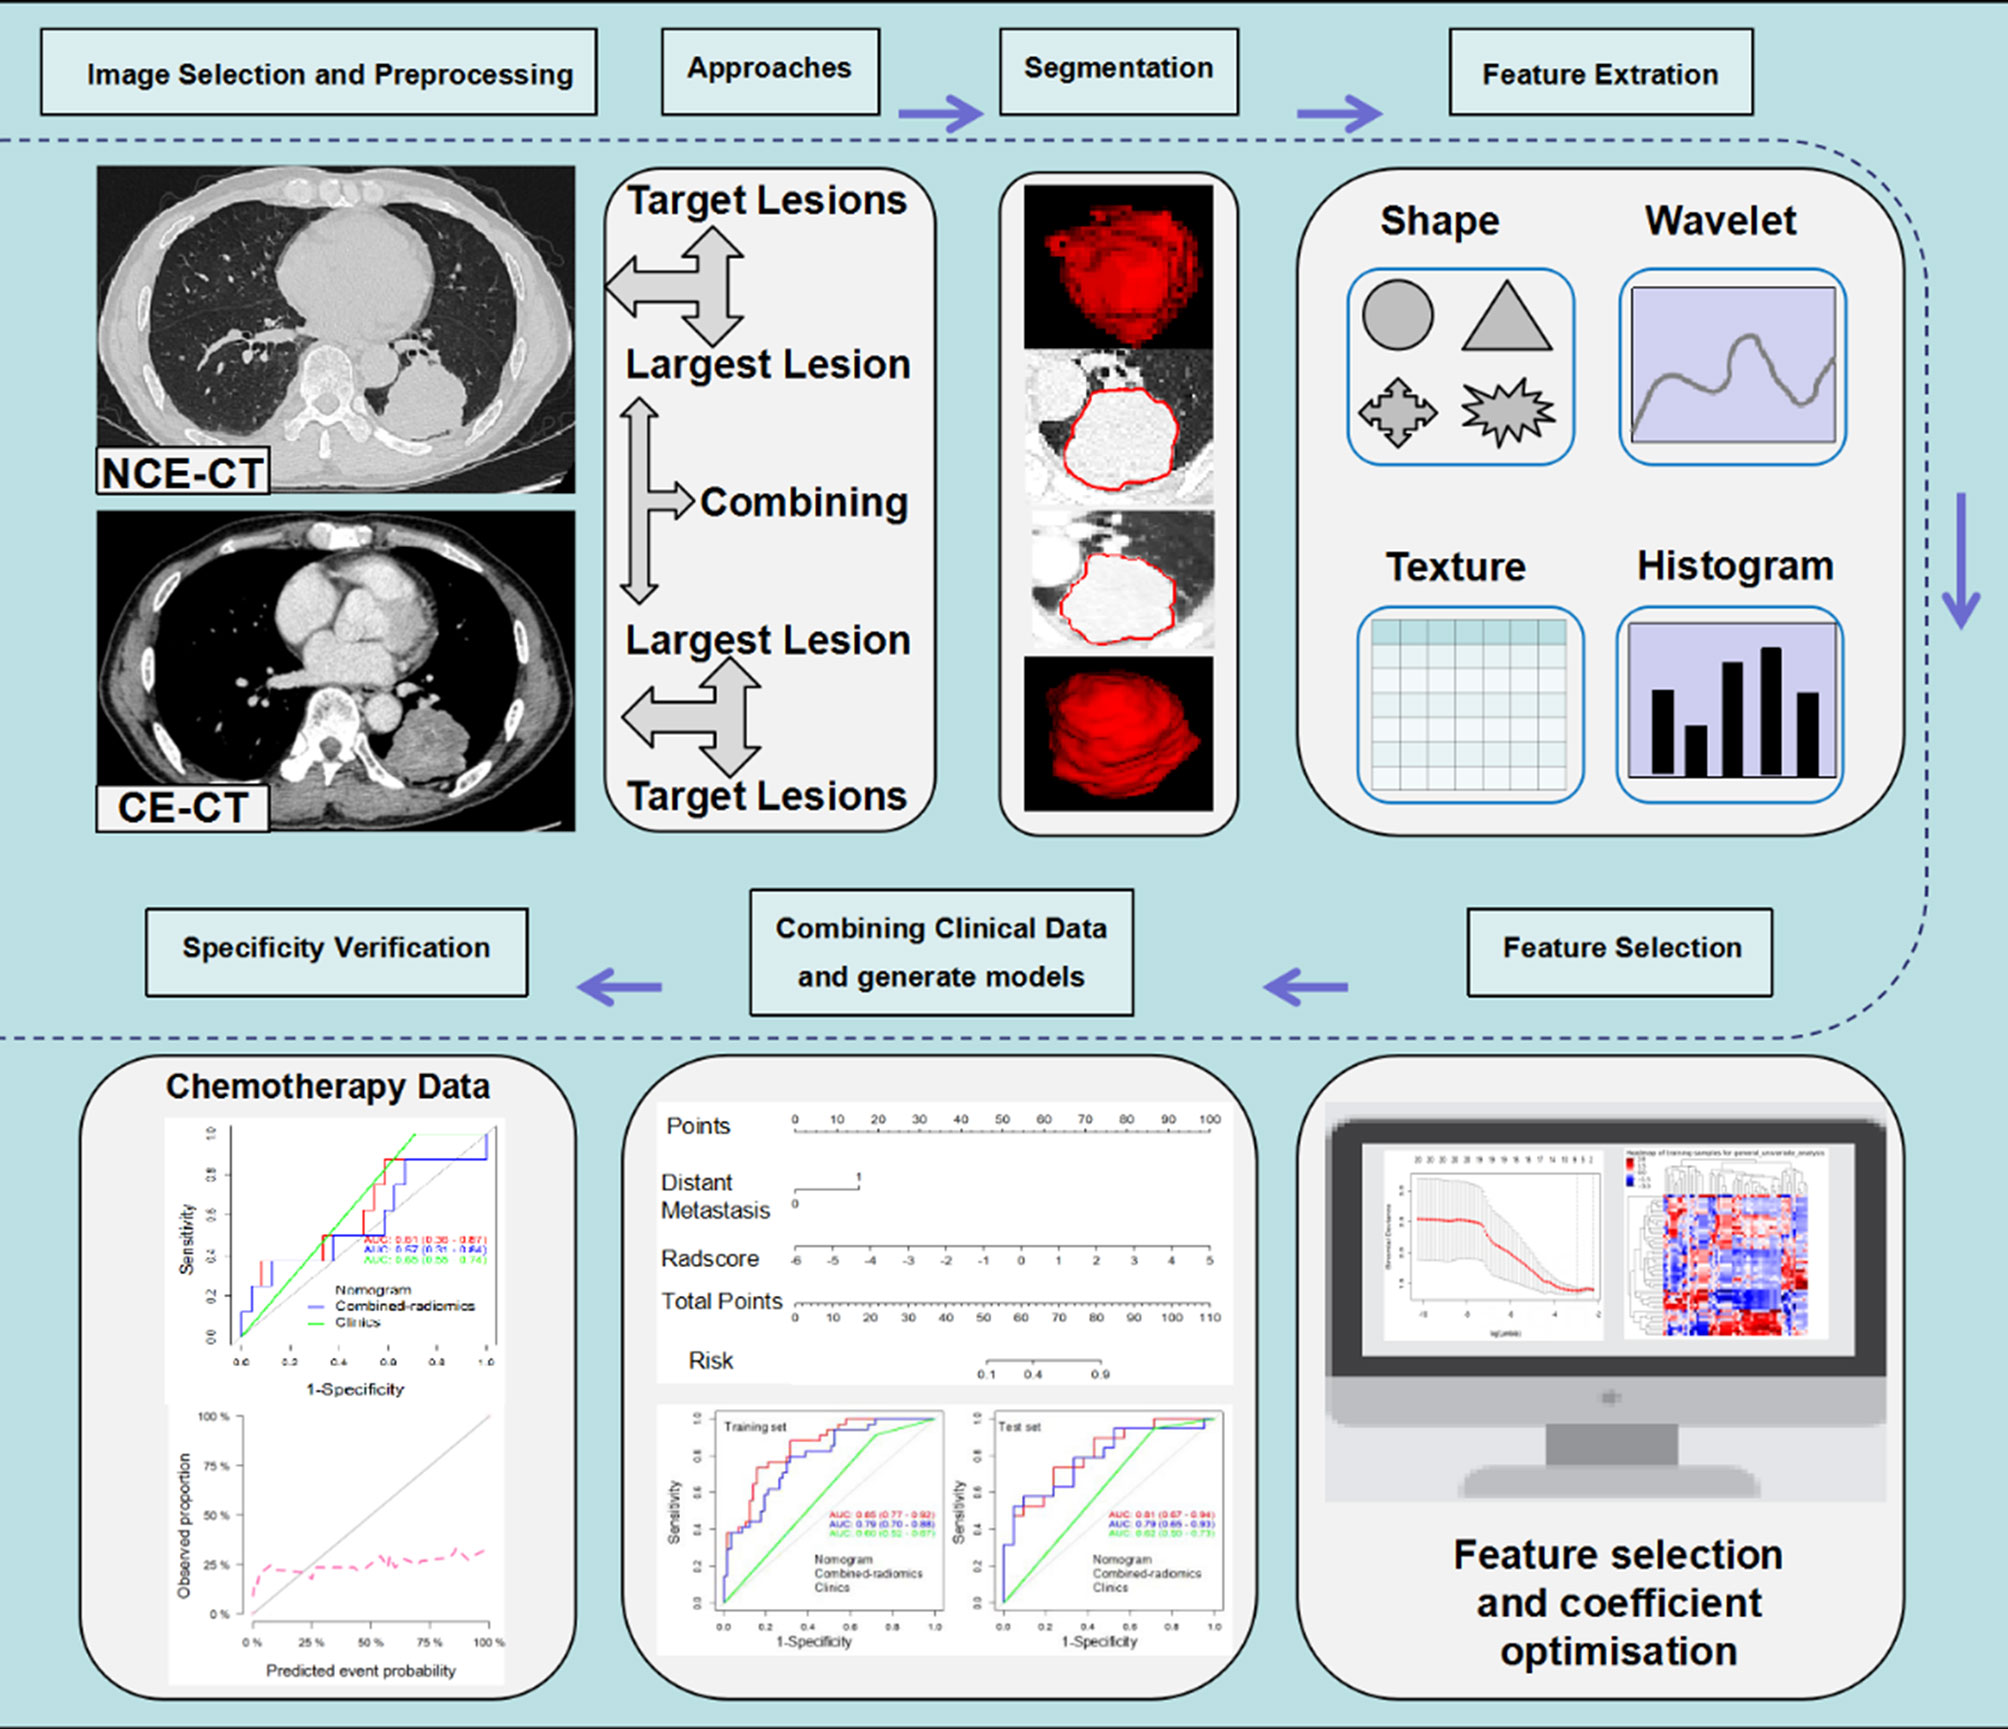
Figure 1 Radiomics workflow. The workflow presents a summary of data collection, study approaches and semi-automatic delineation, modeling schemes of radiomics and specificity verification. NCE-CT, non contrast enhanced CT; CE-CT, contrast enhanced CT.
Materials and Methods
Immunotherapy Dataset
This retrospective multicenter study (NCT04079283) was approved by the institutional ethics committee of each participating hospital, and the requirement for informed consent was waived. This study was performed according with the ethical standards of the Declaration of Helsinki. Initially, a total of 285 patients with advanced NSCLC treated with a PD-1/PD-L1 ICIs therapy (nivolumab/pembrolizumab) from August 1, 2016 to February 28, 2019 in 7 participating institutions were enrolled according to the inclusion criteria (Appendix S1 and Figure 2). According to the exclusion criteria (Appendix S1 and Figure 2), 154 patients were excluded. Finally, the study included the remaining 131 patients. The entire cohort was randomly divided into a training set (n = 92) and an independent testing set (n = 39) at a ratio of 7:3.
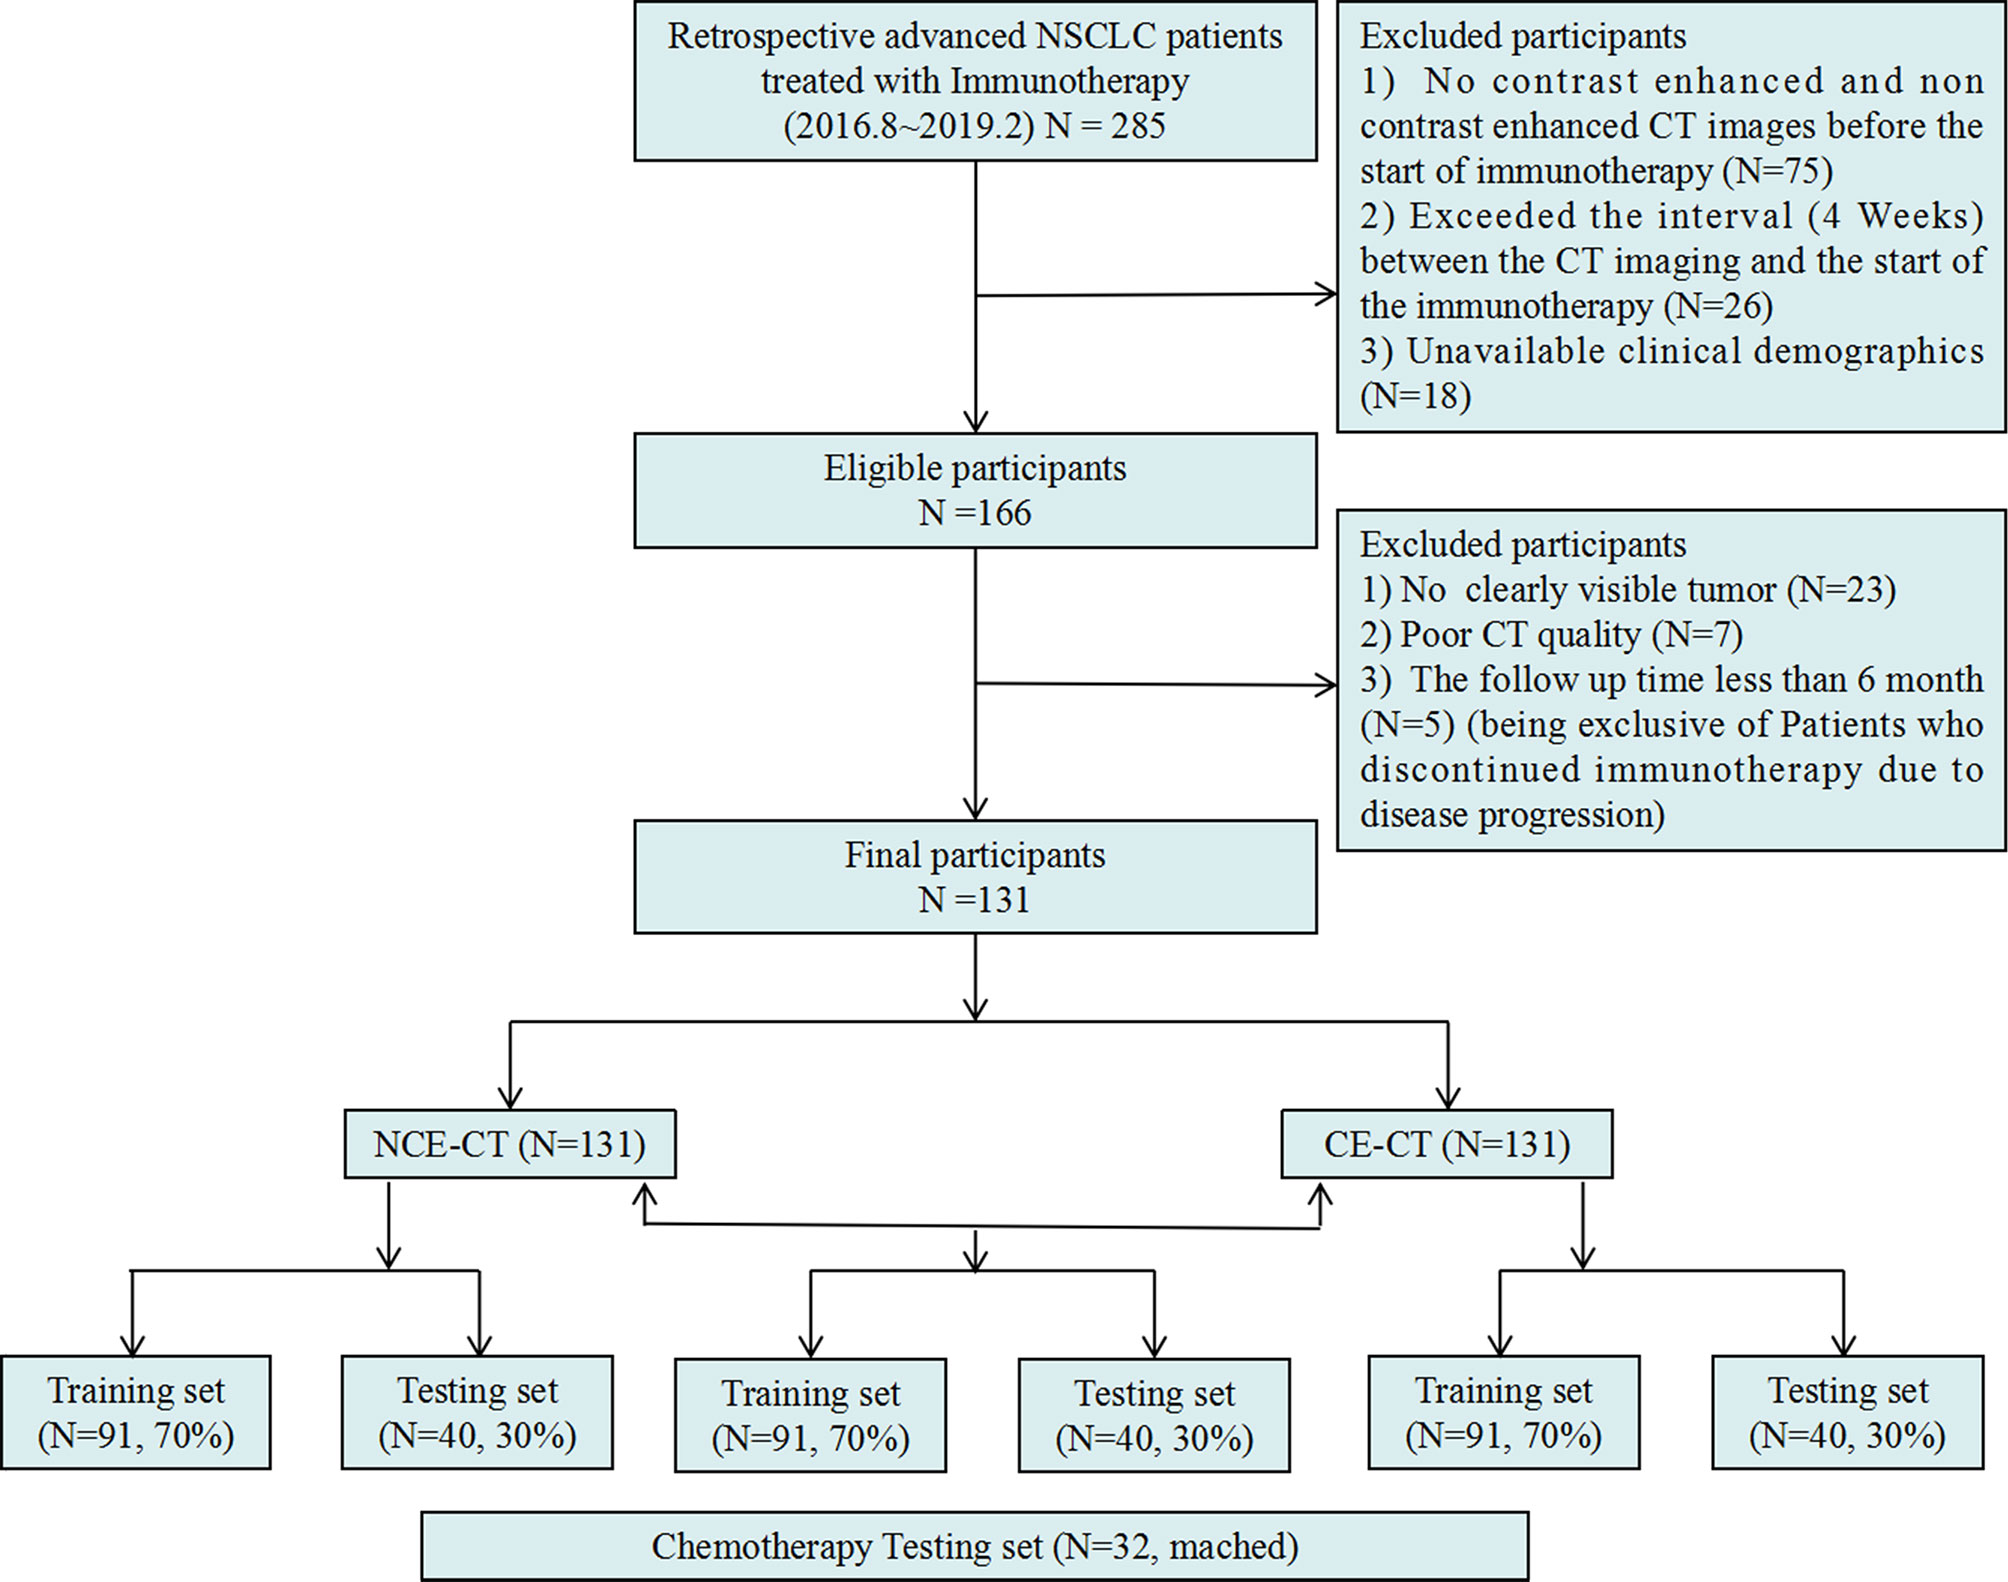
Figure 2 Inclusion and exclusion diagram. Training and testing sets were randomly divided in a proportion of 7:3 respectively as well.
Chemotherapy Dataset
Refer to the previous research (25), to verify the specificity of the radiomic model in predicting response to immunotherapy, we retrospectively collected 32 patients with stage III-IV NSCLC undergoing platinum-based chemotherapy at Tianjin Medical University Cancer Institute and Hospital between 2017 and 2020 as an additional testing set (Figure 2), according to the inclusion criteria (Appendix S2).
Images Acquisition and Harmonizing
Pre-treatment NCE-CT and CE-CT images were acquired on a varied set of CT scanners (Appendix S3). Because slice thickness images may have adverse effects on radiomics feature extraction (22, 30, 32–34), we preprocessed the images. All CT images were resampled in three directions with a resolution of 1.5 mm to standardize the patient’s voxel size. In addition, Z-score normalization was applied to unify the CT value scale of the scanner.
Lesion Segmentation and Response Kinetics
Three experienced readers reviewed baseline NCE-CT and CE-CT images and defined the target lesions according to RECIST (35) consensus, and then the largest lesion was chosen from target lesions of each patient by measuring two-dimensional maximum diameter. All target lesions on NCE-CT and CE-CT CT images were manually segmented via ITK-SNAP (www.itksnap.org) by two readers. If there is a dispute between two readers, a third reader with 13 years of experience in thoracic radiology will judge and modify it. To narrow the difference in tumor boundaries between the pulmonary window and mediastinal window images, the window width and window level of NCE-CT and CE-CT images were uniformly set at 1200 and -500.
Clinically, immunotherapy response assessment is often performed six months after treatment (23, 36). Therefore, treatment response on images at follow-up six months after therapy according to iRECIST (37) served as the endpoint of our study. Response status was dichotomized as follows: Complete response (iCR), partial response (iPR) or stable disease (iSD) were classified as “response”; Confirmed progressive disease (iCPD) were considered as “non-response”. For patients who were considered to be unconfirmed progression (iUPD) at follow-up 6 months after treatment, their treatment responses needed to be further determined with additional follow-ups to ensure that iUPD would not be used as labels for model training. For the chemotherapy dataset, treatment response was evaluated using RECIST 1.1 (35).
Feature Engineering and Signature Building
A total of 1316 radiomics features (RFs) were extracted from all target lesions of baseline NCE-CT and CE-CT images of the training set using Artificial Intelligence Kit software version 3.3.0 (GE Healthcare, China) (Table S1). Firstly, 107 hand-craft RFs were extracted from CT images, including 24 gray level co-occurrence matrix features, 18 first-order histogram features, 16 gray level size zone matrix features, 16 gray level run length matrix features, 14 shape features, 14 gray level dependence matrix features, 5 neighboring gray tone difference matrix features. After wavelet, LoG and LBP transform based on CT images, 744 wavelet features, 186 laplacian (LoGsigma=2.0/3.0) features, and 279 local binary pattern features were obtained respectively. Firstly, Minimum Redundancy Maximum Relevance (mRMR) was used to preprocess these extracted features to remove redundant and irrelevant features. Then, Least Absolute Shrinkage and Selection Operator (LASSO) logistic regression was performed to choose the optimized subset of features. A linear combination of selected features and coefficient vector was used to calculate the radiomics signature (radscore) for each patient. Largest lesion (LL) and target lesions (TL) approaches were used to construct the radiomics modes toward individual-wise analysis. LL approach: radscore of largest target lesion is regarded as individual radiomics signature to predict immunotherapy response; TL approach: average radscore of all target lesions served as a global radiomics signature to predict therapy response. The formula was as follows:
RFs extracted from baseline NCE-CT and CE-CT images were used to construct radiomics model based on NCE-CT image (NCE-radiomics) and radiomics model based on CE-CT image (CE-radiomics), respectively. Finally, the combined-radiomics model based on both NCE-CT and CE-CT images was constructed, and the combined-radscore was calculated by summing the optimal radscores based on NCE-CT and CE-CT images weighted by their coefficients (38).
Statistical Analysis
The inter-observer reproducibility evaluation of lesion segmentation was quantitatively measured using the Dice Similarity Coefficient. The Chi-square test and Mann-Whitney U test were used to test differences of categorical variables and continuous variables, respectively. To construct the best nomograms incorporating clinical factors and radiomics models, multivariate logistic regression analysis with backward elimination method was employed. The area under the curve of the ROC curve (AUC) and its confidence interval were determined according with the DeLong test. The predictive accuracy of the nomogram was evaluated by calibration curves. Decision curve analysis (DCA) was performed by quantifying the net benefits at different threshold probabilities to evaluate the clinical utility of the radiomics nomogram. P values less than 0.05 were regarded as significant. Statistical analyses were performed using R (version 3.5.1) and Python (version 3.5.6).
Results
Clinical Characteristics
Among the enrolled 131 patients, a total of 235 target lesions were identified for all patients. The most common lesion site was the lung (n=158, 67%), followed by a small portion of lymph nodes (n=65, 28%) and other organs (n=12, 5%), including liver, adrenal glands, kidneys, and spleen. Among the 131 retrospective patients, 48.85% patients (n=64) showed iPR, 41.22% patients (n=54) showed iPD, and the rest of patients presented iCR (n=3, 2.29%) or iSD (n=10, 7.63%) at the sixth month. The overall disease control rate (DCR) remained at 58.8% (77 of 131). The training set and the test set had identical distributions in clinical characteristics, and the differences were not statistically significant, which proved that they can be used as training set and testing set (Table 1). The differences in clinical characteristics between response and non-response were statistically insignificant, except for distant metastasis (P=0.001) (Table 1). Among the enrolled 32 patients with chemotherapy, the differences of clinical characteristics between response and non-response were not statistically significant (Table S2). No significant statistical differences in clinical characteristics were observed between chemotherapy data and training set, except for pathological type (P=0.016) (Table 2).
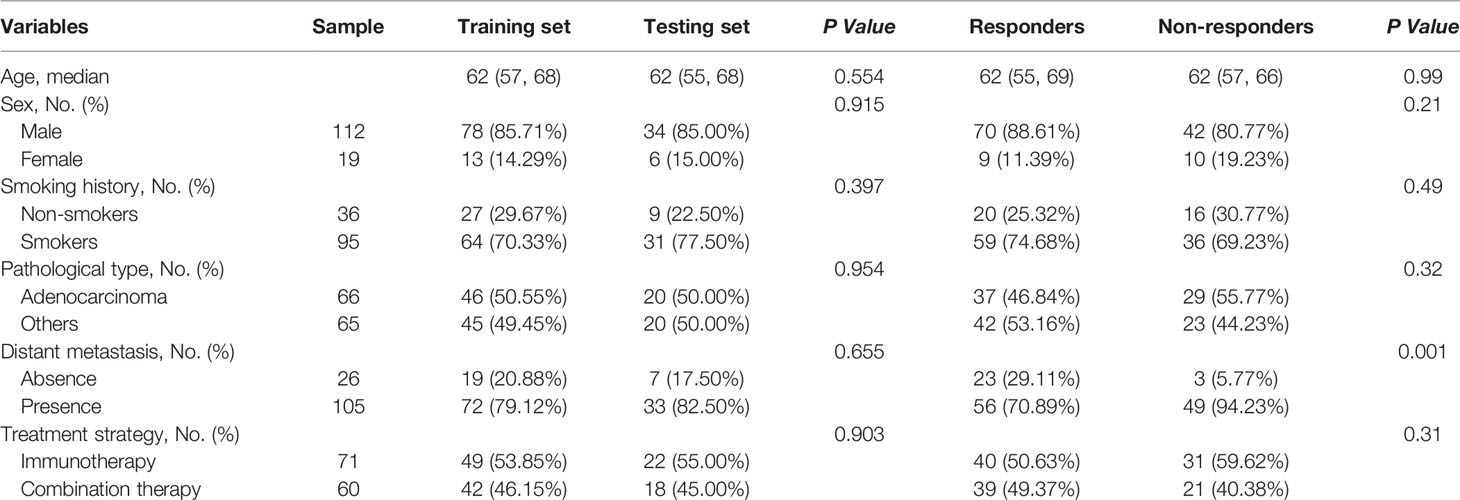
Table 1 Baseline clinical characteristics comparison of the 131 cases between training set and testing set, and responders and non-responders.
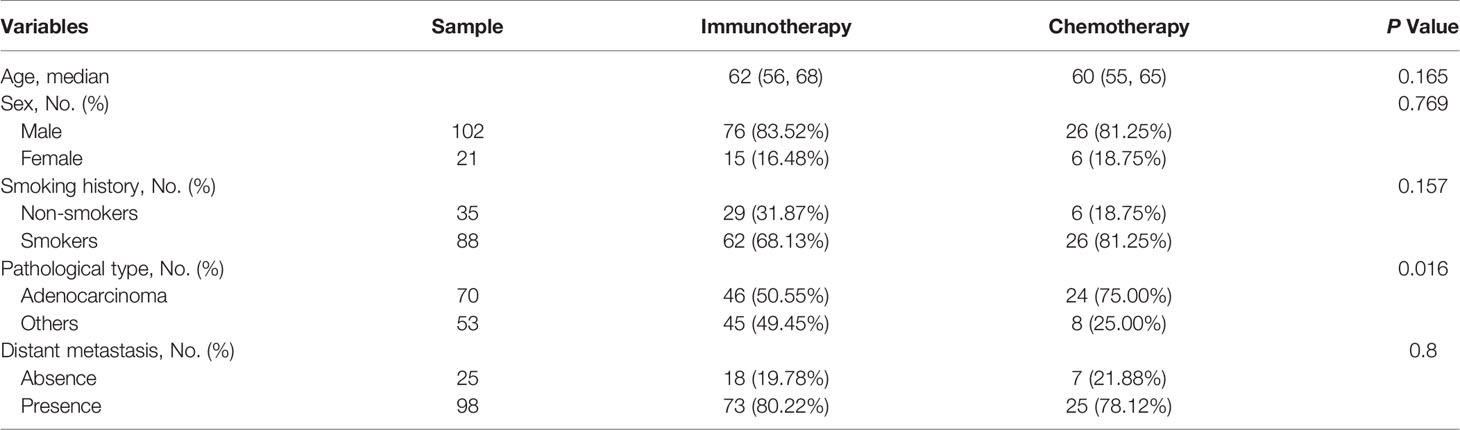
Table 2 Baseline clinical characteristics comparison of patients between immunotherapy training set and chemotherapy cohorts.
Reader Reproducibility
The agreement between the two readers was good. The dice scores of inter-observer lesion segmentation were 0.94 and 0.96 for NCE-CT and CE-CT, respectively.
Response Status Prediction Nomogram With NCE-RFs or CE-RFs
For the LL approach, there was a significant difference in radscore from NCE-CT images (NCE-radscore) (Equation 1, Appendix S5) between responders and non-responders in the training set (P<0.001), which was then confirmed in the testing set (P<0.05) (Figure 3A). Responders also presented a lower level of radscore from CE-CT images (CE-radscore) (Equation 2, Appendix S5) in the training set (P<0.001), and the difference was borderline significant in the testing set (P=0.05) (Figure 4A). The NCE-radiomics signature exhibited significant AUCs value of 0.78 (95% CI, 0.69 to 0.88) and 0.74 (95% CI, 0.58 to 0.91) in the training set and testing set respectively (Figure 3C, Table 3), as did the CE-radiomics signature (0.72, 95% CI, 0.62 to 0.83; 0.69, 95% CI, 0.52 to 0.86) (Figure 4C and Table 3). The difference of AUCs for two signatures in training and testing sets all have no significance (P=0.44; P=0.66). The developed NCE-radiomics nomogram (Figure 3B) that combined NCE-radscore with the clinical factor of distant metastasis achieved the highest AUCs of 0.84 (95% CI, 0.75 to 0.92) and 0.78 (95% CI, 0.64 to 0.92) in training and testing sets respectively (Figure 3C and Table 3). The calibration curves of the NCE-radiomics nomogram (Figure 3D) showed good agreements between the nomogram prediction and actual observation in the training set (P=0.84) and testing set (P=0.16), respectively. The DCA shown in Figure 3E indicated that the NCE-radiomics nomogram from the LL approach had the highest overall net benefit across the majority of the range of reasonable threshold probabilities in all the patients compared with NCE-radiomics or clinical signatures alone. The developed CE-radiomics nomogram (Figure 4B) also showed a good result in predicting response status with AUCs of 0.77 (95% CI, 0.67 to 0.87) and 0.73 (95% CI, 0.57 to 0.88) in training and testing sets respectively (Figure 4C and Table 3). The difference of AUC for two nomograms in training and testing sets all have no significance (P=0.30; P=0.62). The calibration curves of the CE-radiomics nomogram (Figure 4D) showed good agreements between the nomogram prediction and actual observation in the training set (P=0.54) and testing set (P=0.74), respectively. The DCA indicated that the CE-radiomics nomogram (Figure 4E) adding more net benefit than the CE-radiomics or clinical signatures alone had a smaller threshold probability range for a patient than the NCE-radiomics nomogram (Figure 3E).
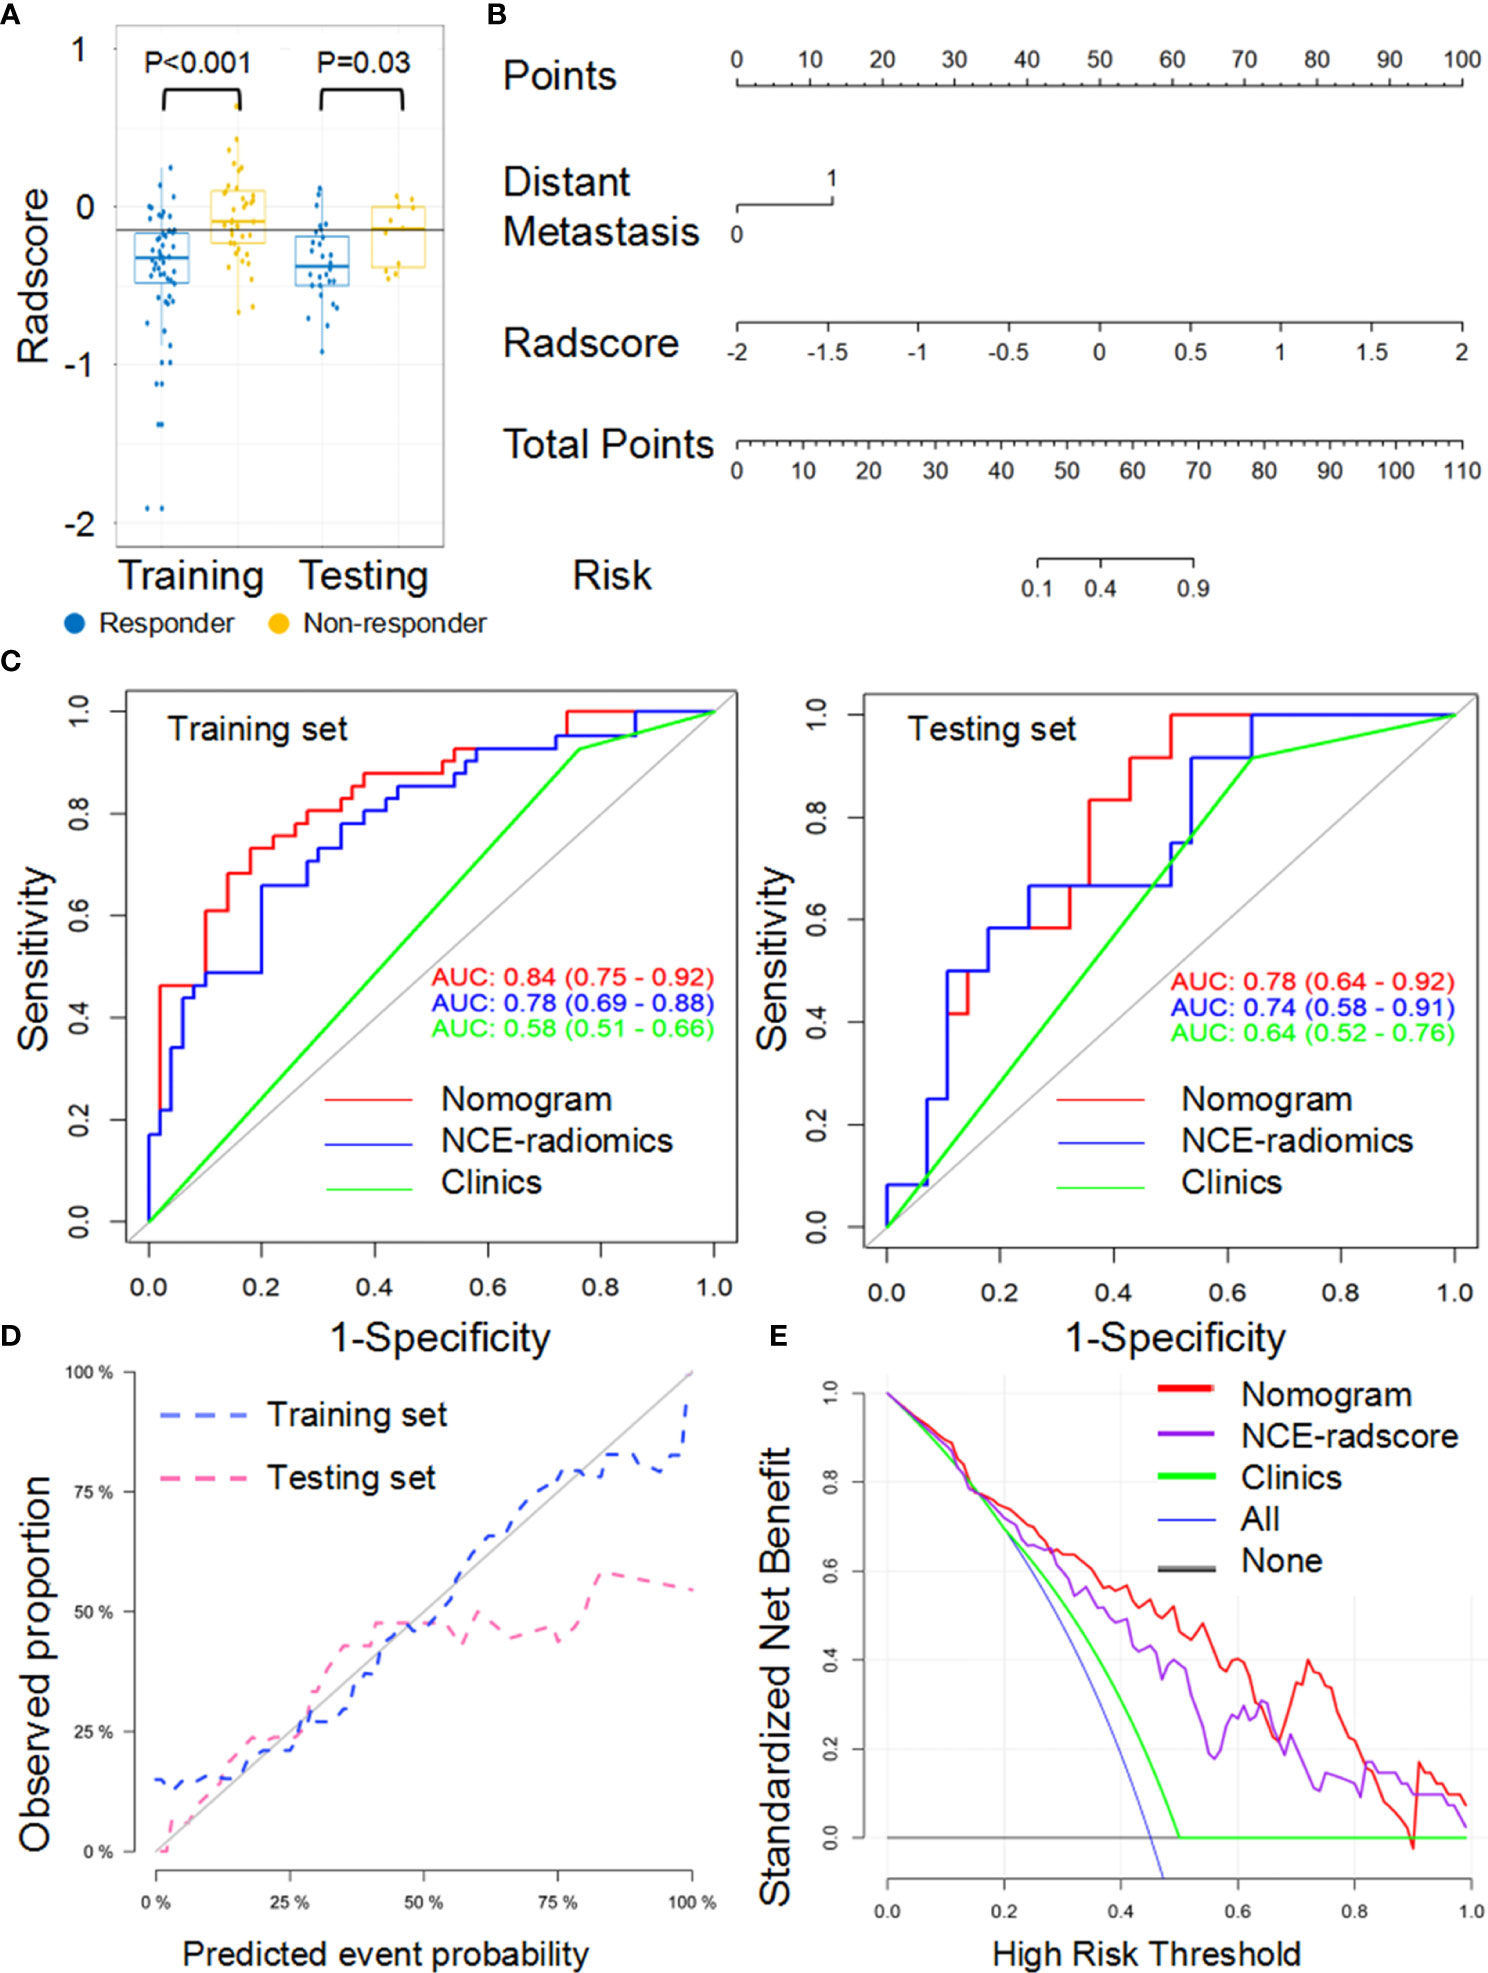
Figure 3 Performance of the NCE-radiomic models from largest lesion approach in training and testing sets. (A) Box and whisker plots depict radscore comparison between responders and non-responders. (B) NCE-radiomic nomogram developed in training set. (C) ROC curves of radiomics signatures in training and testing sets. (D) Calibration curve analysis for the nomogram in training set and testing set. (E) Decision curve analysis for the nomogram (red), radscore (purple), and clinical model (green). The y-axis indicates the net benefit; x-axis indicates threshold probability. The blue line represents the assumption that all patients were responders. The black line represents the hypothesis that no patients were responders.
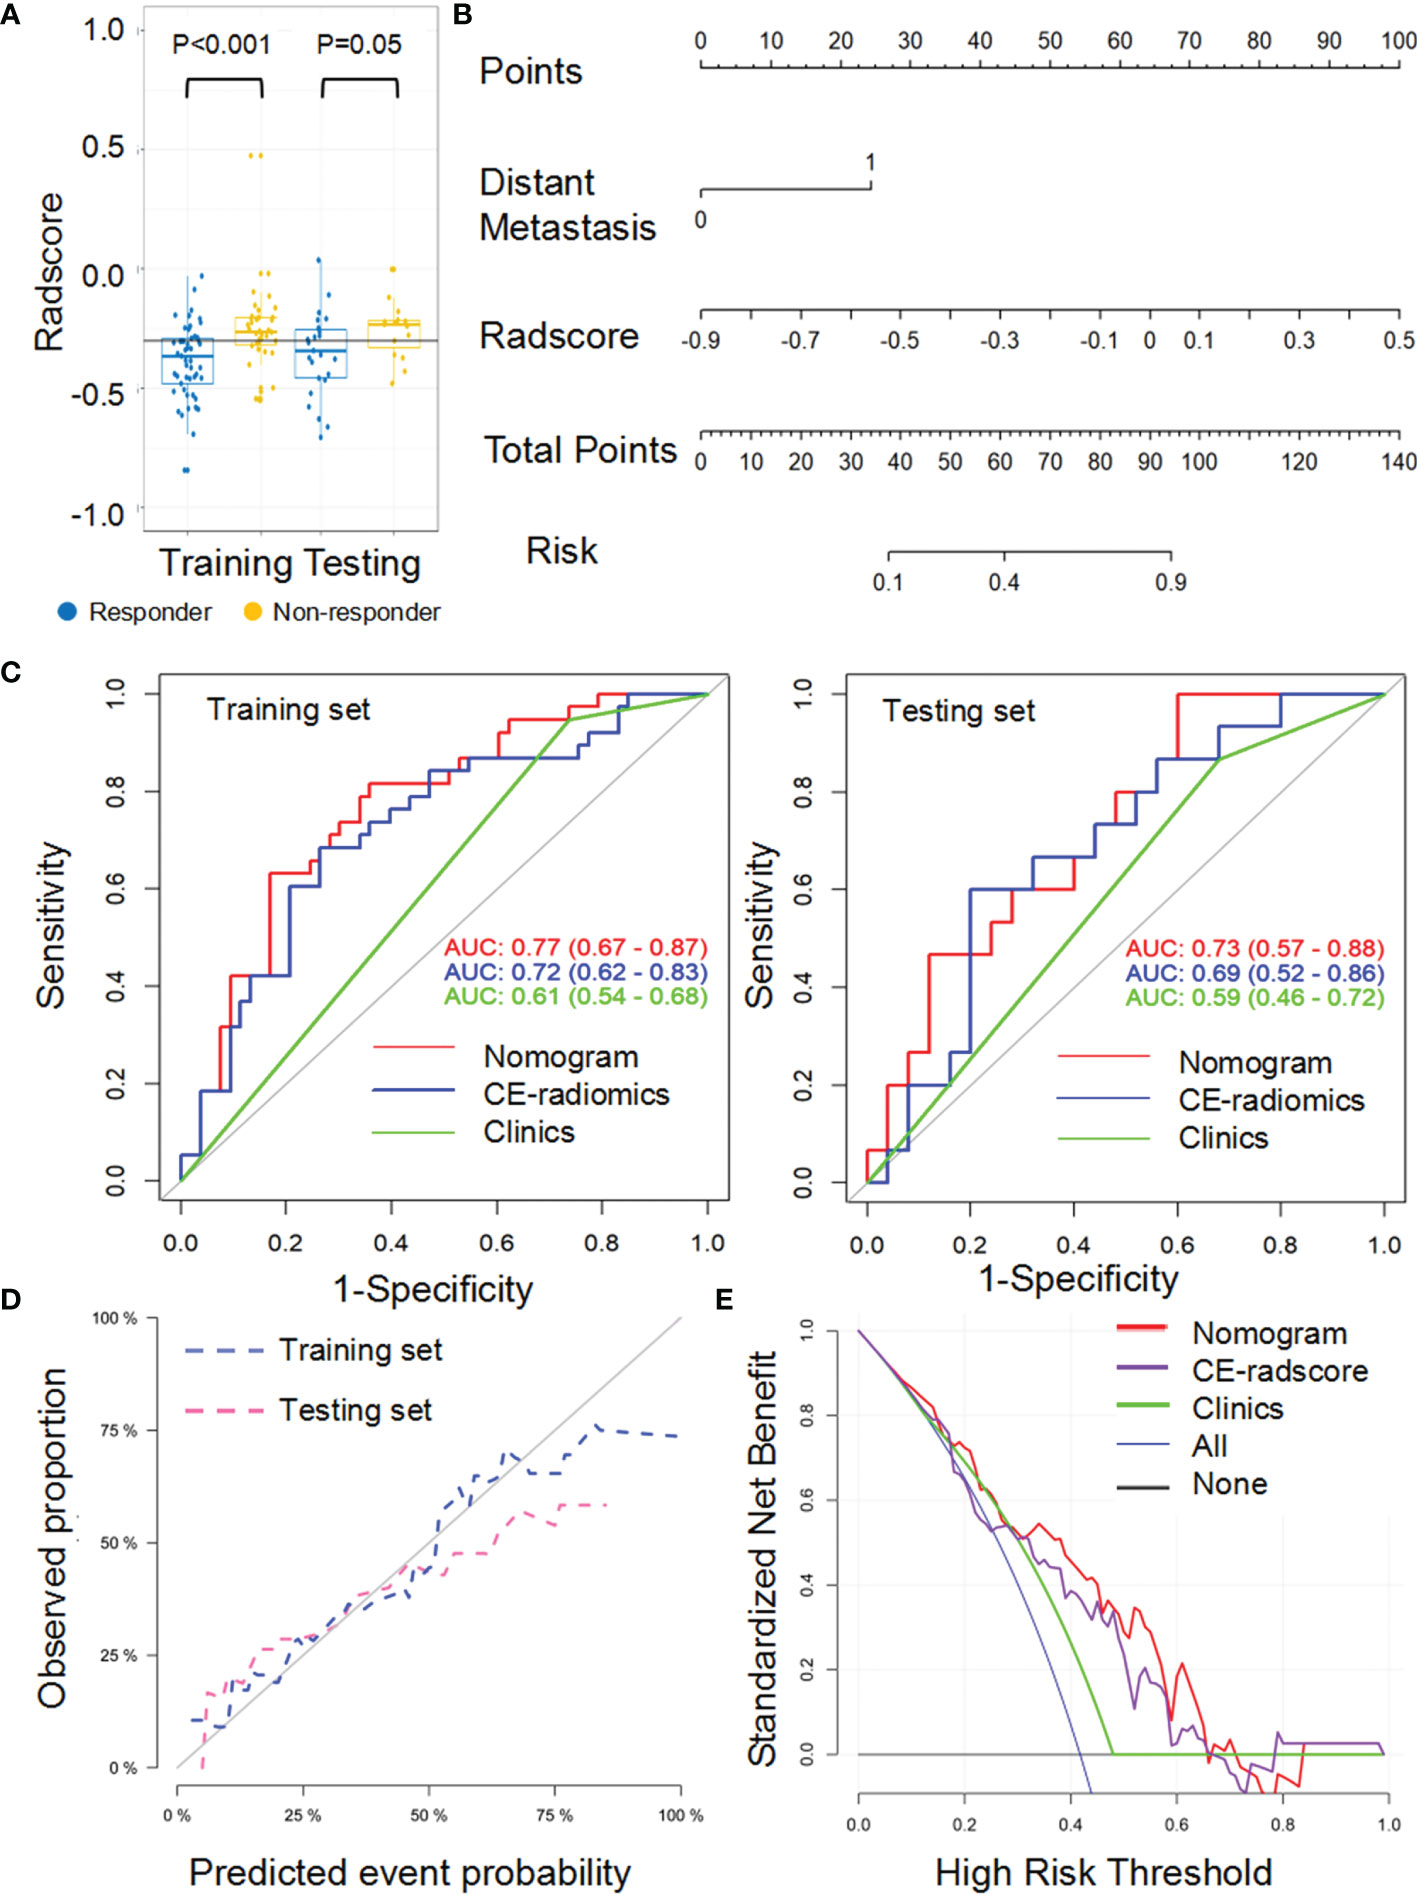
Figure 4 Performance of the CE-radiomic signature from largest lesion approach in training and testing sets. (A) Box and whisker plots depict radscore comparison between responders and non-responders. (B) Radiomic nomogram developed in training set. (C) ROC curves of radiomics signatures in training and testing sets. (D) Calibration curve analysis for the nomogram in training set and testing set. (E) Decision curve analysis for the nomogram (red), radscore (purple), and clinical model (green). The y-axis indicates the net benefit; x-axis indicates threshold probability. The blue line represents the assumption that all patients were responders. The black line represents the hypothesis that no patients were responders.
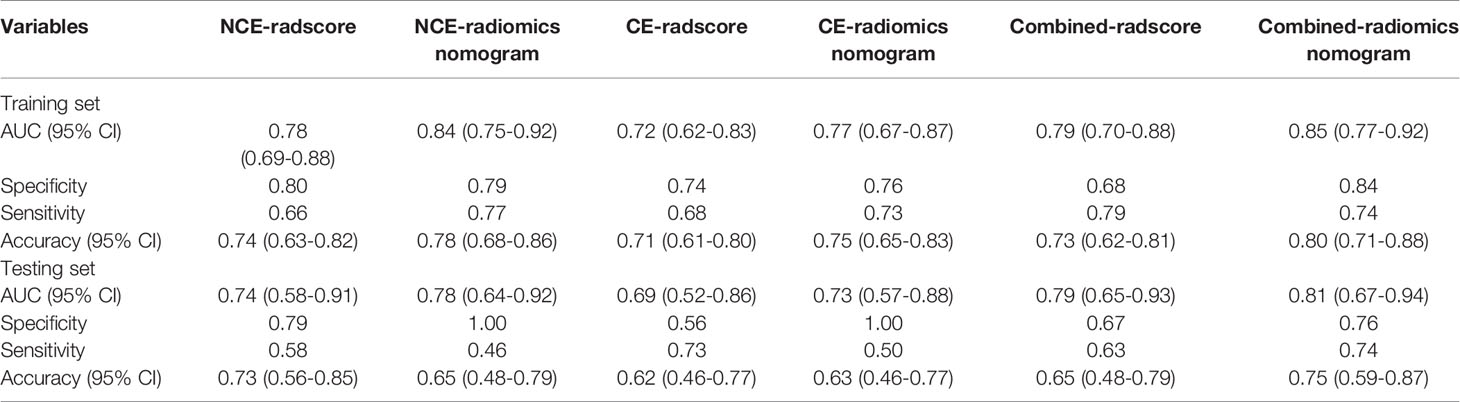
Table 3 ROC analysis for NCE-radiomics, CE-radiomics and combined-radiomics models from largest lesion approach.
For the TL approach, two NCE-RFs and seven CE-RFs were selected through the LASSO logistic regression analysis (Figure S1Aa and Figure S1Ba). The radscore of non-responders was slightly higher than responders in the training set (P=0.008) from NCE-radscore (Equation 3, Appendix E4), but did not reach a significant difference in the testing set (P=0.23) (Figure S1Ab). The NCE-radiomics signature carried out no superior prediction value in training and testing sets (AUC=0.66, 95% CI, 0.55 to 0.78; AUC=0.63, 95% CI, 0.41 to 0.85) (Figure S1Ac and Table 4). The CE-radscore (Equation 4, Appendix S5) was significantly higher in nonresponders than in responders in the training set (P<0.001), and the difference was slightly significant in the testing set (P=0.04) (Figure S1Bb). The CE-radiomics signature exhibited AUCs value of 0.75 (95% CI, 0.65 to 0.85) and 0.68 (95% CI: 0.49-0.88) in training and testing sets respectively (Figure S1Bc and Table 4).
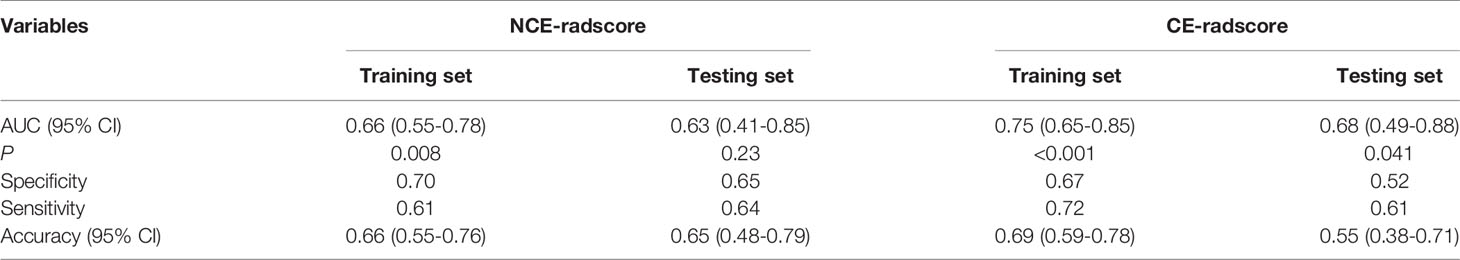
Table 4 ROC analysis for the NCE-radiomics and CE-radiomics models from target lesions approach.
Combined-Radiomics Nomogram Building and Evaluation With Both NCE-CT and CE-CT Radscore
Because radiomics models from the TL approach did not exhibit a higher predictive value than that from the LL approach, combined-radscore was calculated by summing the NCE-radscore and CE-radscore weighted by their coefficients from the LL approach (Equation 5, Appendix E4). There was a significant statistical difference in combined-radscore between responders and non-responders in the training set (P<0.001) and testing set (P=0.003), respectively (Figure 5A). The combined-radiomics model yielded significantly strong prediction results with an AUC of 0.79 (95% CI, 0.77 to 0.92) in the training set and 0.79 (95% CI, 0.67 to 0.94) in the testing set (Figure 5C and Table 3). This combined-radiomics model did perform better prediction performance in the testing set than the NCE-radiomics model and CE-radiomics model, but the improvement did not reach significance in the Delong Test (P=0.67, P=0.37, respectively). Interestingly, the specificity and sensitivity of the model to predict immunotherapy responses were optimized by combining NCE-CT and CE-CT images (Table 3).
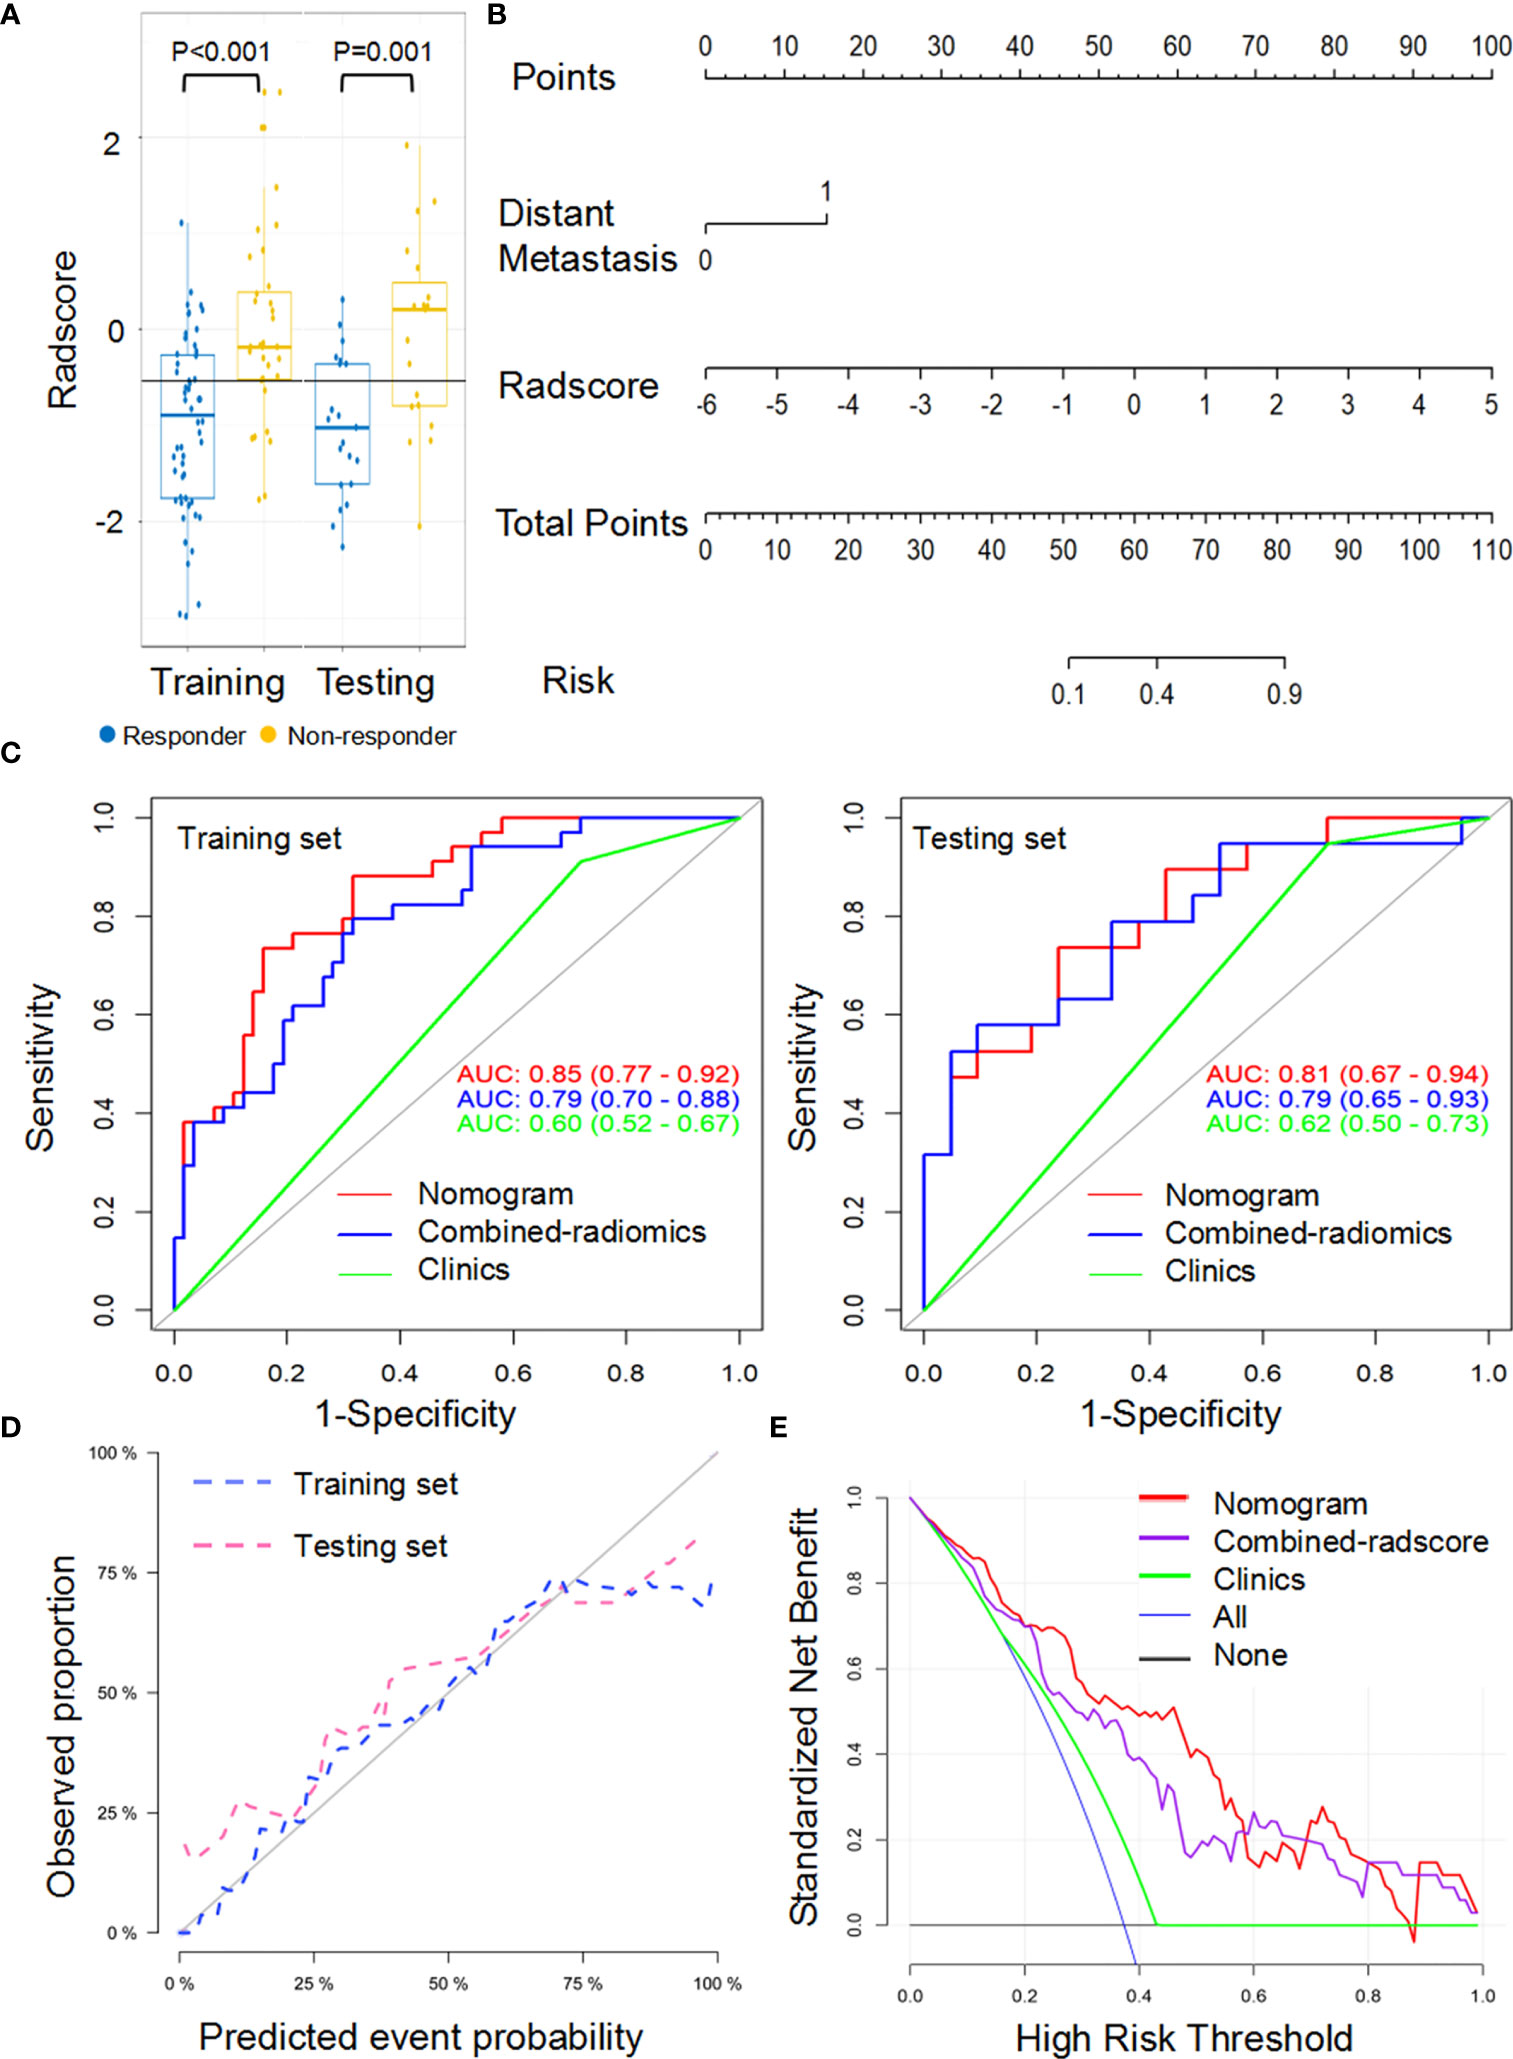
Figure 5 Performance of the combined-radiomic signature from largest lesion approach in training and testing sets. (A) Box and whisker plots depict radscore comparison between responders and non-responders. (B) Radiomic nomogram developed in training set. (C) ROC curves of radiomics signatures in training and testing sets. (D) Calibration curve analysis for the nomogram in training set and testing set. (E) Decision curve analysis for the nomogram (red), radscore (purple), and clinical model (green). The y-axis indicates the net benefit; x-axis indicates threshold probability. The blue line represents the assumption that all patients were responders. The black line represents the hypothesis that no patients were responders.
A combined-radiomics nomogram (Figure 5B) which incorporated the combined-radiomics model based on NCE-CT and CE-CT images with the clinical factor of distant metastasis was chosen as the best response status classifier. The combined-radiomics nomogram showed significantly strong prediction results with an AUC of 0.83 (95% CI, 0.75-0.91) in the training set and an AUC of 0.81 (95% CI, 0.69-0.93) in the testing set (Figure 5C). The difference of AUC between combined-radiomics nomogram and NCE-radiomics nomogram in training and testing sets all have no significance (P=0.86, P=0.79). The prediction accuracy of the nomogram was 0.75 in the testing set (Table 3). The calibration curves of the combined-radiomics nomogram (Figure 5D) showed good agreements between the nomogram prediction and actual observation in the training set (P=0.81) and testing set (P=0.58), respectively. The DCA indicated that the combined-radiomics nomogram from the LL approach had the highest overall net benefit across the majority of the range of reasonable threshold probabilities in all the patients compared with combined-radiomics or clinical signatures alone (Figure 5E).
Proposed Combined-Radiomics Features as a Set of ICI-Specified Biomarkers
The proposed combined-radscore (Figure 6Aa) did not show any significant predictive value in predicting response status of chemotherapy at the sixth month (AUC=0.57, P=0.17) (Figure 6Ab and Table S3), nor did NCE-radiomics and CE-radiomics signature (AUC=0.61, P=0.98; AUC=0.49, P=0.69) (Figures 6B, C and Table S3). The developed combined-radiomics nomogram, NCE-radiomics nomogram, and CE-radiomics nomogram still achieved low AUCs (Figures 6Ab, Bb, Cb and Table S3). The calibration curves of the three nomograms (Figures 6Ac, Bc, Cc) all showed very poor agreements between the nomogram prediction and actual observation in chemotherapy cohorts (P<0.001).
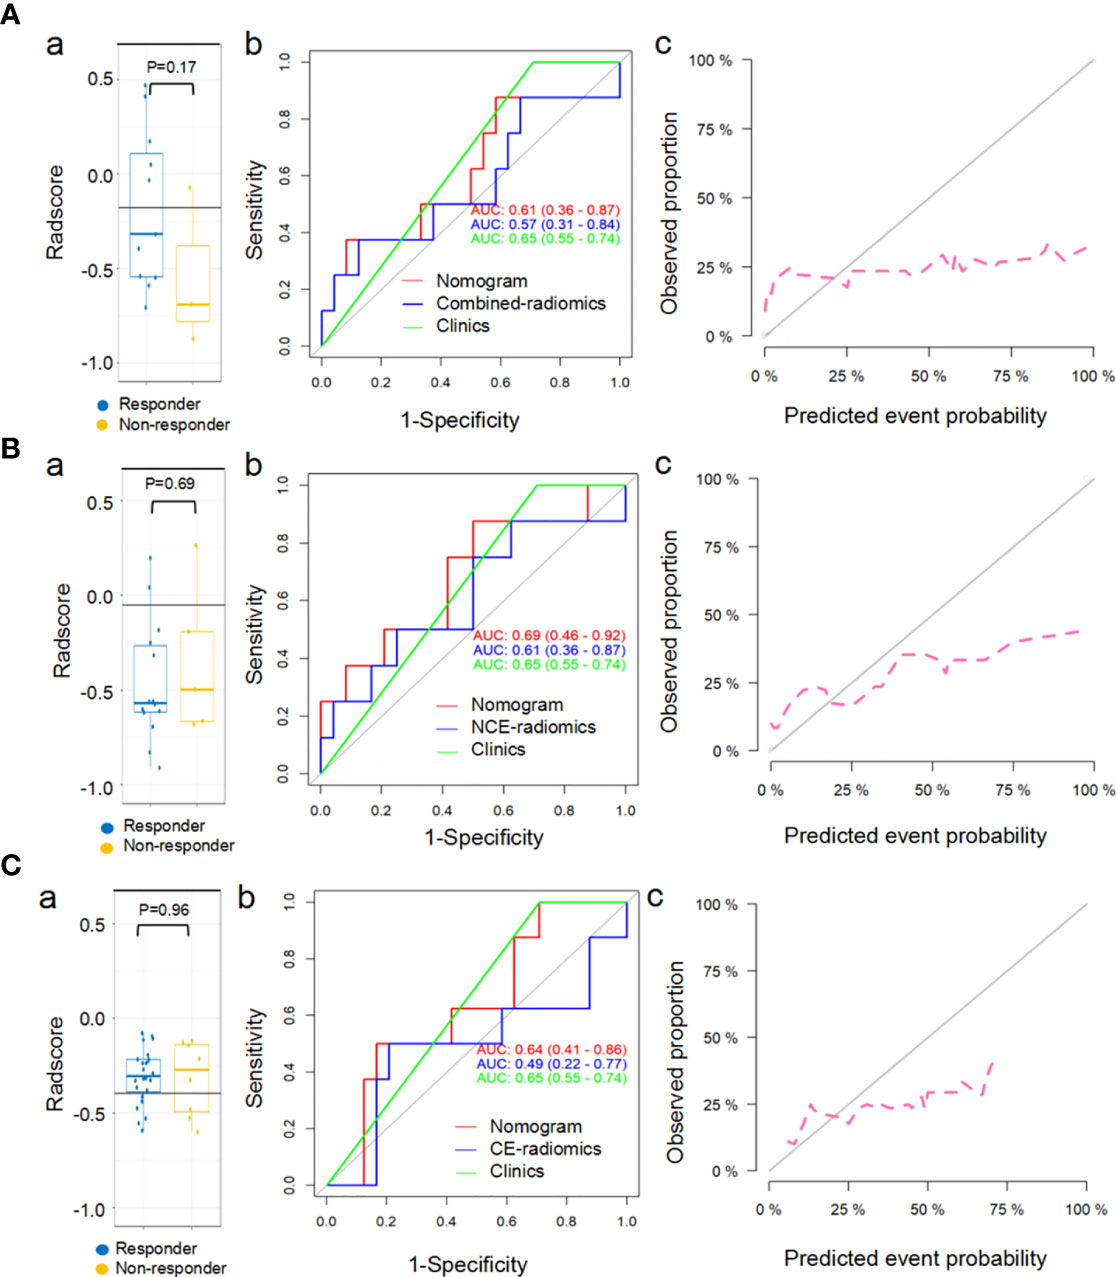
Figure 6 Predictive performance of combined-radiomic (A), NCE-radiomic (B) and CE-radiomic (C) models in chemotherapy cohorts. (Aa, Ba, Ca) Box and whisker plots depict radscore comparison between responders and non-responders. (Ab, Bb, Cb) ROC curves of radiomics signatures in chemotherapy cohorts. (Ac, Bc, Cc) Calibration curve analysis for the nomograms in chemotherapy cohorts.
Discussion
In recent years, radiomics studies of immunotherapy mainly extracted features from CE-CT images (25, 26, 28, 29), but few studies from NCE-CT images. However, it has been suggested that NCE-CT images is more conducive to the feature extraction of radiomics (30). We first compared the NCE-radiomics model with the CE-radiomics model in predicting response to immunotherapy. NCE-radiomics model showed better performance in predicting response to immunotherapy, which was inconsistent with prior studies (25). NCE-radiomics nomogram showed better performance compared with CE-radiomics nomogram. The underlying reason may be that contrast material injected in intravenous had adverse effects on the extraction of radiomics features depicting the biological heterogeneity within the tumor (39–41). In addition, the scanning scheme was preset, and different patients have different hemodynamic characteristics, so the RFs based on CT value were affected to some extent. Although the original images were preprocessed, the problem could not be fundamentally solved. Our results were similar to those observed in a previous study (30) which showed that NCE-radiomics signature was more informative on the differential diagnosis of the solitary pulmonary nodule (SPN) than CE-radiomics signature.
Typically, radiomics studies of lung cancer focused on extracting features from a primary lung tumor, largest lung lesion, or one of the target lesions (23, 26, 27, 29). By contrast, target lesions were all included in our analysis. We assumed that the TL approach which was more consistent with clinical RECIST1.1 could reflect total tumor burden to some extent. Under the circumstance of a mix-response pattern (present both responding and progressive lesions), the TL approach could avoid potential selection bias compared with the LL approach. However, in our study, radiomics models for the TL approach did exhibit lower predictive value. A previous study suggested that the predictive performance of the radiomics model from all lesions on metastases from different organs is different (25). Such a discrepancy can be explained in part by the fact that the low number of samples with 8% (11 of 131) mixed response, which suggests that a large number of mixed responses are necessary for the TL approach. Another possible reason might be the low number of metastases (5%, 12 of 235) from organs other than the lungs and lymph nodes. We believed that the lower 95% confidence interval of AUC (0.41 and 0.49 in the testing set) for NCE-radscore and CE-radscore indicated an insufficient predictive efficiency. NCE-radscore between the responders and non-responders had no significant difference in the testing set (P=0.23). Compared with the LL approach, the TL approach is inconvenient and time-consuming. Therefore, we have reasonably chosen the LL approach to further construct the combined-radiomics with NCE-radscore and CE-radscore.
Although radiomics based on single NCE-CT or CE-CT images are conventionally used for prediction, NCE-radiomics and CE-radiomics may contain complementary information regarding treatment response (31). To further improve the prediction effect of the radiomics model based on the baseline images, a combined-radiomics nomogram based on both NCE-radscore and CE-radscore for LL was built to predict response to immunotherapy. Excitingly, the combined-radiomics model showed better performance in predicting response to immunotherapy than the radiomics model based on single NCE-CT or CE-CT images, suggesting a potential complementarity between RFs based on NCE-CT and CE-CT images (31). In addition, the tumor boundaries of patients with advanced NSCLC are mostly unclear, so simple NCE-CT images cannot accurately delineate the tumor boundaries. Therefore, integrating radiomics features of NCE-CT and CE-CT images into a predictive panel as a radiomics model may be a robust approach for predicting response to immunotherapy. Compared our previous study (42), the combined-radiomics models based on only NCE/CE-CT images of baseline from the single largest lesion approach may be more promising for clinical application and early prediction.
What is unique about this study is that we conducted a single radiomics analysis based on NCE-CT and CE-CT images separately and combined-radiomics analysis based on NCE/CE-CT images. The results highlighted the feasibility and validity of the utility of combined-radiomics with NCE/CE-CT images analysis from the largest lesions. Meanwhile, we also conducted radiomics analysis on both NCE and CE for target lesions. Despite the poor results, it provides a meaningful indication for radiomics study of target lesions studies in immunotherapy. The next step is to construct a large sample composite model of target lesions from different organs, which may provide a consistent framework for RECIST1.1 and overcome the adverse effects of the mixed response pattern of immunotherapy in patients with NSCLC on radiomics features extraction.
Our study also possessed some limitations. First, the heterogeneity of the cohorts from multicenter, particularly for enhancement imaging parameters, could affect radiomics features extraction and analysis process, even though some efforts had been made to weaken the multicenter effect. Second, given that the fact of a limited number of complex responses and metastases outside the lung, the results of radiomics analysis for target lesions may be affected to some extent. Third, the combined-radiomics nomogram was not combined with currently known clinical biomarkers. Integrating data from different disciplines might construct a fully integrated model that can be applied to the clinical workflow. Fourth, the performance of clinical predictive models would decline over the continuous improvement of immunotherapy methods.
In conclusion, the results from our pilot study showed that the combined-radiomics nomogram incorporating the NCE/CE-CT images with the clinical factor of distant metastasis could serve as a non-invasive and cost-effective decision-support tool for better stratification of patients receiving immunotherapy with ICIs.
Data Availability Statement
The original contributions presented in the study are included in the article/Supplementary Material. Further inquiries can be directed to the corresponding authors.
Ethics Statement
The studies involving human participants were reviewed and approved by Tianjin Medical University Cancer Institute and Hospital. Written informed consent for participation was not required for this study in accordance with the national legislation and the institutional requirements.
Author Contributions
Conception and design: MW, YaZ, YiL, and ZY. Literature research: MW, YaZ, and YiL. Collection and assembly of data: all authors. Clinical studies: MW, YaZ, and YiL. Data analysis and interpretation: MW, SW, and YG. Manuscript writing: MW and YaZ. All authors contributed to the article and approved the submitted version.
Funding
This work was supported by the Chinese National Key Research and Development Project (2018YFC1315600), National Natural Science Foundation of China (81974277), and Demonstrative Research Platform of Clinical Evaluation Technology for New Anticancer Drugs (No. 2018ZX09201015).
Conflict of Interest
Authors SW and YG were employed by company GE Healthcare China.
The remaining authors declare that the research was conducted in the absence of any commercial or financial relationships that could be construed as a potential conflict of interest.
Publisher’s Note
All claims expressed in this article are solely those of the authors and do not necessarily represent those of their affiliated organizations, or those of the publisher, the editors and the reviewers. Any product that may be evaluated in this article, or claim that may be made by its manufacturer, is not guaranteed or endorsed by the publisher.
Supplementary Material
The Supplementary Material for this article can be found online at: https://www.frontiersin.org/articles/10.3389/fonc.2021.688679/full#supplementary-material
References
1. Leighl NB, Hellmann MD, Hui R, Carcereny E, Felip E, Ahn M-J, et al. Pembrolizumab in Patients With Advanced Non-Small-Cell Lung Cancer (KEYNOTE-001): 3-Year Results From an Open-Label, Phase 1 Study. Lancet Respir Med (2019) 7(4):347–57. doi: 10.1016/s2213-2600(18)30500-9
2. Rizvi NA, Mazières J, Planchard D, Stinchcombe TE, Dy GK, Antonia SJ, et al. Activity and Safety of Nivolumab, an Anti-PD-1 Immune Checkpoint Inhibitor, for Patients With Advanced, Refractory Squamous Non-Small-Cell Lung Cancer (CheckMate 063): A Phase 2, Single-Arm Trial. Lancet Oncol (2015) 16(3):257–65. doi: 10.1016/s1470-2045(15)70054-9
3. Reck M, Rodriguez-Abreu D, Robinson AG, Hui R, Csoszi T, Fulop A, et al. Pembrolizumab Versus Chemotherapy for PD-L1-Positive Non-Small-Cell Lung Cancer. N Engl J Med (2016) 375(19):1823–33. doi: 10.1056/NEJMoa1606774
4. Brahmer J, Reckamp KL, Baas P, Crino L, Eberhardt WE, Poddubskaya E, et al. Nivolumab Versus Docetaxel in Advanced Squamous-Cell Non-Small-Cell Lung Cancer. N Engl J Med (2015) 373(2):123–35. doi: 10.1056/NEJMoa1504627
5. Ettinger DS, Wood DE, Aggarwal C, Aisner DL, Akerley W, Bauman JR, et al. Hughes: NCCN Guidelines Insights: Non-Small Cell Lung Cancer, Version 1. 2020. J Natl Compr Canc Netw (2019) 17(12):1464–72. doi: 10.6004/jnccn.2019.0059
6. Planchard D, Popat S, Kerr K, Novello S, Smit EF, Faivre-Finn C, et al. Metastatic non-Small Cell Lung Cancer: ESMO Clinical Practice Guidelines for Diagnosis, Treatment and Follow-Up. Ann Oncol (2018) 29:iv192–237. doi: 10.1093/annonc/mdy275
7. Horn L, Spigel DR, Vokes EE, Holgado E, Ready N, Steins M, et al. Nivolumab Versus Docetaxel in Previously Treated Patients With Advanced Non-Small-Cell Lung Cancer: Two-Year Outcomes From Two Randomized, Open-Label, Phase III Trials (CheckMate 017 and CheckMate 057). J Clin Oncol Off J Am Soc Clin Oncol (2017) 35(35):3924–33. doi: 10.1200/JCO.2017.74.3062
8. Borghaei H, Paz-Ares L, Horn L, Spigel DR, Steins M, Ready NE, et al. Nivolumab Versus Docetaxel in Advanced Nonsquamous Non-Small-Cell Lung Cancer. N Engl J Med (2015) 373(17):1627–39. doi: 10.1056/NEJMoa1507643
9. Garon EB, Rizvi NA, Hui R, Leighl N, Balmanoukian AS, Eder JP, et al. Pembrolizumab for the Treatment of non-Small-Cell Lung Cancer. N Engl J Med (2015) 372(21):2018–28. doi: 10.1056/NEJMoa1501824
10. Allison JP. Immune Checkpoint Blockade in Cancer Therapy: The 2015 Lasker-DeBakey Clinical Medical Research Award. JAMA (2015) 314(11):1113–4. doi: 10.1001/jama.2015.11929
11. Eisenhauer EA, Therasse P, Bogaerts J, Schwartz LH, Sargent D, Ford R, et al. New Response Evaluation Criteria in Solid Tumours: Revised RECIST Guideline (Version 1.1). Eur J Cancer (2009) 45(2):228–47. doi: 10.1016/j.ejca.2008.10.026
12. Chiou I L, Burotto M. Pseudoprogression and Immune-Related Response:in Solid Tumors. J Clin Oncol (2015) 33(31):3541–3. doi: 10.1200/JCO.2015.61.6870
13. Lantuejoul S, Sound-Tsao M, Cooper WA, Girard N, Hirsch FR, Roden AC, et al. PD-L1 Testing for Lung Cancer in 2019: Perspective From the IASLC Pathology Committee. J Thorac Oncol (2020) 15(4):499–519. doi: 10.1016/j.jtho.2019.12.107
14. Hellmann MD, Ciuleanu TE, Pluzanski A, Lee JS, Otterson GA, Audigier-Valette C, et al. Nivolumab Plus Ipilimumab in Lung Cancer With a High Tumor Mutational Burden. N Engl J Med (2018) 378(22):2093–104. doi: 10.1056/NEJMoa1801946
15. Havel JJ, Chowell D, Chan TA. The Evolving Landscape of Biomarkers for Checkpoint Inhibitor Immunotherapy. Nat Rev Cancer (2019) 19(3):133–50. doi: 10.1038/s41568-019-0116-x
16. Nishino M, Hatabu H, Hodi FS. Imaging of Cancer Immunotherapy: Current Approaches and Future Directions. Radiology (2019) 290(1):9–22. doi: 10.1148/radiol.2018181349
17. Wu M, Zhang Y, Zhang Y, Liu Y, Wu M, Ye Z. Imaging-Based Biomarkers for Predicting and Evaluating Cancer Immunotherapy Response. Radiol: Imaging Cancer (2019) 1(2):e190031. doi: 10.1148/rycan.2019190031
18. Jin Y, Shen X, Pan Y, Zheng Q, Chen H, Hu H, et al. Correlation Between PD-L1 Expression and Clinicopathological Characteristics of Non-Small Cell Lung Cancer: A Real-World Study of a Large Chinese Cohort. J Thorac Dis (2019) 11(11):4591–601. doi: 10.21037/jtd.2019.10.80
19. Heeke S, Hofman P. Tumor Mutational Burden Assessment as a Predictive Biomarker for Immunotherapy in Lung Cancer Patients: Getting Ready for Prime-Time or Not? Transl Lung Cancer Res (2018) 7(6):631–8. doi: 10.21037/tlcr.2018.08.04
20. Herbst RS, Soria JC, Kowanetz M, Fine GD, Hamid O, Gordon MS, et al. Predictive Correlates of Response to the Anti-PD-L1 Antibody MPDL3280A in Cancer Patients. Nature (2014) 515(7528):563–7. doi: 10.1038/nature14011
21. Herbst RS, Baas P, Kim D-W, Felip E, Pérez-Gracia JL, Han J-Y, et al. Pembrolizumab Versus Docetaxel for Previously Treated, PD-L1-Positive, Advanced Non-Small-Cell Lung Cancer (KEYNOTE-010): A Randomised Controlled Trial. Lancet (2016) 387(10027):1540–50. doi: 10.1016/s0140-6736(15)01281-7
22. Gillies RJ, Kinahan PE, Hricak H. Radiomics: Images Are More Than Pictures, They Are Data. Radiology (2016) 278(2):563–77. doi: 10.1148/radiol.2015151169
23. Mu W, Tunali I, Gray JE, Qi J, Schabath MB, Gillies RJ. Radiomics of (18)F-FDG PET/CT Images Predicts Clinical Benefit of Advanced NSCLC Patients to Checkpoint Blockade Immunotherapy. Eur J Nucl Med Mol Imaging (2020) 47(5):1168–82. doi: 10.1007/s00259-019-04625-9
24. Humbert O, Cadour N, Paquet M, Schiappa R, Poudenx M, Chardin D, et al. (18)FDG PET/CT in the Early Assessment of Non-Small Cell Lung Cancer Response to Immunotherapy: Frequency and Clinical Significance of Atypical Evolutive Patterns. Eur J Nucl Med Mol Imaging (2020) 47(5):1158–67. doi: 10.1007/s00259-019-04573-4
25. Trebeschi S, Drago SG, Birkbak NJ, Kurilova I, Calin AM, Delli Pizzi A, et al. Predicting Response to Cancer Immunotherapy Using Noninvasive Radiomic Biomarkers. Ann Oncol (2019) 30(6):998–1004. doi: 10.1093/annonc/mdz108
26. Sun R, Limkin EJ, Vakalopoulou M, Dercle L, Champiat S, Han SR, et al. A Radiomics Approach to Assess Tumour-Infiltrating CD8 Cells and Response to Anti-PD-1 or Anti-PD-L1 Immunotherapy: An Imaging Biomarker, Retrospective Multicohort Study. Lancet Oncol (2018) 19(9):1180–91. doi: 10.1016/s1470-2045(18)30413-3
27. Tunali I, Gray JE, Qi J, Abdalah M, Jeong DK, Guvenis A, et al. Novel Clinical and Radiomic Predictors of Rapid Disease Progression Phenotypes Among Lung Cancer Patients Treated With Immunotherapy: An Early Report. Lung Cancer (2019) 129:75–9. doi: 10.1016/j.lungcan.2019.01.010
28. Schraag A, Klumpp B, Afat S, Gatidis S, Nikolaou K, Eigentler TK, et al. Baseline Clinical and Imaging Predictors of Treatment Response and Overall Survival of Patients With Metastatic Melanoma Undergoing Immunotherapy. Eur J Radiol (2019) 121:108688. doi: 10.1016/j.ejrad.2019.108688
29. Khorrami M, Prasanna P, Gupta A, Patil P, Velu PD, Thawani R, et al. Changes in CT Radiomic Features Associated With Lymphocyte Distribution Predict Overall Survival and Response to Immunotherapy in Non-Small Cell Lung Cancer. Cancer Immunol Res (2020) 8(1):108–19. doi: 10.1158/2326-6066.CIR-19-0476
30. He L, Huang Y, Ma Z, Liang C, Liang C, Liu Z. Effects of Contrast-Enhancement, Reconstruction Slice Thickness and Convolution Kernel on the Diagnostic Performance of Radiomics Signature in Solitary Pulmonary Nodule. Sci Rep (2016) 6:34921. doi: 10.1038/srep34921
31. Badic B, Desseroit MC, Hatt M, Visvikis D. Potential Complementary Value of Noncontrast and Contrast Enhanced CT Radiomics in Colorectal Cancers. Acad Radiol (2019) 26(4):469–79. doi: 10.1016/j.acra.2018.06.004
32. Nguyen P, Bashirzadeh F, Hundloe J, Salvado O, Dowson N, Ware R, et al. Optical Differentiation Between Malignant and Benign Lymphadenopathy by Grey Scale Texture Analysis of Endobronchial Ultrasound Convex Probe Images. Chest (2012) 141(3):709–15. doi: 10.1378/chest.11-1016
33. Zhao B, Tan Y, Tsai WY, Schwartz LH, Lu L. Exploring Variability in CT Characterization of Tumors: A Preliminary Phantom Study. Transl Oncol (2014) 7(1):88–93. doi: 10.1593/tlo.13865
34. Tan Y, Guo P, Mann H, Marley SE, Juanita Scott ML, Schwartz LH, et al. Assessing the Effect of CT Slice Interval on Unidimensional, Bidimensional and Volumetric Measurements of Solid Tumours. Cancer Imaging (2012) 12:497–505. doi: 10.1102/1470-7330.2012.0046
35. Schwartz LH, Litiere S, de Vries E, Ford R, Gwyther S, Mandrekar S, et al. RECIST 1.1-Update and Clarification: From the RECIST Committee. Eur J Cancer (2016) 62:132–7. doi: 10.1016/j.ejca.2016.03.081
36. NA R, MD H, A S, P K, V M, JJ H, et al. Mutational Landscape Determines Sensitivity to PD-1 Blockade in Non-Small Cell Lung Cancer. Science (2015) 348(6230):124–8. doi: 10.1126/science.aaa1348
37. Seymour L, Bogaerts J, Perrone A, Ford R, Schwartz LH, Mandrekar S, et al. iRECIST: Guidelines for Response Criteria for Use in Trials Testing Immunotherapeutics. Lancet Oncol (2017) 18(3):e143–52. doi: 10.1016/s1470-2045(17)30074-8
38. Zhang Y, He K, Guo Y, Liu X, Yang Q, Zhang C, et al. A Novel Multimodal Radiomics Model for Preoperative Prediction of Lymphovascular Invasion in Rectal Cancer. Front Oncol (2020) 10:457. doi: 10.3389/fonc.2020.00457
39. Ganeshan B, Miles KA. Quantifying Tumour Heterogeneity With CT. Cancer Imaging (2013) 13:140–9. doi: 10.1102/1470-7330.2013.0015
40. Ganeshan B, Miles KA, Young RC, Chatwin CR. Texture Analysis in Non-Contrast Enhanced CT: Impact of Malignancy on Texture in Apparently Disease-Free Areas of the Liver. Eur J Radiol (2009) 70(1):101–10. doi: 10.1016/j.ejrad.2007.12.005
41. Goh V, Ganeshan B, Nathan P, Juttla JK, Vinayan A, Miles KA. Assessment of Response to Tyrosine Kinase Inhibitors in Metastatic Renal Cell Cancer: CT Texture as a Predictive Biomarker. Radiology (2011) 261(1):165–71. doi: 10.1148/radiol.11110264
Keywords: immunotherapy, non-small-cell lung cancer, radiomics, computed tomography, response prediction
Citation: Wu M, Zhang Y, Zhang J, Zhang Y, Wang Y, Chen F, Luo Y, He S, Liu Y, Yang Q, Li Y, Wei H, Zhang H, Lu N, Wang S, Guo Y, Ye Z and Liu Y (2022) A Combined-Radiomics Approach of CT Images to Predict Response to Anti-PD-1 Immunotherapy in NSCLC: A Retrospective Multicenter Study. Front. Oncol. 11:688679. doi: 10.3389/fonc.2021.688679
Received: 31 March 2021; Accepted: 16 December 2021;
Published: 10 January 2022.
Edited by:
Rathan Subramaniam, University of Otago, New ZealandReviewed by:
Sherif Shalaby, University of Pisa, ItalyValentina Battaglia, Pisana University Hospital, Italy
Copyright © 2022 Wu, Zhang, Zhang, Zhang, Wang, Chen, Luo, He, Liu, Yang, Li, Wei, Zhang, Lu, Wang, Guo, Ye and Liu. This is an open-access article distributed under the terms of the Creative Commons Attribution License (CC BY). The use, distribution or reproduction in other forums is permitted, provided the original author(s) and the copyright owner(s) are credited and that the original publication in this journal is cited, in accordance with accepted academic practice. No use, distribution or reproduction is permitted which does not comply with these terms.
*Correspondence: Zhaoxiang Ye, zye@tmu.edu.cn; Ying Liu, tjliuying2009@163.com; Minghao Wu, 1049557295@qq.com
†These authors have contributed equally to this work